High-Energy emissions from Pulsar/Be binary system PSR J2032+4127/MT91 213
Abstract
PSR J2032+4127 is a radio-loud gamma-ray-emitting pulsar; it is orbiting around a high-mass Be type star with a very long orbital period of years, and is approaching periastron, which will occur in late 2017/early 2018. This system comprises with a young pulsar and a Be type star, which is similar to the so-called gamma-ray binary PSR B1259-63/LS2883. It is expected therefore that PSR J2032+4127 shows an enhancement of high-energy emission caused by the interaction between the pulsar wind and Be wind/disk around periastron. Ho et al. recently reported a rapid increase in the X-ray flux from this system. In this paper, we also confirm a rapid increase in the X-ray flux along the orbit, while the GeV flux shows no significant change. We discuss the high-energy emissions from the shock caused by the pulsar wind and stellar wind interaction and examine the properties of the pulsar wind in this binary system. We argue that the rate of increase of the X-ray flux observed by Swift indicates (1) a variation of the momentum ratio of the two-wind interaction region along the orbit, or (2) an evolution of the magnetization parameter of the pulsar wind with the radial distance from the pulsar. We also discuss the pulsar wind/Be disk interaction at the periastron passage, and propose the possibility of formation of an accretion disk around the pulsar. We model high-energy emissions through the inverse-Compton scattering process of the cold-relativistic pulsar wind off soft photons from the accretion disk.
1. Introduction
PSR J2032+4127 is a radio-loud gamma-ray-emitting pulsar discovered by the Fermi Large Area Telescope (Fermi-LAT) and it is a young pulsar with a spin period ms, spin-down power and spin-down age kyr (Abdo et al. 2013). This pulsar had been regarded as isolated pulsar (Camilo et al. 2009) because of the lack of apparent variation in its rotation caused by reasonable orbital motion. Lyne et al. (2015) found the variation of the observed pulsar rotation rate, which is consistent with the Doppler effect of the orbital motion around the high-mass Be star MT91 213. Their study suggests that the orbital period is very long, yr, and the orbit is extremely elongated with an eccentricity . Ho et al. (2016) refined the orbit parameters as years and (see Figure 1). PSR J2032+4127 is a member of a class of rare-type pulsar that is orbiting around a high-mass B star. The next periastron passage will occur in late 2017 or in early 2018.
The binary nature of PSR J2032+4127 is similar to that of PSR B1259-63, which is a well known radio pulsar that is orbiting around the high-mass B star, LS2883, with years and (Johnston et al. 1992, 1999, 2005). PSR B1259-63/LS2883 is known to be a source of non-pulsed and non-thermal emissions in the X-ray/GeV/TeV bands (Aharonian et al. 2005; Abdo et al. 2011; Tam et al. 2011, 2015), and it is classified as a so-called gamma-ray binary, which comprises a compact object (neutron star or black hole) and a high-mass OB star (see Dubus 2013). Multi-wavelength observations have confirmed several TeV gamma-ray binaries, namely, PSR B1259-63/LS 2883, LS5039 (Aharonian et al. 2006), LS I+61∘ 303 (Albert et al. 2006), 1FGL J1018.6-5856 (Ackermann et al. 2012), and H.E.S.S. J0632+057 (Hinton et al. 2009). PSR B1259-63/LS2883 is the only binary system for which the compact object has been confirmed to be a young pulsar. PSR J2032+4127/MT91 213 is a candidate for the next gamma-ray binary, for which the compact object is definitely a young pulsar.
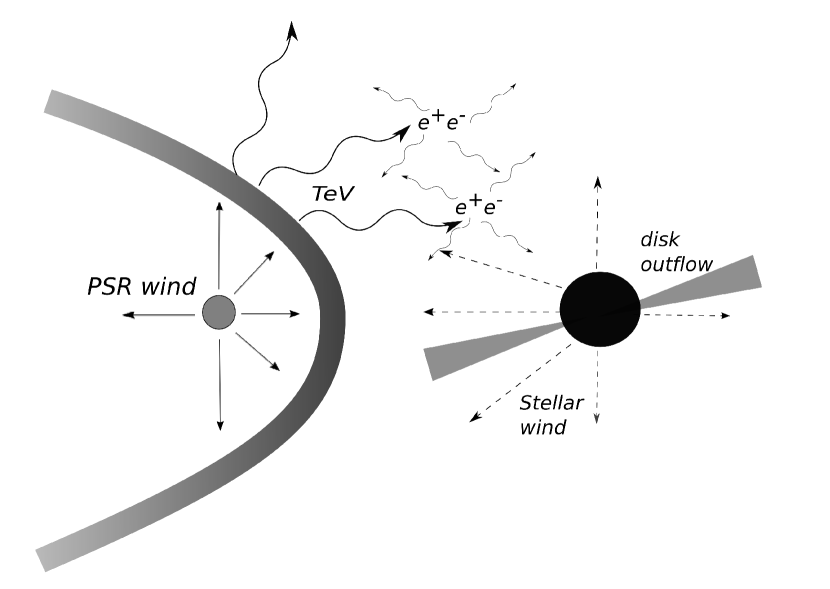
The origin of the high-energy TeV emissions from the PSR B1259-63/LS 2883 system is likely related to the interaction of the pulsar wind of PSR B1259-63 and the Be wind/disk of LS 2883 (Tavani & Arons 1997; Dubus 2006, 2013). Their interaction results in the formation of a shock, where the ram pressures of the pulsar wind and of the stellar wind/disk are in balance (Figure 2). The electrons/positrons in the pulsar wind are accelerated at the shock, and produce nonthermal emissions in the radio to TeV gamma-ray bands. The standard scenario assumes the synchrotron radiation and the inverse-Compton scattering (ICS) process produces radio/X-ray emission and TeV gamma-ray emission, respectively. We can expect that PSR J2032+4127/MT91 213 is also a source of X-rays/TeV gamma-rays arising from the same mechanisms.
X-ray/TeV emissions from the gamma-ray binaries have been observed to exhibit temporal variations in their emission. Various models have been suggested to explain the energy-dependent orbital modulations: for the pulsar model of the gamma-ray binaries, for example, the Doppler boosting effect due to the finite velocity of the shocked pulsar wind (Dubus et al. 2010; Kong et al. 2012; Takata et al 2014a), evolution of the energy spectra of relativistic electrons of the shocked pulsar wind under the different energy-loss rates (Khangulyan et al. 2007; Takahashi et al. 2009; Zabalza et al. 2013), and the interaction between the pulsar wind and the Be disk (Sierpowska-Bartosika & Bednarek 2008; Takata et al. 2012), have been suggested. In this paper, we will consider the orbital variation of the emission from PSR J2032+4127/MT91 213 as a result of the radial evolution of the magnetization parameter (Takata & Taam 2009; Kong et al. 2011) or the variation of the momentum ratio of the two winds.
The GeV emission from PSR J2032+4127/MT91 213 is modulating with the spin period of the pulsar, and hence is dominated bythe magnetospheric process. The GeV emission from the gamma-ray binaries has been observed by the Fermi-LAT. For PSR B1259-63/LS 2883, flare-like GeV emissions have been observed after the second Be disk passage of the pulsar (Abdo et al., 2011; Tam et al. 2011, 2015). Although the inverse-Compton scattering process with anisotropic soft-photon field from the disk/companion star (e.g Khangulyan et al. 2011, 2014; van Soelen et al. 2012; Dubus & Cerutti 2013) or synchrotron radiation process of the relativistic electrons/positrons (Chernyakova et al. 2015; Xing et al. 2016) have been considered, the origin of the emission is not yet understood.
The gamma-binary LS 5039, whose orbital period is days, is a candidate for which the compact object is a young pulsar. The GeV emission from this system has been observed over the whole orbital phase by the Fermi-LAT (Abdo et al. 2009). Because their spectral shape measured by Fermi resembles those of the gamma-ray emitting pulsars, it has been suggested that LS 5039 includes a young pulsar. The orbital modulating GeV emission confirmed by Fermi, however, suggests the emission process in the intra-binary space. The orbital modulations of GeV and X-ray/TeV emissions from LS 5039 show anti-correlation: GeV flux (or X/TeV fluxes) becomes maximum around the superior conjunction (hereafter SUPC) (or inferior conjunction (INFC)) and becomes minimum around the INFC (or SUPC). Within the framework of the shock emission due to the interaction between the pulsar wind and stellar wind, the observed modulation of the X-ray emissions from gamma-ray binary LS 5039 has been interpreted as the Doppler boosting effect caused by the finite velocity of the shocked pulsar wind (Dubus et al. 2010; Takata et al. 2014a), while the strong absorption of the TeV photons by the stellar photon field will suppress the observed emissions at around SUPC (Dubus et al. 2008). The GeV emission may be as a result of the inverse-Compton scattering (hereafter ICS) process of the cold-relativistic pulsar wind (Sierpowska-Bartosik & Torres 2008; Kapala et al. 2010; Torres 2011; Takata et al. 2014a) or of the shock-accelerated particles (Yamaguchi & Takahara; Zabalza et al. 2013). The ICS process between the relativistic particles and the stellar photons causes a flux peak in the observed modulation at around the SUPC (if there is no absorption), where the scattering process of the relativistic particles that propagate to the Earth occurs the head-on, and causes a flux minimum around the INFC, where the scattering is a tail-on collision process. In this paper, we will estimate the contribution of the inverse-Compton scattering process between the cold-relativist pulsar wind and the stellar photon, since the gamma-ray binary will provide a unique laboratory to investigate the properties of the cold-relativistic pulsar wind at the aU distance scale from the pulsar (Cerutti et al. 2008).
The bolometric luminosity of the high-mass companion in the gamma-ray binaries is of the order . This intense stellar photon field leads to not only observable TeV emissions through the ICS, but also substantial absorption of TeV gamma-rays. Because the stellar radiation field is anisotropic in the emission region, the emissivity of the ICS and optical depth of the photon-photon pair-creation process integrated along the line of sight depend on the orbital phase. Such anisotropic processes will cause the observed orbital modulation of TeV gamma-rays (e.g. Kirk et al. 1999; Bednarek 2000; Takata et al. 2014a). The secondary pairs created by the primary TeV gamma-rays are also a source of very high-energy photons through the ICS process. A pair-creation cascade process may develop in the stellar wind region and may cause the observed TeV emissions from the close binary systems (Bednarek 1997, 2007; Sierpowska & Bednarek 2005; Sierpowska-Bartosik & Torres 2007, 2008; Yamaguchi & Takahara 2010; Cerutti et al. 2010) and a periastron passage of the long-orbit binaries (Sierpowska-Bartosik & Bednarek 2008). The anti-correlation between the GeV and TeV light curves of LS 5039 has been interpreted by using this cascade model (Bednarek 2007)
In the X-ray bands, the observed temporal variations along the orbit will be mainly caused by the variations of the physical conditions of the pulsar wind at the shock. With the extremely elongated orbit of PSR B1259-63 and PSR J2032+4127, the distance of the shock () from the pulsar varies by about a factor of ten along the orbit (Figure 5). Hence we can in principle use gamma-ray binaries to probe the physical properties of the pulsar wind (e.g. magnetization parameter and bulk Lorentz factor) as a function of radial distance. For example, the pulsar wind magnetization parameter (Kennel & Coroniti 1984) can be determined as
| (1) |
where, , and are the magnetic field, number density and Lorentz factor of the cold-relativistic pulsar wind, respectively, just before the shock. We can probe how the magnetization parameter changes with the radial distance from the pulsar by examining the observed temporal variations (Takata & Taam 2009; Kong et al. 2011). Since PSR J2032+4127 is now approaching to the periastron passage that will occur in late 2017 or early 2018, and since the separation between PSR J2032+4127 and MT91 213 changes by about a factor of ten during 1year and year from the periastron (Figures 1 and 5), we can expect that the change of the shock distance from the pulsar will cause a large variation in the observed emission from this system, as indicated by the results of the recent X-ray observations done by the Swift (section 2, see also Ho et al. 2016). Moreover, the ICS process of the cold-relativistic pulsar wind before the shock may boost the stellar photons from optical to gamma-ray bands. The next periastron passage may provide u with s a unique opportunity to constrain the Lorentz factor of the pulsar wind.
This paper is organized as follows. In section 2, we will analyze the data taken from the Swift and Fermi-LAT. We will confirm that the X-ray emission observed in 2016 is about factor of ten larger than that from previous observations, while the GeV flux does not show any significant change. In section 3, we describe our emission models from the intra-binary shock and cold-relativistic pulsar wind. In section 4, we will discuss the high-energy emission within the framework of the pulsar wind/Be wind, and probe the evolution of the magnetization parameter with a radial distance by fitting the Swift data. In section 5, we will discuss the emission as a result of the pulsar wind/Be disk interaction model. We will also discuss the possibility of the formation of an accretion disk around the pulsar as a consequence of the pulsar/Be disk interaction and its expected emission in the high-energy bands.
| PSR/Companion | (s) | (yrs) | (lt-s) | ||||
|---|---|---|---|---|---|---|---|
| J2032+4127/MT91 213 | 0.143 | 1.7 | 25-50 | 0.96 | 9022 | 30000K | 10 |
| B1259-63/LS2883 | 0.048 | 8 | 3.4 | 0.83 | 1296 | 30000K |

2. Data analysis of Swift and Fermi observations
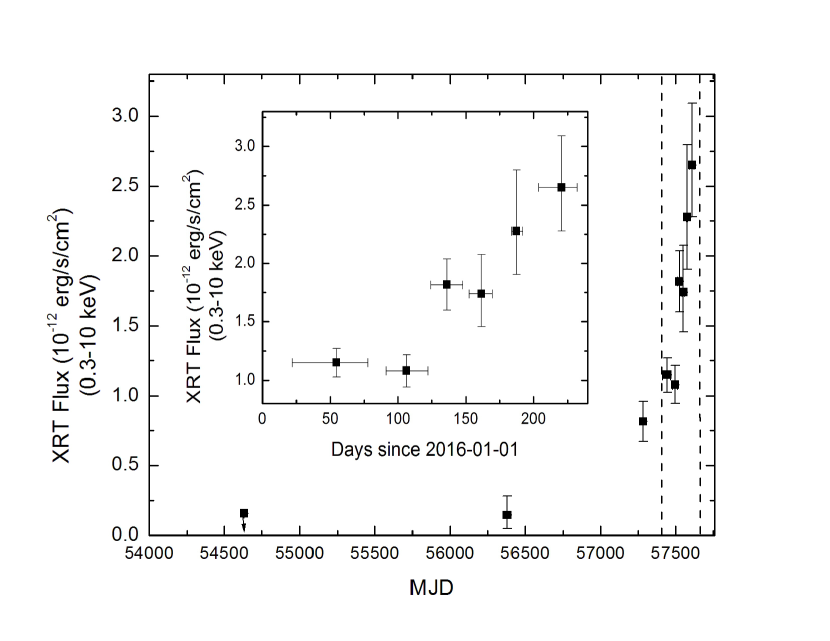
Recently, Ho et al. (2016) reported a rapid increase in the X-ray flux observed by Swift, as the pulsar approached to the periastron. In this paper, we analyze the Fermi-LAT data as well as Swift data. The Swift-X-ray telescope (XRT) light curve was obtained using products extracted from the XRT repository http://www.swift.ac.uk/user_objects/ (see also Evans et al. 2007, 2009). We used a conversion factor of 1.2710 to convert the count rates into unabsorbed fluxes, where an absorbed power-law with 2.37 and , based on total galactic HI column density in the direction toward the pulsar, is assumed (Kalberla et al. 2005; Dickey & Lockman, 1990). Since Ho et al. (2016) adopted the based on the optical extinction of the companion, our unabsorbed X-ray flux is slightly higher than that presented by those authors. This difference does not affect the conclusions of the model calculations discussed in this paper. Due to small photon statistics, we did not include observations shorter than 10 ks before 2014. An observation taken in 2006 had an instrumental issue and was not included as well. An X-ray light curve is shown in Fig. 3. Following up on the initial flux increase observed in early 2016, we asked for additional dedicated XRT ToO observations since March 2016. Three to four observations were grouped together for better signal-to-noise ratios. It is clear that the trend in 2016 is the flux increase in X-rays.
We analyzed the gamma-ray long-term light curve of PSR J2032+4127 using the data from the Fermi-LAT. Photon events with energy ranging from 100 MeV to 500 GeV and time ranged from 2008-08-04 to 2016-08-02 were selected. The event class is ”Pass 8 Source” and the corresponding instrumental response function is ”P8R2_SOURCE_V6”. The region of interest (ROI) is a square centered at the epoch J2000 position of the source: . To avoid contamination from the Earth’s albedo, we excluded the time intervals when the ROI was observed at a zenith angle greater than . The data reduction in this study was performed using the Fermi Science Tools package version v10r0p5111Available at http://fermi.gsfc.nasa.gov/ssc/data/analysis/software/.
We first modeled the average emission from the background sources over the whole time span. The gtlike tool was used to perform a maximum binned likelihood analysis. The source model includes all 3FGL catalog sources (gll_psc_v16.fit) (Acero et al. 2015) that are within from the center of the ROI, the galactic diffuse emission (gll_iem_v06) and the isotropic diffuse emission (iso_P8R2_SOURCE_V6_v06), available from the Fermi Science Support Center (FSSC)222http://fermi.gsfc.nasa.gov/ssc/. The spectral parameters for sources that are non-variable and located away from the center are fixed to their catalog values. Four extended sources within the region, Gamma Cygni, Cygnus Cocoon, HB 21, and Cygnus Loop, were modeled by the extended source templates provided by the FSSC. PSR J2032+4127 is named as 3FGL J2032.2+4126 in the 3FGL catalog and is modeled by a power-law with simple exponential cutoff:
| (2) |
where is the normalization constant, is the scale factor of energy, is the spectral power-law index and is the cut-off energy. From the binned likelihood analysis, the best-fit parameters of PSR J2032+4127 are , and MeV.
After fixing the spectral indices of all sources to the global fit and only leaving the normalization parameters free, the source model is then used to obtain the long-term light curve. The whole data set is then binned into eight bins, each bin is 365days. The energy range of the photons is further limited to 100 MeV-100 GeV. Local fit is performed by the gtlike tool (binned likelihood analysis) to obtain the energy flux of PSR J2032+4127 in each segment. Figure 4 shows the long term evolution of the flux measured by the Fermi. No clear indication of the change in the flux can be seen and the average flux over eight-year observations is , which will be dominated by the pulsed emissions from the magnetosphere.
In the 1990s, the CGRO/EGRET observed the region of PSR J2032+4127 for a couple of times, including a more intensive observation during 1994 May to July. There is one source in the revised EGRET catalog (Casandjian & Grenier, 2008), EGR J2033+4117, whose position is 0.28 deg away from 3FGL J2032.2+4126 (which has been identified as h PSR J2032+4127). The 95% error radius of EGR J2033+4117 is 0.22 degree. Due to the slight offset, we cannnot associate the two gamma-ray sources for certain.
It is still possible to constrain the gamma-ray emission from PSR J2032+4127 using these EGRET data. The photon flux of EGR J2033+4117 is steady over the several measurements, and is consistent with (5-6)ph cm-2 s-1 (above 100 MeV) for all viewing periods. Due to the poorer angular resolution of EGRET compared to LAT and allowing for plausible contamination from nearby sources like Cyg X-3, this flux level may be regarded as an upper limit of any source at the position of PSR J2032+4127 over the 1990s, and is above the average LAT flux 1.4 ph cm-2 s-1 in our analysis.
3. Theoretical Model
The origin of the high-energy TeV emission from the PSR B1259-63/LS 2883 system is likely related to the interaction of the pulsar wind of PSR B1259-63 and the Be wind/disk of LS 2883 (Tavani & Arons 1997). Their interaction results in the formation of a shock, where the pulsar wind ram pressure and stellar wind/disk ram pressure are in balance. We apply this scenario to the PSR J2032+4129/MT91 213 binary. In this section we describe our calculation methods. We define the capital letter and small letter as the distances from the B star and from the pulsar, respectively.
3.1. Pulsar wind/stellar wind interaction

The relativistic pulsar wind, which may have a bulk Lorentz factor of , interacts with the stellar wind and forms a cone-shaped shock separating between the pulsar and the companion star. The radial distance to and its opening angle of the cone-shaped shock are determined by the ratio of the two winds (e.g. Canto et al. 1996 and references therein),
| (3) |
where we assume that the pulsar wind carries the spin down-power of the pulsar, and is the mass loss rate and wind velocity of the companion star, respectively. The wind velocity of the stellar wind at a distance from the stellar surface may be expressed by (Waters et al. 1988)
| (4) |
where km with K being the temperature of the B star. The terminal velocity is estimated from
with and being the mass and radius of the B star, respectively. Since the shock is far away from the surface of the B star, we may assume .
With of this pulsar (Lyne et al. 2015) and a typical mass loss rate of an O-type or B-type star (e.g. Snow 1981; Smith 2006), the momentum ratio of this system will be
| (5) | |||||
indicating the stellar wind is stronger than the pulsar wind with a reasonable mass loss rate of the stellar wind. The distance to the apex of the shock cone, , and the opening angle of the shock, , measured by the pulsar are calculated from (Canto et al. 1996)
| (6) |
and
| (7) |
respectively, where represents the orbital phase and is the separation between two stars. Figure 5 summarizes the evolution of the distance (left panel) and the magnetic field strength (right panel) at the shock apex along the orbit between -4000days and +4000days from the periastron (we did not plot the results for the other orbital phase, since we are interested in the emission processes around the periastron). In the figure, we used to calculate the magnetic field strength. As the figure shows, the shock distance and the magnetic field at the shock change by more than factor of ten along the orbit. Since the pulsar orbit velocity () is at least about a factor of ten slower than the stellar wind velocity (), we assume that the shape of the shock cone is axially symmetric about the axis connecting the two stars.
3.2. Pulsar/Be disk interaction


Since the Be-type star, MT91 213, forms a dense equatorial disk outflow, the pulsar may interact with the Be disk at the periastron passage, as in the case with the gamma-ray binary PSR B1259-63/LS2883 system. The decretion disk model has been explored to describe the structure of the Be disk (Lee et al. 1991; Carciofi & Bjorkman 2006; Okazaki et al. 2011), and it implies the disk mass density () and the scale height () are described by
| (8) |
and
| (9) |
respectively, where and ( and for an isothermal disk). In addition, we apply and the base density .
Takata et al. (2012) studied the orbital modulations of the X-ray/TeV emission from PSR B1259-63/LS2883 system. They argued that with the larger base density () for the Be disk, the pulsar wind creates a cavity in the disk gas and this causes a significant increase in the conversion efficiency from pulsar spin-down power to the shock-accelerated particle energy. This explains the double-peak structure of the X-ray light curves of the gamma-ray binary PSR B1258-63/LS 2883. The pulsar/Be disk interaction with a smaller base density () causes no cavity in the pulsar wind and hence no enhancement in the emission.
With the elongated orbit and the long orbital period of the PSR J2032+4127, a strong pulsar/Be disk interaction will be possible at only periastron passage. The radius of the shock from the pulsar may be obtained from a pressure balance condition,
| (10) |
where is the relative velocity between the pulsar and the disk rotation. If the pulsar interacts with the Be disk at the periastron, where the separation of the two stars is au, the mass density and scale height of the disk at the pulsar are and , where we used , , and . The orbital velocity of the pulsar and circular velocity of the disk are and , respectively, where we used . The radial velocity of the disk matter, with being the sound speed (Okazaki et al. 2011), is much slower than the pulsar motion and the disk’s circular motion. Hence, by assuming the relative velocity , the shock distance calculated from the equation (10) is at the periastron. A pulsar/Be disk interaction may cause a cavity in the pulsar wind around the pulsar, provided that , which yields .
Figure 6 summarizes the ratio of the shock distance given by equation (10) and the scale height of the disk, provided that the pulsar interacts with the disk at the given orbital phase in the horizontal axis. The figure summarizes the shock distance for the epoch between -100days and +100days from the periastron. The different lines show the case for the base density of (solid line), (dashed line) and (dotted line), respectively. We find from the figure that a cavity would form () at the periastron passage if . If the base density is less than , on the other hand, the pulsar wind will strip off an outer part of the Be disk, truncating it at a radius smaller than the pulsar orbit, and the pulsar wind/Be disk interactions will not affect to the observed emission.
3.3. Shock emissions
We calculate the emissions from the shock due to the interaction between the pulsar wind and stellar wind, as follows. The magnetic field at the shock radius but before the shock is calculated from
| (11) |
where we defined . At the shock, the kinetic energy of the pulsar wind is converted into the internal energy of the shocked pulsar wind. Applying a jump condition of a perpendicular MHD shock, we calculate the velocity , the magnetic field , and the gas pressure of the shocked pulsar wind at the shock (Kennel & Coroniti 1984). For the particle kinetic energy dominating the un-shocked flow, that is, for the low regime, we obtain
| (12) |
| (13) |
and
| (14) |
We assume that the post-shock pulsar wind flows along the shock surface. Along the downstream flow, we assume a conservation of the magnetic flux . For the spherical symmetric flow, the bulk velocity decreases with the distance from the shock (Kennel & Coroniti 1984). However, the numerical simulations imply that the post-shock bulk flow for the binary systems does not simply decrease but increases with the distance from the shock, because of a rapid expansion of the flow in the downstream region (Bogovalov et al. 2008). Furthermore, the high-energy emissions take place in the vicinity of the shock radius. In this study, therefore, we assume the velocity field of the post-shock pulsar wind with constant.
We assume that the electrons and positrons in the pulsar wind are accelerated by the shock and form a power law distribution over several decays in energy;
| (15) |
where we assume that the minimum Lorentz factor of the accelerated particles is equal to the average Lorentz factor of the particles forming the cold-relativistic pulsar wind (section 3.4). We assume the maximum Lorentz factor by balancing between the acceleration time scale and the synchrotron loss time scale , yielding , where represents the efficiency of the acceleration, which will be . The efficiency of the acceleration in the gamma-ray binaries has been explained from the observed spectra of very high-energy emissions; for example, a high efficiency is required to explain the TeV emissions of LS 5039 (Zabalza et al. 2013). For PSR J2032+4127/MT91 213, it is difficult to discuss the efficiency, since TeV emission from this source has not yet been detected. In the calculations, we found that the predicted X-ray flux and 0.1-10TeV flux are insensitive to the efficiency if . In this study, therefore, we present the results with . Future TeV observations at the periastron passage may provide an addition information constraining the efficiency.
For the injected particles at the shock, we assume for the power-law index of the distribution. Since the particle energy density is related with the pressure as , the normalization factor of equation (15) is calculated from the relation .
We solve the evolution of the Lorentz factor after the shock with a simple one-dimensional treatment, that is,
| (16) |
We assume the adiabatic loss given by
where is the particle number density. The synchrotron loss is given as
| (17) |
We calculate the ICS energy loss rate using
| (18) |
where is the stellar photon field distribution and is the cross-section with the isotropic photon field. For the soft-photon field, we consider the blackbody radiation from the B star and apply the Planck function with the temperature K, which is the case for companion star of PSR B1259-63 (Negueruela et al., 2011). Figure 7 summarizes the time scale of the cooling at the periastron and at the apex of the shock cone.
The TeV gamma-ray produced by the ICS process may be converted into an electron-positron pair through the photon-photon pair-creation process with the stellar photon. The cross section of this process is calculated from
| (19) |
where
where is the collision angle between the soft photon and gamma-ray, and it is a function of position. The optical depth is calculated from , where represents the energy distribution of the stellar radiation number density (see Table 1 for the parameters of the companion star). Figure 8 summarizes the optical depth of the high-energy photons emitted from the shock apex (); different lines in the figure represent difference system inclination angles and different positions of the pulsars along the orbit. We can find in Figure 8 that the optical depth of the TeV photons emitted around the periastron and the SUPC exceeds unity, indicating the TeV photons emitted during the periastron passage are significantly absorbed by the stellar photons.

3.4. ICS process of the cold-relativistic pulsar wind

The pulsar binaries will be a laboratory to search for the evidence of the high-energy gamma-rays produced by the ICS process of the cold-relativistic pulsar wind (Cerutti et al. 2008). In this study, we assume the pulsar wind is isotropic and is formed near the light cylinder of the pulsar, which is cm for PSR J2032+4127. Since there is a theoretical uncertainty in the particle distribution of the cold-relativistic pulsar wind, we explore the process with a relativistic Maxwell distribution of the form,
| (20) |
which provides an average Lorentz factor of . The normalization is calculated from the condition that
| (21) |
Due to the unknown energy conversion process from the magnetic energy to the particle energy, the magnetization parameter will evolve with the radial distance from the pulsar. From the energy conservation, the average Lorentz factor of the cold-relativistic pulsar wind just before the shock may be described as , which provides in the limit of and , where and are the Lorentz factor and the magnetization parameter at the light cylinder, respectively. The pairs created inside the light cylinder lose their momentum perpendicular to the magnetic field line via synchrotron radiation, and they will eventually escape from the light cylinder with a Lorentz factor of . Hence, the magnetization parameter at the light cylinder may be estimated from
| (22) |
where is the multiplicity and we applied s and G of PSR J2032+4127. From the observations of the pulsar wind nebulae, the multiplicity is expected to be for Crab-like young pulsars (Tanaka & Takahara 2010) and for the Vela-like pulsars (Sefako & de Jager, 2003). Theoretical studies have implied the multiplicity (Hibschman& Arons 2001; Timokhin & Harding 2015). Hence we assume the typical value of the Lorentz factor of the pulsar wind is in the range of .
The power per unit energy per unit solid angle of the ICS process with an anisotropic soft-photon field may be calculated from
| (23) |
where is the solid angle of the sky covered by the B star measured from the emission region, with (or ) describing the angle between the direction of the particle motion and the propagating direction of the scattered photons (or background photons). In addition, is the Planck function of the stellar photon field, and is the differential Klein-Nishina cross section.
Figure 9 shows the expected light curves (left panel) and spectra at the periastron (right panel) for the different system inclination angles relative to the Earth viewing angle () and the average Lorentz factor of the pulsar wind , respectively. As the left panel indicates, the calculated emissions for a larger viewing angle are suppressed at around days from the periastron. This is because the INFC occurs at days from the periastron (Figure 2), and because at around the INFC the ICS process between a soft photon from the B star and a pulsar wind particle moving toward the Earth is a tail-on collision process, which reduces the ICS efficiency. Since the SUPC is days after periastron, the calculated flux measured from the Earth becomes maximum around, but after, periastron. As the right panel shows, the energy flux in the GeV energy bands is for , which is close to the observed flux level () of the pulsed emission from the Fermi-LAT. Hence, we expect that if , the Fermi-LAT will observe an increase in the GeV flux during the next periastron passage.
4. Model results
In the current calculation, we applied the system parameters suggested by Ho et al. (2016), namely, the orbital period of days, and the anomaly of the direction of the Earth (Figure 2). In addition, we apply kpc (Lyne et al. 2015) and MJD 58069 as the periastron. We have not present the results of the calculations for the orbital phase days and days from the periastron, since we are interested in the emission processes around the periastron. We would like to note that within the current uncertainties of the orbit parameters (, (25years, 0.93) in Lyne et al. (2015) and (50years, 0.96) given by Ho et al. (2016), the main conclusions of the model results are not affected, since the system sizes predicted by two authors are very similar to each other.
4.1. X-ray/TeV emissions
As described in the previous section, the Swift observed a rapid increase in the emissions in 0.3-10keV energy bands after MJD56250 (see Figure 3). These X-ray emissions are probably caused as a result of the pulsar wind/stellar wind interaction, since the pulsar/Be disk interaction will be important only at around the periastron (say, between -100 days and +100 days), as discussed in the section 3.2. In this section, therefore, we will discuss the X-ray and TeV emissions from the shock caused by the pulsar wind and stellar wind interaction, and will examine the pulsar wind properties by comparing the model results with the observed X-ray light curve.


4.1.1 Constant
First, we consider the case where the magnetization parameter is constant with the radial distance from the pulsar, namely, the magnetization parameter at the shock does not depend on the shock distance. We also ignore the Doppler boosting effect caused by the finite velocity of the shocked pulsar wind, which will be discussed in section 4.1.2. Figure 10 summarizes the calculated flux and orbital modulation in the 0.3-10keV energy bands (left panel) and in the TeV energy bands (right panel); the solid, dashed, and dotted lines are for , 0.1, and 0.01, respectively. In the calculation, we assumed (that is, ), and . In the left panel of the figure, the results of the Swift observations are also displayed.
We find in Figure 10 that the calculated light curve with constant magnetization parameter predicts an increase in the X-ray flux slower than that of the Swift observations after days from the periastron. The synchrotron luminosity is roughly proportional to for a constant magnetization parameter. As Figure 5 shows, the shock distance decreases by about a factor of during days and days, and therefore, the calculated flux slightly increases during that epoch, which cannot explain the increase in the flux (a factor of ) measured by the Swift.
Figure 11 shows how the calculated flux depends on the model parameters, namely, the magnetization parameter (left panel) and the average Lorentz factor of the un-shocked pulsar wind (right panel). As seen in the left panel, the calculated X-ray flux (solid line) reaches its maximum value at the magnetization parameter . This is because the internal energy () of the post-shock flow at the shock given by the jump condition decreases as the assumed magnetization parameter increases (e.g. figure 4 of Kennel & Coronit 1984), while the magnetic field at the shock () increases as the magnetization parameter increases. The former tends to decrease the calculated X-ray flux, while the latter increases it. These two effects compensate each other and the calculated X-ray flux becomes maximum at the magnetization parameter . We find therefore that it is difficult to explain the observed X-ray flux of Swift after days with using the magnetization parameter . By comparing the calculated flux and Swift observations, therefore, we conclude that the magnetization parameters at the shock is of order of at days. It is possible that the Lorentz factor of the cold-relativistic pulsar wind evolves with the shock distance from the pulsar. In the right panel of Figure 10, however, we can see that the calculated fluxes in X-ray/TeV energy bands are less dependent on the minimum Lorentz factor of the shocked particles at the shock ().
In the calculated TeV light curve (right panel in Figure 10), we can see an asymmetry relative to the periastron. Since the TeV photons from the shock are produced by the ICS process, the asymmetry is introduced by the dependence of the collision angle between the stellar photons and the shocked pulsar wind particles that emit the photons toward the Earth, as in the case with the orbital modulation of the ICS of the cold-relativistic pulsar wind (Figure 9).
For the TeV photons, the optical depth of the pair-creation process depends on the orbital phase, and it becomes the maximum at the SUPC for the photons traveling toward the Earth. This effect can be seen as a rapid drop in the calculated flux around days. The calculated TeV emission from the shock depends on the Earth viewing angle, as summarized in Figure 12.
4.1.2 Doppler boosting effect

In the previous sections, we ignored the effect of the motion of the post-shocked pulsar wind. In such a case, as Figure 10 indicates, the orbital modulation of the X-ray emission is symmetric relative to the periastron. Asymmetry in the X-ray light curve as well as in the TeV light curve will be introduced by the finite velocity of the shocked pulsar wind.
The finite velocity of the shocked pulsar wind will cause the Doppler boosting effect, which enhances or suppresses the observed emissions. It has been suggested that the observed modulation of the X-ray emissions from gamma-ray binary LS 5039 is a result of the Doppler boosting effect (Dubus et al. 2010; Takata et al 2014a). The Doppler factor is calculated from
| (24) |
where is the Lorentz factor of the bulk motion of the post-shocked flow, and is the angle of the flow direction and the line of sight. We assume that the velocity of the post-shocked pulsar wind flow is constant.
Figure 13 summarizes the Doppler boosting effect with the different velocities of the post-shocked flow, (solid lines) given by the jump condition, (dashed line) in the limit of and (dotted line). We can see in the figure that the Doppler boosting effect enhances the emissions before the periastron, while suppressing after it. With , namely for the stellar wind stronger than the pulsar wind, the shock-cone wraps around the pulsar. Around the INFC (days), the post-shocked pulsar wind moves toward the Earth and hence enhances the emissions. These are suppressed at around the SUPC (days) where the post-shocked pulsar wind moves away from the Earth. However, the Doppler boosting effect will not be the reason for the rapid increase in the X-ray emissions observed by the Swift.
4.1.3 Dependence on wind momentum ratio


It has been considered that mass loss from the companion star will be driven by the radiation pressure, and the rapidly rotating main-sequence star, such that the angular velocity of the star rotation is close to its Keplerian angular velocity, and produces a stellar wind enhanced in the polar region (Georgy et al. 2011 and reference therein). It is also considered that anisotropy of the pulsar wind explains the torus-like and jet-like structures of the pulsar wind nebulae, and theoretical models suggest that angular distribution of the pulsar wind energy is proportional to , where is the angle measured from the spin axis (Bogovalov and Khangoulian 2002). The anisotropy of the two winds could change the momentum ratio at the their interaction region along the orbit.
Besides the large structure of the anisotropy, an irregularity of the stellar wind from the high-mass star could be formed. It has been discussed that a radiatively non-stationary acceleration process produces the clumping (small-scale density inhomogeneity) of the stellar wind from the high-mass star (Runacres & Owocki 2002: Owocki & Cohen 2006). It was analyzed that the typical size of a clump at the stellar surface is , and may linearly expand with the radial distance. A larger structure of clumps could be formed in the wind due to difference production mechanisms, magnetic field inhomogeneities, and star’s rotation/pulsation (see Bosch-Ramon 2013). Although the clumps fill only a small fraction of the volume of the wind region, it is thought that they carry most of mass ejected from the star, and have a mass density larger than the average density of the wind. Studies with hydrodynamic simulations have shown that the clumping could develop in size and mass density due to merging between dense shells as traveling from the star, although it was also pointed out that a break-up of the dense shell as a consequence of the Rayleigh-Taylor or thin-shell instability limits the clump growth (Bozzo et al. 2016, and references therein). If a clumpy wind is formed in a high-mass binary system hosting a compact object, it is expected that the irregularity of the mass density in the stellar wind will cause a temporal evolution of the momentum ratio (), yielding the temporal variations in the shock emissions (Owocki et al. 2009; Bosch-Ramon 2013; de la Cita et al. 2016).
The calculated X-ray fluxes depend on the wind momentum ratio, which determines the location of the shock. Figure 14 shows the calculated light curves for (solid lines), 0.085 (dashed lines) and 0.0085 (dotted lines), respectively, with the parameters of and . As we can see in Figure 14, the calculated X-ray flux increases with decreasing the momentum ratio, because the shock distance from the pulsar decreases and hence the magnetic field at the shock increases with decreasing the momentum ratio. As the figure shows, a decrease in the momentum ratio (that is, the stellar wind becomes stronger relative to the pulsar wind) by a factor of ten can give an increase in the observed X-ray fluxes during days to days from the periastron. Such momentum evolution with time could be caused by the anisotropy of the stellar wind/pulsar wind. A shorter time scale variability will be also possible as a consequence of the pulsar wind/clumpy wind interaction.
The observed flux ratio between the X-ray and TeV energy bands may provide an additional information for the magnetization parameter and momentum ratio of the pulsar wind to the stellar wind. As we expect, the flux ratio of the X-ray and TeV does not greatly depend on , but it is sensitive to the energy densities of the magnetic field and soft-photon field at the emission region, which mainly depends on the magnetization parameter and the momentum ratio of the two winds. Figure 15 presents the dependence of on the magnetization parameter and the wind momentum ratio. If the future observations could measure the flux ratio in X-ray and TeV energy bands, we could discuss the momentum ratio of the two winds; for example, if the future observations provide at the periastron, the current model predicts that the magnetization 1 if the momentum ratio .
4.1.4 Radial-dependent of the pulsar wind


As seen in Figures 10, 13 and 14, the calculated X-ray light curve cannot explain the Swift observations after days, if the momentum ratio does not significantly change along the orbit. The radial-dependent magnetization parameter has been discussed in the previous studies to explain the orbital modulations of the gamma-ray binaries (Takata & Taam 2009; Kong et al. 2011; Takata et al. 2014a). In this paper, we explore the radial dependence with a function form of
| (25) |
The left panel in Figure 16 shows the results of the fitting for the Swift X-ray data with different power law indices; for solid line, 2 for dashed line and 3 for dotted line. Other parameters are /yr) and . In addition, we applied taking into account the Doppler boosting effect discussed in section 4.1.2. To explain the observed flux level from Swift, we normalized the magnetization parameter so as to be at aU for each power law index. Figure 17 shows the evolution of the fitting magnetization parameters at the apex of the shock cone as a function of the orbital phase.
We can see in the Figure 16 that a faster evolution (larger ) of the magnetization parameter with the radial distance reproduces a X-ray light curve being more consistent with the whole Swift observations after days. As the figure shows, the current model predicts that the peaks of the flux in the light curve occurs at a day before the periastron and the flux then rapidly decreases during days and days by about one order of magnitude. This is because (1) the assumed magnetization parameter determined by the relation, , exceeds unity for , as Figure 17 shows, and (2) the Doppler boosting suppresses the emissions around the SUPC. This feature can be tested by the future observations.
4.2. GeV emissions and multi-wavelength spectra

Gamma-ray binaries have also been detected by the Fermi-LAT and the emission will originate from the magnetospheric processes and/or the intra-binary processes. For PSR J2032+4127, the pulsed GeV emission due to the pulsar spin has been measured by the Fermi-LAT with an energy flux (section 2). The high-energy tail of the synchrotron spectrum and the low energy tail of the ICS process of the intra-binary shock discussed in the previous sections could contribute to the energy bands (0.1-300GeV) of the Fermi-LAT. In addition to the shock emissions, the ICS process of the cold-relativistic pulsar wind with produces GeV gamma-rays (Figure 9).
Figure 18 compares the observed flux level of the pulsed emissions with the predicted flux levels of the shocked emissions (solid line) and of the ICS process of the cold-relativistic pulsar wind (dashed line). In the calculation, we assume for the average Lorentz factor of the particles of the cold-relativistic pulsar wind, and for the inclination of the system. As we see in Figure 18, the emissions from the intra-binary space are comparable to the magnetospheric emissions around the periastron. With the current parameters, therefore, we expect that the Fermi-LAT measures the orbital modulation of the GeV flux during the periastron passage that will occur in late 2017 or in early 2018.
In Figure 19, we present the model broadband spectra averaged over days to days; the model parameters are in equation (25), and , which reproduce the observed X-ray light curves. To see the dependence of the Lorentz factor , we calculated the spectra for (right panel) and (left panel), respectively. The solid line shows the calculated spectrum combining the synchrotron and ICS process at the shock, and the dashed line represents the spectrum of the ICS process of the cold-relativistic pulsar wind. The current model predicts that the magnetospheric emissions dominate in the spectral energy distribution averaged over the periastron passage. If the minimum Lorentz factor of the shocked pulsar wind particles is , the TeV spectrum will show a turnover at around and the X-ray spectrum has a break at around 10keV.

5. Discussion and summary
5.1. Emissions from the secondary pairs

During the periastron passage, the TeV photons from the shocked pulsar wind may be converted into pairs by the photon-photon pair creation process with the stellar photon fields; in particular, the TeV photons emitted toward the B star will be totally absorbed. These secondary pairs created in the stellar wind side will also emit the non-thermal photons via the synchrotron and ICS processes, and may initiate a further pair-creation cascade. If these pairs are isotropized, they will emit the photons propagating toward the observer, even though the primary TeV photons do not do this (Bednarek 1997, 2007; Sierpowska & Bednarek 2005, 2008; Sierpowska-Bartosik & Torres 2007, 2008; Yamaguchi & Takahara 2010; Cerutti et al. 2010).
The emissions from the secondary pairs produced in the stellar wind side will be dominated by the ICS process. The ratio of the radiation power between the synchrotron radiation and ICS processes will be described by the energy density ratio of the magnetic field to the stellar photon. The ICS process dominates the synchrotron radiation process at the radial distance from the star of
| (26) |
where represents the stellar magnetic field at the stellar surface. In addition, we assumed as the radial evolution of the stellar magnetic field. It is known that some high-mass main-sequence stars have a surface dipole magnetic field of order of G (Walder et al. 2012). With a typical value of , we can see that the synchrotron radiation of the created pairs in the stellar wind side can be important only at very near the stellar surface and its contribution to th observed X-ray emissions will be negligible.
By tracing the primary TeV gamma-rays from all emission regions considered in the calculation box, we calculated the ICS process of the secondary pairs. We assumed that the pairs produced in the stellar wind side are quickly isotropized, and we calculated the emission process with a constant photon field during the crossing time, , where represents the distance of the pair-creation position from the stellar surface. Figure 20 compares the spectra, which are measured on Earth of the ICS photons from the shock region (solid line) and from the secondary pairs (dashed line) at the periastron, where we assumed that all photons from the secondary pairs can escape from the pair-creation process. A further pair-creation cascade process will make the spectra softer. As the figure shows, the integrated flux from the secondary pairs is much less than the primary emissions, and therefore we expect that the contribution of the emissions from higher-order pairs is much less than that from the shock emissions. The emissions from the secondary pairs could contribute to the 0.1-1TeV bands, where the shock emissions around the periastron are significantly absorbed.
5.2. Pulsar/Be disk interaction

The interaction of PSR J203+4127 and the Be disk of MT91 213 may enhance the high-energy emissions, as in the case with the PSR B1259-69/LS2883 system showing an increase in the X-ray/TeV fluxes at the pulsar/Be disk interaction phase (Chernyakova et al. 2006). As we discussed in section 3.2, we expect that the pulsar/Be disk interaction in this system affects the observed emissions, provided that the base density is and the interaction occurs at the periastron passage, say between days and days from the periastron (Figure 6). Since we do not know the geometry (e.g. inclination relative to the orbital plane) of the disk, we cannot predict when the pulsar interacts with it. We expect however that the pulsar/Be disk interaction will occur at least once during the periastron passage during days and days, since the true anomaly corresponds to days from the periastron.
If the base density of the Be disk is close to , an interaction between pulsar and Be disk at the periastron passage will form a cavity in the pulsar wind, and most of the pulsar wind ( sr in solid angle) will be stopped at the radial distance from the pulsar given by equation (10) and Figure 6. In Figure 21, we show an example of the calculated light curve for the pulsar/Be disk interactions and compare the estimated X-ray/TeV fluxes with those for the pulsar/Be wind interactions. For the calculation, we assumed the base density , the magnetization and the momentum ratio for the pulsar wind/stellar wind interaction.
Figure 21 indicates that the pulsar/Be disk interaction predicts X-ray fluxes several factors larger than those due to the pulsar/Be wind interaction, if the magnetization parameter does not evolve with the radial distance. Within the framework of the current calculation, the shock distance from the pulsar is closer, and the magnetic field at the shock is stronger for the pulsar/Be disk interaction, in which at periastron, than the pulsar/Be wind interaction, for which with . As a result, the synchrotron power is stronger for the pulsar/Be disk interaction than the pulsar/Be wind interaction. This result suggests that if the base density of the Be disk is , the interaction of pulsar/Be disk may give rise to local maximum in the orbital modulation of the X-ray emissions.
As the right panel in Figure 21 shows, the calculated TeV flux for the pulsar/Be disk interaction is lower than that for the pulsar/Be wind interaction at around the periastron. This is because the synchrotron cooling time scale for TeV leptons becomes shorter than the ICS cooling and adiabatic cooling time scales at the shock for the pulsar/Be disk interaction. At the periastron, for example, the shock distance at the apex for the pulsar/Be wind interaction is , for which the inverse-Compton cooling and adiabatic cooling time scales of TeV electrons are shorter than the synchrotron cooling time scale (Figure 7). For pulsar/Be disk interaction, the shock distance becomes , which increases the magnetic field at the shock by a factor of , and hence decreases the synchrotron cooling time scale by about . As a result, the ICS cooling scale, which is less sensitive to the shock distance, becomes longer than the synchrotron time scale, and the ICS emissivity is suppressed.
5.3. Formation of a disk around the pulsar
As we discussed in section 3.2, if the base density of the disk is high enough, the pulsar wind will be confined within a small region by the Be disk matter. When the radius of the cavity estimated in Figure 6 is less than the radius below which the kinetic energy of the disk gas is less than the gravitational potential energy of the pulsar, the disk matter may be gravitationally captured by the pulsar, and results in the formation of a disk around the pulsar. The capture radius measured from the pulsar may be estimated as
| (27) |
where is the mass of the pulsar and is the relative velocity of the pulsar with respect to the disk matter. Near the periastron, AU, the orbital velocity of the pulsar is . The velocities of the Kepler motion and the radial velocity of the Be disk at the pulsar position are of the order of and , respectively (Okazaki et al. 2011). Hence, we expect that the relative velocity is of order of , although this depends on the disk geometry and the rotation direction.
As Figure 6 shows, at near the periastron, where the separation is au, the estimated shock distance due to the pulsar/Be disk interaction is of order of au for , suggesting the disk matter could be captured by the pulsar because . The accretion rate may be estimated as
| (28) | |||||
where is the geometrical factor and we used the parameter at AU (typical separation during the periastron passage) with . We note that for the stellar wind, , the capture radius becomes AU, which is usually smaller than the shock radius due to the pulsar wind and stellar wind interaction (Figure 5). Hence the stellar wind will not be captured by the pulsar.
There will be an relative angular momentum of the captured matter with respect to the pulsar, indicating the captured matter forms a circular orbit around the pulsar at a distance () where the relative angular momentum per unit mass is equal to the angular momentum of the Kepler orbit around the pulsar, . The angular frequency of the orbital motion of the pulsar is . The angular frequency of the circular orbit of the Be disk around the B-star is also , because . Roughly speaking, therefore, the angular frequency associated with the relative angular momentum will be of the order of , although again it depends on the disk geometry and rotation direction. The circularization radius of the captured matter may be estimated as (Frank et al. 2002)
| (29) | |||||
If we apply the standard Shakura-Sunyaev disk model, the disk matter will move inward with a dynamical time scale , where is the viscous parameter in units of 0.1, suggesting the accreting matter will take several weeks to reach the pulsar after the capture event. If the dynamical time scale () is longer than the pulsar’s disk crossing time scale, which may be of the order of , the accretion disk may not develop around the pulsar. We note however that the circularization radius given by equation (29) is sensitive to the relative velocity; with cm, for example, cm, which is inside of the light cylinder. Moreover, we do not know the geometry of the disk. If the disk plane is parallel to the orbital plane, the pulsar/Be disk continues to interact during the periastron passage. Hence it is possible that the accretion disk develops with a radial length around the pulsar at the periastron passage.
If the accretion disk forms around the pulsar, the disk supplies UV photons in the pulsar wind region. Figure 22 summarizes the radiation power () for the accretion disk (solid line), stellar surface (dashed line), and Be disk (dotted line). For the accretion disk, we assume an accretion rate and the disk extends from the light cylinder of the pulsar to . For the stellar emission, we assume the Planck function with K and . For the Be disk emissions, we assumed the disk temperature after the calculation of Carciofi & Bjorkman (2006). We ignore the effects of the emission and absorption lines on the spectra.


As discussed in above, the captured matter will take about several weeks to reach the pulsar magnetosphere. Before the accretion disk reaches to the light cylinder radius, the rotation activity of the pulsar is still turned on and produces the cold-relativist pulsar wind. Then we can expect that the ICS process of the cold-relativistic pulsar will boost up the UV photons from the disk to the higher energy photon. Figure 23 summarizes the calculated spectra (left panel) and the integrated flux as a function of the accretion disk inclination angle (right panel). The figure shows the results when the accretion disk extends from the light cylinder radius to . In addition, we assumed the mono-energetic distribution of the particles in the cold-relativistic pulsar wind. We took into account the energy loss of the pulsar wind due to the ICS process. As Figure 23 shows, if the initial Lorentz factor is which produces the scattered photons with 1-10GeV energy, the calculated flux level can reach an order of , which is comparable to that of the pulsed emissions.
Pulsar binary systems may provide a valuable laboratory to study the accretion process on rapidly spinning and strongly magnetized neutron stars. One may consider that once the accretion disk crosses the light cylinder, the rotation-powered activity would be quenched. This is because the copious plasma fills the acceleration region at the rotation-powered stage, where the charge density deviates from the so-called Goldreich-Julian charge density (Goldreich & Julian 1969). However, the recent observation suggests the rotation-powered activities and the accretion disk can co-exist in the magnetosphere. A transient-millisecond pulsar is a binary millisecond pulsar with low mass companion star, and it transits between the rotation-powered stage and the accretion stage (Archibald et al. 2009). PSR J1023+0038 transited from its rotation powered stage to the accretion stage at the latter in 2013 June, when the pulsed radio emission from this pulsar disappeared (Stappers et al. 2013). Coherent pulsed X-ray emission discovered after 2013 June suggests an accretion of matter on the neutron star surface (Archibald et al. 2015). Jaodand et al. (2016), however, found that the spin-down rate in the accretion stage is higher than that in the rotation-powered stage, and they concluded that the rotation activity is still operating in the accretion stage. Enhancement of observed GeV emission in the accretion stage also suggests the survival of the rotation activity in the accretion stage (Takata et al. 2014b). This model was also applied to another transient-millisecond pulsar PSR J1227-4853 (Bednarek 2015). Gamma-ray binaries with a Be companion may also offer opportunities to study this accretion process on young pulsars.
The ICS model of the pulsar wind could provide an explanation for the origin of the flare-like GeV emissions from PSR B1259-63/LS 2883 system after the second Be disk passage of the pulsar. It has been observed that the GeV peak in the orbital modulation occurs days after the X-ray peak (Tam et al. 2011, 2015). It has been considered that the phase of the X-ray peak corresponds to that of the pulsar/Be disk interaction. So we may expect that the Be disk matter starts to be captured by the pulsar around the orbital phase of the X-ray peak. Since it will take several weeks to fully develop the accretion disc around the pulsar, the GeV peak position will delay from the X-ray peak position.
Finally, the magnetic radius from the pulsar is defined as the distance where the dipole magnetic field of the pulsar begins to dominate the dynamics of the accreting matter, and it is estimated from with and ,
| (30) | |||||
This radius is smaller than the light cylinder radius of PSR J2032+4127 (cm). The co-rotation radius () is defined as the distance where the angular velocity of Keplerian motion is equal to the spin angular velocity of the pulsar, namely
| (31) |
which will be smaller than the magnetic radius, suggesting the accretion process is in propeller regime, and not all infalling matter will accrete on the pulsar surface. The outflow due to the propeller effect also could cause the high-energy emission (e.g. Papitto & Torres, 2015).
In summary, we analyzed the Swift and Fermi-LAT data of the PSR J2032+4127/MT91 213 binary system, which is a candidate to be another TeV gamma-ray binary. The X-ray flux has rapidly increased as the pulsar approaches periastron, which will occur in late 2017 or early 2018, while the GeV flux measured by Fermi-LAT shows no significant change. We investigated the X-ray emission by the synchrotron process of the pulsar wind particles accelerated at the shock due to the pulsar wind and stellar wind interaction. We argued that the increase in the observed X-rays is caused by (1) variation of the momentum ratio of the two winds along the orbital phase or (2) the evolution of the magnetization parameter of the pulsar wind with the radial distance as and . The current model predicts that the peak fluxes in the 0.3-10keV and 0.1-10TeV energy bands are of the order of . The gamma-ray binary system could provide a unique laboratory to study the emissions from the cold-relativistic pulsar wind. The current model suggests that the ICS process of the cold-relativistic pulsar wind could contribute to the Fermi-LAT observations at the periastron passage (Figure 18). For this binary system, the pulsar/Be disk interaction will affect to the observed emissions, provided that the base density of the Be disk is and the interaction occurs during days and days. For a Be disk with higher base density , the pulsar/Be disk interaction could form an accretion disk around the pulsar. The ICS process of the cold-relativistic pulsar wind off the UV from the disk also provides the high-energy emission from the pulsar/Be star binary system. Future multi-wavelength observations will provide a unique opportunity to probe the pulsar wind properties and the various emission processes caused by the pulsar/Be wind and pulsar/Be disk interactions.
We express our appreciation to an anonymous referee for useful comments and suggestions. We thank A. Okazaki for the useful discussions on the Be disk model. JT is supported by NSFC grants of Chinese Government under 11573010 and U1631103. CWN and KSC are supported by GRF grant under 17302315. CYH is supported by the National Research Foundation of Korea through grants 2014R1A1A2058590 and 2016R1A5A1013277. All calculations were done under the High Performance Computing Cluster (Hyperion) of the Institute of Particle Physics and Astrophysics, HUST.
References
- Abdo et al. (2009) Abdo et al. 2009, ApJL, 706, 56
- Abdo et al. (2011) Abdo et al. 2011, ApJL, 736, 11
- abdo (2013) Abdo, A. A.; Ajello, M.; Allafort, A.; Baldini, L.; Ballet, J.; Barbiellini, G.; Baring, M. G.; Bastieri, D., et al., 2013, ApJS, 208, 17
- Acero et al. (2015) Acero, F.; Ackermann, M.; Ajello, M.; Albert, A.; Atwood, W. B.; Axelsson, M.; Baldini, L.; Ballet, J. et al., 2015, ApJS, 218, 23
- Ackermann et al. (2012) Ackermann, M. et al. 2012, Sci, 335, 189
- Aharonian et al. (2005) Aharonian, F. et al. 2005, A&A, 442, 1
- Aharonian et al. (2006) Aharonian, F. et al. 2006, A&A, 460, 743
- Albert et al. (2006) Albert, J. et al. 2006, Sci, 312, 1771
- Archibald et al. (2015) Archibald, Anne M.; Bogdanov, Slavko; Patruno, Alessandro; Hessels, Jason W. T.; Deller, Adam T. et al., 2015, ApJ, 807, 62
- Archibald et al. (2009) Archibald, Anne M.; Stairs, Ingrid H.; Ransom, Scott M.; Kaspi, Victoria M.; Kondratiev, Vladislav I., et al., 2009, Sci, 324, 1411
- Bednarek (2015) Bednarek, W., 2015, MNRAS Letter, 451, 55
- Bednarek (2007) Bednarek, W., 2007, A&A, 464, 259
- Bednarek (2000) Bednarek, W., 2000 A&A 362, 646
- Bednarek (1997) Bednarek, W., 1997, A&A, 322, 528
- Bogovalov &Khangoulian (2002) Bogovalov, S. V.; Khangoulian, D. V., 2002, MNRAS Letter, 336, 53
- bogovalov (2008) Bogovalov, S. V.; Khangulyan, D. V.; Koldoba, A. V.; Ustyugova, G. V.; Aharonian, F. A., 2008, MNRAS, 387, 63
- Bosch-Ramon (2013) Bosch-Ramon, V., 2013, A& A, 560, 32
- Bozzo et al. (2016) Bozzo, E.; Oskinova, L.; Feldmeier, A.; Falanga, M., 2016, A&A, 589, 102
- Cerutti et al. (2008) Cerutti, B.; Dubus, G.; Henri, G., 2008 A&A, 488, 37
- Cerutti et al. (2010) Cerutti, B., Malzac, J., Dubus, G., Henri, G., 2010 A&A, 519, 81
- camilo (2013) Camilo, F.; Ray, P. S.; Ransom, S. M.; Burgay, M.; Johnson, T. J.; Kerr, M.; Gotthelf, E. V.; Halpern, J. P., et al. 2009, ApJ, 705, 1
- Canto et al. (1996) Canto, J., Raga, A.C. & Wilkin, F.P., 1996, ApJ, 469, 729
- carciofi et al. (2006) Carciofi, A. C.; Bjorkman, J. E., 2006, ApJ, 639, 1081
- casandjian (2009) Casandjian, J.-M. & Grenier, I. A., 2008, A&A, 489, 849
- Chernyakova (2006) Chernyakova, M.; Neronov, A.; Lutovinov, A.; Rodriguez, J.; Johnston, S., 2006, MNRAS, 367, 1201
- Chernyakova (2015) Chernyakova, M. et al. 2015. MNRAS 454, 1358
- de la Cita eta l. (2016) de la Cita, V. M.; Bosch-Ramon, V.; Paredes-Fortuny, X.; Khangulyan, D.; Perucho, M., 2016, arXiv:1611.03788
- Dubus (2006) Dubus, G., 2006, A&A 456, 801
- Dubus (2008) Dubus, G.; Cerutti, B.; Henri, G., 2008, A&A, 477, 691
- Dubus (2010) Dubus, G., Cerutti, B. & Henri, G., 2010, A&A, 516, 18
- Dubus (2013) Dubus, G., 2013, The Astronomy and Astrophysics Review, Volume 21, article id. 64
- Dubus & Cerutti (2013) Dubus, G.; Cerutti, B., 2013, A&A, 557, 127
- dickey (1990) Dickey, John M.; Lockman, Felix J., 1990, ARA&A, 28, 215
- Evans (2007) Evans, P. A.; Beardmore, A. P.; Page, K. L.; Tyler, L. G.; Osborne, J. P.; Goad, M. R.; O’Brien, P. T.; Vetere, L., 2007, A&A, 469, 379
- Evans (2009) Evans, P. A.; Beardmore, A. P.; Page, K. L.; Osborne, J. P.; O’Brien, P. T.; Willingale, R.; Starling, R. L. C.; Burrows, D. N. et al., 2009, MNRAS, 3 97, 1177
- Frank (2002) Frank, J., King, A., & Raine, D. 2002, Accretion Power in Astrophysics (Cambridge: Cambridge Univ. Press)
- georgy (2011) Georgy, C.; Meynet, G.; Maeder, A.,2011, A&A, 527, 52
- Goldreich & Julian (1969) Goldreich, Peter; Julian, William H., 1969, ApJ, 157 869
- Hibschman (2001) Hibschman, J. A., & Arons, J. 2001, ApJ, 554, 624
- Hinton et al. (2009) Hinton et al. 2009, ApJL, 690L, 101
- Ho et al. (2016) Ho, Wynn C. G.; Ng, C.-Y.; Lyne, Andrew G.; Stappers, Ben W.; Coe, Malcolm J.; Halpern, Jules P.; Johnson, Tyrel J.; Steele, Iain A., 2016, eprint arXiv:1609.06328
- Jaodand et al. (2016) Jaodand, Amruta; Archibald, Anne M.; Hessels, Jason W. T.; Bogdanov, Slavko; D’Angelo, Caroline R., et al. 2016, ApJ, 830, 122
- Johnston et al. (1992) Johnston, Simon; Manchester, R. N.; Lyne, A. G.; Bailes, M.; Kaspi, V. M.; Qiao, Guojun; D’Amico, N., 1992, ApJ Ltter, 387, 37
- Johnston et al. (1999) Johnston, Simon; Manchester, R. N.; McConnell, D.; Campbell-Wilson, D., 1999, MNRAS, 302, 277
- Johnston et al. (2005) Johnston, Simon; Ball, Lewis; Wang, N.; Manchester, R. N., 2005, MNRAS, 358, 1069
- Kalberla et al. (2005) Kalberla, P. M. W.; Burton, W. B.; Hartmann, Dap; Arnal, E. M.; Bajaja, E.; Morras, R.; Pppel, W. G. L., 2005, A&A, 440, 775
- Kapala et al. (2010) Kapala, M., Bulik, T., Rudak, B., Dubus, G. & Lyczek, M., 2010, Proceedings of the 25th Texas Symposium on Relativistic Astrophysics. December 6-10, 2010. Heidelberg, Germany. Editors: Frank M. Rieger (Chair), Christopher van Eldik and Werner Hofmann.
- Kennel (1984) Kennel, C. F.; Coroniti, F. V., 1984, ApJ, 283, 710
- Khangulyan et al. (2007) Khangulyan, D.; Hnatic, S.; Aharonian, F.A.; Bogovalov, S.V., 2007, MNRAS, 380, 320
- Khangulyan et al. (2011) Khangulyan, D.; Aharonian, F. A.; Bogovalov, S.V.; Rib, M., 211, ApJ, 742, 98
- Khangulyan et al. (2012) Khangulyan, D., Aharonian, F.A.; Bogovalov, S.V., & Rib M., 2012, ApJL, 752, 17
- Khangulyan et al. (2014) Khangulyan, Dmitry; Bogovalov, Sergey V.; Aharonian, Felix A., 2014, International Journal of Modern Physics Conference Series, 28, 60169
- Kirk et al. (1999) Kirk, J. G.; Ball, Lewis; Skjæraasen, Olaf, 1999, APh, 10, 31
- Kong et al. (2011) Kong, S.W., Yu, Y.W., Huang, Y.F. & Cheng, K.S., 2011, MNRAS, 416, 1067
- Kong et al. (2012) Kong, S. W.; Cheng, K. S.; Huang, Y. F, 2012, ApJ, 753, 127
- Lee et al. (1991) Lee, Umin; Osaki, Yoji; Saio, Hideyuki, 1991, MNRAS, 250, 432
- lyne (2015) Lyne, A. G.; Stappers, B. W.; Keith, M. J.; Ray, P. S.; Kerr, M.; Camilo, F.; Johnson, T. J., 2015, MNRAS, 451, 581
- Negueuela (2011) Negueruela, Ignacio; Rib, Marc; Herrero, Artemio; Lorenzo, Javier; Khangulyan, Dmitry; Aharonian, Felix A., 2011, ApJL, 732, 11
- Okazaki (2011) Okazaki, Atsuo T.; Nagataki, Shigehiro; Naito, Tsuguya; Kawachi, Akiko; Hayasaki, Kimitake; Owocki, Stanley P.; Takata, Jumpei, 2011, PASJ, 63, 893
- Owocki (2009) Owocki, S. P.; Romero, G. E.; Townsend, R. H. D.; Araudo, A. T., 2009, ApJ, 2009, 696, 690
- Owocki (2011) Owocki, Stanley P.; Cohen, David H., 2006, ApJ, 648, 565
- Papitto (2015) Papitto, A.; Torres, D. F., 2015, ApJ, 807, 33
- Runacres (2002) Runacres, M. C.; Owocki, S. P., 2002, A&A, 381, 1015
- Sefako (2003) Sefako, Ramotholo R.; de Jager, Ocker C., 2003, ApJ, 593, 1013
- Sierpowska-Bartosik (2008) Sierpowska-Bartosik, A. & Torres, D.F., 2008, APh, 30, 239
- Sierpowska-Bartosik (2007) Sierpowska-Bartosik, A., Torres, Diego F., 2007, ApJ Letter, 671, 145
- Sierpowska-Bartosik (2008a) Sierpowska-Bartosik, A., Bednarek, W., 2008, MNRAS, 385, 2279
- Sierpowska & Bednarek (2005) Sierpowska, A.; Bednarek, W., 2005, MNRAS, 356, 711
- Smith (2006) Smith, M. A., 2006 A&A, 459, 215
- Snow (1981) Snow, T. P., Jr., 1981, ApJ, 251, 139
- Stappers et al. (2013) Stappers, B. W.; Archibald, A.; Bassa, C.; Hessels, J.; Janssen, G. et al. ATel, 5513, 1
- Takahashi et al. (2009) Takahashi, T. et al. 2009, ApJ, 697, 592
- Takata & Taam (2009) Takata, J. & Taam, R.E., 2009, ApJ, 702, 100
- Takata et al. (2012) Takata, J.; Okazaki, A. T.; Nagataki, S.; Naito, T.; Kawachi, A.; Lee, S.-H.; Mori, M.; Hayasaki, K.; 2012, ApJ, 750, 70
- Takata et al. (2014a) Takata, J.; Leung, Gene C. K.; Tam, P. H. T.; Kong, A. K. H.; Hui, C. Y.; Cheng, K. S., 2014a, ApJ, 790, 18
- Takata et al. (2014b) Takata, J.; Li, K. L.; Leung, Gene C. K.; Kong, A. K. H.; Tam, P. H. T., et al. 2014b, ApJ, 785, 131
- Tanaka & Takahara (2010) Tanaka, Shuta J.; Takahara, Fumio, 2010, ApJ, 715, 1248
- Tam et al. (2011) Tam, P.H.T., Huang, R.H.H., Takata, J., Hui, C.Y., Kong, A.K.H., Cheng, K. S., 2011, ApJL, 736, 10
- Tam et al. (2015) Tam, P. H. T.; Li, K. L.; Takata, J.; Okazaki, A. T.; Hui, C. Y.; Kong, A. K. H., 2015, ApJ Letter, 798, 26
- Tavani & Arons (1997) Tavani, M., & Arons, J., 1997, ApJ, 477, 439
- Timokhin (2015) Timokhin, A. N.; Harding, A. K., 2015, ApJ, 810, 144
- Torres (2011) Torres, D.F., 2011, Proceedings of the 1st Sant Cugat Forum on Astrophysics, ’ICREA Workshop on the high-energy emission from pulsars and their systems’, held in April, 2010, (preprint, arXiv:1008.0483)
- van Soelen et al. (2012) van Soelen, B.; Meintjes, P. J.; Odendaal, A.; Townsend, L. J., 2012, MNRAS, 426, 3135
- Waters et al. (1988) Waters, L. B. F. M.; van den Heuvel, E. P. J.; Taylor, A. R.; Habets, G. M. H. J.; Persi, P., 1988, A&A, 198, 200
- Walder et al. (2012) Walder, Rolf; Folini, Doris; Meynet, Georges, 2012, SSRv, 166, 145
- Xing et al. (2016) Xing, Yi; Wang, Zhongxiang; Takata, Jumpei, APJ, 828, 61
- Yamaguchi & Takahara (2010) Yamaguchi, M. S.; Takahara, F., 2010, ApJ, 717, 85
- Yamaguchi & Takahara (2010) Yamaguchi, M. S.; Takahara, F., 2012,ApJ, 761, 146
- Zabalza et al. (2013) Zabalza, V.; Bosch-Ramon, V.; Aharonian, F.; Khangulyan, D., 2013, A&A 551, 17