11email: fedele@arcetri.astro.it 22institutetext: Leiden Observatory, Leiden University, P.O. Box 9513, NL-2300 RA, Leiden, The Netherlands
33institutetext: School of Physics and Astronomy, University of Leeds, Leeds LS2 9JT, UK
44institutetext: UK Astronomy Technology Centre, Royal Observatory Edinburgh, Blackford Hill, Edinburgh EH9 3HJ, UK
55institutetext: Max Planck Institut für Extraterrestrische Physik, Giessenbachstrasse 1, 85748 Garching, Germany
66institutetext: Max-Planck-Institute for Astronomy, Koenigstuhl 17, 69117 Heidelberg, Germany
ALMA unveils rings and gaps in the protoplanetary system
HD 169142: signatures of two giant protoplanets
The protoplanetary system HD 169142 is one of the few cases where a potential candidate protoplanet has been recently detected via direct imaging in the near-infrared. To study the interaction between the protoplanet and the disk itself observations of the gas and dust surface density structure are needed. This paper reports new ALMA observations of the dust continuum at 1.3 mm, 12CO, 13CO and C18O emission from the ( almost face-on) system HD 169142 at angular resolution of (au). The dust continuum emission reveals a double-ring structure with an inner ring between (au) and an outer ring between (au). The size and position of the inner ring is in good agreement with previous polarimetric observations in the near-infrared and is consistent with dust trapping by a massive planet No dust emission is detected inside the inner dust cavity (au) or within the dust gap (au) down to the noise level. In contrast, the channel maps of the line of the three CO isotopologues reveal the presence of gas inside the dust cavity and dust gap. The gaseous disk is also much larger than the compact dust emission extending to (au) in radius. This difference and the sharp drop of the continuum emission at large radii point to radial drift of large dust grains ( m-size). Using the thermo-chemical disk code dali, the continuum and the CO isotopologues emission are modelled to quantitatively measure the gas and dust surface densities. The resulting gas surface density is reduced by a factor of inward of the dust gap. The gas and dust distribution hint at the presence of multiple planets shaping the disk structure via dynamical clearing (dust cavity and gap) and dust trapping (double ring dust distribution).
Key Words.:
protoplanetary disks – giant planet formation1 Introduction
Observations of the cold gas and dust reservoirs of protoplanetary disks are powerful tools for investigating the early phase of planet formation. In particular, addressing the radial distribution of gas and dust in the disk interior has the potential to unveil the initial conditions for the formation of gas giant planets. In contrast with optical/near-infrared scattered light data or infrared spectroscopy, sub-millimetre observations probe the bulk of the gas and dust mass in the disk. Recent observations in the sub-millimetre regime with the Atacama Large Millimetre/Sub-millimeter Array (ALMA) brought to light the evidence of discontinuous radial (gaps and cavities) and azimuthal (traps and vortices) dust distributions (e.g., Casassus et al., 2012; van der Marel et al., 2013; ALMA Partnership et al., 2015; Walsh et al., 2014; Andrews et al., 2016; Isella et al., 2016) and cold gas cavities that are smaller than the dust cavities (van der Marel et al., 2016).
Different theories have been proposed to explain the formation of dust gaps and rings including: dynamical interaction with one or more giant planets carving out the dust (e.g., Papaloizou & Lin, 1984); magneto-rotational instability giving rise to dead-zones (Flock et al., 2015); dust grain growth corresponding to condensation fronts (Zhang et al., 2015); fusing of dust grains at temperatures below the sublimation point (dust sintering, Okuzumi et al., 2016); photoevaporation (Ercolano et al., 2017).
Sub-millimetre interferometric observations of both gas and dust have the potential to unveil the evolutionary status of protoplanetary systems and to disentangle the physical origin of dust cavities and dust gaps in disks. A particularly powerful test is to perform ALMA observations of disks for which optical/near-infrared data have previously suggested embedded planets.
| Dates Observed | 2015 August 30 | ||
|---|---|---|---|
| Baselines | 13 – 1445 m — 10 – 1120 k | ||
| C18O 2–1 | 13CO 2–1 | 12CO 2–1 | |
| Rest frequency [GHz] | 219.56035 | 220.39868 | 230.53800 |
| Synthesized beam [FWHM] | |||
| Position angle | –745 | –752 | –728 |
| Channel width [km s-1] | 0.084 | 0.084 | 0.040 |
| r.m.s. noise (per channel) [mJy beam-1] | 6 | 8 | 13 |
| Peak emission [mJy beam-1] | 100 | 200 | 540 |
| Integrated fluxa𝑎aa𝑎aIntegrated over a circular aperture of 3″ radius. [Jy km s-1] | 3.90.5 | 7.60.6 | 14.02.0 |
| Weighting | natural | ||
| Continuum Frequency [GHz] | 233.0 | ||
| Synthesized beam [FWHM] | 028 018 | 024 016 | 022 014 |
| Position angle | –779 | –783 | –800 |
| r.m.s. noise [mJy beam-1] | 0.07 | 0.26 | 0.11 |
| Peak emission [mJy beam-1] | 17 | 15 | 13 |
| Integrated flux [mJy] | 23223 | 22623 | 22623 |
| Weighting | Briggs, robust = 0.5 | Uniform | Superuniform |
2 HD 169142
HD 169142 is a young Myr and isolated (Grady et al., 2007) Herbig Ae/Be star (The et al., 1994) with (Blondel & Djie, 2006), spectral type A5 and K (Dunkin et al., 1997). The most recent measurement of the parallax is mas (Gaia Collaboration et al., 2016) which translates to a distance pc. Previous estimates by de Zeeuw et al. (1999) had instead pc. In the rest of the paper we will use the newest distance estimate adjusting all the relevant parameters. The stellar luminosity adopted in this paper is based on the new distance estimate and on the the optical V-magnitude and extinction (V = 8.15 mag, mag, Malfait et al. 1998, e.g.,). Sub-millimeter observations of the 1.3 mm dust continuum and CO with the Submillimeter Array (SMA) measured a disk inclination of 13∘ and a position angle of 5∘ (Raman et al., 2006; Panić et al., 2008). Based on observations of multiple CO isotopologues with the SMA, Panić et al. (2008) derive a total gas mass of in good agreement with the estimate by Pinte et al. (2010) of based on the Herschel/PACS detection of [O I] 63 m (Meeus et al., 2010; Fedele et al., 2013). The spectral energy distribution (SED) suggests the presence of a discontinuous radial distribution of the dust (Malfait et al., 1998). This is confirmed by direct imaging observations of the thermal emission at mid-infrared wavelengths (Honda et al., 2012) as well as by band scattered light emission (Fukagawa et al., 2010; Quanz et al., 2013; Momose et al., 2015; Wagner et al., 2015). In particular, the H-band polarimetric image shows a ring-like dust distribution at a radius of (20 au) from the star. The dust ring seen in scattered light is also detected in the 7 mm continuum (Osorio et al., 2014).
Biller et al. (2014) and Reggiani et al. (2014) detected a point-like emission at (au) via -band coronographic and polarimetric differential imaging, respectively. According to Reggiani et al. (2014) this emission is produced by a massive planet of . Biller et al. (2014) warn instead that, because of the non-detection in the and bands, this should be a disk feature. Nevertheless, the potential discovery of a protoplanet makes HD 169142 an ideal case to study the planet-disk interaction during the early phases of planetary formation and evolution.
This paper presents new ALMA high angular resolution observations of HD 169142 of the transition of 12CO, 13CO and C18O and 1.3 mm dust continuum. From these observations we place more stringent constraints on the dust and gas density structures. In section 3 we summarise the observing strategy and the data reduction. Results are presented in section 4. In section 5 we compare the observations with simulations of thermo-chemical disk models to constrain the gas and dust distributions. Discussion and conclusions are given in sections 6 and 7, respectively.


3 Observations and data reduction
HD 169142 (J2000: R.A. = 18h24m29.776s, DEC = –29∘4649.900) was observed on 2015 August 30 with the Atacama Large Millimeter Array (ALMA) in band 6 (211–275 GHz) as part of project 2013.1.00592.S. In total, 35 antennas were used to achieve a spatial resolution of . The upper sideband (USB) contained two spectral windows. One window has continuum observations in the Time Domain Mode (TDM) correlator setting with 2 GHz bandwidth centered at 233 GHz. The 12CO = 2–1 line at 230.538 GHz was observed in the second USB spectral window with the Frequency Domain Mode (FDM) correlator setting at 30.5 kHz (0.040 km s-1) frequency (velocity) resolution. 13CO = 2–1 at 220.39868 GHz and C18O = 2–1 at 219.56035 GHz were both observed in separate spectral windows in the lower sideband (LSB) in FDM mode. Each observed LSB line had a frequency (velocity) resolution of 61.0 kHz (0.084 km s-1). Table 1 summarizes the observational parameters.
Visibility data were obtained in a single execution block with a 6.05s integration time per visibility for 50 minutes total on-source. System temperatures were between K. Weather conditions on the date of observation gave an average precipitable water vapour of 1.8 mm. Calibration was done with as the delay and bandpass calibrator, J1812-2836 as the gain calibrator, and Ceres as the flux calibrator. The flux values for Ceres on the date of observation were 1.941 Jy in the LSB and 2.165 Jy in the USB. The visibility data were subsequently time binned to 30s integration times per visibility for self-calibration, imaging, and analysis. Extended emission is present in 12CO and 13CO data and poorly sampled on short baselines in the space, which resulted in a reduced image quality. For this reason, the total flux listed in Table 1 is integrated in a circular aperture of 3″ radius centered on the source position.
Self-calibration for HD 169142 was performed using the 233 GHz continuum TDM spectral window with DA59 as the reference antenna. Calibration solutions were calculated twice for phase and once for amplitude. The first phase solution interval was set to 300s, the second phase and amplitude solutions had the solution interval set equal to the binned integration time. Self-calibration solutions from the TDM spectral window were cross-applied to each FDM spectral window. Continuum subtraction of the line data was done in space based on a single-order polynomial fit to all line-free channels in each spectral window. clean imaging for the continuum was done using different weighting schemes, Briggs (Briggs, 1995), uniform and superuniform, (Table 1). In the rest of the paper we adopt the first (which provides the minimum r.m.s.). For the lines clean imaging was done with natural weighting. Data reduction was performed with the Common Astronomy Software Applications (casa, McMullin et al. 2007).
4 Results
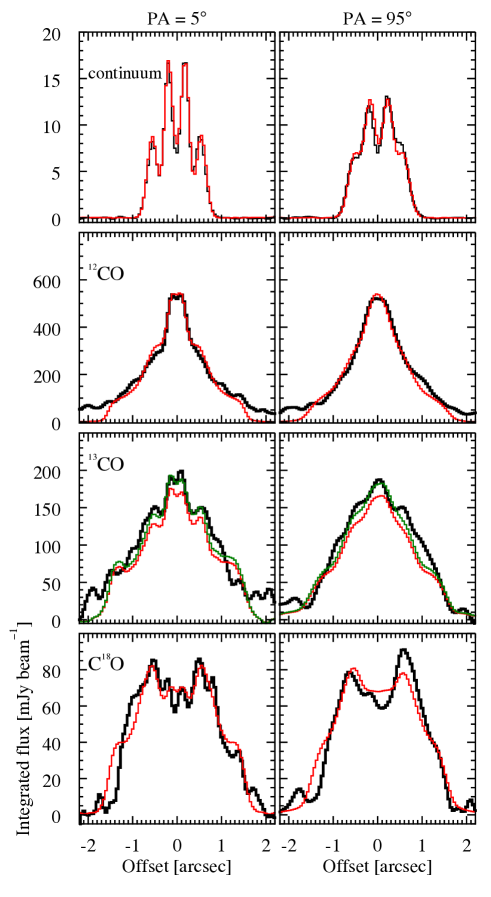
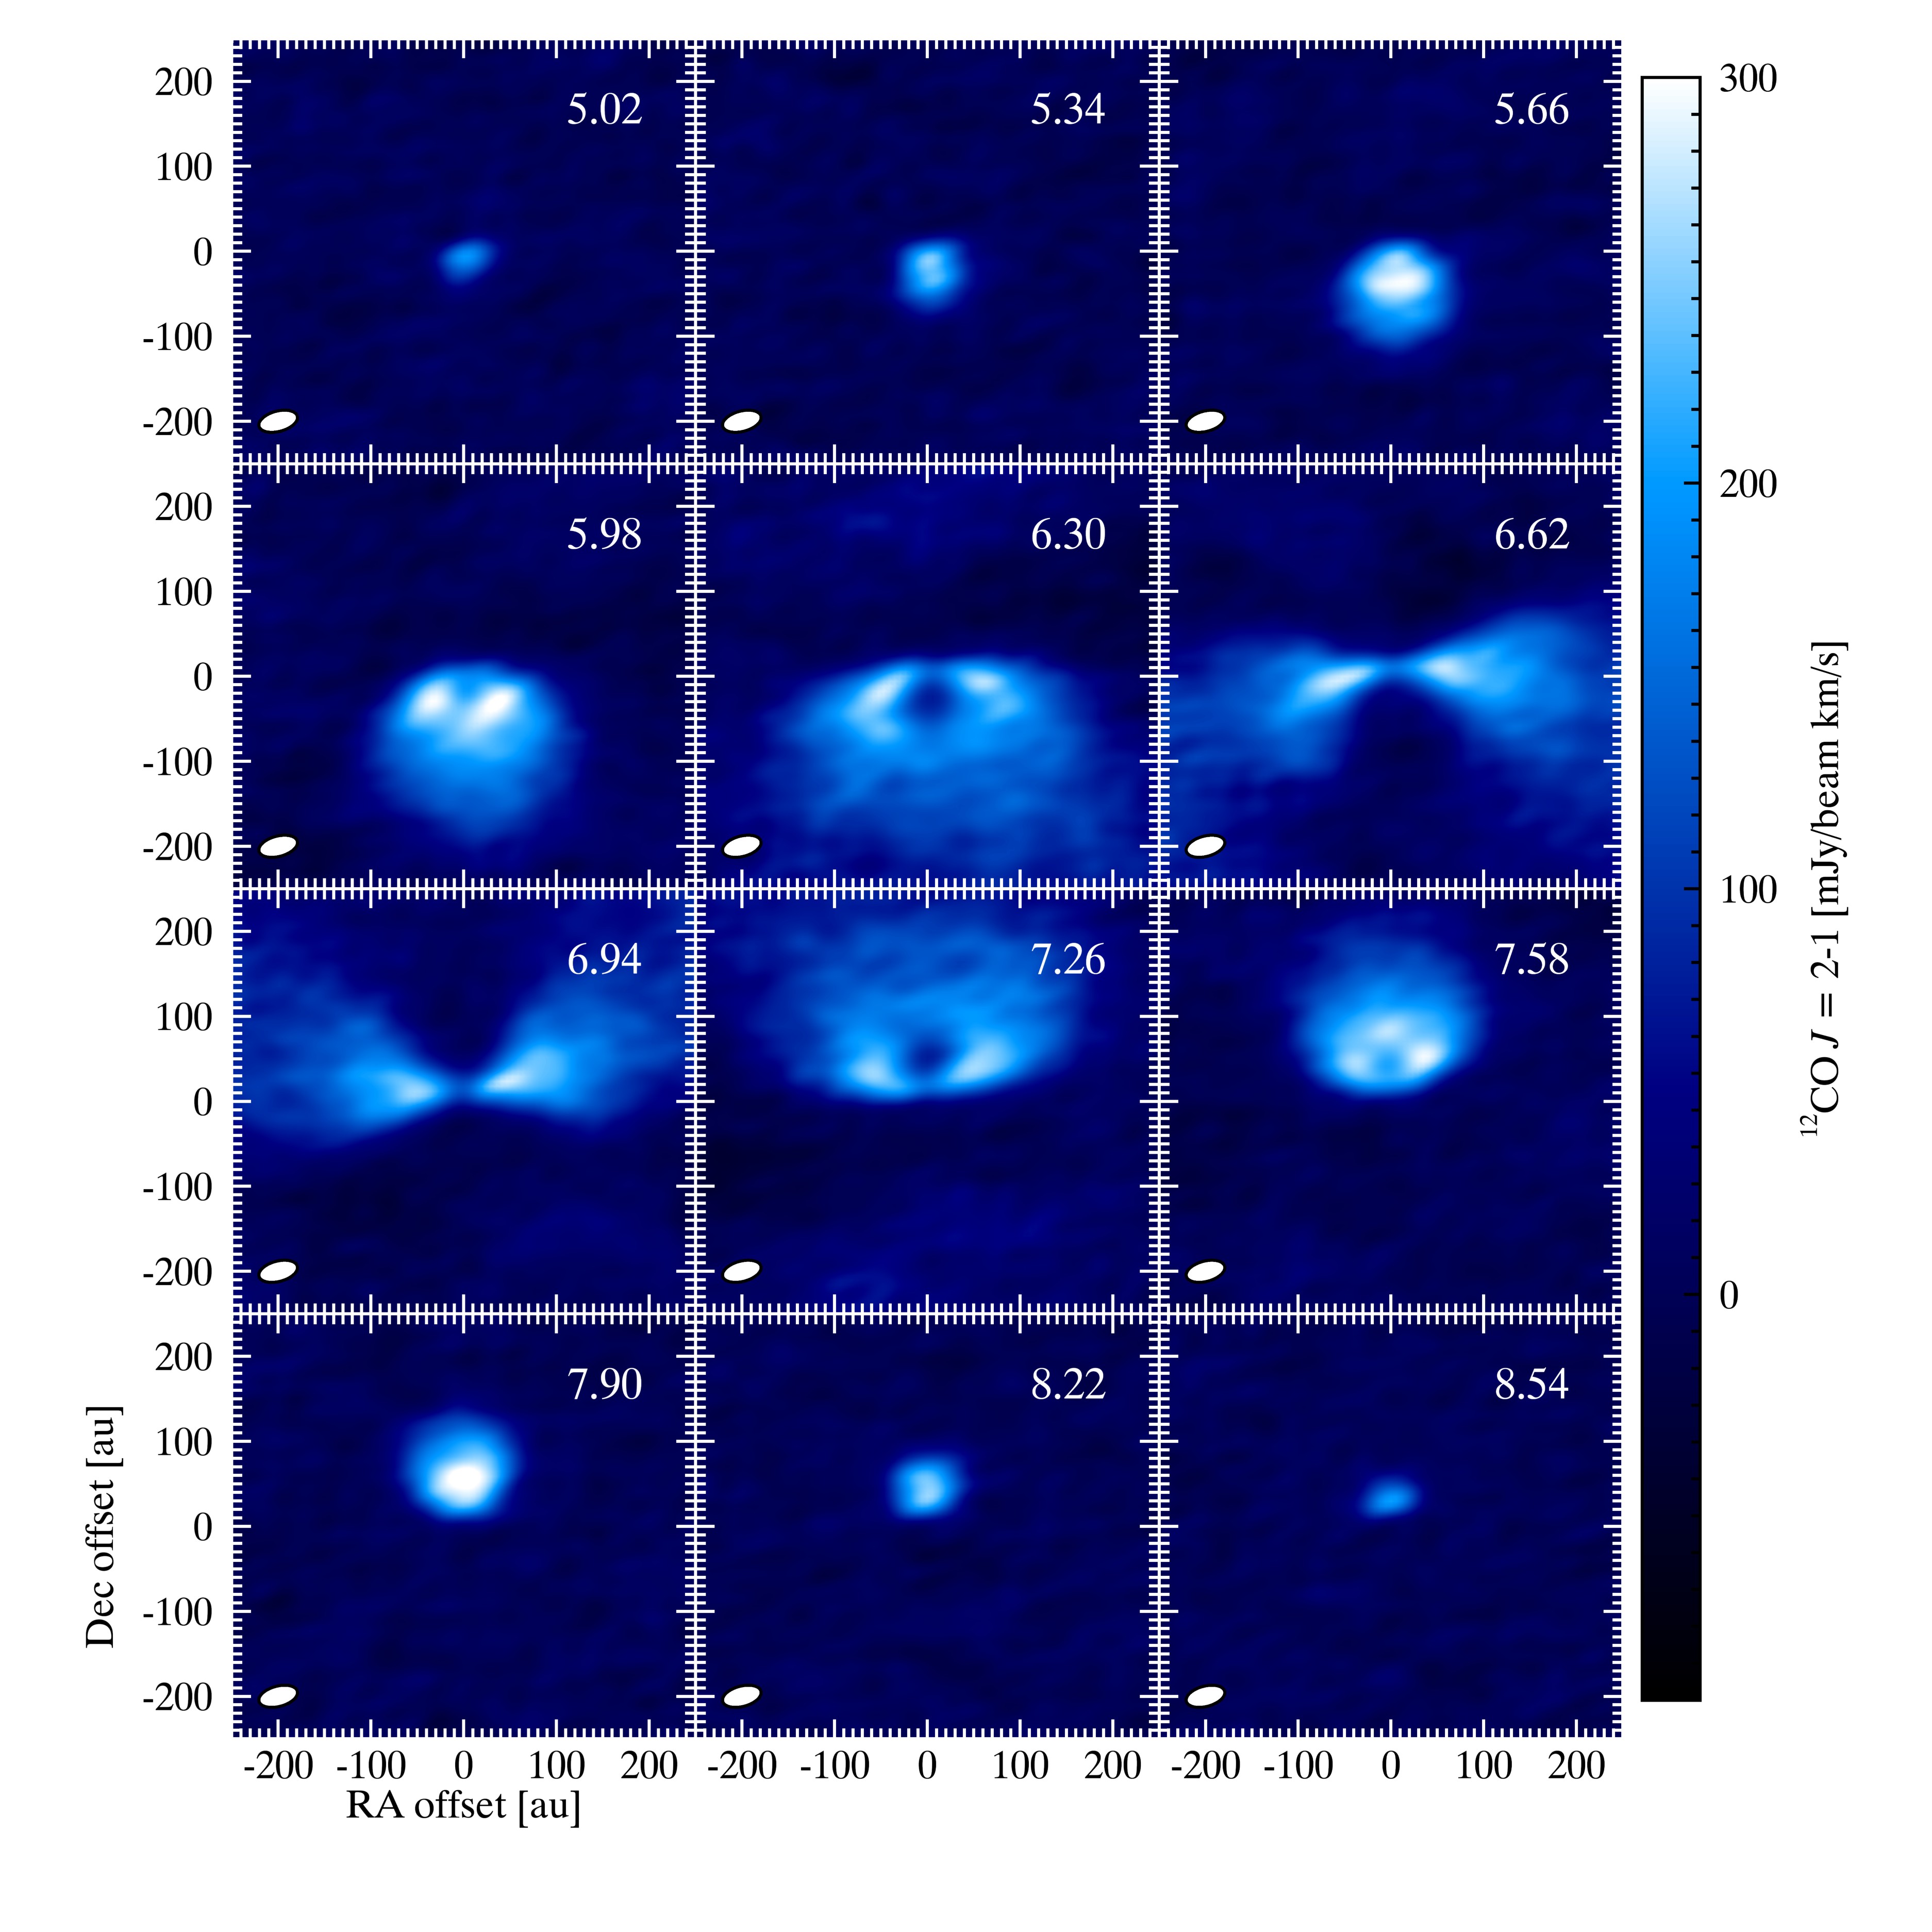
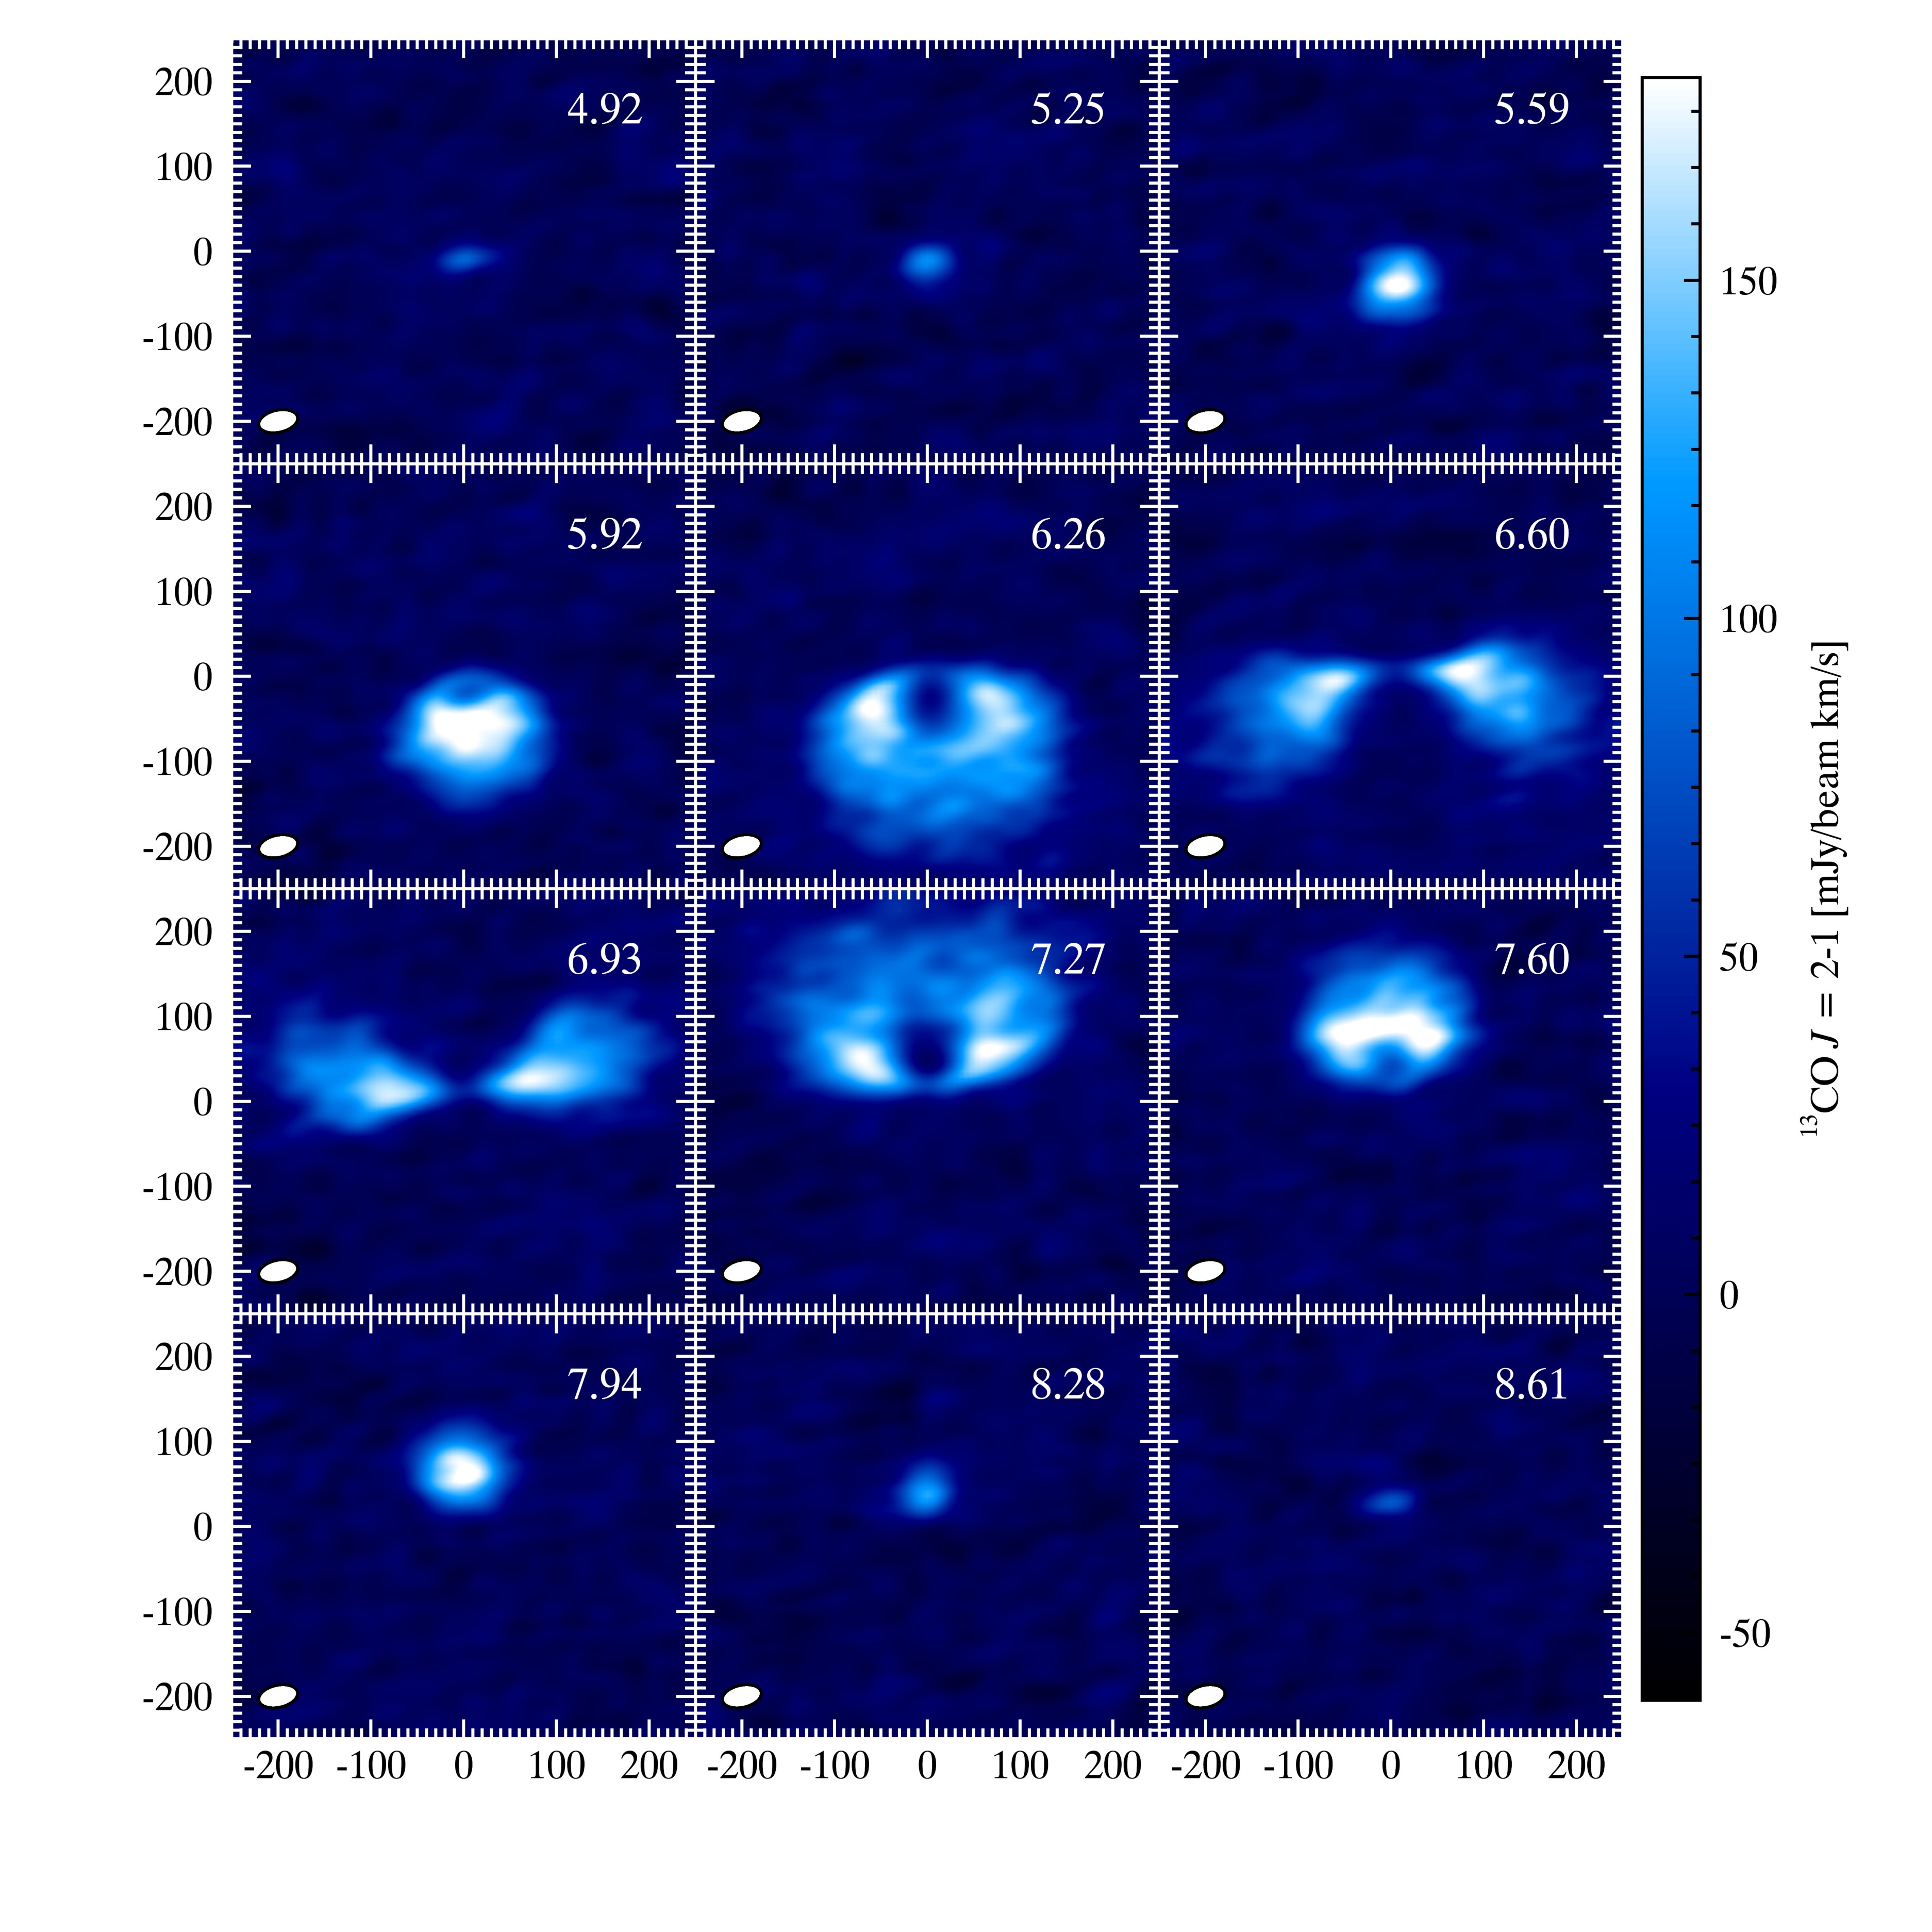
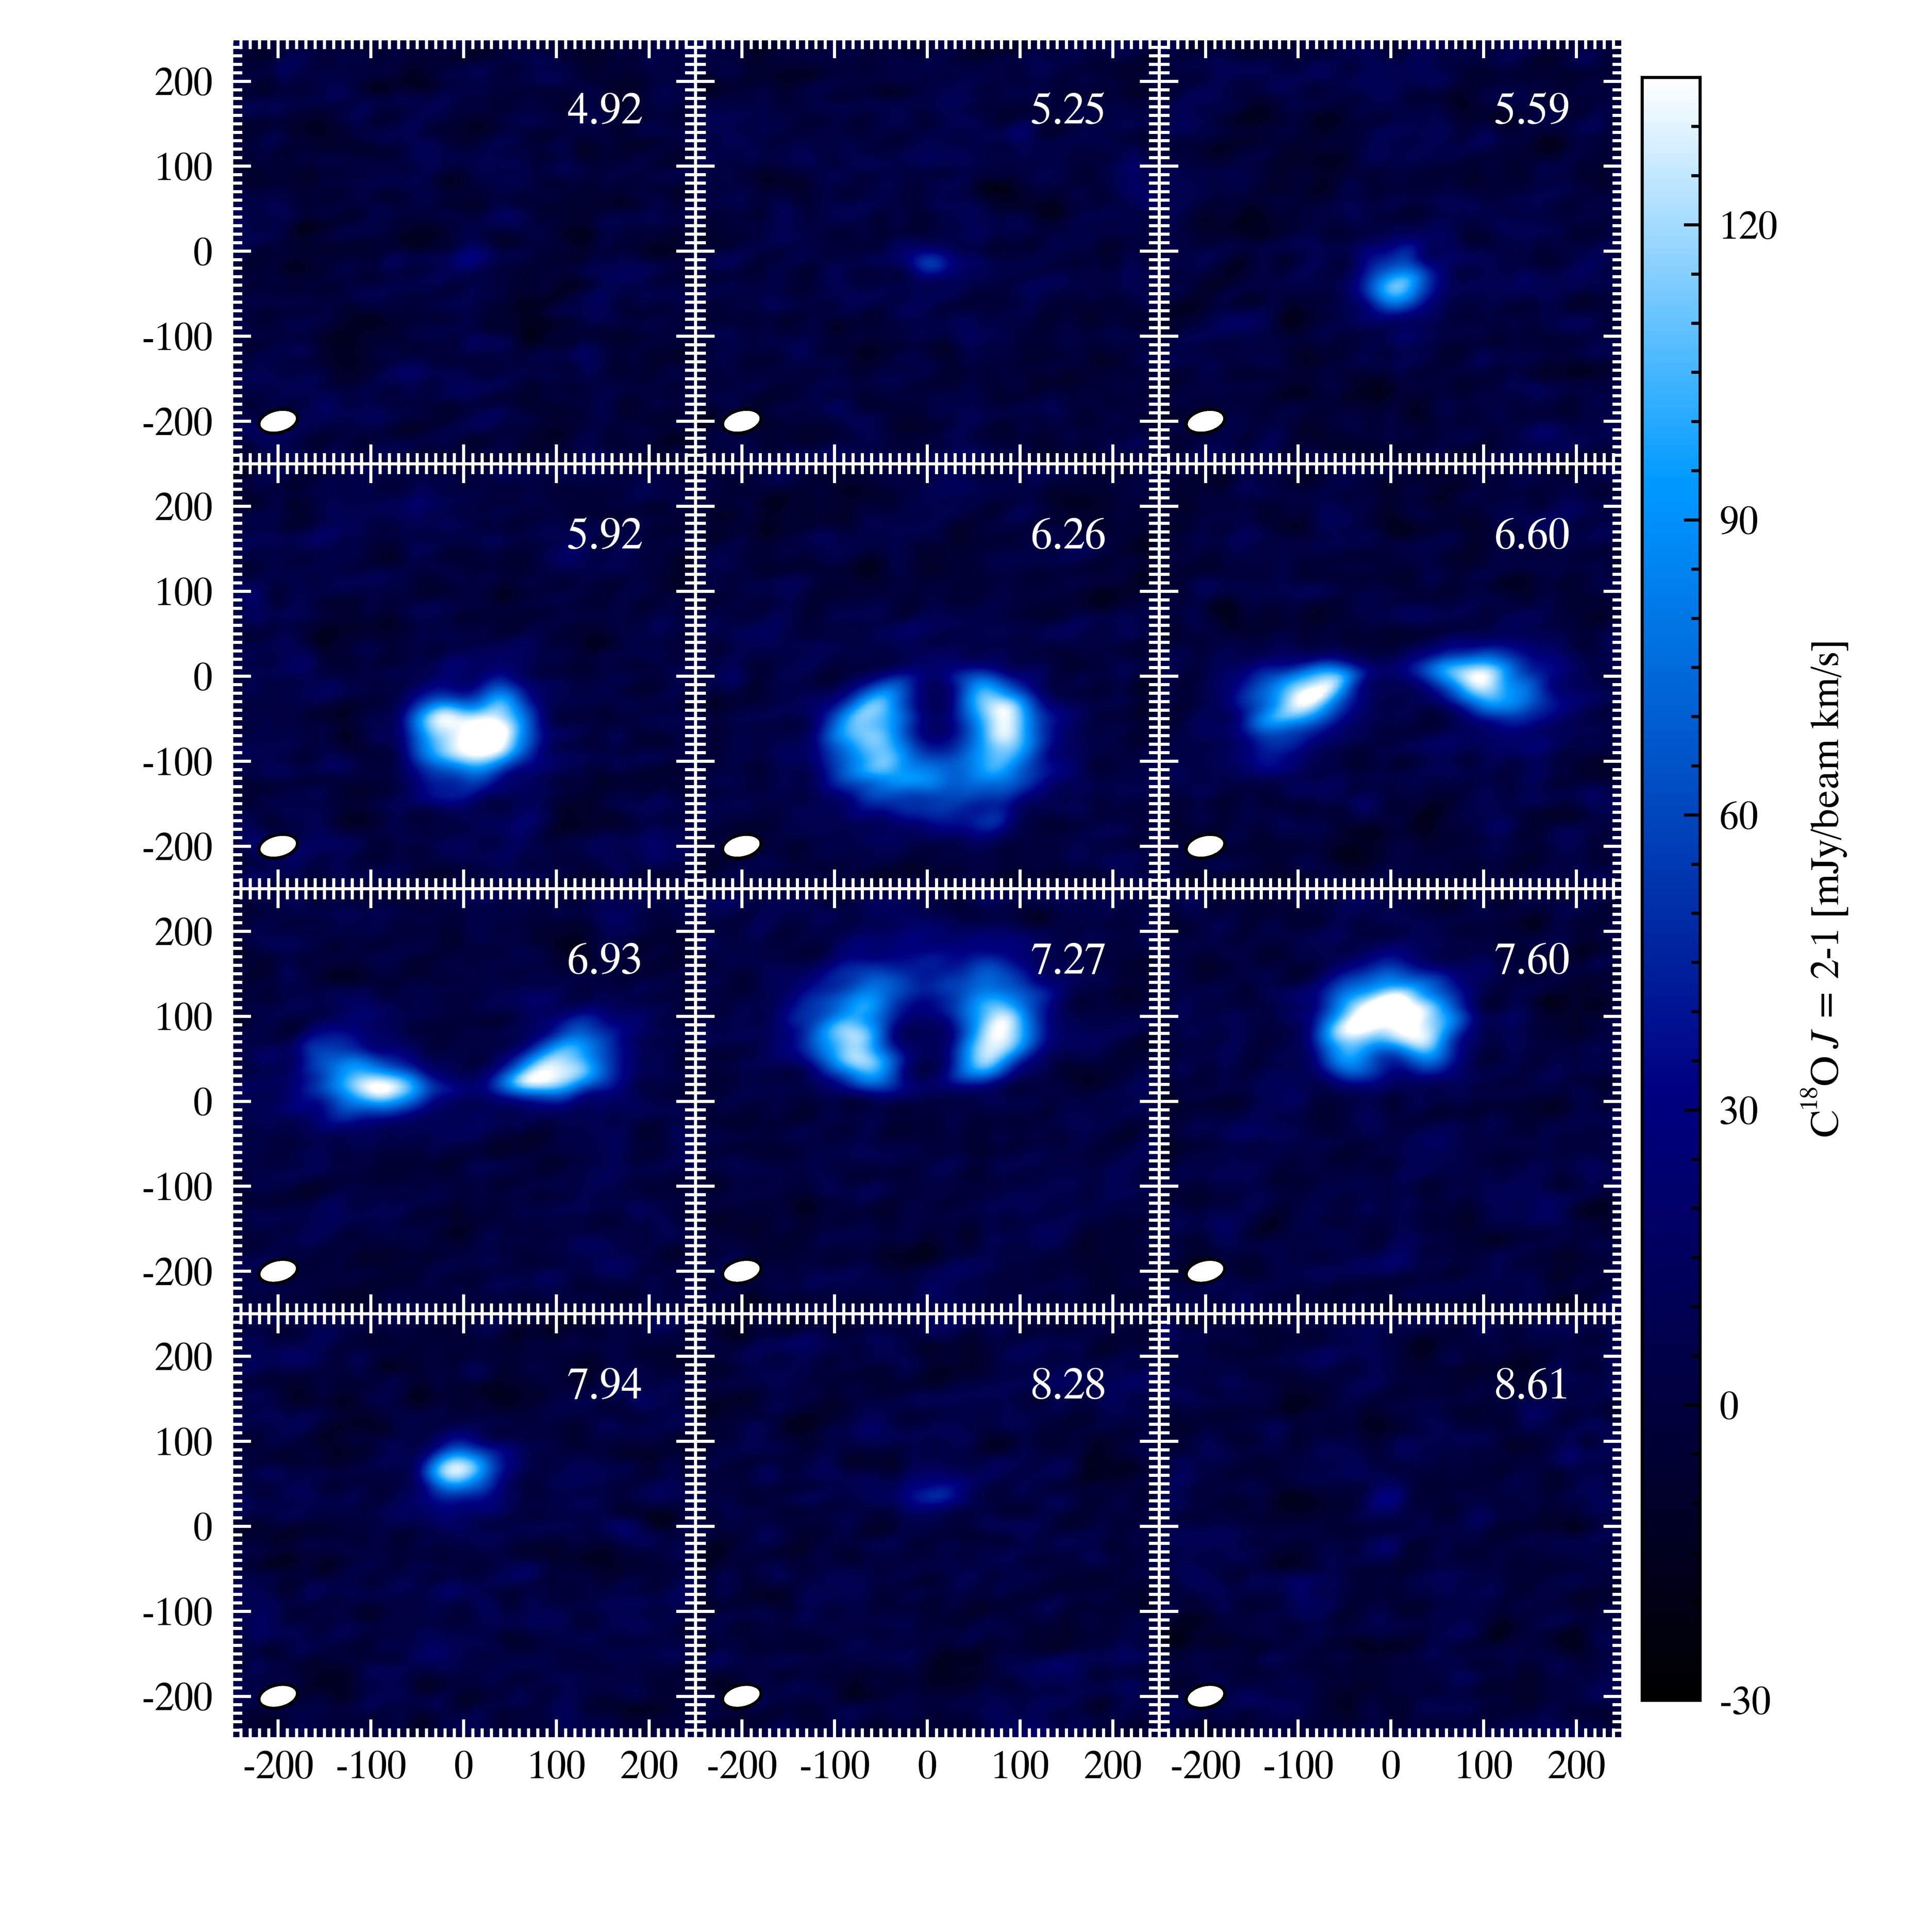
The 1.3ṁm continuum and all the three CO isotopologues lines are readily detected. Figures 1, 2 and 3 show the dust continuum map, the lines integrated intensity maps and the radial profiles, respectively. The channel maps of the three lines are presented in Figures 8, 9 and 10 in the Appendix.
4.1 Dust continuum emission
The 1.3 mm continuum map (Figure 1) and the radial profile (Figure 3) reveal a double-ring structure in the dust distribution with an inner cavity 017 in radius and a dust gap between . The dust continuum emission drops steeply beyond 064. The different structures are highlighted in Figure 1 (center panel) along with the position of the point-like -band emission (Biller et al., 2014; Reggiani et al., 2014). The radial profile (Figure 3) is shown at 2 different position angles, PA=5∘ (major axis) and PA=95∘ (minor axis). Along the minor axis, the continuum is slightly asymmetric with the West side brighter than the East side. The flux difference between the two sides is mJy ().
The ALMA continuum map shows some similarities with the H-band polarimetric differential imaging (PDI, Quanz et al. 2013; Momose et al. 2015). The NaCo H-band PDI image is shown in Figure 1 and Figure 4 shows the radial intensity profile. The position and size of the inner dust ring and gap are consistent between both wavelength ranges. In the outer disk, the ALMA continuum emission is clearly more compact than the H-band emission (Figure 4).
The dearth of dust continuum emission inside the inner dust cavity and the dust gap, and the similarities between the H-band PDI and the dust continuum emission, suggest that the cavity and the gap are due to a substantial depletion of dust particles. An upper limit to the dust mass inside the gap can be estimated from the r.m.s. of the continuum flux density (Table 1). With the assumption of optically thin emission, the dust mass is (e.g., Roccatagliata et al., 2009):
| (1) |
where (Jy) is the upper limit on the flux density, (cm) the distance, = 2 (cm2 g-1) the mass absorption coefficient at 230 GHz (Beckwith et al., 1990), (K) the dust temperature inside the gap and (Jy sr-1) the Planck function. We assume K (see Fig. 5). The flux density upper limit is computed adopting a constant flux of Jy beam-1 (i.e., 3 r.m.s.) over the entire gap area. This corresponds to a dust mass 3 upper limit of 0.3 M⊕. With the same assumptions the dust mass upper limit inside the cavity (assuming K, Fig. 5) is M⊕.
4.2 CO isotopologues emission
The integrated intensity maps (Figure 2) and the radial profile (Figure 3) of the three CO isotopologues show different intensity distributions: the 12CO emission is centrally concentrated with most of the line intensity originating within a 020 radius; the peak of the 13CO emission corresponds to that of 12CO but with a secondary ring-like structure further out in the disk; in the case of C18O, the emission map shows an inner (weak) ring centered at and a (strong) outer ring peaking at with tail up to . The gas emission is more extended than the dust continuum emission (Figure 3). Moreover, the H-band scattered light emission, in the outer disk, follows the same intensity distribution as that of 12CO.
The positions of the 2 C18O peaks are spatially coincident with the location of the dust rings. Along the disk minor axis, the C18O is slightly asymmetric with the West side brighter than the East one (similar to the continuum asymmetry). The flux difference between the 2 peaks is mJy (). The line emission maps are consistent with a disk inclination of 13∘ and a position angle of the disk major axis of 5∘.
The different radial distributions of the emission from the three isotopologues is readily explained by an optical depth effect as the transition of the three species has different with . The optically thick 12CO emission is mostly sensitive to the gas temperature, and as a consequence its line intensity peaks toward the central, hotter, region of the disk. As the optical depth goes down, the line emission is less sensitive to the gas temperature and more sensitive to the gas column density. This is clear when looking at the distribution of 13CO and C18O: in the first case the emission is less peaked (compared to 12CO) toward the central region and it also shows a secondary peak (ring-shaped) in the outer, colder, disk. Finally, the optically thin C18O emission originates mostly in the outer disk showing a clear ring-like structure. The ring-like shape seen in the 13CO and C18O emission map is spatially coincident with the outer dust ring.
4.3 Disk surface density
The spatial distribution of the three isotopologues emission provides direct insight into the gas content in the disk: the strong centrally peaked 12CO emission indicates the presence of gas inside the dust gap and the dust cavity. On the other hand, the line intensity map of 13CO and in particular C18O implies a substantial drop of the gas surface density by a factor of the order of 100 inside the dust gap and cavity (see section 5). The similar intensity profiles of the scattered light and 12CO emission, in the outer disk, is a strong indication that the small dust grains are dynamically and thermally coupled to the gas in the outermost layers of the disk. The intensity drop in the inner disk is also clearly seen in the individual channel maps shown in Figures 8, 9 and 10 in the Appendix
The significance of the asymmetric emission along the minor axis (continuum and C18O) is low () and further observations are needed to confirm such a structure.
5 Analysis
In this section the ALMA observations of the 1.3 mm continuum and of the three CO isotopologues are compared with thermo-chemical disk model simulations. The goal is to quantify the decrease in dust and gas in the cavity and gap identified in the images.
5.1 Disk model description
The simulations presented here were generated using the thermo-chemical disk code dali (Dust and Lines, Bruderer et al. 2012; Bruderer 2013). In this example dali takes as input a K blackbody radiation field to simulate the stellar spectrum and a power-law surface density structure with an exponential tail
| (2) |
with the radial distance from the star, critical radius, gas surface density at . The dust surface density is , where is the gas-to-dust mass ratio. Along the vertical axis the gas density is parametrized by a Gaussian distribution with scale height ()
| (3) |
with the critical scale height and the flaring angle. Following D’Alessio et al. (2006), the settling of the large dust particles is implemented adopting two different power-law grain size populations, small (0.005 - 1 m) and large (0.005 - 1000 m) and power-law exponent (note that the size ranges are different from those adopted in D’Alessio et al. 2006). Dust mass absorption cross sections are from Andrews et al. (2011). The scale height of the two populations is for the small grains and () for the large grains. The mass ratio between the two populations is controlled by the parameter : the dust surface density is and for the small and large grains, respectively.
dali solves the 2D dust continuum radiative transfer and determines the dust temperature and radiation field strength at each disk position. In a second step dali iteratively solves the gas thermal balance and chemistry, and returns as output the continuum and line emission maps computed via ray tracing. Isotope selective photodissociation is included in the chemistry as described in Miotello et al. (2014).
5.2 Surface density
Starting from the ALMA observations we define a surface density structure as shown in Figure 5 (left): the gas distribution extends from to , while dust is only present between – and between – . Along the radial axis, gas and dust densities are reduced by different decrease factors for the gas inside the dust cavity () and inside the dust gap () and for the dust in the ring () as follow
Figure 5 shows the modelled disk density structure.
Note that our model does not include the small ring of hot dust, inside 0.27 au (e.g., Wagner et al., 2015). This does not influence our results as the extinction produced by this small amount of dust is negligible and it does not affect the propagation of the ultraviolet radiation further out in the disk.
5.3 Model grid
We created a grid of disk models varying the most relevant geometrical and physical parameters These are:
-
•
gas and dust mass (regulated by the combination of , , and ): which control the overall continuum and line emission as well as the SED
-
•
flaring angle (): influencing mostly the radial intensity profile of the optically thick 12CO emission (arising from the outermost layers)
-
•
scale height (): which has a major impact on the intensity of the gas and dust emission and on the SED
-
•
gas and dust decrease factors (, , ): that control the gas and dust emission inside the dust gap
-
•
size and position of the cavity and of the gap (, , , )
-
•
outer dust and gas radii (, )
Table 2 lists the definition, range and step size of the different parameters.
Using dali we created model images of the dust continuum emission and of the transition of the three CO isotopologues. In the case of the CO isotopologue lines, the model channel maps are computed with the same spectral resolution as the observations. From the dali model images we measured synthetic visibilities, synthetic observations and residual (data-model) images reading the coordinates, integration time, source position, hour angle and spectral window parameters directly from the observed ALMA measurement set. For this task we used the casa tools simobserve and clean.
The model grid is compared to the observations with the aim of constructing a fiducial model that quantitatively reproduces the ALMA observations. The observed radial intensity profiles (along the disk minor and major axes) and the SED are fitted against the model grid. The fiducial model is defined by the set of parameters that minimise the difference between observations and model grid within the explored parameter space.
5.4 Fiducial model and comparison with observations
The surface density distribution, the density and temperature structure and the SED of the fiducial model are shown in Figure 5. Figures 6 and 7 show the comparison with the observations: Figure 6 shows (from left to right) the ALMA observations (continuum or line integrated map), synthetic observations and residual images (computed in the -plane); Figure 7 shows the radial intensity profiles along the disk major and minor axes. In order to asses the quality of the fit, Figure 11 shows the radial profile differences for a subset of the model grid.
Dust surface density: the fiducial model reproduces well the dust continuum image, with an inner dust cavity of au, an inner ring between au, a gap between au and an outer ring between au. The cavity and the gap are empty of millimetre-sized dust particles down to the noise level; there is an upper limit to the dust mass of M⊕ and M⊕ in the cavity and gap, respectively. The inner ring is decreased by a factor of (=) (Figure 3). The total dust mass is M⊙. The cavity and the gap are also free of micron-sized dust particles as suggested by the NACO polarimetric observations (Figure 4).
Gas in inner disk: our analysis confirms the presence of gas inside the dust gap (i.e., 35 au 56 au) and inside the dust cavity ( au) down to an inner radius of au. The gas surface density inward of the dust gap is decreased by a factor of 30 – 40 (=). Interestingly we find that .
Gas in the outer disk: the gas surface density extends well beyond the dust outer radius. The fiducial model follows closely the slope of radial profile of the three CO isotopologues in the outer disk. The outer gas radius of 180 au is set by the steep drop of the C18O emission at large radii. Adopting a larger outer gas radius would overestimate the C18O emission in the outer disk, leaving almost unchanged the profiles of 12CO and C13O. The total gas mass is M⊙ for the adopted standard carbon abundance of [C]/[H]=. While the fiducial model reproduces reasonably well the intensity profiles, the absolute flux of the 13CO emission is slightly underestimated. The difference in absolute flux is of the order of .
6 Discussion
The radial distribution of the (optically thin) 1.3 mm emission showing two deep gaps is qualitatively consistent with the presence of multiple planets shaping the dust distribution. Pinilla et al. (2015) performed two dimensional hydrodynamical simulations coupled with a dust evolution model of a disk hosting two giant planets showing that planets can produce multiple dust traps. These simulations show that the formation of dust traps is due to a combination of three main parameters: planetary mass, disk viscosity and dust fragmentation velocity. In particular, the trap is easily formed for a high planetary mass and/or a low disk viscosity. In the case of HD 169142, the lack of dust continuum emission inside the dust cavity (au) and in the outer gap (35 au 56 au) suggests very efficient dust trapping by means of two giant planets.
Azimuthal asymmetries are sometimes observed in the dust continuum emission of Herbig AeBe systems as in the case of HD 142527 (Casassus et al., 2012; Fukagawa et al., 2013) and IRS 48 (van der Marel et al., 2013). Such an asymmetry is thought to be due to dynamical interaction between the disk and a massive planet generating a vortex where dust particles are trapped (Rossby instability, de Val-Borro et al., 2007; Lyra et al., 2009). The lack of such an asymmetry in the two dust rings of HD 169142 implies an upper limit to the mass of the two planets of MJupiter.
The density drop of gas inward of the dust gap requires a rather massive planet with MMJupiter for the outer planet. For lower planetary mass indeed the cavity is “porous” and gas from the outer disk could flow inwards filling the gap (e.g., Lubow & D’Angelo, 2006; Alexander & Armitage, 2009). This is consistent with the prescriptions of Rosotti et al. (2016) which predict a mass of MJupiter (based on the size of the dust gap).
In the case of the inner dust cavity, the ALMA CO maps show no further drop of the gas density, suggesting inward gas flow. This poses a further limit to the planetary mass inside the inner dust cavity of M MJupiter.
Thus, based on the lack of azimuthal asymmetric features and on the drop of the gas surface density, the ALMA data presented here are consistent with the presence of two giant planets of MMJupiter and MMJupiter for the inner and outer planet, respectively.
The ALMA 1.3 mm continuum image confirms the presence of a real dust gap (i.e., depletion of dust particles) between au. This gap was previously detected via near-infrared polarimetric imaging but only thanks to ALMA it is possible to determine the density drop. The dust gap is likely the outcome of dynamical interaction between the disk and a second, unseen, planet as noted above. Moreover, while the dust continuum emission is confined within a radius of 83 au, with a sharp decay, the gas emission extends up to 180 au radius as can be seen in Figures 2 and 3. This dichotomy is also observed in other systems seen at high angular resolution such as LkCa 15 (Isella et al., 2012), HD 163296 (de Gregorio-Monsalvo et al., 2013), HD 100546 (Walsh et al., 2014), HD 97048 (Walsh et al., 2016; van der Plas et al., 2017). The smaller size of the dust disk compared to the gas is primarily due to an optical depth effect (e.g., Dutrey et al., 1996), but the sharp drop of the dust emission however hints at the radial drift of the dust particles (Weidenschilling, 1977; Birnstiel & Andrews, 2014) with the grains trapped at local pressure maxima induced by the planet-disk interaction. The similarity of the radial intensity profile of the H-band scattered light and of the 12CO emission is indicative of dynamical and thermal coupling of the small dust grains with the gas in outermost layers the disk.
An alternative scenario that could also explain the surface density profile of HD 169142 is the case of magneto-rotational (MRI) instability creating dead-zones (e.g., Regály et al., 2012; Flock et al., 2015; Hasegawa & Takeuchi, 2015). While a dead-zone itself results in a pressure bump with a gas density contrast of only a few, the combination with a mass loss mechanism can make this region largely devoid of gas by an amount similar to that observed in HD 169142. This process was investigated, e.g., by Morishima (2012) in the case of MRI instability combined with photoevaporation and by Pinilla et al. (2016) including magnetohydrodynamics (MHD) wind (and dust evolution).
Other protoplanetary systems around Herbig AeBe stars show similar multiple-ring dust distribution structures such as HD 100546 (Walsh et al., 2014), HD 97048 (Walsh et al., 2016) and HD 163296 (Isella et al., 2016). Also in these two cases, the ALMA observations suggest the existence of multiple planets which are responsible for the dynamical clearing of the disk. The emerging picture is that these Herbig AeBe protoplanetary disks are in an late evolutionary phase where planets have already formed at large distances from the star. Future ALMA observations will tell us whether this is true for the entire class of Herbig AeBe systems.
| Parameter | Value | Description | |
| fixed | |||
| [] | 1.65⋄⋄footnotemark: ⋄ | stellar mass | |
| Teff [K] | 8400‡‡footnotemark: ‡ | stellar temperature | |
| [] | 10††footnotemark: † | stellar luminosity | |
| d [pc] | 117††footnotemark: † | stellar distance | |
| [∘] | 13⋆,†⋆,†footnotemark: ⋆,† | disk inclination | |
| PA [∘] | 5⋆,†⋆,†footnotemark: ⋆,† | disk position angle | |
| , flarge | 0.2††footnotemark: † | settling parameters | |
| range / step | best fit | ||
| 0.0 – 0.2 / 0.05 | 0.0 | degree of flaring | |
| 0 – 2 / 0.5 | 1.0 | power-law exponent | |
| 0.05 – 0.09 / 0.01 | 0.07 | scale height at | |
| [au] | 50 – 200 / 50 | 100 | critical radius |
| 50 – 100 / 10 | 80 | gas-to-dust mass ratio | |
| [g cm-2] | 5 – 8 / 0.5 | 6.5 | at |
| [au] | 11 – 15 / 1 | 13 | gas inner radius |
| [au] | 18 – 22 / 1 | 20 | dust inner radius |
| [au] | 32 – 36 / 1 | 35 | dust cavity inner radius |
| [au] | 52 – 60 / 2 | 56 | dust outer radius |
| [au] | 170 – 210 / 10 | 180 | gas outer radius |
| [au] | 81 – 91 / 2 | 83 | dust outer radius |
| 0.25 – 0.35 / 0.02 | 0.27 | dust depletion for | |
| 0.01 – 0.05 / 0.005 | 0.025 | gas depletion for | |
| 0.01 – 0.05 / 0.005 | 0.025 | gas depletion for | |
7 Conclusions
From the analysis of the ALMA observations presented in this paper we conclude that gas and dust in HD 169142 are physically decoupled with the dust particles concentrated in two rings between au and au. Thanks to ALMA, we have, for the first time, strong constraints on the distribution and dynamics of bulk of the dust and gas. We find a real dust depletion (i.e., absence of dust particles) inside the cavity (au) and the gap ( au). The dust cavity and gap are filled in with gas as suggested by the emission maps of the three CO isotopologues, with the gas surface density reduced by a factor of for au. The sharp edge of the continuum map at 83 au is indicative of radial drift of dust grains (dust outer radius gas outer radius).
Among the various theories proposed to explain the opening of gaps in disks (e.g., dynamical interaction with planets, MRI, dust sintering and photoevaporation), the most likely scenario for HD 169142 is the presence of multiple giant planets (MJupiter) carving out the disk and giving rise to the cavity and the gap and trapping the dust particles beyond the planetary orbits. The combined effect of MRI instability (forming dead-zones) and MHD wind could also give rise to the rings and gaps structure in both gas and dust although with different characteristics that could be tested by future higher S/N and higher angular resolution data.
We stress the importance of spatially resolved observations of multiple CO isotopologues transitions: thanks to the different optical depths, the spatially resolved channel maps of the three isotopologues allows us to detect and quantify the very small amount (MJupiter) of gas inside the dust gap. This demonstrates the potential of CO isotopologues observations in probing the gas surface density and the evolutionary phase of protoplanetary systems.
Acknowledgements.
This paper makes use of the following ALMA data: ADSJAO.ALMA2013.1.00592.S. ALMA is a partnership of ESO (representing its member states), NSF (USA) and NINS (Japan), together with NRC (Canada), NSC and ASIAA (Taiwan), and KASI (Republic of Korea), in cooperation with the Republic of Chile. The Joint ALMA Observatory is operated by ESO, AUINRAO and NAOJ. This work has made use of data from the European Space Agency (ESA) mission Gaia (http://www.cosmos.esa.int/gaia), processed by the Gaia Data Processing and Analysis Consortium (DPAC, http://www.cosmos.esa.int/web/gaia/dpac/consortium). Funding for the DPAC has been provided by national institutions, in particular the institutions participating in the Gaia Multilateral Agreement. DF acknowledges support from the Italian Ministry of Education, Universities and Research, project SIR (RBSI14ZRHR). MC and MRH are supported by a TOP grant from the Netherlands Organisation for Scientific Research (NWO, 614.001.352). CW acknowledges financial support from the Netherlands Organisation for Scientific Research (NWO, grant 639.041.335) and start-up funds from the University of Leeds, UK. The authors thank M. Tazzari, S. Facchini, G. Rosotti, L. Testi and P. Pinilla for useful discussions and S. Quanz for providing the NaCo image.References
- Alexander & Armitage (2009) Alexander, R. D. & Armitage, P. J. 2009, ApJ, 704, 989
- ALMA Partnership et al. (2015) ALMA Partnership, Brogan, C. L., Pérez, L. M., et al. 2015, ApJ, 808, L3
- Andrews et al. (2011) Andrews, S. M., Wilner, D. J., Espaillat, C., et al. 2011, ApJ, 732, 42
- Andrews et al. (2016) Andrews, S. M., Wilner, D. J., Zhu, Z., et al. 2016, ApJ, 820, L40
- Beckwith et al. (1990) Beckwith, S. V. W., Sargent, A. I., Chini, R. S., & Guesten, R. 1990, AJ, 99, 924
- Biller et al. (2014) Biller, B. A., Males, J., Rodigas, T., et al. 2014, ApJ, 792, L22
- Birnstiel & Andrews (2014) Birnstiel, T. & Andrews, S. M. 2014, ApJ, 780, 153
- Blondel & Djie (2006) Blondel, P. F. C. & Djie, H. R. E. T. A. 2006, A&A, 456, 1045
- Briggs (1995) Briggs, D.S.. 1995, Ph.D. thesis, The New Mexico Institute of Mining and Technology, Socorro, New Mexico, USA
- Bruderer (2013) Bruderer, S. 2013, A&A, 559, A46
- Bruderer et al. (2012) Bruderer, S., van Dishoeck, E. F., Doty, S. D., & Herczeg, G. J. 2012, A&A, 541, A91
- Casassus et al. (2012) Casassus, S., Perez M., S., Jordán, A., et al. 2012, ApJ, 754, L31
- D’Alessio et al. (2006) D’Alessio, P., Calvet, N., Hartmann, L., Franco-Hernández, R., & Servín, H. 2006, ApJ, 638, 314
- de Gregorio-Monsalvo et al. (2013) de Gregorio-Monsalvo, I., Ménard, F., Dent, W., et al. 2013, A&A, 557, A133
- de Val-Borro et al. (2007) de Val-Borro, M., Artymowicz, P., D’Angelo, G., & Peplinski, A. 2007, A&A, 471, 1043
- de Zeeuw et al. (1999) de Zeeuw, P. T., Hoogerwerf, R., de Bruijne, J. H. J., Brown, A. G. A., & Blaauw, A. 1999, AJ, 117, 354
- Dunkin et al. (1997) Dunkin, S. K., Barlow, M. J., & Ryan, S. G. 1997, MNRAS, 286, 604
- Dutrey et al. (1996) Dutrey, A., Guilloteau, S., Duvert, G., et al. 1996, A&A, 309, 493
- Ercolano et al. (2017) Ercolano, B., Rosotti, G. P., Picogna, G., & Testi, L. 2017, MNRAS, 464, L95
- Fedele et al. (2013) Fedele, D., Bruderer, S., van Dishoeck, E. F., et al. 2013, A&A, 559, A77
- Flock et al. (2015) Flock, M., Ruge, J. P., Dzyurkevich, N., et al. 2015, A&A, 574, A68
- Fukagawa et al. (2010) Fukagawa, M., Tamura, M., Itoh, Y., et al. 2010, PASJ, 62, 347
- Fukagawa et al. (2013) Fukagawa, M., Tsukagoshi, T., Momose, M., et al. 2013, PASJ, 65, L14
- Gaia Collaboration et al. (2016) Gaia Collaboration, Brown, A. G. A., Vallenari, A., et al. 2016, A&A, 595, A2
- Grady et al. (2007) Grady, C. A., Schneider, G., Hamaguchi, K., et al. 2007, ApJ, 665, 1391
- Hasegawa & Takeuchi (2015) Hasegawa, Y. & Takeuchi, T. 2015, ApJ, 815, 99
- Honda et al. (2012) Honda, M., Maaskant, K., Okamoto, Y. K., et al. 2012, ApJ, 752, 143
- Isella et al. (2016) Isella, A., Guidi, G., Testi, L., et al. 2016, Physical Review Letters, 117, 251101
- Isella et al. (2012) Isella, A., Pérez, L. M., & Carpenter, J. M. 2012, ApJ, 747, 136
- Lubow & D’Angelo (2006) Lubow, S. H. & D’Angelo, G. 2006, ApJ, 641, 526
- Lyra et al. (2009) Lyra, W., Johansen, A., Klahr, H., & Piskunov, N. 2009, A&A, 493, 1125
- Malfait et al. (1998) Malfait, K., Bogaert, E., & Waelkens, C. 1998, A&A, 331, 211
- McMullin et al. (2007) McMullin, J. P., Waters, B., Schiebel, D., Young, W., & Golap, K. 2007, in Astronomical Society of the Pacific Conference Series, Vol. 376, Astronomical Data Analysis Software and Systems XVI, ed. R. A. Shaw, F. Hill, & D. J. Bell, 127
- Meeus et al. (2010) Meeus, G., Pinte, C., Woitke, P., et al. 2010, A&A, 518, L124
- Miotello et al. (2014) Miotello, A., Bruderer, S., & van Dishoeck, E. F. 2014, A&A, 572, A96
- Momose et al. (2015) Momose, M., Morita, A., Fukagawa, M., et al. 2015, PASJ, 67, 83
- Morishima (2012) Morishima, R. 2012, MNRAS, 420, 2851
- Okuzumi et al. (2016) Okuzumi, S., Momose, M., Sirono, S.-i., Kobayashi, H., & Tanaka, H. 2016, ApJ, 821, 82
- Osorio et al. (2014) Osorio, M., Anglada, G., Carrasco-González, C., et al. 2014, ApJ, 791, L36
- Panić et al. (2008) Panić, O., Hogerheijde, M. R., Wilner, D., & Qi, C. 2008, A&A, 491, 219
- Papaloizou & Lin (1984) Papaloizou, J. & Lin, D. N. C. 1984, ApJ, 285, 818
- Pascual et al. (2016) Pascual, N., Montesinos, B., Meeus, G., et al. 2016, A&A, 586, A6
- Pinilla et al. (2015) Pinilla, P., de Juan Ovelar, M., Ataiee, S., et al. 2015, A&A, 573, A9
- Pinilla et al. (2016) Pinilla, P., Flock, M., Ovelar, M. d. J., & Birnstiel, T. 2016, A&A, 596, A81
- Pinte et al. (2010) Pinte, C., Woitke, P., Ménard, F., et al. 2010, A&A, 518, L126
- Quanz et al. (2013) Quanz, S. P., Avenhaus, H., Buenzli, E., et al. 2013, ApJ, 766, L2
- Raman et al. (2006) Raman, A., Lisanti, M., Wilner, D. J., Qi, C., & Hogerheijde, M. 2006, AJ, 131, 2290
- Regály et al. (2012) Regály, Z., Juhász, A., Sándor, Z., & Dullemond, C. P. 2012, MNRAS, 419, 1701
- Reggiani et al. (2014) Reggiani, M., Quanz, S. P., Meyer, M. R., et al. 2014, ApJ, 792, L23
- Roccatagliata et al. (2009) Roccatagliata, V., Henning, T., Wolf, S., et al. 2009, A&A, 497, 409
- Rosotti et al. (2016) Rosotti, G. P., Juhasz, A., Booth, R. A., & Clarke, C. J. 2016, MNRAS, 459, 2790
- Sandell et al. (2011) Sandell, G., Weintraub, D. A., & Hamidouche, M. 2011, ApJ, 727, 26
- The et al. (1994) The, P. S., de Winter, D., & Perez, M. R. 1994, A&AS, 104, 315
- van der Marel et al. (2016) van der Marel, N., van Dishoeck, E. F., Bruderer, S., et al. 2016, A&A, 585, A58
- van der Marel et al. (2013) van der Marel, N., van Dishoeck, E. F., Bruderer, S., et al. 2013, Science, 340, 1199
- van der Plas et al. (2017) van der Plas, G., Wright, C. M., Ménard, F., et al. 2017, A&A, 597, A32
- Wagner et al. (2015) Wagner, K. R., Sitko, M. L., Grady, C. A., et al. 2015, ApJ, 798, 94
- Walsh et al. (2016) Walsh, C., Juhász, A., Meeus, G., et al. 2016, ApJ, 831, 200
- Walsh et al. (2014) Walsh, C., Juhász, A., Pinilla, P., et al. 2014, ApJ, 791, L6
- Weidenschilling (1977) Weidenschilling, S. J. 1977, MNRAS, 180, 57
- Zhang et al. (2015) Zhang, K., Blake, G. A., & Bergin, E. A. 2015, ApJ, 806, L7
Appendix A Channel maps
The individual channel maps of 12CO, 13CO and C18O are shown in Figures 8, 9 and 10, respectively. The velocity scale is defined in the local standard of rest (LSR) system. In all cases, the maps are created using natural weighting and the velocity resolution is resampled to 0.160 km s-1(12CO) and 0.168 km s-1(13CO and C18O) with Hanning smoothing. The disk emission is detected from km s-1to km s-1and the systemic velocity is km s-1.
Appendix B Model grid
Figure 11 shows the results of the model grid (sed. 5.3) where we vary one parameter at a time. Only a subset of the model grid is shown here. Note in particular, how the 12CO radial profile is very sensitive to (the inner gas radius) while the inner dust radius () affects not only the continuum radial profile but also the strength of the 13CO and C18O emission in the inner disk.
