Tel.: +49-30-20934228
22email: frank.havemann@ibi.hu-berlin.de 33institutetext: Jochen Gläser 44institutetext: Center for Technology and Society, TU Berlin (Germany)
Memetic search for overlapping topics
based on a local evaluation of link communities
Abstract
In spite of recent advances in field delineation methods, bibliometricians still don’t know the extent to which their topic detection algorithms reconstruct ‘ground truths’, i.e. thematic structures in the scientific literature. In this paper, we demonstrate a new approach to the delineation of thematic structures that attempts to match the algorithm to theoretically derived and empirically observed properties all thematic structures have in common. We cluster citation links rather than publication nodes, use predominantly local information and search for communities of links starting from seed subgraphs in order to allow for pervasive overlaps of topics. We evaluate sets of links with a new cost function and assume that local minima in the cost landscape correspond to link communities. Because this cost landscape has many local minima we define a valid community as the community with the lowest minimum within a certain range. Since finding all valid communities is impossible for large networks, we designed a memetic algorithm that combines probabilistic evolutionary strategies with deterministic local searches. We apply our approach to a network of about 15,000 Astronomy & Astrophysics papers published 2010 and their cited sources, and to a network of about 100,000 Astronomy & Astrophysics papers (published 2003–2010) which are linked through direct citations.
Keywords:
citation networks overlapping topics memetic algorithm link clustering astrophysics1 Introduction
The identification of thematic structures (topics or fields) in sets of papers is one of the recurrent problems of bibliometrics. It was deemed one of the challenges of bibliometrics by van Raan (1996) and is still considered as such despite the significant progress and a plethora of methods available. Major developments since van Raan’s paper include approaches that cluster the whole Web of Science based on journal-to-journal citations Leydesdorff (2004); Leydesdorff and Rafols (2009, 2012), co-citations, or direct citations Boyack et al. (2005); Boyack and Klavans (2010); Klavans and Boyack (2011); Waltman and van Eck (2012), the advance of hybrid approaches that combine citation-based and term-based techniques Glenisson et al. (2005); Glänzel and Thijs (2015), and term-based probabilistic methods (topic modelling, cf. \citeNPyau_clustering_2014). However, in spite of all the methodological progress we still don’t know whether the groups of papers found by these methods represent the knowledge structures they are intended to identify. It is still not clear which, if any, ‘ground truth’ about the set of papers is reflected by the groups of papers.
This uncertainty also applies to community detection, which represents one group of methods that can be used for the reconstruction of thematic structures in sets of papers. The recent discussion about the ability of community detection algorithms to reconstruct ground truths that are reflected in metadata Hric et al. (2014); Peel et al. (2016) illustrates the point. Metadata are likely to reflect the various ground truths differently. Peel et al. identified several reasons why the division of a network might not correlate with metadata (p. 2), and stated further that a network “can result from multiple, distinct generative processes, each with its own ground truth” (p. 3). Applied to the reconstruction of thematic structures from networks of papers, this means that although we know the metadata about papers and the links in a network to be related to the ground truths we intend to reconstruct, it is still difficult to tell which of these ground truths (thematic structures), if any, a community detection algorithm reconstructs.
In this paper, we propose a new approach to this problem. We attempt to increase the likelihood that relevant thematic structures are reconstructed from the network of papers by using an algorithm that fits structural properties all the ground truths we are interested in have in common. We start from a theoretical discussion of thematic structures in science and derive principles of clustering from theoretically deduced and empirically observed properties of topics. Applying these principles, we cluster citation links rather than publication nodes, use predominantly local information, and search for communities of links starting from seed subgraphs in order to allow for pervasive overlaps of topics.
We evaluate sets of links with a new cost function and assume that local minima in the cost landscape correspond to link communities. Since identifying all these communities in a large network is impossible in reasonable periods, we apply a memetic algorithm that combines nondeterministic evolutionary strategies with deterministic local searches in a cost (or fitness) landscape Neri et al. (2012). We demonstrate and test our approach by applying it to two networks. The first network consists of about 15,000 Astronomy & Astrophysics papers (published 2010) and their cited sources (see \citeNPHaveman2015ISSI for preliminary results). The second network consists of about 100,000 Astronomy & Astrophysics papers (published 2003–2010) which are linked through direct citations.
2 Theoretical considerations
We start from the sociological insight that topics are actively constructed by researchers in their joint production of scientific knowledge. We define a topic as a focus on theoretical, methodological or empirical knowledge that is shared by a number of researchers and thereby provides these researchers with a joint frame of reference for the formulation of problems, the selection of methods or objects, the organisation of empirical data, or the interpretation of data (on the social ordering of research by knowledge see \citeNPglaser_wissenschaftliche_2006). This definition resonates with \citeANPwhitley1974cognitive’s 1974 description of research areas but abandons the assumption that topics form a hierarchy. The only demand the definition makes is that some scientific knowledge is perceived similarly by researchers and influences their decisions.
From the definition follows that there is no structural or functional difference between a topic and a field, as was suggested by sociologists who considered the hierarchical order of thematic and social structures, e.g. Whitley (1974) and Chubin (1976). We consider both topics and fields as shared perspectives on knowledge.
All topics and fields emerge from coinciding autonomous interpretations and uses of knowledge by researchers (see e.g. the case studies of emerging topics/fields discussed by \citeNPedge1976astronomy, pp. 350–402). While individual researchers may launch topics and advocate them, the latter’s content and fate depend on the ways in which they are used by others.
This constructivist approach explains three properties of topics that have consequences for bibliometric methods:
-
1.
Topics are local in the sense that they are primarily topics to the researchers whose decisions are influenced by and who contribute to them. Methods for topic identification using only local information reconstruct this insider perspective, while methods using also global information construct a compromise between insider and outsider perspectives on topics.
-
2.
Topics can have any ‘size’ (however measured) between the smallest topics (that just concern very few researchers) and very large thematic structures (fields or even themes cutting across several fields). This fractal nature of knowledge has been described by van Raan (1991) and Katz (1999). Methods aimed at recovering this structure should not be biased against any particular topic size.
-
3.
Given the multiple objects of knowledge that can serve as common reference for researchers, topics inevitably overlap. Publications commonly contain several knowledge claims, which are likely to address different topics Cozzens (1985); Amsterdamska and Leydesdorff (1989). Adjusting to this property of topics means taking into account that bibliometric objects like terms, publications, authors, journals, and citation links are likely to belong to several topics simultaneously. Consequently, the reconstruction of overlapping topics in publication networks requires that subgraphs may overlap pervasively, i.e. not only in their boundaries.
The local construction of topics, their varying size and pervasive overlaps make it likely that topics form a poly-hierarchy i.e. a hierarchy where a smaller topic can be a subtopic of two or more larger topics that have no hierarchical subtopic relation (see (Healey et al., 1986, 239–241) for the observation of a poly-hierarchy of topics based on keywords).
An attempt to reconstruct topics with the above-described properties needs to apply four principles. First, clustering should be based on the least heterogeneous property of a paper available to bibliometrics, namely the link between a publication and its cited source. A citation often links a paper to one specific knowledge claim made in the cited source. Although a publication may be cited in a paper without reference to a specific knowledge claim, or may be cited several times for the use of different knowledge claims, links to cited sources are likely to reflect only one topic in most cases.111The same argument can be made for a term used in one paper. Exploiting this property alone and in combination with links to cited sources is a task for future work. Second, clustering should utilise mainly local information when the ‘producer perspective’ on topics is to be reconstructed. Third, an algorithm should enable pervasive overlaps of subgraphs in order to reconstruct overlapping thematic structures. Fourth, an algorithm should not be biased against any particular topic size.
The construction of overlapping communities is by now a well-known and frequently addressed problem of network analysis Fortunato (2010); Xie et al. (2013); Amelio and Pizzuti (2014). Constructing overlapping communities of nodes by clustering links has been proposed by Evans and Lambiotte (2009) and by Ahn et al. (2010). The use of local rather than global information to reconstruct community structures of networks is also well established Clauset (2005); Lancichinetti et al. (2009); Havemann et al. (2011); Zhang et al. (2015). However, as reviews of algorithms indicate Fortunato (2010); Xie et al. (2013); Amelio and Pizzuti (2014), link clustering, the use of local information and the construction of pervasively overlapping communities have not yet been applied together, possibly because the task for which this is necessary has not yet arisen.
3 Method
We operationalise ‘topic’ as a community in a citation network of papers, i.e. as a cohesive subgraph that is well separated from the rest of the network (Fortunato, 2010, p. 83). Hierarchical and poly-hierarchical organisation inevitably reduce cohesion because larger communities include boundaries between well separated sub-communities.
From the theoretical considerations follows that links rather than nodes should be clustered for the reconstruction of topics. A link community can be defined as a set of links that is well separated from the rest of the graph and also relatively well connected internally. The boundary of a community of links consists of nodes that have links which belong to the community and links that do not belong. This makes it possible to determine the degree to which a paper addresses a topic by calculating the proportion of its citation links belonging to the respective link community.
Although a citation link is directed—the citing and cited paper cannot be interchanged—we can treat citation links as undirected because for the clustering only the content of the link matters. This content is jointly defined by the citing and the cited paper.
We now describe the local cost function for the evaluation of subgraphs (and the identification of link communities), the memetic algorithm in which the cost function is applied, and the experimental setup in which the algorithm was applied.
3.1 Cost function for evaluation of link sets
Link clustering has been introduced by Evans and Lambiotte (2009) and Ahn et al. (2010). Following a suggestion by Evans and Lambiotte (2009) we introduce a local cost function of link set which is based on external and also on internal connectivity of and includes a size normalisation that accounts for the finite size of the network.
Each link set defines a subgraph of the network. The subgraph’s node set contains all nodes attached to links in . In this sense we use the term subgraph also for a link set .
The internal degree of node is defined as the number of links in attached to . Its external degree is the number of its other links and is obtained by subtracting its internal from its total degree: . External degrees are weighted with the subgraph membership-grade of boundary node to obtain a measure of external connectivity of link set :
| (1) |
where is the number of all nodes.222The sum runs through all nodes but only boundary nodes of contribute to it because for inner nodes of we have and for nodes not attached to links in we have . Each term in the sum equals the electrical conductance between external and internal nodes connected through node if we identify the links with electrical resistors of conductance equal to 1.333Applying Kirchhoff’s laws we obtain total resistance of all links of node as . Alternatively, external connectivity can be justified by translating external connectivity in the properly weighted line graph of the network into terms of the original network Havemann et al. (2015a).
A simple size normalisation that accounts for the finite size of the network is achieved by adapting the normalised cut—suggested by Shi and Malik (2000) for node communities—to link communities, which leads us to the cost function normalised node-cut :
| (2) |
where is the number of all links and is the sum of all internal degrees —cf. \shortciteN[p. 4]havemann_detecting_2015. is a non-negative function with a maximum value of one.
We construct a cost landscape where each place corresponds to a link set . A place’s height is given by cost . Its neighbouring places can be reached by adding a link to or by removing a link from . A local minimum in the cost landscape corresponds to a link set with smaller than -values of all link sets surrounding in the cost landscape. Thus, it corresponds to a well separated link set—compared to its surrounding link sets. This is why we can define link communities as link sets corresponding to local minima of function . In accordance with our understanding of communities as cohesive subgraphs (see above, p. 3), we also require that link communities must be connected link sets (Havemann et al., 2015a, p. 5).
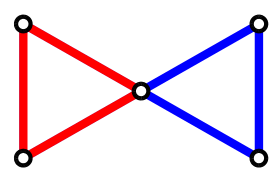
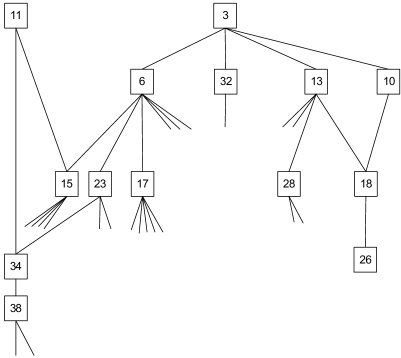
As a simple example, we determined the -landscape of the bow-tie graph (Figure 1).444cf. Evans and Lambiotte (2009) and for calculations see \shortciteN[Appendix]havemann_detecting_2015 We expect a cut through the central node to be the best division in two link communities (the two triangles). Indeed, the landscape has two minima with , which both correspond to a cut through the central node that partitions the graph in two triangles.555The central node is the boundary node for both triangles with equal internal and external degree of 2. This gives and . All other partitions cut through two nodes and have higher values of .
The evaluation function can be used to identify link communities by finding local minima in the cost landscape. Since the cost landscape is often very rough—has many local minima that sometimes correspond to very similar communities—it is reasonable to sharpen the criterion for a solution by widening the set of subgraphs we compare with each other. A community has a better -value than all its direct neighbours in the landscape but for a valid community we demand that it has to be better than all link sets in a wider environment. The size of this environment is determined by setting a minimum distance between a valid community and any link set with a lower -value but we must exclude unconnected link sets from the comparison.666We only compare connected link sets because for a community one can construct an unconnected link set with (which makes invalid) by adding a small link set to if is small enough and has no connection to . We therefore define the range of a community as the distance in the cost landscape to the nearest connected link set with a lower -value diminished by one. That means, is the radius of a community’s largest environment in the cost landscape in which no connected link set with lower cost exists.
With the notion of range we can define a community as valid if it has a range . Minimum range determines the resolution of the algorithm because any two valid communities differ by at least links. The algorithm’s resolution can be made size dependent by specifying it in relative terms, as we did in our experiments when setting a valid community’s minimum range at one third of its size:
Since we are ultimately interested in topics that are addressed by papers, we transform link communities into paper communities by assigning papers fully to a topic if all their citation links belong to the link community and assigning papers fractionally to a topic according to the proportion of their links that belongs to the link community.
3.2 Memetic algorithm for finding link communities in the cost landscape
The cost function is used in a clustering algorithm that looks for minima in the cost landscape starting from seed subgraphs of different sizes.
The task of finding communities in large networks is always very complex and requires the use of heuristics. We chose a memetic algorithm that combines non-deterministic evolution with a deterministic local search in the cost landscape Neri et al. (2012). In our algorithm, a population of communities is randomly initialised and evolves because the genetic operators of crossover, mutation, and selection are repeatedly applied. Since the non-deterministic operators do not necessarily lead to communities, each crossover and mutation is followed by a local search, which we call adaptation, cf. Algorithm 1. The genetic operators and local search procedures are described in Appendix A, p. A. The size of the population is kept constant.
Since the evolutions of community populations are independent from each other, the final communities obtained in different evolutions can overlap pervasively. An evolution ends if the -value of the best community does not improve anymore regardless of community size. By preventing a size bias of the algorithm and enabling pervasive overlaps, the independent construction of communities fulfils two more principles derived from our definition of a topic.
Evolutionary algorithms have already been used for identifying communities in networks (Fortunato, 2010, p. 106). Some authors have even applied evolutionary algorithms to link clustering but all used global evaluation functions Pizzuti (2009); Li et al. (2013); Shi et al. (2013). Memetic evolutionary algorithms have also been applied to reconstruct communities but only for node clustering and only with global evaluation functions Gong et al. (2011); Pizzuti (2012); Gach and Hao (2012); Ma et al. (2014).
3.3 Experimental setup
The overall procedure is described by Algorithm 2. We apply a node-wise local search inside the memetic algorithm and a link-wise local search at the end (s. Appendix A, p. A).
After the experiments were completed, we found that one sub-routine (the node-wise local-search within the memetic evolution) calculated the cost function incorrectly.777 Instead of the function defined in equation 2, the following function was implemented: . Since all other sub-routines using the cost function calculated it correctly, the error affected primarily the efficiency of the algorithm rather than the validity of its results. However, the bug created a tendency for the memetic search to overlook some local minima when analysing large sub-graphs. We therefore repeated the experiments for all seeds that did not lead to communities in the first two experiments and for several other large seeds. This re-run identified some further large valid communities. In other cases, the memetic algorithm only led to variants of communities found before, thereby confirming the limited impact of the bug.
Because the algorithm searches randomly, communities can be improved by any new experiments or new valid communities can be found. In this sense, for larger networks our algorithm never comes to a definite end.
The experimental setup includes setting a resolution parameter which determines a valid community’s minimum range according to We choose .
We also decided to consider communities of more than three quarters of all links as invalid because their range exceeds the whole network, and their validity cannot be determined.
Initialising populations from seed subgraphs:
Since topics vary in size the algorithm should start from differently sized seed subgraphs. Seed subgraphs should also be located in all regions of the network. Owing to the randomness of evolution the choice of seed graphs is unlikely to affect the results. However, it is likely to effect the efficiency of the algorithm. In our experiments, we applied two strategies for obtaining seeds. First, we used the citation links of randomly selected papers to induce seed subgraphs. Second, disjunct clusters constructed by applying two different hard clustering algorithms were used as seeds (see below, 5.1 and 5.2). Each seed was first adapted by a node-wise local search and then used to initialise the population of different communities by mutating the adapted seed.
Running the memetic algorithm:
Termination:
Due to the many local minima in the cost landscape and the random elements in our procedure, there is always the possibility that more and better valid communities exist. We therefore applied a pragmatic rule by terminating experiments when we did not find new valid communities that increase the coverage of the network (cf. Algorithm 2).
Final selection:
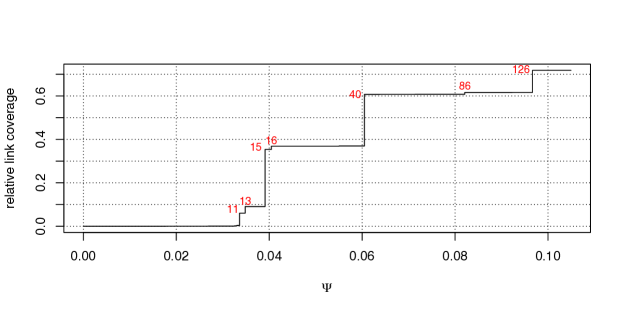
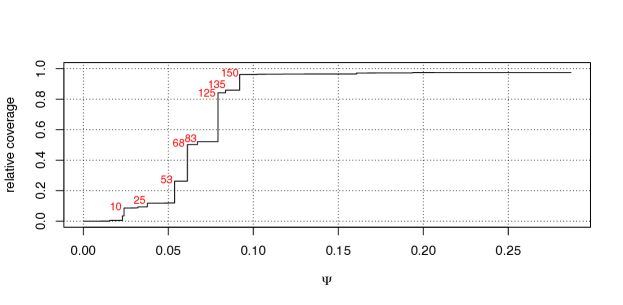
In our approach, a good community is a connected link set with a low value of cost function . Displaying coverage over can be used for selecting the final set of best communities (cf. Fig. 2 for an example). We calculate the coverage of the network by ranking communities according to and determining the percentage of all links in the network which are in the union of link sets up to the current -value. We use the lowest -value above which the coverage does not substantially increase as a cutoff point and disregard all valid communities with higher -values because they represent more weakly delineated topics. A specific investigation of thematic structures might require a different decision.
4 Data
We downloaded all articles, letters and proceedings papers from the Web of Science published 2003–2010 in journals listed in the category Astronomy & Astrophysics of the Journal Citation Reports of these years. Reference data had to be standardised with rule-based scripts. The algorithm was applied to two citation networks obtained from this dataset.
First, we analysed the citation network of 14,954 papers published 2010 and the sources cited in these papers. To reduce the complexity of the network, we omitted all sources that are cited only once because they do not link papers and their removal should not unduly influence clustering. We excluded 184 papers that are not linked to the giant component of the citation network and proceeded with a network of 119,954 nodes (14,770 papers and their cited sources) that are connected by 536,020 citation links. The network would be bipartite except for several direct citations between papers published 2010. The solution we found in this network is referred to as clustering .
Second, we analysed the network of all Astronomy & Astrophysics papers published 2003–2010 linked by direct citations. The giant component of this citation network contains 101,831 papers as nodes and 924,750 citation links between them. This network is the data model used by \shortciteNVelden2016Infomap and by \shortciteNvanEck2016citation in their studies published in this issue. The solution we found in this network is referred to as clustering .
For both networks, we neglected the direction of citation links and analysed an undirected unweighted connected graph. Neglecting the direction (and thus the time dimension) of citation directions is unproblematic if communities of thematically similar links are constructed because the theme of a link is determined jointly by the citing and the cited paper. Other approaches might have to consider the direction of citation links in the 2003–2010 direct-citation data-model because the nature of citation links shifts within the network. 2003 papers are almost exclusively linked to the network by being cited. For papers of subsequent years, the nature of links changes until the 2010 papers are linked almost exclusively by citing other papers.
5 Experiments and Results
5.1 The citation network of papers published in 2010 (clustering )

Seed graphs were obtained from Ward clustering the network’s nodes with a similarity measure derived from theoretical considerations Gläser et al. (2015). We ordered all Ward clusters by their stability (the length of their branch in the dendrogram) and selected 63 of the most stable clusters as seeds. In addition, we used the citation links of 969 randomly selected papers to induce small seed subgraphs.
Searches starting from these seeds resulted in a total of more than 2,600 valid communities including many small communities with relatively bad cost values (). Displaying link coverage over for the union of the best communities ranked with regard to according to Algorithm 2 we observe a sharp knee at 126 communities, with coverage equal to 71.8 % and cost below 0.0967 (Fig. 2). For this calculation, we have omitted the largest community with more than half of all links because including it would lead to a coverage of 100 % with only 15 communities, i.e. exclude most of the substructures we are interested in.
The largest community (the number is the size rank, size in terms of numbers of links) contains 394,924 links or 74 % of all links. It is the only one that is larger than half of the network. It contains 10,840 papers, 10,354 of which are full members with all their citation links in link set .
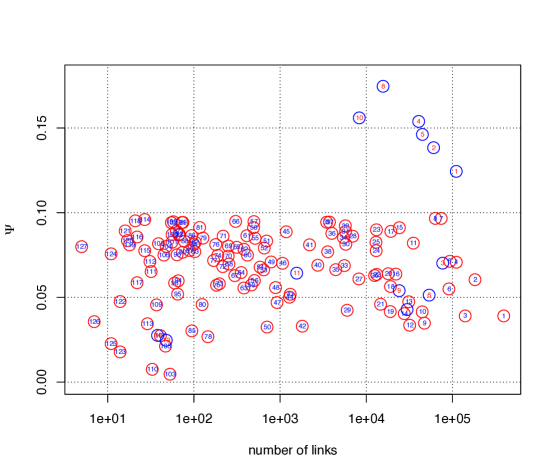
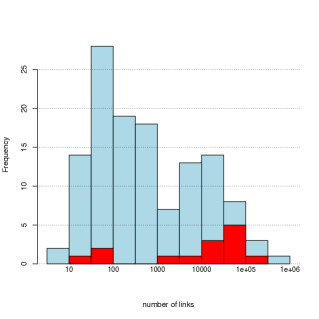
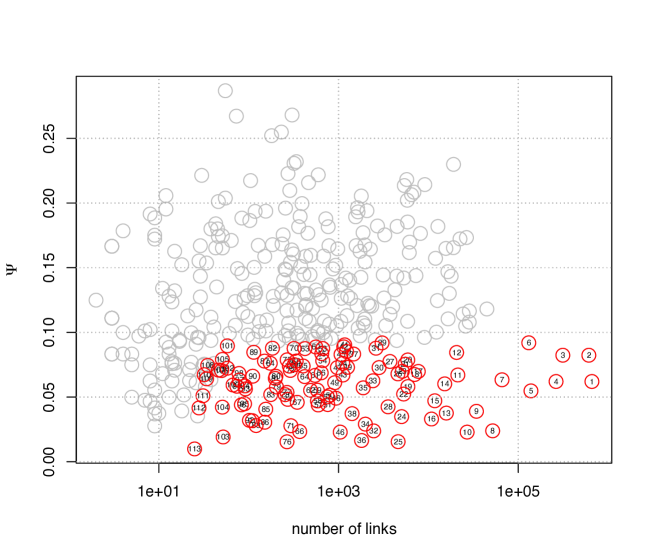
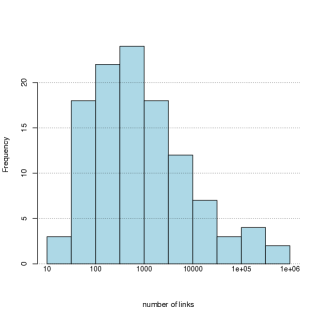
Fig. 3 displays cost over size (number of links ) for all 127 selected communities and the clusters obtained by Theresa Velden, who applied the Infomap algorithm (Velden et al., 2017, this issue) to our network. Fig. 4 displays size measured by sums of paper fractions and by link numbers for all 127 communities. Table 5 (s. Appendix, p. 5) lists number of links, cost, fractional score, and other characteristic data for the 50 largest communities.888See webpage http://researchdata.ibi.hu-berlin.de/comparison2010.htm for cluster description sheets. The whole clustering solution and more statistical data can be downloaded from http://researchdata.ibi.hu-berlin.de/Astronomy&Astrophysics/2010/.
5.2 The network of direct citations 2003–2010 (clustering )
We used clusters of papers obtained by (van Eck and Waltman, 2017, this issue) as seeds. We selected 469 clusters from three clusterings of this network at different levels of resolution. The smallest cluster contains 50 papers, the largest 20,209 papers.

For some seeds the algorithm had to be terminated prematurely because there were not enough mutants to initialize a population or because local searches led to subgraphs containing more than three quarters of all links. In these cases, the final link-wise search was applied to results of intermediate steps. We found 381 valid communities.
There are two valid communities with more than half of all links ( and , the number is the size rank, size measured with numbers of links). They are the main components of the link complements of and , respectively. To select the best communities with maximum coverage we rank all but the two largest valid communities according to their -values and successively unite them reaching a coverage of 97.5 % of all links (Fig. 5). Of the 379 remaining communities we selected those with because communities above this threshold improve relative coverage only by 1.3 %. Again, including the two largest communities would lead to the exclusion of interesting sub-structures.
The large number of very small communities in our sample required a decision on the minimum size from which a community should be considered a topic. We set this threshold at 20 (fractionally counted) papers over 8 years, which led to the exclusion of further 39 communities (cf. cost-size diagram in Fig. 7).999Coverage is decreased by this omission only by a negligible amount. In Fig. 7 size measured by sums of paper fractions and by link numbers is displayed for all 113 selected communities (see Fig. 4 for the distribution of community sizes of the 2010 network). A description of the 50 largest communities can be found in Table 6 in Appendix, p. 6.101010See webpage http://researchdata.ibi.hu-berlin.de/comparison.htm for cluster description sheets. The whole clustering solution and more statistical data can be downloaded from http://researchdata.ibi.hu-berlin.de/Astronomy&Astrophysics/2003-2010/.
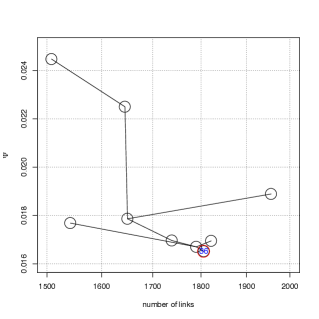
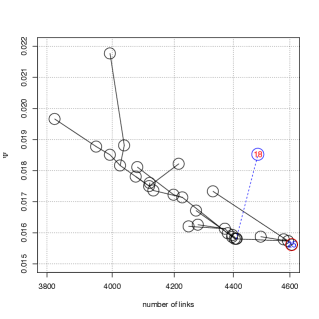
For several seeds memetic searches ended in the same sink of the cost landscape. The most attractive sink is that around community where 29 search paths ended (s. Fig. 8). One of the seed subgraphs—cluster of clustering solution (van Eck and Waltman, 2017, this issue)—is already located in this sink but was improved by memetic search. The paper-based Salton index of the pair – is 0.94.111111The Salton index measures similarity of two sets and is defined as the ratio of the size of their intersection and the geometric mean of their sizes. It is also called Salton’s cosine because it can be calculated as the cosine of the angle between two vectors characterising the sets. Their papers are about phenomena in the magnetosphere.121212cf. webpage http://researchdata.ibi.hu-berlin.de/comparison.htm with clusters and
6 Exploring the Cluster Solutions
In this section, we explore our two cluster solutions by discussing their correspondence (section 6.1) and by analysing the poly-hierarchies of both solutions (section 6.2). We debate possible reasons for unstructured regions (section 6.3) and compare the 2010 solution with a clustering of the same network obtained with another method (section 6.4).
As mentioned above, we refer to the 127 communities found in the citation network of 14,770 papers published 2010 in astrophysics journal as clustering and name the solution found in the network of 101,831 astrophysics papers 2003–2010 linked by direct citations clustering . The two networks share most of papers published 2010 and all papers cited in 2010 papers and published 2003–2009 in journals of the set considered. The network of direct citations between papers published 2003–2010 does not contain cited sources outside this paper set. It is more than two times denser than the 2010 network.
| size() | size() | Salton | overlap | overlap | |||
|---|---|---|---|---|---|---|---|
| rank | size() | in 2010 | index | in | in | ||
| 1 | 2 | 5932 | 4 | 4677 | 0.87 | 0.77 | 0.98 |
| 2 | 4 | 3583 | 4 | 4677 | 0.81 | 0.92 | 0.70 |
| 3 | 6 | 2737 | 5 | 2599 | 0.84 | 0.82 | 0.86 |
| 4 | 12 | 1352 | 8 | 1144 | 0.88 | 0.81 | 0.96 |
| 5 | 14 | 1275 | 9 | 1158 | 0.85 | 0.81 | 0.89 |
| 6 | 19 | 868 | 13 | 711 | 0.84 | 0.76 | 0.93 |
| 7 | 18 | 609 | 10 | 700 | 0.84 | 0.90 | 0.78 |
| 8 | 29 | 243 | 28 | 218 | 0.85 | 0.81 | 0.90 |
| 9 | 34 | 206 | 17 | 210 | 0.87 | 0.87 | 0.86 |
| 10 | 38 | 132 | 23 | 132 | 0.90 | 0.90 | 0.90 |
| 11 | 50 | 33 | 86 | 22 | 0.82 | 0.67 | 1.00 |
| 12 | 66 | 30 | 54 | 24 | 0.82 | 0.73 | 0.92 |
| 13 | 61 | 15 | 61 | 14 | 0.90 | 0.87 | 0.93 |
| 14 | 92 | 4 | 91 | 4 | 1.00 | 1.00 | 1.00 |
6.1 Correspondence of the two solutions
Despite the differences between the two networks, our two clustering solutions and have many – pairs of communities with a good match. We compared individual communities from both solutions by assigning as community members all papers that were published in 2010 and have membership grades larger than 0.5 in a community of clustering or , respectively. Among these, 14 – pairs of communities have a Salton index of 0.8 or higher (cf. Table 1). Among these 14 best matches there are pairs of very large communities. 11 of 14 best matching pairs show an overlap of at least 0.9, that means that at least 90 % of the smaller is covered by the larger community.
Due to the differences between the networks we cannot expect that all 113 -communities match one of the 127 -communities with high similarity. Some -communities have very few papers in 2010 (we have, e.g., 25 of them with less than five papers in 2010 and two without any 2010 paper). Others are not connected if we only consider their papers in 2010.131313We have put papers of each -community into the 2010-network and linked them via all their cited sources and calculated the sizes of their main components. To get an impression of matching, we have plotted similarity of -communities to best matched -communities over size of -communities. Bad matching is mainly occurring for small -communities which typically have large -partners.
6.2 Overlaps and poly-hierarchies
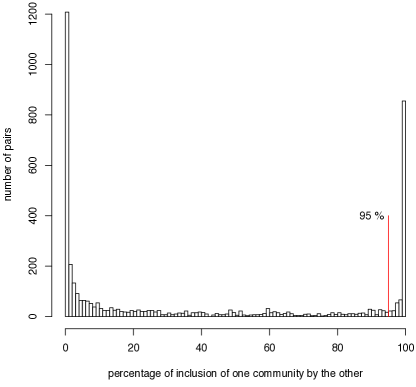
In both solutions there are many pairs of communities that overlap i.e. share links and nodes. Overlaps vary from very small to inclusion, i.e. communities being subgraphs of larger communities. In Fig. 9 we show the distribution of relative inclusion for pairs of overlapping communities in clustering . Relative inclusion is the percentage of links of one community which are also in the other community. The density function has a typical U-form with many pairs with small inclusion and many pairs with total or nearly total inclusion. Analysing hierarchical relations between link communities by comparing their link sets, we found that large communities have many subcommunities. All these subcommunities are small and are typically two orders of magnitude smaller than the large community. This picture changes substantially if we relax the subset relation and only demand that a subtopic community should share at least 95 % of its links with each of its supertopic communities. The threshold is derived from the distribution in Fig. 9. At 95 % the number of pairs begin to rise. In Tables 5 and 6 (Appendix C) we provide the numbers of subtopics, of supertopics, and of other communities which overlap for each community in the two solutions.
| keywords | |
|---|---|
| 2 | solar system, planets, solar physics, stellar structure, circumstellar matter, planetary atmospheres, extrasolar planets, asteroseismology, mars, solar wind; solar, planet, stars, sun, atmosphere, mars, period, earth, spacecraft, coronal |
| 3 | beyond the standard model, cosmic microwave background radiation, relativity, large scale structure of the universe, p branes, dark energy, general theory of relativity, quantum gravity, cosmological models, neutrino masses; scalar, scalar field, standard model, qcd, lhc, higgs, inflation, gravity, quark, quantum |
| 7 | neutron stars, astroparticle physics, gamma ray bursts, mars, pulsars, stellar phenomena, blazars, gravitational waves, x ray binary stars, binary systems; gamma ray, neutron star, mars, ray bursts, pulsar, grb, x ray, gravitational wave, high energy, swift |
| 11 | relativity, black holes, quantum gravity, beyond the standard model, p branes, gravitation, general theory of relativity, gravitational singularities, event horizons, hawking radiation; spacetime, black hole, quantum gravity, horizon, metric, gravity, solutions, schwarzschild, loop quantum, holographic |
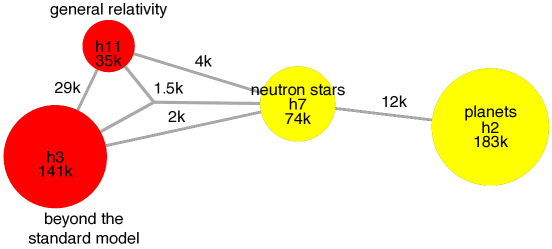
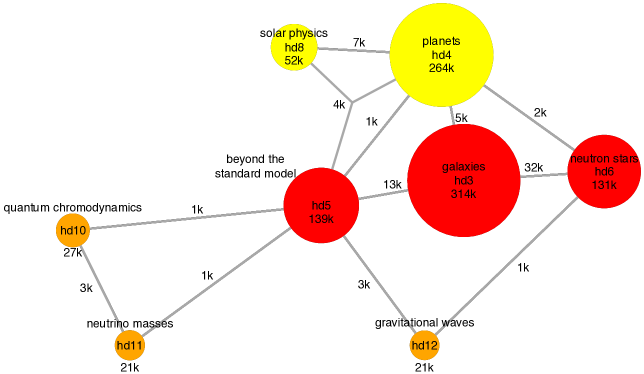
Communities at the highest levels of their poly-hierarchy and their overlap relationships are of interest when thematic structures within the paper sets are analysed. Solution has three communities without supertopic: , , and . Because large communities obscure relationships of subtopics we want to analyse, we excluded communities that are larger than half of the networks (, , and ) from the following analysis. Omitting , there are eight communities at the highest poly-hierarchy level of clustering . They cover 72 % of all links. Fig. 10 visualises the overlaps between the four largest of them and their relation to .141414There are also four small -communities which have only as their supertopic. Two of them have only papers in solid-state physics, the other two are overlapping with and . In Table 2 the terms describing the four communities are listed. The terms before semicolons were assigned to papers by Kevin Boyack by applying the Data Harmony’s Machine Aided Indexer (M.A.I.) on Unified Astronomy Thesaurus data (Velden et al., 2017, this issue).151515cf. also http://astrothesaurus.org/ and http://www.dataharmony.com/ The terms after the semicolons are extracted by Rob Koopman and Shenghui Wang from titles and abstracts. They than ranked both types of terms by calculating normalised mutual information (Koopman and Wang, 2017, this issue).
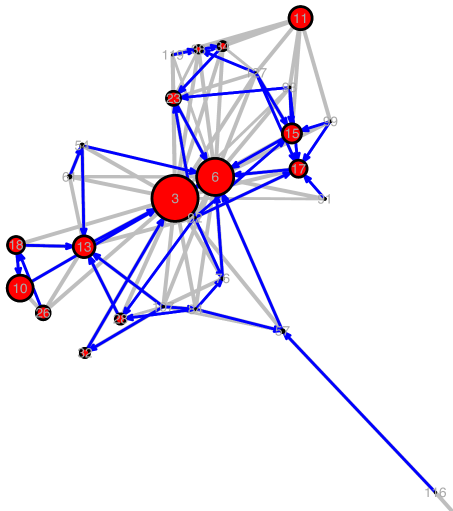
We define a direct supertopic of a topic as a supertopic that cannot be reached indirectly through a chain of supertopic-subtopic relations. In Fig. 12 we draw supertopic-subtopic relations as links and draw blue arrows for direct relations which end in the large community . Community , e.g., is a subtopic community of communities and . The existence of such relationships discriminates poly-hierarchies from normal strict hierarchies. The organisational chart (Fig. 12) shows several cases of communities being included (at the 95 % level) in more than one other community, which corresponds to subtopics with more than one supertopic. If we relax the subtopic-supertopic relationship by allowing up to 5 % of a subtopic’s links not being shared with its supertopic, than the resulting relaxed poly-hierarchy is not always transitive. The small community in the lower right of Fig. 12, for example, is related to via and (blue arrows) but not directly with a grey link.
| keywords | |
|---|---|
| 3 | galaxies, redshift, doppler shift, active galactic nuclei, quasars, galaxy clusters, milky way galaxy, star formation, galaxy groups, astronomical research; galaxies, redshift, active galactic, star formation, agn, galactic nuclei, sample, clusters, quasar, sloan digital |
| 4 | planets, solar system, circumstellar matter, planetary atmospheres, planetary system formation, natural satellites, mars, extrasolar planets, emission line objects, stars; star, planet, main sequence, mars, hd, atmosphere, jupiter, abundances, radial velocity, period |
| 5 | beyond the standard model, cosmic microwave background radiation, p branes, dark energy, relativity, cosmological models, radio astronomy, quantum gravity, general theory of relativity, gravitational singularities; scalar field, dark energy, inflation, cosmological constant, gravity, spacetime, microwave background, cosmic microwave, brane, universe |
| 6 | neutron stars, gamma ray bursts, pulsars, stellar phenomena, astroparticle physics, blazars, supernova remnants, x ray binary stars, accretion disks, magnetars; gamma ray, x ray, neutron star, ray bursts, grb, pulsar, high energy, jet, swift, bursts grbs |
| 8 | solar physics, stellar structure, coronal mass ejections, starspots, magnetic fields, sunspots, solar flares, asteroseismology, coronae, solar corona; solar, coronal mass, magnetic, active region, cme, sunspot, flare, mass ejections, solar activity, plasma |
| 10 | perturbation methods, light cones; qcd, quark, meson, lattice, decays, chiral, pi pi, gluon, pion, j psi |
| 11 | neutrino masses, beyond the standard model, supersymmetric standard model, supersymmetry, leptogenesis, technicolor, grand unified theory, extra dimensions, supernova neutrinos, baryogenesis; standard model, lhc, higgs, lepton, top quark, minimal supersymmetric, neutrino, hadron collider, supersymmetric standard, electroweak |
| 12 | gravitational waves, ligo, interferometers, astroparticle physics, relativity, general theory of relativity, binary stars, black holes, circular orbit, schwarzschild black holes; gravitational wave, lisa, wave detectors, post newtonian, inspiral, ligo, numerical relativity, waveforms, binary black, interferometric gravitational |
A specific property of the journal Physical Review D, in which 18 % of the articles in our dataset 2003–2010 are published (19 % in 2010), offers an opportunity to assess the performance of our algorithm. Issues of Phys. Rev. D are thematically separated. Only the issues with even numbers publish papers on astronomy and astrophysics, while issues with uneven numbers are devoted to particle physics (1175 papers in issues with uneven numbers in our dataset 2010).161616cf. Subject Areas on this webpage of Physical Review D: http://journals.aps.org/prd/authors/editorial-policies-practices Our algorithm reconstructed this distinction, as can be illustrated in Fig. 12. The papers in the five clusters , , , , and and their subclusters are dominated by particle-physics papers.171717E.g., 1050 of the 1175 particle-physics papers in Phys. Rev. D are among the 1272 full papers in . Quantum chromodynamics (QCD), quark, and meson are among the most frequent and distinguishing terms obtained for these topics (for method cf. Table 2). This branch of the poly-hierarchy reconstructs the thematical separation between issues of Phys. Rev. D.
Fig. 12 shows only subtopic-supertopic relationships of 27 communities of clustering . They are subtopics of and of and are connected with 97 further communities via . The three remaining communities are (which we omitted from the analysis) and two isolated communities mentioned in footnote 14.
Our clustering of the direct-citation network 2003–2010 has 13 communities at the highest level of the poly-hierarchy if and are omitted. The 13 communities cover 96 % of all links. In Fig. 13 the overlaps between the eight largest of them are visualised. Table 3 lists terms describing the eight topics. They are selected in the same manner as terms in Table 2 (see above). The corresponding graph for solution (Fig. 10) shows less but more inclusive topics.181818Note that -topics in Fig. 10 cover a smaller part of the their network than -topics in Fig. 13. Especially, a lot of papers about galaxies are missing in Fig. 10 (cf. next section).
Similar to clustering , clustering reconstructs the thematic split of contributions to Physical Review D. The two largest clusters dominated by particle physics are and (cf. Table 3 and Fig. 13). Again, these clusters are dominated by papers published in Phys. Rev. D in issues with uneven numbers, which are presented by in total 7760 papers in the 2003–2010 direct-citation network. 7358 of these are full papers in or (4229 of 4990 full papers in , 3129 of 3716 full papers in ).
Clusters obtained by any hierarchical clustering form a hierarchy where each cluster equals the union of its subclusters. In the poly-hierarchy of link communities the union of a community’s subcommunities does in general not fill it totally.
6.3 Terra incognita
In both networks we have regions which have no substructures in our solutions. In clustering solution , our algorithm constructed overlapping valid communities in a region comprising 72 % of the 2010 network, while the remaining 28 % were covered by just one community—the largest one () which covers 74% of all links in the network.
If we neglect the two largest communities and , clustering solution covers 96 % of the network 2003–2010 but the third largest community, , has not any subtopic in the set of remaining 110 -communities. If we unite all but the largest three -communities the union covers only 68 % of all links.191919There are 21 subtopics of among all 381 valid -communities, but we have deselected them because their -value is above the threshold. Thus, has substructures but only faint ones and their inclusion would increase coverage only by 4 % to 72 %. The results in both networks are consistent.202020We found the area of clustering solution that is not occupied by communities but by largely coinciding with the 2010 proportion of the area not covered by clustering solution without the three largest communities (90 % of 3013 papers with membership not covered by the reduced -solution are also in the set of 3881 papers not covered by the reduced -solution).
Thus, we wonder why we have a topic with several thousand papers for which no subtopic can be found whereas for other smaller topics we find subtopics. The assumption that the unstructured region might represent thematically diffuse areas that are produced by overlaps with neighbouring disciplines, could not be confirmed. For this to be the case, the area of the network would have to be of lower density, and publications would be expected to be located in those clusters of solution that have a large share of non-Astronomy papers (Boyack, 2017, this issue). Neither is the case. In both networks the density of the terra incognita is above the average density of the network.
Our algorithm could not identify thematic substructures in the terra incognita. This observation is difficult to interpret. The other highly aggregated solutions presented in this special issue always place one cluster on the terra incognita rather than assigning its papers to different clusters. However, solutions produced with high resolution levels and the first run of the Infomap algorithm construct smaller clusters in this region of the network (see also below, 6.4). This poses the question whether the cost function evaluates certain regions of a network in a way that prevents the identification of substructures.
6.4 Comparing the 2010 solution to a hard clustering of the same network
| size | sizes | Salton | overlap | selected | ||
|---|---|---|---|---|---|---|
| index | min | keywords in | ||||
| 1 | 2418 | 1 | 10667.77 | 0.53 | 1.00 | galaxies, redshift, star formation |
| 2 | 1963 | 2 | 4798.45 | 0.53 | 0.92 | extrasolar planets, giant stars |
| 3 | 2508 | 6 | 2747.10 | 0.90 | 0.97 | background radiation, relativity |
| 4 | 1261 | 8 | 1835.36 | 0.70 | 0.88 | molecular clouds, protostars |
| 5 | 1548 | 7 | 2499.23 | 0.67 | 0.86 | neutron stars, gamma rays, pulsars |
| 6 | 1613 | 10 | 1321.53 | 0.87 | 0.96 | beyond the standard model |
| 7 | 1309 | 12 | 1360.39 | 0.95 | 0.98 | solar physics, stellar structure |
| 8 | 538 | 1 | 10667.77 | 0.19 | 0.97 | white dwarfs, supernovae |
| 9 | 1103 | 14 | 1282.21 | 0.87 | 0.93 | solar system, mars, natural satellites |
| 10 | 331 | 7 | 2499.23 | 0.33 | 0.97 | gravitational waves, astroparticle |
| 11 | 159 | 50 | 33.53 | 0.66 | 0.98 | troposphere, mesosphere |
| 12 | 3 | 1 | 10667.77 | 0.01 | 0.96 | galaxies, mass distribution |
| 13 | 9 | 105 | 8.50 | 0.99 | 1.00 | microgravity, earth orbit, the moon |
| 14 | 7 | 107 | 7.00 | 0.96 | 1.00 | celestial coordinate systems |
Theresa Velden applied the Infomap algorithm to the network of 2010 papers and cited sources (s. \shortciteN[this issue]Velden2016Infomap for a description of the approach). This provides us with the opportunity to compare our solution of 127 overlapping clusters to the solution of 14 hard clusters produced by the final iteration of the Infomap algorithm and also to the solution produced by the first iteration of the Infomap algorithm with more than 1500 clusters.
Table 4 provides the best matching -community for each of the 14 -clusters (matches measured with link sets). The three -clusters for which the match to communities from is worst (8, 10, and 12) are also those with highest values of cost function (s. Fig. 3, p. 3), which explains why our algorithm has not found good valid communities similar to them.
99 % of links of the large cluster are in our terra incognita (s. section 6.3) and covers 73 % of its links. Thus, solution has no substructures in this region of the network, either. However, the first iteration of the Infomap algorithm did find (small) thematic substructures in this region of the network. We are currently investigating the reasons for this discrepancy.
7 Discussion and Conclusion
The algorithm we developed and used constructs link communities by evolving populations of subgraphs in runs that are independent of each other. It does not enforce a compromise between possible different assignments of links or papers to clusters because it neither allocates all links or papers to clusters simultaneously, nor does it allocate links or papers exclusively. Evolutions terminate depending on the cost function regardless of cluster sizes. For these reasons, we assume that the memetic algorithm is at least in principle able to reconstruct the ground truths we derived from our theoretical considerations.
Both our experiments produced poly-hierarchies of partially and completely overlapping valid communities, which we consider as representations of topics. Since the algorithm constructs each community independently from all others, it could also have constructed disjunct communities. Since it did not, overlapping topics appear to exist in networks of publications from the perspective of our evaluation function . This applies to both the network of 2010 papers and their cited sources and the direct citation network of 2003–2010 papers.
Since our algorithm could indeed construct overlapping communities, we can also conclude that it can serve the purpose of exploring theoretically derived structural properties of topics. This leads to the theoretically interesting question what these overlaps actually mean. The traditional hierarchical understanding of topics is that a larger topic consists of smaller topics. The overlapping topics we constructed suggest two questions that challenge this view. First, it seems possible that the smaller topics do not completely cover the larger one. Does this mean that there are publications that belong to a topic but to none of its subtopics? One can go even further by asking whether overlaps always represent subtopics in the sense of a more specific sub-area. Is it possible that a smaller topic overlapping a larger one is thematically different, e.g. by referring to a method applied only by few researchers working on the subject?
A downside of our approach is that it produces a large number of communities and thus forces two explicit decisions on the validity of communities, i.e. the representation of topics by communities. First, we must decide how small a community can be and still represents a topic. This creates a sorites-type problem. One citation link between a paper and a cited source certainly does not constitute a topic. Neither do two citation links. Neither do three. What about four? Five? And so on. We must introduce a minimum size threshold for communities to be considered as representing topics, which admittedly is completely arbitrary. Comparisons to other solutions that produce very small clusters and experiments with varying size thresholds are necessary to provide some firmer ground for this decision.
Second, we are forced to decide how different two communities must be in order to represent different topics. All approaches that identify communities by finding local minima in a rough cost landscape and allow for communities to overlap face the problem of selecting communities. A rough cost landscape has many local minima, which correspond to communities that share many nodes and links. This requires a numerical parameter (the resolution of the method) that defines the minimum number of links or nodes in which subgraphs must differ in order to be considered as different communities. We had to introduce such a parameter (cf. section 3.1). Since the experiments reported here are the first ones with a new cost function, we set the parameter arbitrarily at 1/3 of the number of links of the community with higher -value. However, we expect further applications to work with a parameter whose value is derived from the purpose of the clustering exercise.
Evolutionary algorithms feature many numerical parameters including population size, mutation variance, number of crossovers in each generation, and others. These technical parameters do not affect the content of the solution the same way as the resolution parameter. Instead, they affect the efficiency of the algorithm, i.e. the quality of a solution that is produced in a given computation time.
We presented a new algorithm and cost function which produce clustering solutions that meet our theoretical criteria and are comparable to those produced with other solutions (see \shortciteNVelden2016Comparison this issue on the comparison of solutions). However, the task of comprehensively validating the proposed approach lies still ahead of us. One of the common approaches to validation, the use of benchmark graphs, seems difficult to apply. To our knowledge, benchmark graphs whose topology reflects the ground truths our approach is supposed to reconstruct—thematic structures of scientific knowledge—do not yet exist. Since our approach is tailored to that task, testing its ability to simply detect communities in standard benchmark graphs seems beside the point.
The phenomenon of unstructured regions (section 6.3) needs further analysis. In both clusterings there is a relatively large and dense region where neither we nor any other solution represented in this issue found substructures. Is this a real phenomenon or is our cost function unable to identify small topics in dense regions?
Although quite happy with the solutions the algorithm produces, we are much less happy with the computing costs of our memetic algorithm.212121For example, one evolution in which a large community (with nearly 18 % of papers 2003–2010) is constructed run nearly six days on a machine with 16 CPUs. To accelerate the procedure we already implemented parallel computing of populations in the R-Package PsiMin (cf. Appendix B). We also run parallel evolutions on different machines and CPUs. Exploring the algorithm by systematically varying parameters requires experiments with smaller networks. Using one of the larger communities constructed in the experiments described in this paper could also contribute to further exploring comparative clustering solutions.
Acknowledgements.
First, we want to thank all other authors of this special issue for doing this collaborative clustering exercise with us and for giving us many suggestions and hints. Special thanks to the members of the advisory board of our diversity project (http://141.20.126.172/~div/) who accompanied it throughout seven years. The work published here was partly funded by the German Research Ministry (01UZ0905). We thank Andreas Prescher for programming a fast C++-based R-package for parallel node-wise memetic search in the -landscape and a package for parallel link-wise local search. We thank Theresa Velden for the giant component of the network of direct citations between papers published 2003–2010 and her cluster solution for the network of papers published 2010 obtained with Infomap. Thanks to Nees Jan van Eck for the cluster solutions for this network he had obtained with CitNetExplorer. We also would like to thank Kevin Boyack for additional data of his clustering. Kevin Boyack, Rob Koopman, and Shenghui Wang have determined keywords we used to characterise clusters and communities. We are grateful to Wolfgang Glänzel and Rob Koopman who commented on an earlier version of this paper, and to two anonymous reviewers whose critical remarks helped us to clarify our argument.References
- Ahn et al. (2010) Ahn, Y.-Y., J. P. Bagrow, and S. Lehmann (2010). Link communities reveal multi-scale complexity in networks. Nature 466, 761–764. Cf. arXiv preprint 0903.3178. Accessed 1 December 2016.
- Amelio and Pizzuti (2014) Amelio, A. and C. Pizzuti (2014). Overlapping Community Discovery Methods: A Survey. Social Networks: Analysis and Case Studies, 105. Cf. arXiv preprint 1411.3935. Accessed 1 December 2016.
- Amsterdamska and Leydesdorff (1989) Amsterdamska, O. and L. Leydesdorff (1989). Citations: Indicators of significance? Scientometrics 15(5-6), 449–471.
- Boyack (2017) Boyack, K. W. (2017). Investigating the Effect of Global Data on Topic Detection. Scientometrics. In this issue.
- Boyack and Klavans (2010) Boyack, K. W. and R. Klavans (2010). Co-citation analysis, bibliographic coupling, and direct citation: Which citation approach represents the research front most accurately? Journal of the American Society for Information Science and Technology 61(12), 2389–2404.
- Boyack et al. (2005) Boyack, K. W., R. Klavans, and K. Börner (2005). Mapping the backbone of science. Scientometrics 64(3), 351–374.
- Chubin (1976) Chubin, D. E. (1976). The Conceptualization of Scientific Specialties. Sociological Quarterly 17(4), 448–476.
- Clauset (2005) Clauset, A. (2005). Finding local community structure in networks. Physical Review E 72(2), 26132.
- Cozzens (1985) Cozzens, S. E. (1985). Comparing the sciences: Citation context analysis of papers from neuropharmacology and the sociology of science. Social Studies of Science 15(1), 127–153.
- Edge and Mulkay (1976) Edge, D. O. and M. J. Mulkay (1976). Astronomy transformed. The emergence of radio astronomy in Britain. New York: Wiley.
- Evans and Lambiotte (2009) Evans, T. S. and R. Lambiotte (2009). Line graphs, link partitions, and overlapping communities. Physical Review E 80(1), 16105.
- Fortunato (2010) Fortunato, S. (2010). Community detection in graphs. Physics Reports 486(3-5), 75–174.
- Gach and Hao (2012) Gach, O. and J.-K. Hao (2012, January). A memetic algorithm for community detection in complex networks. In C. A. C. Coello, V. Cutello, K. Deb, S. Forrest, G. Nicosia, and M. Pavone (Eds.), Parallel Problem Solving from Nature - PPSN XII, Number 7492 in Lecture Notes in Computer Science, pp. 327–336. Springer Berlin Heidelberg.
- Glänzel and Thijs (2015) Glänzel, W. and B. Thijs (2015). Using hybrid methods and ‘core documents’ for the representation of clusters and topics: The astronomy dataset. In A. A. Salah, Y. Tonta, A. A. A. Salah, C. Sugimoto, and U. Al (Eds.), Proceedings of ISSI 2015 Istanbul: 15th International Society of Scientometrics and Informetrics Conference, pp. 1085–1090.
- Gläser (2006) Gläser, J. (2006). Wissenschaftliche Produktionsgemeinschaften: die soziale Ordnung der Forschung. Campus Verlag.
- Gläser et al. (2015) Gläser, J., M. Heinz, and F. Havemann (2015). Epistemic Diversity as Distribution of Paper Dissimilarities. In A. A. Salah, Y. Tonta, A. A. A. Salah, C. Sugimoto, and U. Al (Eds.), Proceedings of ISSI 2015 Istanbul: 15th International Society of Scientometrics and Informetrics Conference, pp. 1006–1017.
- Glenisson et al. (2005) Glenisson, P., W. Glänzel, F. Janssens, and B. D. Moor (2005). Combining full text and bibliometric information in mapping scientific disciplines. Information Processing & Management 41(6), 1548–1572.
- Gong et al. (2011) Gong, M., B. Fu, L. Jiao, and H. Du (2011, November). Memetic algorithm for community detection in networks. Physical Review E 84(5), 056101.
- Havemann et al. (2015a) Havemann, F., J. Gläser, and M. Heinz (2015a, January). Detecting Overlapping Link Communities by Finding Local Minima of a Cost Function with a Memetic Algorithm. Part 1: Problem and Method. Cf. arXiv preprint 1501.05139. Accessed 1 December 2016.
- Havemann et al. (2015b) Havemann, F., J. Gläser, and M. Heinz (2015b). A link-based memetic algorithm for reconstructing overlapping topics from networks of papers and their cited sources. In A. A. Salah, Y. Tonta, A. A. A. Salah, C. Sugimoto, and U. Al (Eds.), Proceedings of ISSI 2015 Istanbul: 15th International Society of Scientometrics and Informetrics Conference, pp. 1054–1060.
- Havemann et al. (2011) Havemann, F., M. Heinz, A. Struck, and J. Gläser (2011). Identification of Overlapping Communities and their Hierarchy by Locally Calculating Community-Changing Resolution Levels. Journal of Statistical Mechanics: Theory and Experiment 2011, P01023. Cf. arXiv preprint 1008.1004. Accessed 1 December 2016.
- Healey et al. (1986) Healey, P., H. Rothman, and P. K. Hoch (1986). An experiment in science mapping for research planning. Research Policy 15(5), 233–251.
- Hric et al. (2014) Hric, D., R. K. Darst, and S. Fortunato (2014, December). Community detection in networks: Structural communities versus ground truth. Physical Review E 90(6), 062805.
- Katz (1999) Katz, J. S. (1999). The self-similar science system. Research Policy 28(5), 501–517.
- Klavans and Boyack (2011) Klavans, R. and K. Boyack (2011). Using global mapping to create more accurate document-level maps of research fields. Journal of the American Society for Information Science and Technology.
- Koopman and Wang (2017) Koopman, R. and S. Wang (2017). Mutual Information based labelling and comparing clusters. Scientometrics. In this issue.
- Lancichinetti et al. (2009) Lancichinetti, A., S. Fortunato, and J. Kertesz (2009). Detecting the overlapping and hierarchical community structure in complex networks. New Journal of Physics 11, 033015. Cf. arXiv preprint 0802.1218. Accessed 1 December 2016.
- Leydesdorff (2004) Leydesdorff, L. (2004). Clusters and maps of science journals based on bi-connected graphs in the Journal Citation Reports. Journal of Documentation 60(4), 371–427.
- Leydesdorff and Rafols (2009) Leydesdorff, L. and I. Rafols (2009). A global map of science based on the ISI subject categories. Journal of the American Society for Information Science and Technology 60(2), 348–362.
- Leydesdorff and Rafols (2012) Leydesdorff, L. and I. Rafols (2012, April). Interactive overlays: A new method for generating global journal maps from Web-of-Science data. Journal of Informetrics 6(2), 318–332.
- Li et al. (2013) Li, Z., X.-S. Zhang, R.-S. Wang, H. Liu, and S. Zhang (2013, December). Discovering link communities in complex networks by an integer programming model and a genetic algorithm. PLoS ONE 8(12), e83739.
- Ma et al. (2014) Ma, L., M. Gong, J. Liu, Q. Cai, and L. Jiao (2014, June). Multi-level learning based memetic algorithm for community detection. Applied Soft Computing 19, 121–133.
- Neri et al. (2012) Neri, F., C. Cotta, and P. Moscato (Eds.) (2012). Handbook of Memetic Algorithms, Volume 379 of Studies in Computational Intelligence. Springer, Berlin.
- Peel et al. (2016) Peel, L., D. B. Larremore, and A. Clauset (2016, August). The ground truth about metadata and community detection in networks. Cf. arXiv preprint 1608.05878. Accessed 1 December 2016.
- Pizzuti (2009) Pizzuti, C. (2009). Overlapped community detection in complex networks. In Proceedings of the 11th Annual conference on Genetic and evolutionary computation, pp. 859–866. ACM.
- Pizzuti (2012) Pizzuti, C. (2012). Boosting the detection of modular community structure with genetic algorithms and local search. In Proceedings of the 27th Annual ACM Symposium on Applied Computing, pp. 226–231.
- Shi et al. (2013) Shi, C., Y. Cai, D. Fu, Y. Dong, and B. Wu (2013, September). A link clustering based overlapping community detection algorithm. Data & Knowledge Engineering 87, 394–404.
- Shi and Malik (2000) Shi, J. and J. Malik (2000, August). Normalized cuts and image segmentation. IEEE Transactions on Pattern Analysis and Machine Intelligence 22(8), 888 –905.
- van Eck and Waltman (2017) van Eck, N. J. and L. Waltman (2017). Citation-based clustering of publications using CitNetExplorer and VOSviewer. Scientometrics. In this issue.
- van Raan (1996) van Raan, A. (1996). Advanced bibliometric methods as quantitative core of peer review based evaluation and foresight exercises. Scientometrics 36(3), 397–420.
- van Raan (1991) van Raan, A. F. J. (1991). Fractal geometry of information space as represented by co-citation clustering. Scientometrics 20, 439–449.
- Velden et al. (2017) Velden, T., K. Boyack, J. Gläser, R. Koopman, A. Scharnhorst, and S. Wang (2017). Comparison of Topic Extraction Approaches and Their Results. Scientometrics. In this issue.
- Velden et al. (2017) Velden, T., S. Yan, and C. Lagoze (2017). Infomap Clustering of Direct Citation Network and Topic Affinity Analysis. Scientometrics. In this issue.
- Waltman and van Eck (2012) Waltman, L. and N. J. van Eck (2012). A new methodology for constructing a publication-level classification system of science. Journal of the American Society for Information Science and Technology 63(12), 2378–2392.
- Whitley (1974) Whitley, R. (1974). Cognitive and social institutionalization of scientific specialties and research areas. In R. Whitley (Ed.), Social Processes of Scientific Development, pp. 69–95. London: Routledge & Kegan Paul.
- Xie et al. (2013) Xie, J., S. Kelley, and B. K. Szymanski (2013, August). Overlapping community detection in networks: The state-of-the-art and comparative study. ACM Comput. Surv. 45(4), 43:1–43:35.
- Yau et al. (2014) Yau, C.-K., A. Porter, N. Newman, and A. Suominen (2014, September). Clustering scientific documents with topic modeling. Scientometrics 100(3), 767–786.
- Zhang et al. (2015) Zhang, Z., N. Zhang, C. Zhong, and L. Duan (2015, November). Detecting Overlapping Communities with Triangle-Based Rough Local Expansion Method. In D. Ciucci, G. Wang, S. Mitra, and W.-Z. Wu (Eds.), Rough Sets and Knowledge Technology, Number 9436 in Lecture Notes in Computer Science, pp. 446–456. Springer International Publishing. DOI: 10.1007/978-3-319-25754-9_39.
Appendix A Elements of Memetics
In large networks exploring the cost landscape by adding or removing individual links is very time-consuming. Therefore, we begin the search with a coarse search phase in which the memetic algorithm adds or removes groups of links by adding or removing a node with all its links. Node-wise memetics is done with subgraphs induced by node sets : mutation, crossover, and local search are based on node sets. The coarse search phase is followed by a fine search phase, namely a link-wise local search (cf. Algorithm 2).
Local search:
Local search (adaptation) in the cost landscape is done by a greedy algorithm for finding local cost minima that correspond to communities. The algorithm is called greedy because it always chooses the step in the cost landscape that brings the biggest decrease (or the smallest increase) of . Node-wise local search includes a neighbouring node of subgraph (or excludes a boundary node) with all its links to nodes in . Link-wise local search includes a neighbouring link of subgraph or excludes a link attached to a boundary node. Local search can begin by a series of either inclusions or exclusions of nodes (links). If no neighbouring place in the landscape with lower cost can be reached the algorithm excludes or includes further nodes (links). This stops after a maximum number of steps without improvement. This maximum number is calculated from the relative resolution parameter. In all experiments described here we go as many steps as allowed by the rule that a community’s range should be at least one third of its size (Havemann et al., 2015a, cf. p. 6). When no further improvement can be achieved, the search switches from inclusion to exclusion or vice versa. Inclusion and exclusion are continued until no further improvement is possible. Exclusion can make the subgraph unconnected. Node-wise local search then proceeds with its main component. In the case of link-wise local search the exclusion process can go through places in the cost landscape which correspond to unconnected subgraphs. Connectedness is tested only after running the algorithm. If we obtain two or more components then we start new link-wise local searches using components as seeds.
Mutation:
We mutate a community with mutation variance by changing maximally a proportion of its nodes. This is done by randomly selecting a node in , to which neighbours in are randomly added until a connected subgraph of a size larger than is reached. To this subgraph, further random neighbours are added, which now can also be outside . This random extension continues until a connected subgraph of size is reached. The mutant is then subjected to two local searches, one each starting with greedy inclusion and exclusion of nodes. Thereby we obtain two communities from each mutation (which can be identical).
Crossover:
From two parent communities we construct two new individuals by taking intersection and union of the communities as starting points for adaptive local searches. Adapting the union is started with exclusion of nodes, adapting the intersection is started with inclusion of nodes. Of course, it has no effect to cross such parents where one of them is part of the other one. We also do not cross disjoint parents because we are interested in connected subgraphs as solutions.
Selection:
From the old population and the results of mutations and crossovers we select the communities with lowest -values, keeping the population size constant. A new best community is only included if it is inside the minimal range (defined by the resolution parameter) of the best community of the original population. Deselected new best communities can be used as seeds for other memetic searches.
Appendix B Running memetic search
Each seed was first adapted by a local search and then used to initialise the population of 16 different communities by mutating the adapted seed with a variance of 15 %.
In the first round of memetic searches, up to five experiments were run with each seed. The standard mutation variance in each experiment was 2 %, i.e. up to 2 % of the nodes were randomly exchanged. The variance was increased to 15 % if -values did not improve for 10 generations (renewal of population). For each seed, the results of these experiments where used to initialise a population (of eight communities) for a second round of up to ten memetic experiments. Here we omitted renewal and led the mutation variance decrease after each generation for which no improved best community was obtained. This strategy was applied to find nearby better communities which could have been overseen with fixed mutation variance. After node-wise memetics, for each community we made a link-wise local search.
We tested whether link communities have a range above the minimum range of one third of the link set’s size. At this stage, we also considered subgraphs induced by complementary link-sets because cost function is the same for and its complement. If the complement is unconnected then we tried to improve its main component by link-wise local search.
We implemented the whole procedure as R-scripts. For parallel node-wise memetic search in the -landscape we applied a fast new C++-based R-Package PsiMin. For parallel link-wise local search we applied R-Package PsiMinL. Both (yet unpublished) packages were programmed for us by Andreas Prescher.
Appendix C Results
| = | # full | sum of | # related | ||||
|---|---|---|---|---|---|---|---|
| -rank | # links | papers | fractions | subtopics | supertopics | others | |
| 1 | 394924 | 0.0391 | 10354 | 10667.77 | – | – | – |
| 2 | 183177 | 0.0605 | 5741 | 5934.75 | 70 | 0 | 34 |
| 3 | 141063 | 0.0391 | 3923 | 4095.23 | 24 | 0 | 32 |
| 4 | 111323 | 0.0708 | 3518 | 3650.07 | 47 | 1 | 46 |
| 5 | 93641 | 0.0713 | 3203 | 3299.33 | 61 | 1 | 39 |
| 6 | 91349 | 0.0550 | 2604 | 2747.10 | 17 | 1 | 31 |
| 7 | 74369 | 0.0967 | 2354 | 2499.23 | 28 | 0 | 61 |
| 8 | 63508 | 0.0967 | 1738 | 1835.36 | 0 | 1 | 48 |
| 9 | 47464 | 0.0348 | 1907 | 1964.06 | 32 | 1 | 44 |
| 10 | 44729 | 0.0415 | 1272 | 1321.53 | 2 | 1 | 30 |
| 11 | 35259 | 0.0821 | 1180 | 1276.35 | 7 | 0 | 32 |
| 12 | 31999 | 0.0336 | 1321 | 1360.39 | 20 | 2 | 46 |
| 13 | 31232 | 0.0475 | 974 | 1008.05 | 7 | 1 | 16 |
| 14 | 27685 | 0.0405 | 1236 | 1282.21 | 40 | 3 | 47 |
| 15 | 24304 | 0.0912 | 823 | 890.08 | 4 | 3 | 21 |
| 16 | 22111 | 0.0638 | 1109 | 1176.34 | 52 | 3 | 43 |
| 17 | 19343 | 0.0890 | 724 | 762.28 | 5 | 2 | 18 |
| 18 | 19161 | 0.0565 | 589 | 621.82 | 1 | 3 | 15 |
| 19 | 19058 | 0.0417 | 841 | 874.71 | 28 | 5 | 42 |
| 20 | 18036 | 0.0640 | 723 | 762.81 | 19 | 3 | 31 |
| 21 | 14711 | 0.0460 | 702 | 737.56 | 25 | 6 | 53 |
| 22 | 13244 | 0.0636 | 728 | 754.02 | 43 | 2 | 44 |
| 23 | 13177 | 0.0899 | 494 | 512.70 | 6 | 2 | 13 |
| 24 | 13079 | 0.0776 | 679 | 698.55 | 29 | 2 | 42 |
| 25 | 13008 | 0.0826 | 665 | 688.18 | 19 | 3 | 46 |
| 26 | 12540 | 0.0630 | 403 | 414.81 | 0 | 4 | 9 |
| 27 | 8233 | 0.0609 | 455 | 470.90 | 31 | 1 | 43 |
| 28 | 6982 | 0.0861 | 223 | 235.07 | 3 | 2 | 18 |
| 29 | 6023 | 0.0424 | 239 | 245.11 | 6 | 8 | 31 |
| 30 | 5812 | 0.0814 | 387 | 399.25 | 28 | 4 | 44 |
| 31 | 5771 | 0.0889 | 230 | 242.44 | 0 | 6 | 30 |
| 32 | 5734 | 0.0923 | 185 | 196.42 | 1 | 1 | 17 |
| 33 | 5593 | 0.0688 | 328 | 343.54 | 16 | 7 | 39 |
| 34 | 5446 | 0.0853 | 195 | 210.40 | 2 | 4 | 8 |
| 35 | 4441 | 0.0664 | 307 | 314.62 | 16 | 8 | 41 |
| 36 | 3999 | 0.0879 | 253 | 259.45 | 6 | 4 | 43 |
| 37 | 3755 | 0.0945 | 194 | 202.32 | 12 | 7 | 23 |
| 38 | 3580 | 0.0770 | 123 | 135.36 | 2 | 5 | 6 |
| 39 | 3484 | 0.0944 | 142 | 154.64 | 1 | 8 | 31 |
| 40 | 2750 | 0.0690 | 165 | 169.76 | 5 | 12 | 39 |
| 41 | 2204 | 0.0811 | 99 | 101.35 | 6 | 5 | 38 |
| 42 | 1816 | 0.0331 | 132 | 137.73 | 4 | 5 | 30 |
| 43 | 1316 | 0.0519 | 134 | 139.33 | 8 | 15 | 28 |
| 44 | 1290 | 0.0502 | 105 | 108.67 | 7 | 11 | 22 |
| 45 | 1183 | 0.0888 | 58 | 59.00 | 3 | 8 | 30 |
| 46 | 1072 | 0.0702 | 64 | 64.82 | 7 | 5 | 33 |
| 47 | 925 | 0.0470 | 83 | 85.91 | 5 | 7 | 28 |
| 48 | 889 | 0.0558 | 74 | 76.04 | 1 | 20 | 13 |
| 49 | 789 | 0.0710 | 30 | 30.41 | 1 | 9 | 15 |
| 50 | 709 | 0.0325 | 32 | 33.53 | 1 | 6 | 12 |
| = | # full | sum of | # related | ||||
|---|---|---|---|---|---|---|---|
| -rank | # links | papers | fractions | subtopics | supertopics | others | |
| 1 | 661025 | 0.0621 | 62606 | 67817.87 | – | – | – |
| 2 | 611025 | 0.0824 | 71488 | 79068.49 | – | – | – |
| 3 | 313717 | 0.0824 | 19948 | 22756.18 | 0 | 0 | 24 |
| 4 | 263676 | 0.0621 | 31242 | 33989.63 | 53 | 0 | 16 |
| 5 | 138567 | 0.0549 | 17372 | 18875.51 | 41 | 0 | 59 |
| 6 | 131062 | 0.0920 | 11899 | 13664.33 | 0 | 0 | 42 |
| 7 | 66007 | 0.0634 | 10406 | 11219.33 | 52 | 1 | 14 |
| 8 | 51956 | 0.0240 | 9035 | 9599.80 | 19 | 0 | 38 |
| 9 | 34292 | 0.0391 | 8201 | 8811.90 | 48 | 2 | 18 |
| 10 | 27006 | 0.0230 | 4990 | 5299.93 | 13 | 0 | 14 |
| 11 | 21283 | 0.0672 | 3716 | 4161.44 | 4 | 0 | 30 |
| 12 | 20617 | 0.0846 | 2740 | 3049.89 | 5 | 0 | 35 |
| 13 | 15851 | 0.0377 | 4846 | 5183.65 | 32 | 3 | 26 |
| 14 | 15202 | 0.0603 | 2789 | 3146.62 | 6 | 1 | 29 |
| 15 | 11787 | 0.0472 | 2919 | 3175.17 | 10 | 4 | 29 |
| 16 | 10840 | 0.0331 | 3873 | 4109.32 | 33 | 4 | 22 |
| 17 | 7726 | 0.0699 | 1203 | 1381.78 | 3 | 1 | 17 |
| 18 | 7027 | 0.0675 | 1254 | 1412.50 | 0 | 1 | 12 |
| 19 | 5919 | 0.0582 | 923 | 1057.08 | 0 | 1 | 20 |
| 20 | 5898 | 0.0788 | 1312 | 1482.75 | 4 | 1 | 24 |
| 21 | 5519 | 0.0755 | 1023 | 1159.48 | 0 | 1 | 16 |
| 22 | 5306 | 0.0524 | 1715 | 1928.48 | 12 | 3 | 25 |
| 23 | 5130 | 0.0700 | 651 | 746.04 | 0 | 2 | 7 |
| 24 | 5039 | 0.0350 | 1907 | 2036.18 | 13 | 5 | 29 |
| 25 | 4607 | 0.0156 | 2129 | 2214.93 | 22 | 2 | 26 |
| 26 | 4585 | 0.0680 | 743 | 858.58 | 0 | 1 | 17 |
| 27 | 3734 | 0.0776 | 876 | 1001.57 | 2 | 2 | 23 |
| 28 | 3558 | 0.0426 | 1120 | 1210.82 | 5 | 8 | 14 |
| 29 | 3052 | 0.0920 | 670 | 775.94 | 2 | 0 | 28 |
| 30 | 2826 | 0.0729 | 834 | 944.41 | 3 | 1 | 26 |
| 31 | 2613 | 0.0879 | 413 | 481.93 | 0 | 5 | 14 |
| 32 | 2461 | 0.0239 | 1042 | 1108.51 | 8 | 8 | 18 |
| 33 | 2413 | 0.0627 | 769 | 847.31 | 1 | 9 | 9 |
| 34 | 1990 | 0.0292 | 996 | 1058.81 | 7 | 3 | 36 |
| 35 | 1883 | 0.0572 | 344 | 395.04 | 0 | 1 | 13 |
| 36 | 1806 | 0.0165 | 941 | 978.65 | 7 | 3 | 29 |
| 37 | 1473 | 0.0834 | 510 | 585.49 | 5 | 1 | 18 |
| 38 | 1415 | 0.0373 | 657 | 711.38 | 5 | 3 | 26 |
| 39 | 1259 | 0.0731 | 251 | 291.21 | 0 | 6 | 12 |
| 40 | 1230 | 0.0853 | 308 | 351.10 | 1 | 4 | 16 |
| 41 | 1171 | 0.0905 | 458 | 507.82 | 3 | 6 | 18 |
| 42 | 1143 | 0.0889 | 321 | 366.07 | 0 | 1 | 23 |
| 43 | 1120 | 0.0671 | 170 | 198.11 | 0 | 1 | 16 |
| 44 | 1117 | 0.0761 | 360 | 398.15 | 1 | 3 | 21 |
| 45 | 1066 | 0.0830 | 318 | 366.26 | 2 | 1 | 10 |
| 46 | 1045 | 0.0230 | 521 | 548.00 | 1 | 11 | 17 |
| 47 | 971 | 0.0729 | 236 | 272.84 | 0 | 3 | 12 |
| 48 | 937 | 0.0492 | 508 | 548.67 | 5 | 4 | 28 |
| 49 | 906 | 0.0612 | 228 | 263.50 | 1 | 1 | 15 |
| 50 | 803 | 0.0516 | 417 | 455.16 | 2 | 4 | 30 |
In Table 5 and Table 6 we list data of the 50 largest communities in the networks with papers published in 2010 and in 2003–2010, respectively. The following definitions are used:
Full papers
are papers which have no citation links to papers outside the subgraph induced by link set .
Fractions of papers
are membership grades of papers i.e. the ratios of numbers of internal to numbers of all citation links. Thus, sum of fractions is determined as
where is the degree of paper and its internal degree with regard to (the number of links attached to which are in link set ).
Subtopics
of community are all other communities which have at least 95 % of their links in link set .
Supertopics
of community are all other communities which include at least 95 % of links in link set .
Other related communities
of community are all those communities which have links in common with link set but are not sub- or supertopics of .