Dust clouds and plasmoids in Saturn’s Magnetosphere
as seen with four Cassini instruments
Abstract
We revisit the evidence for a ”dust cloud” observed
by the Cassini spacecraft at Saturn in 2006.
The data of four instruments are simultaneously compared
to interpret the signatures of a coherent swarm of
dust that would have remained near the equatorial plane
for as long as six weeks.
The conspicuous pattern, as seen in the dust counters of the
Cosmic Dust Analyser (CDA), clearly repeats on three
consecutive revolutions of the spacecraft.
That particular cloud is estimated to about 1.36 Saturnian
radii in size, and probably broadening.
We also present a reconnection event from the magnetic field
data (MAG) that leave behind several plasmoids like those
reported from the Voyager flybys in the early 1980s.
That magnetic bubbles happened at the dawn side of Saturn’s
magnetosphere.
At their nascency, the magnetic field showed a switchover of
its alignment, disruption of flux tubes and a recovery on
a time scale of about 30 days.
However, we cannot rule out that different events might have
taken place.
Empirical evidence is shown at another occasion when a
plasmoid was carrying a cloud of tiny dust particles such
that a connection between plasmoids and coherent dust clouds
is probable.
keywords:
Dust clouds, Saturn, Cassini mission, Cosmic Dust Analyser, Magnetosphereurl]DOI: http://dx.doi.org/10.1016/j.asr.2016.12.030
1 Introduction
Interplanetary dust clouds are local density enhancements of particles of a specific mass type. They would usually be relicts of dissolved comets, debris of an asteroidal collision, ejecta from planets or moons, and a few may also go back to jet streams from active bodies, or coronal mass ejections. In the vast range of patterns, the characteristics of dust will vary on all dimensions: size, density, mass, lifetime, and more (see, e.g., Grün et al. (2004)).
During the Pioneer and both Voyager flybys at Saturn in the 1980s, regions of plasma material were found on the day-side of the Saturnian magnetosphere (Bridge et al. (1981), Bridge et al. (1982)). These are local spots of relatively dense and cold plasma at distances beyond 16 Saturnian radii (1 = 60,268 km). In particular, Voyager 2’s ion spectrometer suggested that numerous of such isolated “plasma blobs” float closely to the Saturnian magnetopause. Dust grains, which would be very much more massive than plasma components, were not reported. We accidentally discovered in the Cassini data one striking event that showed a local enhancement of dust particles resembling a “dust blob” remaining for a few revolutions of the spacecraft (Khalisi et al. (2015)). Now, we will investigate that event in more detail throughout this paper.
Dust usually carries an electric charge, so, it seems likely that there might be regions of increased dust particles more or less tied to magnetically confined areas. An analog for such accumulations could be the Coronal Mass Ejections in the solar wind. The Cassini mission offers an excellent opportunity to search for similar dust clouds, more so, as the existence of the plasma blobs has already been verified. The source of plasma enhancements is still unresolved, but a plenty of mechanisms were debated. We will briefly review five of them in the next section. Thereafter, we show an example for a “dust cloud” and a “plasmoid” as well as a connection of both. For the coupling of these two types, we empirically present a multi-instrument evidence.
2 Plasma and dust models for the magnetosphere of Saturn
2.1 Sputtering
Among the first accounts on plasma concentrations at Saturn, Frank et al. (1980) came forward with ion observations made by Pioneer 11 in 1979. They identified a torus of cold hydrogen (H+) and oxygen ions (O2+ and O3+) in the distance range of 4–16 . They proposed a sputtering mechanism from two sources: the Saturnian rings as the primary source as well as the ice moons Dione and Tethys as secondary sources. Almost three decades later, the Cassini Plasma Spectrometer (CAPS) confirmed the existence of the plasma injections from these moons (Burch et al. (2007)). The injections are very localized, while the inherent electrons have pitch-angle distributions characteristic for a trapped population.
Meanwhile, the geologically active moon Enceladus became known as a significant contributor of dust, water ice, salty contaminations, and charged particles, all of which would further disintegrate in the tenuous environment (Porco et al. (2006)). Enceladus attracted more notice and is considered as the main source of ejecta now.
2.2 Titan wake
The second explanation on those density enhancements was associated with a plasma wake from Titan. Although lacking a magnetic field of its own, Titan’s atmosphere is known as an ion source (Bridge et al. (1981)). From Voyager’s plasma measurements, Hartle et al. (1982) exemplified that the wake will be produced as a result of the interaction of Saturn’s magnetosphere with Titan’s induced ionosphere, in a similar way as the interaction of Venus with the solar wind. The wake would be draped in the moon’s quasi-magnetospheric tail, and it coincides with an abrupt lack of high energy electrons (700 eV), called the electron “bite-out” region. As evolving on its backside sector, the wake arises preferably on the sunward side when Titan is exposed stronger to the variable shock front of Saturn’s magnetosphere (Fig. 6 of Hartle et al. (1982)). In some rare cases, Titan would entirely leave Saturn’s asymmetric magnetic field and be shocked directly by the solar wind. Then, the solar wind pressure is likely to evoke reconnection processes. Unlike Venus or Mars, all these interactions turn out very complex in the special case of Titan, for its atmosphere is affected by both Sun and Saturn (see Bertucci et al. (2011)).
A plasma wake can acquire a meandering shape due to its stochastic radial motion (expansion, contraction of the entire magnetosphere of Saturn) in response to the changing solar wind pressure. If it remains identifiable for a time longer than a planetary rotation, it may wrap up itself and stay in the vicinity of Titan. Thus, the Voyager spacecraft could have intercepted the same plasma wake more than once and mocked several density enhancements (Bridge et al. (1981)). Two decades later, the Cassini spacecraft confirmed different plasma populations during two close Titan flybys in 2004 (Szego et al. (2005)). The populations were found drifting as far as 1 (or 20 Titan radii) from the moon itself. However, it was not discernible whether the same furled structure was traversed, or different particle flows were generated at different times, or even both.
2.3 Detachments from the magnetospheric sheet
A third model was presented by Goertz (1983). He pointed out that the observed plasma “islands” could be detached from the magnetospheric sheet of Saturn. This idea is motivated by Hill (1976) on flux-tubes in a centrifugally distorted magnetic field. A flux-tube becomes unstable when its plasma content is a decreasing function of the distance from the spin axis. The theory was successfully applied to the outer magnetosphere of Jupiter. For Saturn, such extensions would happen on the boundary of the magnetospheric sheet to the outer magnetosphere, i.e. at about 16 or 17 . Goertz (1983) compared the enclosed bubbles of tailward-moving plasma, which he called “plasmoids”, with the separating magnetic blobs already known from the Earth’s magnetosphere.
In the same year, Sittler et al. (1983) presented a comprehensive analysis of the plasma observations and sketched a magnetospheric environment around Saturn with three fundamentally different regions: the inner plasma torus (), the extended plasma sheet (7–15 ), and a hot outer magnetosphere () which extends right down to the magnetopause. The Voyager data implied that the disturbances display an anti-correlated nature of electron properties (density and temperature): Hot and more tenuous electrons drift from the outer magnetosphere inwards, while a cool and rather dense electron component from the inner torus migrates outwards, combined with heating. So, there exists an inward and outward transport of plasma electrons.
The morphology of the magnetospheric profile was essentially confirmed by Cassini (Arridge et al. (2007)). The magnetometer observations also revealed those plasmoids. The examples presented originate from a radial distance of 22 . The structures were interpreted as multiple crossings of a rippled or displaced current sheet caused by solar wind variations. Three more plasmoids were identified in the magnetic tail at distances as far as 40 (Hill et al. (2008)).
The model of plasma detachments does not necessarily contradict the Titan-associated wake model above (Sect. 2.2), for both are consistent with gradual aging effects. Sittler et al. (1983) estimated the time scale for the dispersal to be a few Kronian rotation periods. As Goertz (1983) pointed out, a Titan plume would remain stable as long as it moved very slowly. When speeding up, the velocity shear across the wake can generate a Kelvin-Helmholtz instability which will lead to a mixing of the slow wake and fast background plasma. Also, the centrifugal instability will cause a rapid dispersal in radial direction. It is even likely that the combined effects account for the diffusion.
The sources of these plasma injections remain unknown, but they seem to be randomly distributed in both local time and Saturnian longitude. Another argument in favor are the matching values of the peak densities of both plasma blobs and in the plasma sheet.
Last but not least, Sittler et al. (1983) showed that the attenuation of electron energies was correlated with micron-sized dust particles. In particular, the authors referred to the inner plasma torus inside of 5 , though such signatures would easily apply to any diamagnetic shielding of neutral material in general. The range of the attenuation will be approximately equal to the diameter of the dust particles.
2.4 Hyperion as dust source
A new angle of view was thrown in by Banaszkiewicz & Krivov (1997). Using numerical simulations, the authors argued that Hyperion, at 24 , would possibly serve as a dust supplier for Titan. Initially, the dust particles of a few micro-meter in size, originating from Hyperion, are locked in a 4:3 mean motion resonance with Titan and forming a stable dust belt. That resonance will be destroyed by the solar radiation pressure, and, to a much smaller share (less than 1%), by the plasma drag force (Krivov & Banaszkiewicz (2001)). Once the resonance is broken, the orbits of the dust particles become unstable and stratify themselves by mass: the larger ones of m segregate inwards and collide with Titan, the smaller ones will escape out of the system.
Since both Hyperion and Titan move close to the boundary of the day-ward magnetosphere of Saturn, the region between the two moons is filled with low density, hot, and subsonic plasma. In this region, the interaction occurs between the dust particles and the plasma: The much faster moving plasma of ions exposes a drag force on the dust grains (Banaszkiewicz & Krivov (1997)). However, at the time of designing the theory, Cassini was still en route to Saturn and the parameters of the dust as well as the assumed yields of ejecta from Hyperion were poorly known. Many assessments were uncertain.
Later, Kennedy et al. (2011) looked for such dust swarms in the far-off field at Saturn (100 Saturnian radii, ) deploying observations of the Spitzer Space Telescope in the infrared. A large-scale cloud, that could be attributed to an irregular satellite or other cosmic origin, was not found definitely.
2.5 Two-cell plasma convection
A fifth approach to explain the density enhancements in the outer magnetosphere was presented by Gurnett et al. (2007) when studying the Saturn kilometric radiation (SKR). The SKR is an intense radio emission from the auroral zones, analogous to the auroral radiation on Earth. Their model goes without artificial relations to moons or their ambiences. The heart of Gurnett et al. (2007)’s concept was a two-cell convection emerging between the neutral gas torus at the orbit of Enceladus and the magnetospheric plasma sheet.
The mass loss from the geysers of Enceladus (distance: 3.95 ) feeds the neutral gas torus all the way along its orbit. As the plasma passes outward through the inner edge of the neutral gas torus, it picks up newly ionized particles from the torus and thereby increases its density. The density remains lower on the opposite longitude, thus, the centrifugal forces become different. This difference drives a large convection cell on either flanks of the planet (see Fig. 3 of Gurnett et al., 2007). The rapid rotation of the plasma disk and the constrained motion of the particles to the magnetic field lines act additionally to concentrate the plasma near the equatorial plane.
As both convection cells rotate, their outflow produces perturbations that drift into the outer magnetosphere. The associated perturbations in the magnetic field develop a phase lag. By the time these perturbations reach the magnetopause at 20 , they appear at the morning side of the planet, where the SKR would be generated. This would be consistent with the fact that the electron density is often different on the inbound and outbound arcs of the Cassini trajectory, in particular in the vicinity of Enceladus (Gurnett et al. (2007)). Thus, the period of the SKR modulation proved to be locked to the variation of the plasma density in that inner region of the magnetosphere.
In fact, Ulysses was able to sense the SKR from Saturn. The observations by Galopeau & Lecacheux (2000) showed that the SKR period lengthened by 1% on an annual time scale during the years from 1994 to 1997. For this long-term variations, Gurnett et al. (2007) suggested the seasonal effect of the altering solar inclination angle which affects the conductivity of the plasma disk: The illumination of the Southern hemisphere increases the conductivity of its ionosphere, which, in turn, governs a number of other phenomena including the poleward motion of flux, the corresponding aurora with its SKR, and even connects farther out to the plasma disk.
Almost the same conclusion was given by Goldreich & Farmer (2007) who found that the SKR must be supported by currents external to the planetary body. They also rested the source of the varying SKR upon the coupling of the outflowing plasma and magnetic field close to the orbit of Enceladus. A current would produce a non-axisymmetric component to the intrinsic magnetic field of the planet, which itself should be symmetric because of its perfect axis alignment with the rotational axis. To sum up this model: The external magnetic field suffers a break in symmetry due to the centrifugally driven convection.
3 Data basis and orbits
The Cassini orbiter is in the favorable situation to exploit the dynamics in the magnetosphere in detail. The multi-instrumental view opens up a new picture to the precise topographical survey of the magnetospheric regions. We adopt the model of radial distances by Sittler et al. (1983) which was improved by André et al. (2008).
The key parameters of our study are provided by the MAPSview database. We employed the following instrumental data:
-
1.
CDA: impact rate of the registered dust events per 64 s, see Khalisi et al. (2015) for details.
-
2.
CAPS: electron density , electron velocity , and pressure (EMNT parameter); and the same for ions, , , (IMNT parameter), if present.
-
3.
MAG: strength of the magnetic field plus its three components , , and in the kronocentric solar-magnetospheric (KSM) coordinate system.
-
4.
RPWS: qualitative radio signals in the frequency bands of 1 Hz, 10 Hz, 100 Hz, 1 kHz, and 10 kHz.
-
5.
TRAJ: additionally, the current position of Cassini from Saturn.
Most parameters have a resolution of min of time, except some very few cases when the instrument was out of its nominal operation. The CDA and CAPS are directional instruments, and their data has to be corrected for the current pointing. RPWS and MAG are not reliant on the spacecraft attitude and have the advantage of a continuous measurement of their respective signals throughout the orbit. In particular, the components of the B-vector give important clues to the alignment of the magnetic field.
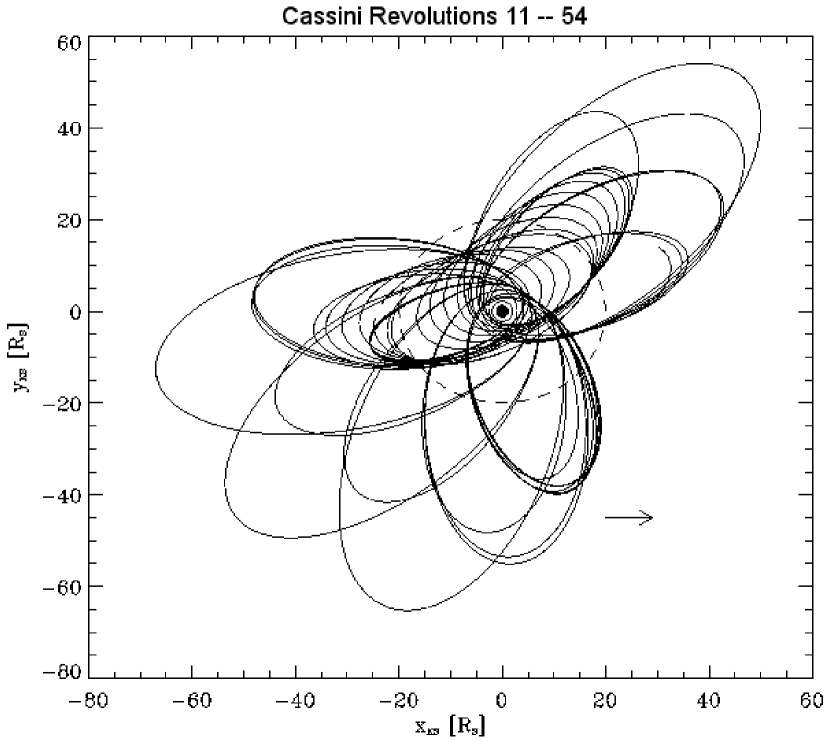
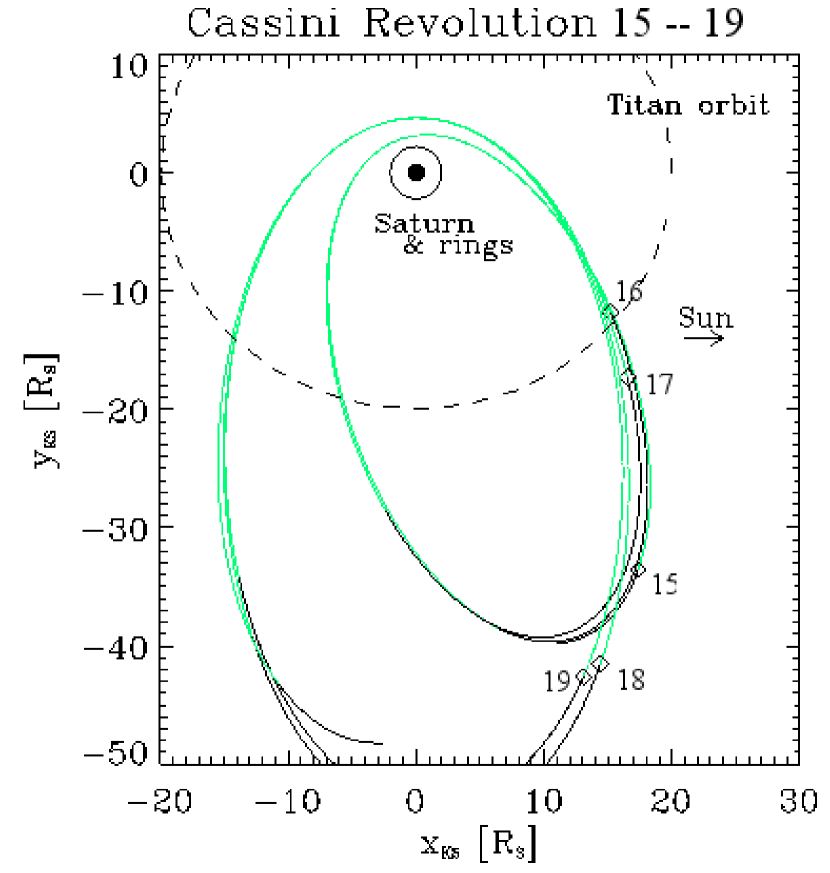
Our analysis spans the Cassini Revolutions #11–54 (DOYs 186/2005 till 361/2007), a total of 905 days. The state of the Saturnian magnetosphere was evaluated by Achilleos et al. (2008) for the first Revolutions #7–14, which had an inclination of . We supplement their analysis by 40 more revolutions and put our focus to the equatorial plane (). Figure 1 shows the projection of the orbits onto the ring plane in a Saturn-centred coordinate system. The Sun was to right hand side (arrow), illuminating the Southern hemisphere; it was below the plane at an angle of 20–10∘ getting increasingly shallower.
The orbital inclinations of Cassini’s trajectory changed during its tour. The equatorial plane was traversed at the dusk side for the Revolutions #15–26, while the line of apsides turned slowly to the magnetotail. At the interim Revolutions #27–46 the orbits suffered from high inclinations (), which we redlined from this particular analysis. When the orbits were re-tilted to the ring plane for the Revolutions #47–52, Cassini already transited the evening side of the magnetosphere. A disturbance from Jupiter’s magnetic field was not given, for it had outpaced Saturn back in 2000 and, now, was a quarter of its orbit ahead. Also, the solar activity passed its maximum in 2000, and was subsiding. Therefore, such “external effects” can be neglected with regard to the years 2005 to 2007, and even so at the distance of Saturn.
4 Topography of the magnetosphere
Our approach was such that we firstly determined the state of the magnetosphere at each revolution. The electron density in the solar wind reveals stable at values of cm-3, as are the electron velocities at 20–40 km/s. Though the electrons are thermal velocities, they provide continuous data and a resolution on 1-min-scale, while the ion data are often missing in the data base. The electron data proved benefical to distinguish the borders of the magnetospheric regions. The interplanetary magnetic field strength is usually 0.5–1.0 nT at the distance of Saturn.
The magnetopause of Saturn is identified best by a sharp drop of and a steep rise of . Simultaneously, jumps to 4–5 nT and the -component turns negative. The B-values at the entry of the magnetopause do vary strongly upon local conditions. In a number of cases, when the spacecraft sojourned near the magnetopause, we observed a swaying magnetic boundary (multiple crossings of the magnetopause); or an accumulation of dust particles at the bow shock; or various detached plasmoidal regions; or a sudden depletion of electrons. The whole magnetopause appears very vivid, complex, and looks different at almost each passage. On the other hand, some dynamical phenomena show a surprisingly stable pattern that remain as long as several revolutions of Cassini. Therefore, the identification of some features inside the magnetosphere turns out ambiguous. André et al. (2008) confined four regions which we re-examined in our broader sample:
-
1.
the innermost plasma disk,
-
2.
outer plasma disk,
-
3.
plasma sheet (at radii 7–16 ),
-
4.
and the hot outer magnetosphere reaching out to the magnetopause.
The latter region has been tagged as “magnetic cushion” recently (Delamere et al. (2015)), as the processes between the current sheet and the magnetopause are not well understood in case of Saturn. The cushion behaves like a reservoir of magnetic flux balancing the centrifugal and mechanical stress when the magnetodisc re-structures itself dynamically under the variable solar wind conditions.
When the spacecraft entered any of these magnetospheric regions, the magnetometer (MAG) and plasma instrument (CAPS) displayed some characteristics that are summarized in Table 1. The features represent a very rough indication and are based upon the comparison of many orbits.
| MAG | CAPS | |
|---|---|---|
| solar wind | 0.5 – 1.5 nT | cm-3, stable |
| km/s | ||
| magnetopause | abrupt rise to 4–5 nT | abrupt drop by 10–100 |
| sharp kink to negative | upward jump by 10 | |
| magnetic cushion | co-rotating | cm-3, fluctuating |
| km/s, unstable | ||
| plasma sheet | all -components const. | small rise, less fluctuating |
| low variance of , stable | small drop | |
| outer plasma disk | ( first minimum) | exceeding 1 cm-3 |
| eV/cm-3 | ||
| inner plasma disk | ( second minimum) | cm-3 |
| rising by factor 5–10 |
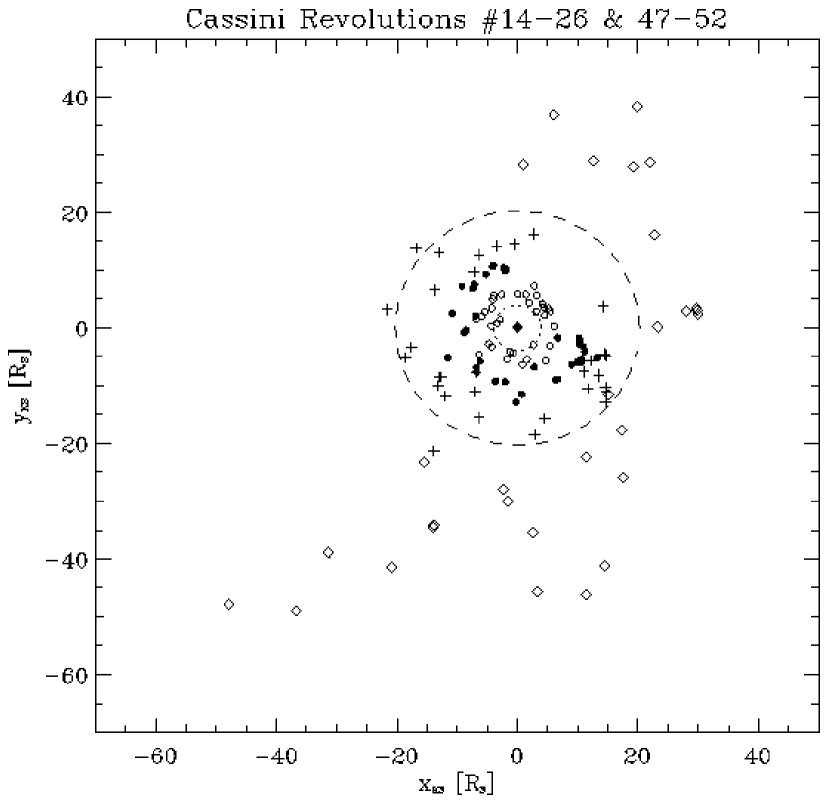
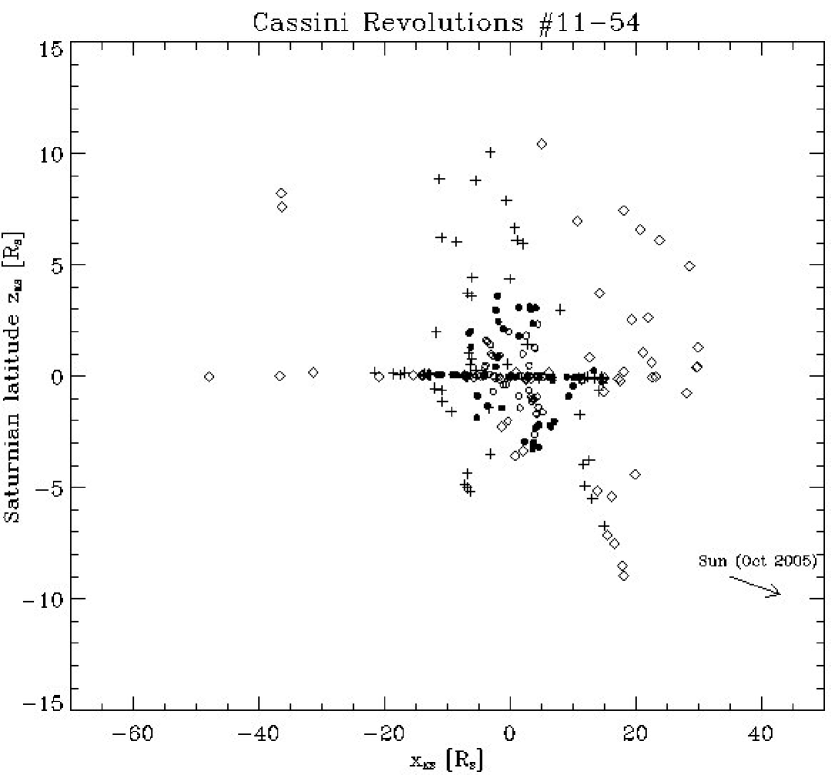
Figure 2 displays the points of entering and leaving the respective region during the Revolutions #15–26 and #47–53, as Cassini flew its first two bunches of equatorial orbits (inclination ). In an edge-on view, Figure 3 shows these features for all Revolutions (#11–54). The Sun reduced its angle of illumination from (arrow) to during the time span considered in this study (mid-2005 to 2007).
5 Examples of dust clouds
We searched the whole data sample for patterns that repeatedly appeared in three or more subsequent revolutions. Particularly, we put our focus on dust particles of the CDA. An intriguing pattern was presented by Khalisi et al. (2015) for the Revolutions 26–29. Here, we revisit that data and supplement the evidence in the scope of additional instruments.
5.1 Three-peaked dust pattern at Rev. 26–29
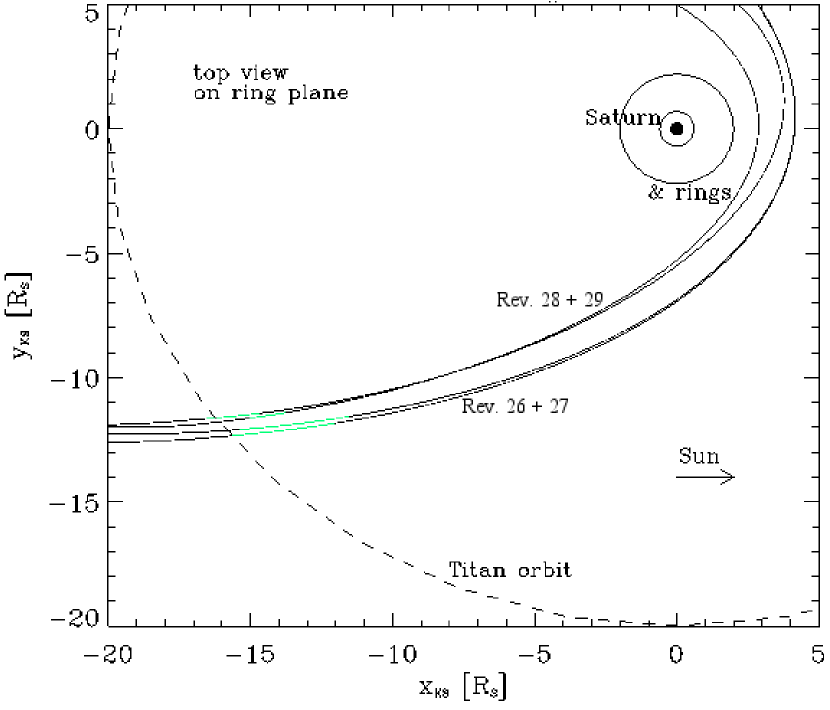
Cassini approached its perikronium in Revolution #26 down from the magnetotail, while the magnetic field was rather quiet (5 nT), but slowly rising when approaching the inner regions. In the far-off space beyond 20 , Arridge et al. (2009) identified several crossing events of the current sheet. On DOY 203.02 of 2006 a very close flyby of Titan (T16, distance: 950 km) took place. This passage was accompanied by a vigorous disturbance in all instruments (Figure 5). The magnetic data clearly shows how Cassini crossed the moon’s induced ionosphere. Right after the passage, the spacecraft changed its sequence of equatorial orbits and set in for a number of inclined orbits. On four consecutive revolutions, #26–29, it traversed almost the same spot in the Saturnian space (Fig. 4). On the first of these (#26), the ring plane of Saturn was crossed about two hours after that Titan flyby (DOY=203.11).
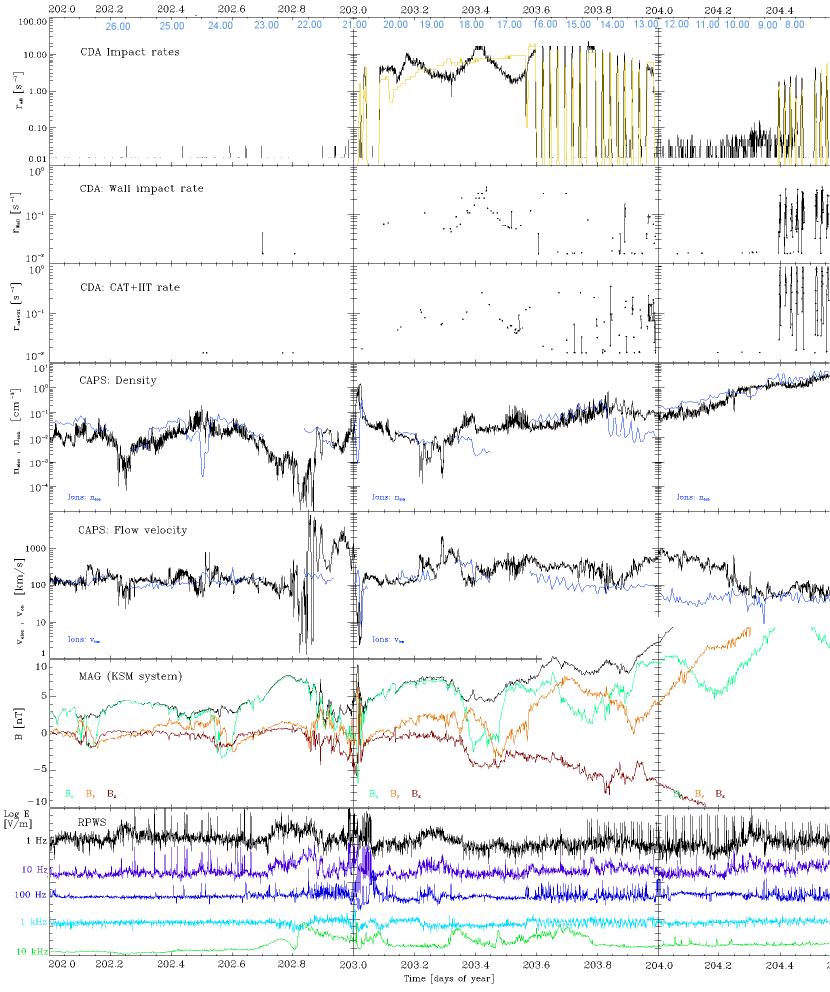
Then the CDA data revealed three conspicuous peaks of impacting particles at DOY 203.17, 203.41, and a broad one around 203.70 (Fig. 5). The latter one happened during the communication period with Earth, when the probe carried out “rolls” while scanning the sky for dust impacts. From the second and third panel of Figure 5 it is seen that twice as much impacts were registered on the instrument housing (so-called “Wall events”) than on the main sensitive area (“CAT + IIT events”). That means that most particles entered the device from a direction deviating from the Kepler-RAM. The ratio of both rates would reflect the angle between the two flows:
| (1) |
A rough estimate yields that the particle cloud drifts toward relative to the Kepler-RAM. Here, we accumulated the few available data
points between 203.30 and 203.55 to intervals of 30 min and computed the averages. The second dust peak coincides with a perturbation of the magnetic field, as can be seen in the sixth panel of Figure 5. It is also conceivable that a magnetic compression region, filled with dust particles, could have passed the spacecraft.
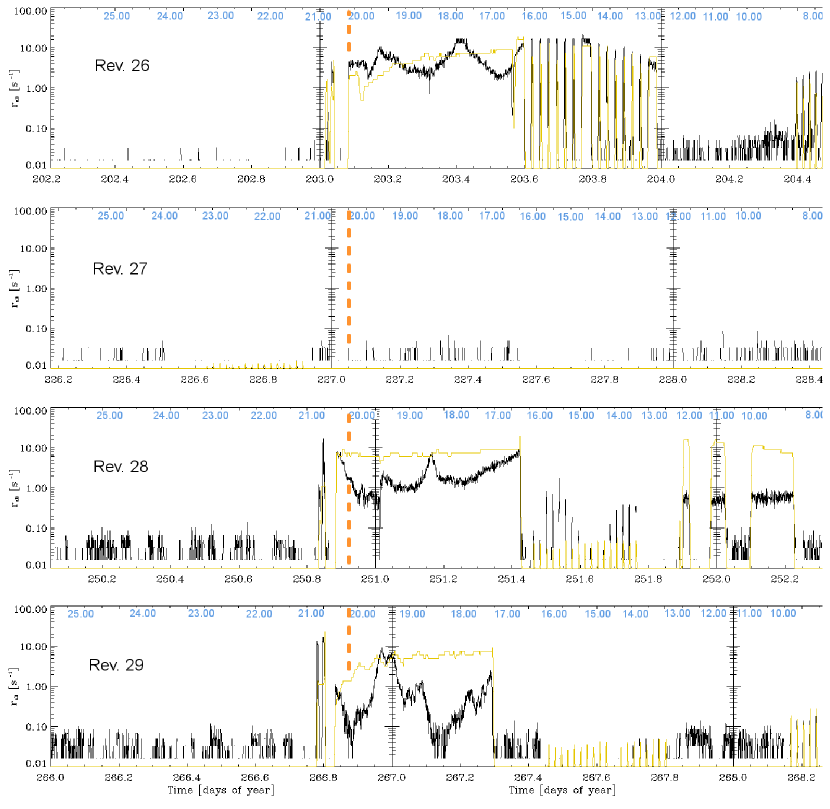
A comparison of the dust rates for the subsequent Cassini revolutions is shown in the next Figures. The second panel of Fig. 6 reveals that the CDA pointed to an unsuitable direction, away from the Kepler-RAM. A few “accidental” impacts still made it for measurement in the time period under consideration, i.e. from 227.10 to 227.55. An enhancement of dust particles can be sensed.
At the third return to that same spot of space (third panel of Fig. 6), the signals resembled those of Revolution #26 again. The three-peaked pattern can be identified at DOY = 251.02, 251.16, and 251.65. Finally, at Revolution #29, the orbit inclination of the spacecraft had already been increased by some , thus, Cassini must have transited the Southern parts of that dust cloud.
Examining the two front peaks separately, one finds that both have experienced an apparent compression and moved outwards (Tab. 2). The prior peak was squeezed by factor of 3, and the later by 1.5.
| Minimum | Maximum | Minimum | Maximum | Minimum | |
|---|---|---|---|---|---|
| T26= | 203.14 | 203.175 | 203.31 | 203.41 | 203.525 |
| d26= | 19.90 | 19.64 | 18.60 | 17.80 | 16.86 |
| T28= | 251.01 | 251.02 | 251.08 | 251.16 | 251.24 |
| d28= | 19.65 | 19.58 | 19.15 | 18.56 | 17.96 |
The second peak seems to approach faster, pushing the prior. The front side of the first pile appears steep in Revolution 26, while its tail runs out shallower. But then, in Revolution 28, the second pile compresses the forerunning and could possibly have merged into it by the time of Revolution #29. Since the spacecraft changed its orbit inclination, it would have traversed a different part of that cloud then. From the time stamps of entering and leaving the cloud, the extent of both patterns can be estimated to 82,500 km or 1.36 .
5.2 Pulsating magnetosphere at Rev. 15–18
A magnetic reconnection event in the magnetosphere was observed during the Revolutions #15–18 in late 2005. We claim that the process persisted for several days and left behind disrupted plasmoids. The data of three consecutive revolutions resemble a “respirating magnetopause”. The relicts of that process stayed as long as 35 days – much longer than the reconnection events we would expect from Earth’s magnetosphere.
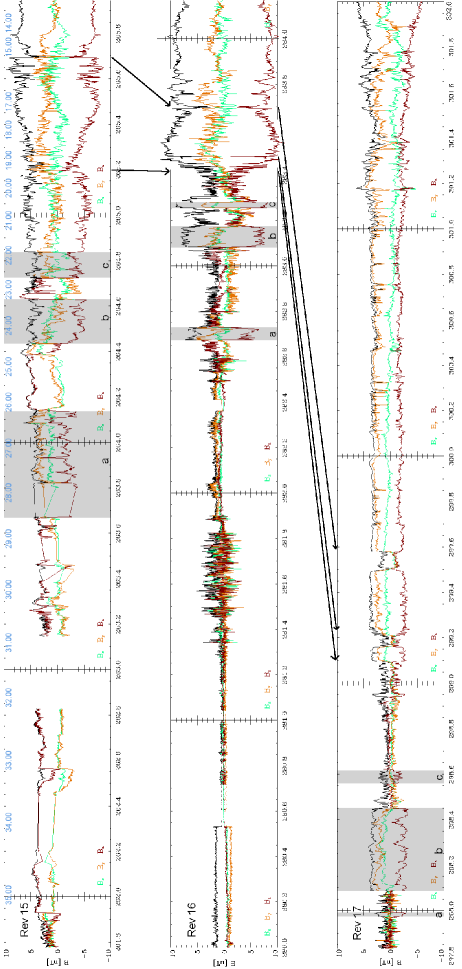
The three panels of Figure 7 show the magnetic field data of the Revolutions #15–17, and they are adjusted to the distance scale, which is given at the uppermost axis in blue ticks. Cassini was in the equatorial plane with the line of its apoapsis pointing to the dawn side. It passed almost the same spot of the Saturnian coordinate space for the next five revolutions. The spacecraft had already struck the magnetosphere at distance 37.77 on DOY = 260.98 (not shown here). The -component had switched from positive to negative values of nT at various times (shaded gray and marked with letters a, b, and c), before remaining negative at distance = 22.65 on DOY = 264.72. This marked the final entering into the magnetosphere.
At the next return (#16, middle panel), most of the positive -regions turned to segments of high magnetic turbulence. They are still visible in the intervals between the gray areas; the most conspicuous one appeared still reconnecting during DOY 281. The gray areas became detached plasmoids in a compressed magnetic field with their negative -component still conserved inside the loop. A new magnetopause started re-forming further inside between = 21.50 and 19.50 during DOY 283. The highest spikes of the -component evolved to new cut-offs for two more plasmoids that would be visible at the next Revolution (indicated by arrows in Fig. 7).
At the third return (Rev. 17, bottom panel), the interplanetary magnetic field had created new ambient conditions and made the magnetosphere cause a vast expansion. That solitary plasmoid of DOY = 282.70 had shifted by more than 10 outward to DOY = 297.97, and faded. Other plasmoids were stretched and weakened, while the new magnetopause established at = 29.16 (DOY = 299.59).
The process of restoration of the magnetopause was still continuing in the subsequent Revolution, #18. In Figure 8 we show the pulsation in a top-view on the equatorial plane. From the numbers accompanying the entry positions (diamonds) into the magnetosphere, it is seen how that boundary contracted and bounced back again at Revolutions #18 and 19.
The procedure of re-organizing would normally take place within a few hours or be completed within a day, at most. Therefore it looms unusual
that such magnetic relicts could remain for several days, as shown here. As Fuselier et al. (2014) point out, reconnection events are identified by two important aspects: First, their location of occurence (planetomagnetic latitude) – this characterizes the type of reconnection in terms of the shear angle between the magnetosheath and the planet’s magnetic field at the reconnection site. And second, heated streaming electrons in the magnetosheath near the magnetopause; the electron detectors draw an abrupt change of the density and temperature when passing the magnetopause. Our explanation of these long-lasting plasmoids (gray areas in Fig. 7) was rather interpreted as partial crossings of the magnetopause by the spacecraft.
In general, our scenario disagrees with Bagenal & Delamere (2011) who estimate the outflow of plasma from Saturn’s magnetodisc within one planetary rotation or less than day. Therefore, we cannot exclude being erroneous and dealing with a different mechanism than suggested here. However, the similarity of the features in the shaded areas as well as the turbulence inbetween appear remarkable. The patterns seem to repeat in the Revolutions #15–17, and make us suggest the same magnetic environment.
5.3 Dust-filled clouds and evacuated holes
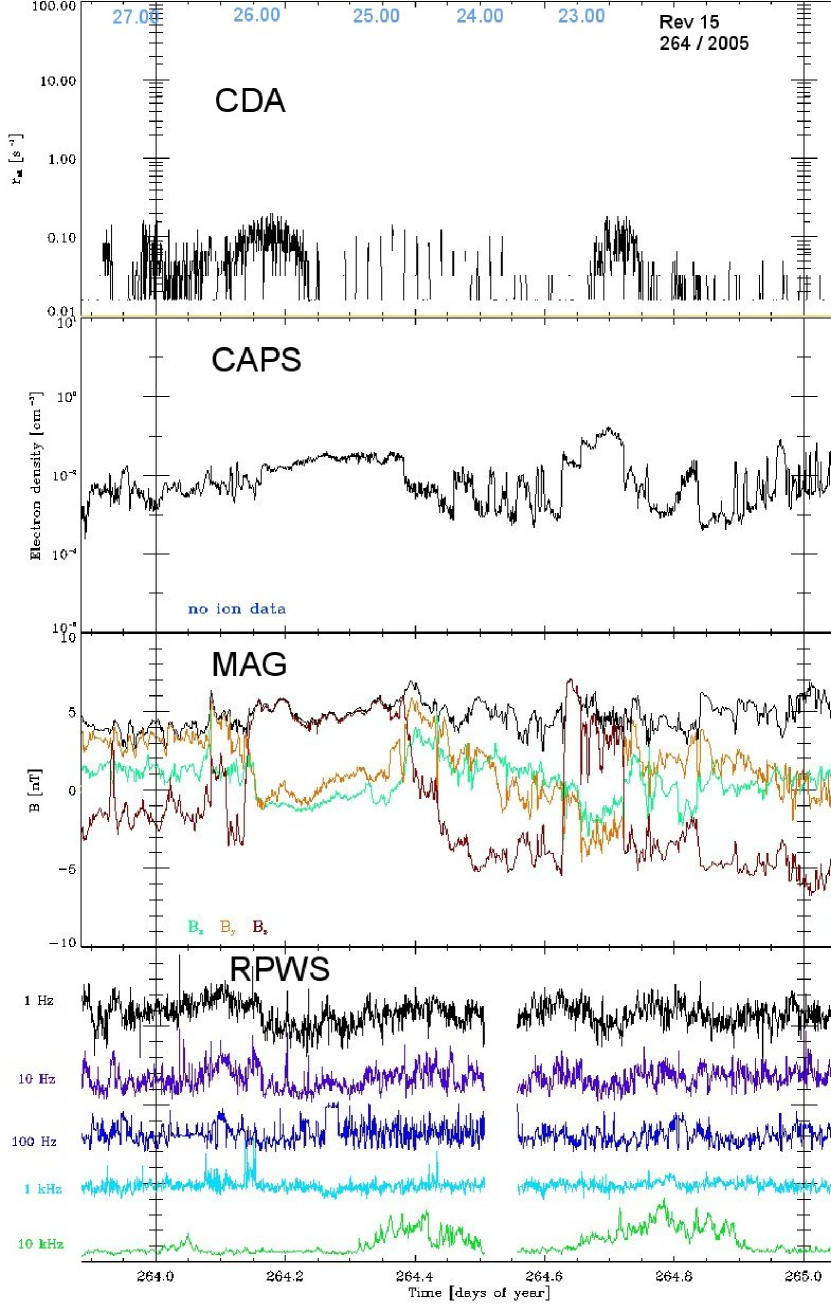
Figure 9 reprises the initial conditions of the reconnection process in Revolution #15 in a multi-instrument view. In the uppermost panel, dust particles gather in those two blobs at DOY 264.15–.23 and 264.67–.75, respectively. Their impact direction is non-Keplerian, as the pointing of the CDA (yellow line) is zero. The electron density (second panel) exhibits high values matching the temperature of the solar wind; the magnetic cushion of Saturn is usually colder than these measurements. The compression of the magnetic sheath can also lead to higher thermal electrons, however, also suggesting an incipient interaction with the solar wind. These enhancements of dust and electrons coincide with a northward component of the magnetic field (third panel, red line); this component will be reconnecting and diminishing thereafter. The relicts are visible in the next orbit (middle panel of Figure 7 at DOY=282.55 and 282.76). The 10-kHz-radio signal of RPWS (green line, bottom panel) beacons to strong energetic activity. Both events are an example for a “dust-filled plasmoid” indicating a relationship of ionized nano particles with the magnetic field.
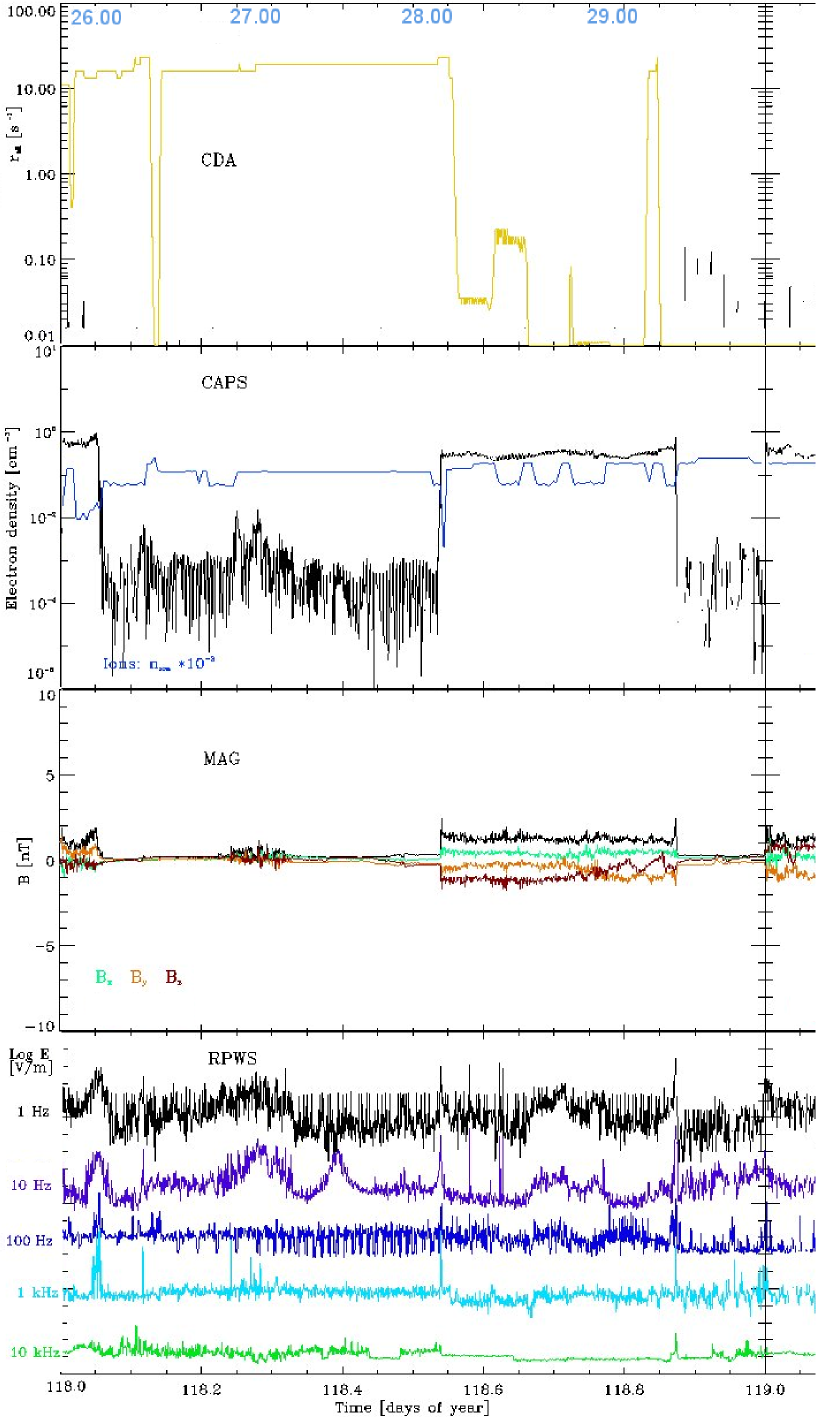
The opposite would be some kind of an “evacuated plasmoid” and is presented in Figure 10. On DOY 117/2007, Cassini was on its Revolution #43, a highly inclined orbit on the evening side of Saturn. It had left the magnetosphere on its outbound leg and was about 10 above the ring plane. In the midst of the solar wind, there appeared patches of extremely low magnetic field: The first is seen at DOY = 118.06 with relicts of a magnetic turbulence centered on time stamp DOY = 118.28, and the second one starting at 118.88 till the end of the day. The CDA shows no dust impacts, except a few solitary hits. However, the pointing was excellent towards the Kepler-RAM and off, again. CAPS also suggests two hole-like features with the electron density (blue line) being depleted by three orders of magnitude. A comparison of the MAG-data revealed that the -component had a similar northward orientation, as discussed in the section above, at the respective locations during the previous orbit.
6 Discussion
The dust cloud of Revolutions #26–29 seemed to drift at a velocity of 10–14 m/s in space. Under the assumption that Enceladus is the most significant source for permanently pouring solid material into the Saturnian space, such a cloud would need about 2.5 years to migrate from its origin to the scene of observation (Khalisi et al. (2015)). The frequent transits of the icy moons like Tethys, Dione, and Rhea would quickly have torn apart such a structure. The particles would be distributed along the way or stick to the surfaces of these moons. Various other effects like shock waves, gravitational drags, evaporation, and Kepler shear will also lead to a fast disruption of the cloud on the orbital time scale. Only debris larger than mm in size may survive, though such large particles are not recorded.
Along with the example of a dust-filled magnetic plasmoid, we suggest the following mechanism: Nano-sized dust particles are ionized at their origin, which would be the orbit of Enceladus. This would happen due to UV-radiation or energetic jet streams. The particles become trapped inside a “magnetic cage”. Then, they will be pushed down the magnetic flow as in the model of two-cell convection by Gurnett et al. (2007).
Leaving behind the plasma sheet at 17 , these “cages” become isolated and turn into “plasmoids” as introduced by Goertz (1983). The plasmoids would carry the pack of tiny particles all the way through the magnetic cushion. Beyond the magnetopause they are subject to reconnection effects with the northward-oriented component of the solar magnetic field. The plasmoids burst and liberate their interior. As the swarm disrupts, the nano-particles get integrated into the ambient medium. The smallest particles vanish first, while the inert ones stay for as long as 40 days, as shown in Figure 6.
Jackman et al. (2014) listed some 100 plasmoids and other features in the magnetotail during 2006. Most of them lasted a few minutes, and the longest 1.5 h. The authors consider an underestimation of the plasmoid size by a factor of 4–8. Our particular dust enhancement of Figures 5 and 6 is not connected to any of their incidents. The large-scale comparison of orbits leaves us with data being almost 20 days apart. This is usually far too long for plasmoids to exist, therefore, we cannot present unambiguous footage, but a suggestion to further work.
It may be noteworthy that Krüger et al. (2010) also reported of surprisingly high impact rates of dust at Jupiter, when the Galileo spacecraft was occasionally at far-off distances from the planet. Being outside of the Jovian magnetosphere at 280 or 0.13 Astronomical Units, an enhanced dust emission was seen and interpreted as signatures from the innermost Galilean Moon Io or its torus, respectively. That period coincided with neutral gas production from the Io torus, such that the dust particles would couple to both the gas and the magnetic field. However, the coupling mechanism was not know in detail.
An analogy can be drawn to a Coronal Mass Ejection (CME) that contains hot ions from the solar atmosphere or a prominence, in particular. As Ragot & Kahler (2003) pointed out, the electromagnetic force becomes most effective for particles smaller than 100 nm in size (their Figure 2). At the planetary distances analyzed by us, the magnetic field is much too weak for retaining the larger particles. But in the immediate vicinity of Saturn, 2 , the electrostatic interaction prevails, as the phenomenon of the dark spokes on the rings of Saturn show (Grün et al. (1992)). There, even micro-sized particles are caught by the strong magnetic field and forced to shift their motion.
In this paper, we suggested a heuristic mechanism that would carry a swarm of tiny particles over large distances through the magnetosphere of Saturn. However, not everybody supports the results presented here. A detailed mathematical model will be necessary to verify that view. The data of the CDA does provide the empirical basis for this. Even more such cases as in Figure 6 may be hidden in the legacy of Cassini and await their discovery.
Acknowledgments
We thank the Klaus Tschira Foundation, Heidelberg, for the financial support for this study from 2010 to 2013. The Max-Planck-Institute for Nuclear Physics, Heidelberg, enabled to finish the work. Thanks also to Jeffrey Kopmanis, Uni Michigan, for the help with the MAPSview data base; Harald Krüger and Norbert Krupp for discussions; and the referees for their critical comments that led to significant changes.
References
References
- Achilleos et al. (2008) Achilleos N., Arridge C.S., Bertucci C., Jackman C.M., Dougherty M.K., Khurana K.K., Russell, C.T.: ”Large-scale dynamics of Saturn’s Magnetopause: Observations by Cassini”, Journal of Geophysical Research 113, A11209, 2008; doi: 10.1029/2008JA013265
- André et al. (2008) André N., Blanc M., Maurice S., Schippers P., Pallier E., Gombosi T.I., Hansen K.C., Young D.T., Crary F.J., Bolton S., Sittler E.C., Smith H.T., Johnson R.E., Baragiola R.A., Coates A.J., Rymer A.M., Dougherty M.K., Achilleos N., Arridge C.S., Krimigis S.M., Mitchell D.G., Krupp N., Hamilton D.C., Dandouras I., Gurnett D.A., Kurth W.S., Louarn P., Srama R., Kempf S., Waite H.J., Esposito L.W., Clarke J.T.: ”Identification of Saturn’s Magnetospheric Regions and Associated Plasma Processes”, Reviews of Geophysics 46, RG4008, 2008; doi: 10.1029/2007RG000238
- Arridge et al. (2007) Arridge C.S., Russell C.T., Khurana K.K., Achilleos N., André N., Rymer A.M., Dougherty M.K., Coates A.J.: ”Mass of Saturn’s magnetodisc: Cassini observations”, Geophysical Research Letters 34, L09108, 2007; doi: 10.1029/2006GL028921
- Arridge et al. (2009) Arridge C.S., McAndrews H.J., Jackman C.M., Forsyth C., Walsh A.P., Sittler E.C., Gilbert L.K., Lewis G.R., Russell C.T., Coates A.J., Dougherty M.K., Collinson G.A., Wellbrock A., Young D.T.: ”Plasma electrons in Saturn’s magnetotail: Structure, distribution and energisation”, Planetary and Space Science 57, 2032–2047, 2009; doi: 10.1016/j.pss.2009.09.007
- Bagenal & Delamere (2011) Bagenal F. & Delamere P.A. (2011): ”Flow of mass and energy in the magnetospheres of Jupiter and Saturn”, Journal of Geophysical Research 116, A05209, 2011; doi: 10.1029/2010JA016294
- Banaszkiewicz & Krivov (1997) Banaszkiewicz M. & Krivov A.V.: ”Hyperion as a Dust Source in the Saturnian System”, Icarus 129, p289–303, 1997; doi: 10.1006/icar.1997.5781
- Bertucci et al. (2011) Bertucci C., Duru F., Edberg N., Fraenz M., Martinecz C., Szego K., Vaisberg O.: ”The Induced Magnetospheres of Mars, Venus, and Titan”, Space Science Reviews 162, p113–171, 2011; doi: 10.1007/s11214-011-9845-1
- Bridge et al. (1981) Bridge H.S., Belcher J.W., Lazarus A.J., Olbert S., Sullivan J.D., Bagenal F., Gazis P.R., Hartle R.E., Ogilvie K.W., Scudder J.D., Sittler E.C., Eviatar A., Siscoe G.L., Goertz C.K., Vasyliunas V.M.: ”Plasma Observations Near Saturn: Initial Results from Voyager 1”, Science 212, p217–224, 1981; doi: 10.1126/science.212.4491.217
- Bridge et al. (1982) Bridge H.S., Bagenal F., Belcher J.W., Lazarus A.J., McNutt R.L., Sullivan J.D., Gazis P.R., Hartle R.E., Ogilvie K.W., Scudder J.D., Sittler E.C., Eviatar A., Siscoe G.L., Goertz C.K., Vasyliunas V.M.: ”Plasma Observations Near Saturn: Initial Results from Voyager 2”, Science 215, p563–570, 1982; doi: 10.1126/science.215.4532.563
- Burch et al. (2007) Burch J.L., Goldstein J., Lewis W.S., Young D.T., Coates A.J., Dougherty M.K., André N.: ”Tethys and Dione as Sources of outward-flowing plasma in Saturn’s magnetosphere”, Nature 447, p833–835, 2007; doi: 10.1038/nature05906
- Delamere et al. (2015) Delamere P.A., Otto A., Ma X., Bagenal F., Wilson R.J: ”Magnetic flux circulation in the rotationally diven giant magnetospheres”, Journal of Geophysical Research: Space Physics 120, p4229–4245; doi: 10.1002/2015JA021036
- Frank et al. (1980) Frank L.A., Burek B.G., Ackerson K.L., Wolfe J.H., Mihalov J.D.: ”Plasmas in Saturn’s Magnetosphere”, Journal of Geophysical Research 85, No. A11, p5695–5708, 1980; doi: 10.1029/JA085iA11p05695
- Fuselier et al. (2014) Fuselier S.A., Frahm R., Lewis W.S., Masters A., Mukherjee J., Petrinec S.M., Sillanpaa I.J.: ”The location of magnetic reconnection at Saturn’s magnetopause: A comparison with Earth”, Journal of Geophysical Research Space Physics 119, p2563–2578, 2014; doi: 10.1002/2013JA019684
- Galopeau & Lecacheux (2000) Galopeau P.H.M. & Lecacheux A.: ”Variations of Saturn’s radio rotation period measured at kilometer wavelengths”, Journal of Geophysical Research 105, No. A6, p13089–13102, 2000; doi: 10.1029/1999JA005089
- Goertz (1983) Goertz C.K.: ”Detached Plasma in Saturn’s Front Side Magnetosphere”, Geophysical Research Letters 10, p455–458, 1983; doi: 10.1029/GL010i006p00455
- Goldreich & Farmer (2007) Goldreich P. & Farmer A.J.: ”Spontaneous axisymmetry breaking of the external magnetic field at Saturn”, Journal of Geophysical Research 112, A05225, 2007; doi: 10.1029/2006JA012163
- Grün et al. (1992) Grün E., Goertz C.K., Morfill G.E., Havnes O.: ”Statistics of Saturn’s Spokes”, Icarus 99, p191–201, 1992; doi: 10.1016/0019-1035(92)90182-7
- Grün et al. (2004) Grün E., Dikarev V., Frisch P.C., Graps A., Kempf S., Krüger H., Landgraf M., Moragas-Klostermeyer G., Srama R.: “Dust in Interplanetary Space and in the Local Galactic Environment”, ASP Conference Series 309, 2004, p245–264; in: Astrophysics of Dust, Edited by Witt A.N., Clayton G.C., and Draine B.T., ISBN 978-1-58381-244-0
- Gurnett et al. (2007) Gurnett D.A., Persoon A.M., Kurth W.S., Groene J.B., Averkamp T.F., Dougherty M.K., Southwood D.J.: ”The Variable Rotation Period of the Inner Region of Saturn’s Plasma Disk”, Science 316, 2007, p442; doi: 10.1126/science.1138562
- Hartle et al. (1982) Hartle R.E., Sittler E.C., Ogilvie K.W., Scudder J.D., Lazarus A.J., Atreya S.K.: ”Titan’s Ion Exosphere Observed From Voyager 1”, Journal of Geophysical Research 87, A3, p1383–1394, 1982; doi: 10.1029/JA087iA03p01383
- Hill (1976) Hill T.W.: ”Interchange stability of a rapidly rotating magnetosphere”, Planetary and Space Science 24, p1151–1154, 1976; doi: 10.1016/0032-0633(76)90152-5
- Hill et al. (2008) Hill T.W., Thomsen M.F., Henderson M.G., Tokar R.L., Coates A.J., McAndrews H.J., Lewis G.R., Mitchell D.G., Jackman C.M., Russell C.T., Dougherty M.K., Crary F.J., Young D.T.: ”Plasmoids in Saturn’s magnetotail”, Journal of Geophysical Research 113, A01214, 2008; doi: 10.1029/2007JA012626
- Jackman et al. (2014) Jackman C.M., Slavin J.A., Kivelson M.G., Southwood D.J., Achilleos N., Thomsen M.F., DiBraccio G.A., Eastwood J.P., Freeman M.P., Dougherty M.K., Vogt M.F.: ”Saturn’s dynamic magnetotail: A comprehensive magngetic field and plasma survey of plasmoids”, Journal of Geophysical Research 119, 5465–5494, 2014; doi: 10.1002/2013JA019388
- Kennedy et al. (2011) Kennedy G.M., Wyatt M.C., Su K.Y.L., Stansberry J.A.: ”Searching for Saturn’s dust swarm: limits on the size distribution of irregular satellites from km to micron sizes”, Monthly Notices RAS 417, p2281–2287, 2011; doi: 10.1111/j.1365-2966.2011.19409.x
- Khalisi et al. (2015) Khalisi E., Srama R., Grün E.: ”Counter data of the Cosmic Dust Analyzer aboard the Cassini spacecraft and possible ’dust clouds’ at Saturn”, Advances in Space Research 55, p303–310, 2015; doi: 10.1016/j.asr.2014.09.002
- Krivov & Banaszkiewicz (2001) Krivov A.V. & Banaszkiewicz M.: ”Unusual origin, evolution and fate of icy ejecta from Hyperion”, Planetary and Space Science 49, p1265–1279, 2001; doi: 10.1016/S0032-0633(01)00069-1
- Krüger et al. (2010) Krüger H., Bindschadler D., Dermott S.F., Graps A.L., Grün E., Gustafson B.A., Hamilton D.P., Hanner M.S., Horányi M., Kissel J., Linkert D., Linkert G., Mann I., McDonnell J.A.M., Moissl R., Morfill G.E., Polanskey C., Roy M., Schwehm G., Srama, R.: ”Galileo dust data from the jovian system: 2000 to 2003”, Planetary and Space Science 58, p965-993, 2010; doi: 10.1016/j.pss.2010.03.003
- Porco et al. (2006) Porco C.C., Helfenstein P., Thomas P.C., Ingersoll A.P., Wisdom J., West R., Neukum G., Denk T., Wagner R., Roatsch T., Kieffer S., Turtle E., McEwen A., Johnson T.V., Rathbun J., Veverka J., Wilson D., Perry J., Spitale J., Brahic A., Burns J.A., Del Genio A.D., Dones L., Murray C.D., Squyres S.: ”Cassini Observes the Active South Pole of Enceladus”, Science 311, p1393–1401, 2006; doi: 10.1126/science.1123013
- Ragot & Kahler (2003) Ragot B.R. & Kahler S.W.: ”Interactions of Dust Grains with Coronal Mass Ejections and Solar Cycle Variations of the F-Coronal Brightness”, The Astrophysical Journal 594, p1049–1059, 2003; doi: 10.1086/377076
- Sittler et al. (1983) Sittler E.C. jr., Ogilvie K.W., Scudder J.D.: ”Survey of Low-Energy Plasma Electrons in Saturn’s Magnetosphere: Voyagers 1 and 2”, Journal of Geophysical Research 88, p8847–8870, 1983; doi: 10.1029/JA088iA11p08847
- Szego et al. (2005) Szego K., Bebesi Z., Erdos G., Foldy L., Crary F., McComas D.J., Young D.T., Bolton S., Coates A.J., Rymer A.M., Hartle R.E., Sittler E.C., Reisenfeld D., Bethelier J.J., Johnson R.E., Smith H.T., Hill T.W., Vilppola J., Steinberg J., Andre N.: ”The global plasma environment of Titan as observed by Cassini Plasma Spectrometer during the first two close encounters with Titan”, Geophysical Research Letters 32, L20S05, 2005, doi: 10.1029/2005GL022646