On the origin of the shallow and “replica” bands in FeSe monolayer superconductors
On the origin of the shallow and “replica” bands in FeSe monolayer superconductors
I. A. Nekrasov, N. S. Pavlov, M. V. Sadovskii
I. A. Nekrasov, N. S. Pavlov, M. V. Sadovskii
I. A. Nekrasov, N. S. Pavlov, M. V. Sadovskii
On the origin of the shallow and “replica” bands in FeSe monolayer superconductors
Abstract
We compare electronic structures of single FeSe layer films on SrTiO3 substrate (FeSe/STO) and KxFe2-ySe2 superconductors obtained from extensive LDA and LDA+DMFT calculations with the results of ARPES experiments. It is demonstrated that correlation effects on Fe-3d states are sufficient in principle to explain the formation of the shallow electron – like bands at the M(X)-point. However, in FeSe/STO these effects alone are apparently insufficient for the simultaneous elimination of the hole – like Fermi surface around the -point which is not observed in ARPES experiments. Detailed comparison of ARPES detected and calculated quasiparticle bands shows reasonable agreement between theory and experiment. Analysis of the bands with respect to their origin and orbital composition shows, that for FeSe/STO system the experimentally observed “replica” quasiparticle band at the M-point (usually attributed to forward scattering interactions with optical phonons in SrTiO3 substrate) can be reasonably understood just as the LDA calculated Fe-3dxy band, renormalized by electronic correlations. The only manifestation of the substrate reduces to lifting the degeneracy between Fe-3dxz and Fe-3dyz bands in the vicinity of M-point. For the case of KxFe2-ySe2 most bands observed in ARPES can also be understood as correlation renormalized Fe-3d LDA calculated bands, with overall semi – quantitative agreement with LDA+DMFT calculations.
71.20.-b, 71.27.+a, 71.28.+d, 74.70.-b
1 Introduction
The discovery of high-temperature superconductivity in iron pnictides (see reviews [1, 2, 3, 4, 5, 6] was almost immediately followed by the observation of rather low temperature ( 8K) superconductivity in iron chalcogenide FeSe, with electronic structure quite similar to that of iron pnictides (see review [7]).
Further success in creation of intercalated FeSe based systems with rather high 30-40K (see review in [8, 9]) quickly made them popular objects of investigations because of their different electronic structure [10, 11].
Most impressive results were achieved with the growth of epitaxial films of single FeSe monolayer on 001 plane of Sr(Ba)TiO3 (STO) substrate with record breaking values in the range of 65–85 K [12, 13] (or probably up to 100 K [14]). The general theoretical and experimental situation in these rapidly developing field of research was described in recent reviews [9, 15].
ARPES measurements [16] in FeSe/STO monolayer system demonstrated rather unusual band structure, characterized by the absence of hole – like bands at the center of Brillouin zone (-point), with rather shallow electronic band at the M-point with very low Fermi energies of the order of 50 meV, accompanied by the formation of “replica” of this band about 100 meV below in energy. Similar unusually shallow bands were also observed at X-point in ARPES experiments on intercalated KxFe2-ySe2 system [17].
The existence of such peculiar bands rises many serious theoretical questions [9], such as probable considerable role of non adiabatic interactions [18, 19] and the possibility of observation of BCS-BEC crossover effects in these systems. In particular, the formation of the “replica” band in FeSe/STO is widely interpreted as being due to inteaction with high – energy ( 100 meV) optical phonons of Sr(Ba)TiO3 substrate [16] with some important conclusions on the possible role of these interactions for the significant enhancement of in this system [18, 19, 20, 21].
Further in this paper we compare the ARPES detected quasiparticle bands for FeSe/STO and KxFe2-ySe2 and compare them with the results of our LDA+DMFT calculations for these systems as well as for the isolated FeSe layer, together with the analysis of initial LDA bands [22]. Interaction parameters of the Hubbard model in LDA+DMFT were taken =5.0 eV, =0.9 eV for FeSe and FeSe/STO and =3.75 eV, =0.56 eV for KFe2Se2 (see the Supplemental Material [23], where we present further computational details).
2 FeSe/STO system
In Fig. 1 we compare the theoretical LDA+DMFT results on panels (a,d,e,h) with experimental ARPES data [16] on panels (b,c,f,g). LDA+DMFT spectral function maps of isolated FeSe monolayer are shown in Fig. 1(a) and Fig. 1(d) at and M points respectively. For FeSe/STO LDA+DMFT spectral function maps are shown on (e), (h) panels at and M points. The obtained LDA bandwidth of Fe-3d band in isolated FeSe monolayer is 5.2 eV, which is much larger than 4.3 eV that obtained for FeSe/STO. This is due to the lattice constant expanded from Å to Å in going from isolated FeSe monolayer to FeSe/STO. Thus for the same interaction strength and doping levels LDA+DMFT calculations show substantially different band narrowing due to correlation effects: a factor of 1.5 in isolated FeSe monolayer (same as bulk FeSe) and a factor of 3 in FeSe/STO. Thus FeSe/STO system is more correlated as compared with the bulk FeSe or isolated FeSe layer.
Most of features observed in the ARPES data (Fig. 1, panels (f),(g)) can be identified with our calculated LDA+DMFT spectral function maps (Fig. 1, panels (e),(h)). The experimental quasiparticle bands around M-point marked by , and (Fig. 1(g,h)) correspond mainly to Fe-3dxz and Fe-3dyz states, while the and quasiparticle bands have predominantly Fe-3dxy character. As we noted above the appearance of band in FeSe/STO is usually attributed to forward scattering interaction with 100 meV optical phonon of STO substrate [16, 18, 19, 20, 21]. However, our calculations show that band is most probably of purely electronic nature. Some puzzling behavior of this band can be explained by difficulties of experimental observations of the Fe-3dxy states near M-point (see Refs. [17, 24] and references therein, as well as discussion in Ref. [25] in the context of NaFeAs compound).
Thus, in FeSe/STO we observe the overall agreement between LDA+DMFT results (Fig. 1(h)) and ARPES data [16] (Fig. 1(g)) on semi-quantitative level with respect to relative positions of quasiparticle bands. Let us also note that the Fermi surfaces formed by the and bands in our LDA+DMFT calculations are nearly the same as the Fermi surface observed at M-point by ARPES.
The shallow band at M-point originates from LDA Fe-3dxz and Fe-3dyz bands (see also Fig. 2, right panel) compressed by electronic correlations. In the hope of achieving the better agreement with experiments we also examined the reasonable increase of Coulomb interaction within LDA+DMFT and the different doping levels, but these have not produced the significant improvement of our results.
The quasiparticle band near M-point appeared because of the lifting of degeneracy of Fe-3dxz and Fe-3dyz bands (in contrast to isolated FeSe layer, see panel Fig. 1(d)). The origin of this band splitting is related to the height difference below and above Fe ions plane due to the presence of interface with SrTiO3 (see Supplemental Material [23] for ion positions used in our calculations).
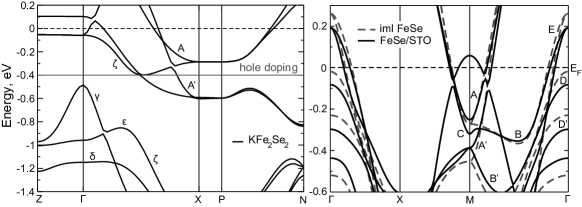
Actually, all quasiparticle bands in the vicinity of M-point can be well represented as LDA bands compressed by a factor of 3 due to electronic correlations. This fact is clearly supported by LDA band structure shown on the right panel of Fig. 2, where different bands are marked by letters identical to those used in Fig. 1.
Near the M-point we can also observe the O-2py band (in the energy interval below -0.2 eV (Fig. 1(h)) originating from TiO2 layer adjacent to FeSe. Due to doping level used here this O-2py band goes below the Fermi level in contrast to LDA picture shown in Fig. 2 (on the right) where O-2py band crosses the Fermi level and forms hole pocket. This observation rules out possible nesting effects which might be expected from LDA results [22].
Now let us discuss the bands around the -point, which are presented on panels (a,b,e,f) of Fig. 1. Here the situation is much simpler than in the case of M-point. One can see here only two bands observed in the experiment (Fig. 1(f)). The quasiparticle band has predominantly Fe-3dxy character, while the quasiparticle band originates from Fe-3d states. Again the relative locations of LDA+DMFT calculated and bands are quite similar to the ARPES data.
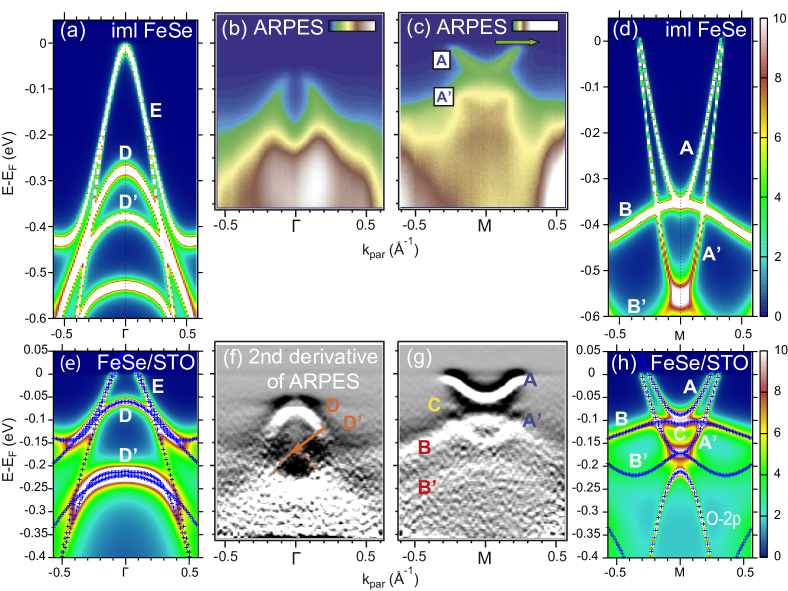
Main discrepancy of LDA+DMFT results and ARPES data is the band shown in Fig. 1(e) which is not observed in the ARPES. This band corresponds to a hybridized band of Fe-3dxz, Fe-3dyz and Fe-3dxy states. In principle some traces of this band can be guessed in the experimental data of Fig. 1(f) around -0.17 eV and near the -point 0.5. Surprisingly these are missed in the discussion of Ref. [16]. Actually, the ARPES signal from band can be weakened because of sizable Fe-3dxy contribution [17, 24, 25] and thus might be indistinguishable from band. Also one can imagine that for stronger band renormalization the band becomes more flat and might merge with band. Detailed orbital resolved LDA+DMFT spectral function maps showing the intensity of different orbital contributions are presented in Supplemental Material [23].
3 KFe2Se2 system
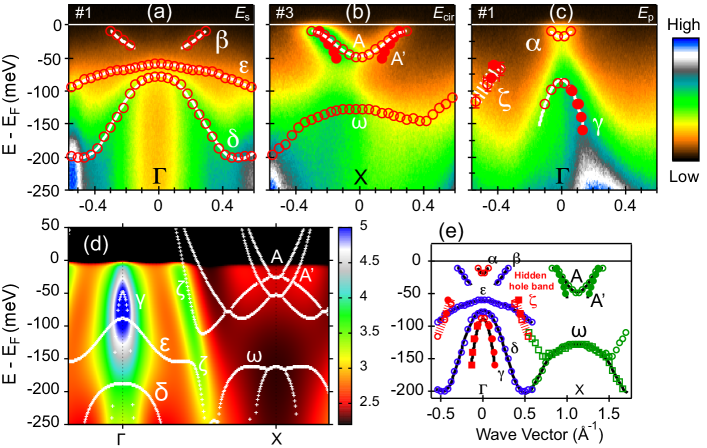
In Fig. 3 we present the comparison of LDA+DMFT spectral function maps (panel (d)) and ARPES data of Ref. [17] (panels (a,b,c,e)) for KxFe2-ySe2. Panels (a,b,c) of Fig. 3 correspond to different incident beam polarizations: – polarization in the plane parallel to the sample surface; – polarization in the plane normal to the sample surface; – circular polarization. The use of different polarizations allows one to distinguish contributions of bands with different symmetry (see discussion in Ref. [17, 25]). This fact is clearly seen in panels (a,b,c) of Fig. 3 where different bands are marked with Greek letters. In Fig. 3(e) we see the joint picture of all quasiparticle bands detected in ARPES [17] experiment.
Now we will try to explain the origin of the experimental bands and their orbital composition on the basis of LDA′ [26, 27, 28, 29] calculations for KFe2Se2 (Fig. 2, left panel) and LDA′+DMFT results (Fig. 3, panel (e)). In our LDA′+DMFT calculations the quasiparticle band near X-point corresponds to Fe-3dxz and Fe-3dyz states and the quasiparticle band near X-point is mainly formed by Fe-3dxy states. These bands are denoted in the same way as on left panel of Fig. 2. Thus the band corresponds to 50 meV shallow band typical for FeSe monolayer materials. Its “replica” band has Fe-3dxy symmetry and is strongly suppressed in the experiments of Ref. [17]. Actually, the authors of Ref. [17] emphasized that they can not obtain a signal from Fe-3dxy states. Thus both and bands are just the renormalized LDA′ bands (compare with left panel of Fig. 2). At about -0.15 eV at the X-point there is quasiparticle band which is formed only due to self-energy effects.
Now we turn to bands around -point. The and bands are formed by Fe-3d states. The band is rather strongly modified in comparison with the initial LDA′ band (see Fig. 2, left panel), while the band preserve the initial form rather well. Energy location of quasiparticle band agrees well for LDA′+DMFT and ARPES results. However, the band is much lower in energy in LDA′+DMFT. At the -point the band (which is the hybridized band of Fe-3dxz, Fe-3dyz and Fe-3dxy states) in LDA′+DMFT is above the and bands in contrast to ARPES data (Fig. 3(e)). This picture is somehow inherited from the initial LDA′ band structure (Fig. 2, left). The band (Fig. 3(e)) consists in fact of two bands. The upper part (above 130 meV) of this band is formed by Fe-3dxz and Fe-3dyz states, while the lower part is formed by Fe-3d states. In ARPES experiments this band is only partially observed around 80 meV (Fig. 3(e)), while its lower part is not distinguished experimentally from band [17].
The overall agreement between ARPES and LDA′+DMFT results for K0.76Fe1.72Se2 system is rather satisfactory and allows one to identify the orbital composition of different bands detected in the experiment. However and bands found in ARPES are not observed in our LDA′+DMFT spectral function maps. More so there are no obvious candidates for these bands within the LDA′ band structure (Fig. 2, left). Thus the origin of experimentally observed and quasiparticle bands remains unclear.
4 Conclusion
Our results essentially allow the understanding of the origin of the shallow band at the M-point in FeSe monolayer materials due to correlation effects on Fe-3d states only. The detailed analysis of ARPES detected quasiparticle bands and LDA+DMFT results shows that this shallow band is formed just by the degenerate Fe-3dxz and Fe-3dyz bands renormalized by correlations. Moreover the so called “replica” band observed in ARPES for FeSe/STO can be reasonably understood as the simple LDA renormalized Fe-3dxy band with no reference to interactions with optical phonons of STO. The influence of STO substrate in our calculations is reduced only to the removal of degeneracy of Fe-3dxz and Fe-3dyz bands in the vicinity of M-point. In the case of KxFe2-ySe2 most of ARPES detected bands can also be expressed as correlation renormalized Fe-3d LDA bands. Unfortunately correlation effects are unable to completely eliminate the hole Fermi surface at the -point, which is not observed in most ARPES experiments on FeSe/STO system. Note, however, that recently a small Fermi surface at the -point was observed in ARPES measurements on FeSe/STO at doping levels, corresponding to the highest values of [30].
5 Acknowledgements
This work was done under the State contract (FASO) No. 0389-2014-0001 and supported in part by RFBR grant No. 17-02-00015. NSP work was also supported by the President of Russia grant for young scientists No. Mk-5957.2016.2. The CT-QMC computations were performed at supercomputer “Uran” at the Institute of Mathematics and Mechanics UB RAS.
References
- [1] M.V. Sadovskii. Usp. Fiz. Nauk 178, 1243 (2008) [Physics Uspekhi 51, 1201 (2008)]
- [2] K. Ishida, Y. Nakai, H. Hosono. J. Phys. Soc. Jpn. 78, 062001 (2009)
- [3] D.C. Johnson. Adv. Phys. 59, 83 (2010)
- [4] P.J. Hirschfeld, M.M. Korshunov, I.I. Mazin. Rep. Prog. Phys. 74, 124508 (2011)
- [5] G.R. Stewart. Rev. Mod. Phys. 83, 1589 (2011)
- [6] A.A. Kordyuk. Fizika Nizkikh Temperatur 38, 1119 (2012) [Low Temperature Physics 38, 888 (2012)]
- [7] Y. Mizugushi, Y. Takano. J. Phys. Soc. Japan 79, 102001 (2010)
- [8] A. Krzton-Maziopa , J. Phys. Condens. Matter 28, 293002 (2016)
- [9] M.V. Sadovskii. Usp. Fiz. Nauk 186, 1035 (2016) [Physics Uspekhi 59, 947 (2016)]
- [10] M.V. Sadovskii, E.Z. Kuchinskii, I.A. Nekrasov. JMMM 324, 3481 (2010)
- [11] I.A. Nekrasov, M.V. Sadovskii. Pis’ma Zh. Eksp. Teor. Fiz. 99, 687 (2014) [JETP Letters 99, 598 (2014)]
- [12] Wang Qing-Yan , Chin. Phys. Lett. 29, 037402 (2012)
- [13] R. Peng , Nature Communications 5, 5044 (2014)
- [14] Jian-Feng Ge , Nature Materials 14, 285 (2015)
- [15] Xu Liu , J. Phys. Cond. Mat. 27, 183201 (2015)
- [16] J.J. Lee , Nature 515, 245 (2014)
- [17] M. Sunagawa , Journal of the Physical Society of Japan 85, 073704 (2016)
- [18] L.P. Gor’kov. Phys. Rev. B 93, 060507 (2016)
- [19] L.P. Gor’kov. Phys. Rev. B 93, 054517 (2016)
- [20] L. Rademaker , New J. Phys. 18, 022001 (2016)
- [21] Y. Wang , Supercond. Sci. Technol. 29, 054009 (2016)
- [22] I.A. Nekrasov, N.S. Pavlov, M.V. Sadovskii, A.A. Slobodchikov, Fizika Nizkikh Temperatur 42, 1137 (2016) [Low Temp. Phys. 42, 891 (2016)]
- [23] See Supplemental Material
- [24] M.D. Watson , Phys. Rev. B 91, 155106 (2015).
- [25] I.A. Nekrasov, N.S. Pavlov, M.V. Sadovskii, J. Supercond. Nov. Magn. 29, 1117 (2016); I.A. Nekrasov, N.S. Pavlov, M.V. Sadovskii, Pis’ma Zh. Eksp. Teor. Fiz. 102, 30 (2015) [JETP Letters 102, 26 (2015)]
- [26] I.A. Nekrasov, N.S. Pavlov, M.V. Sadovskii. Pis’ma Zh. Eksp. Teor. Fiz. 95, 659 (2012) [JETP Letters 95, 581 (2012)]
- [27] I.A. Nekrasov, N.S. Pavlov, M.V. Sadovskii. Zh. Eksp. Teor. Fiz. 143, 713 (2013) [JETP 116, 620 (2013)]
- [28] I.A. Nekrasov, N.S. Pavlov, M.V. Sadovskii. Pis’ma Zh. Eksp. Teor. Fiz. 97, 13 (2013); [JETP Letters 97, 18 (2013)]
- [29] I.A. Nekrasov, N.S. Pavlov, M.V. Sadovskii. Zh. Eksp. Teor. Fiz. 144, 1061 (2013) [JETP 117, 926 (2013)]
- [30] Y. Shi , ArXiv:1606.01470
Supplemental Material to the article “On the origin of the shallow and “replica” bands in FeSe monolayer superconductors”
In this Supplement we provide computational details and crystallographic data for FeSe based systems under consideration. Also here we present orbital resolved LDA+DMFT calculated quasipartical bands for these materials.
1 Computation details
The LDA′ calculations [S1, S2] of KFe2Se2 compound were performed using the Linearized Muffin-Tin Orbitals method (LMTO) [S3]. The electroning structures of FeSe monolayer and FeSe monolayer on SrTiO3 substrate were calculated within FP-LAPW method [S4].
For the DMFT part of LDA+DMFT calculations we employed CT-QMC impurity solver [S5, S6]. To define DMFT lattice problem for KFe2Se2 compound we used the full LDA Hamiltonian (i.e. without any orbitals downfolding or projecting) same as in Refs. [S7, S8]. For isolated FeSe layer and FeSe/STO projection on Wannier functions was done for Fe-3d and Se-4p states (isolated FeSe layer) and for Fe-3d, Se-4p states and O-2py states from TiO2 layer adjacent to SrTiO3 (FeSe/STO). Standard wien2wannier interface [S9] and wannier90 projecting technique [S10] were applied to this end.
The DMFT(CT-QMC) computations were done at reciprocal temperature (290 K) with about 108 Monte-Carlo sweeps. Interaction parameters of Hubbard model were taken =5.0 eV, =0.9 eV for isolated FeSe and FeSe/STO and =3.75 eV, =0.56 eV for KFe2Se2 [S11]. We employed the self-consistent fully-localized limit definition of the double-counting correction [S2]. Thus computed values of Fe-3d occupancies and corresponding double-counting energies are , (K0.76Fe1.72Se2), , (isolated FeSe layer), , (FeSe/STO).
2 Crystal structure
2.1 FeSe, FeSe/STO
The crystal structure of the bulk FeSe has tetragonal structure with the space group 4/ and lattice parameters Å, Å. The experimentally obtained crystallographic positions are the following: Fe(2a) (0.0, 0.0, 0.0), Se(2c) (0.0, 0.5, zSe), zSe=0.2343 [S14]. For LDA calculation of isolated FeSe layer the slab technique was applied with these crystallographic parameters.
The FeSe/STO crystal structure was taken from LDA calculation with crystal structure relaxation [S15]. FeSe monolayer was placed on three TiO2-SrO layers to model the bulk SrTiO3 substrate. The FeSe/STO slab crystal structure parameters are Å, Ti-Se distance Å, Fe-O distance Å, distance between top (bottom) Se ion and the Fe ions plane is 1.41 Å (1.3 Å). Atomic positions are: Sr – (0.5,0.5,-1.95 Å), O – (0.5,0,0), (0,0,-1.95 Å), Ti – (0,0,0).
LDA+DMFT calculations of FeSe/STO were performed for doping level of 0.2 electrons per Fe ion.
2.2 KFe2Se2
The ideal KFe2Se2 compound has tetragonal structure with the space group 4/ and lattice parameters Å and Å. The crystallographic positions are the following: K(2a) (0.0, 0.0, 0.0), Fe(4d) (0.0, 0.5, 0.25), Se(4e) (0.0, 0.5, zSe) with zSe=0.3539 [S16].
Chemical composition K0.76Fe1.72Se2 corresponds to the total number of electrons 26.52 per unit cell (the stoichiometric compound has total number of electrons equal to 29.0). Total number of electrons 26.52 per unit cell corresponds to the doping level of 1.24 holes per Fe ion. This doping level was taken for LDA′+DMFT calculations. Position of corresponding Fermi level at about -0.4 eV is shown on left panel of Fig. 2 (main part of article).
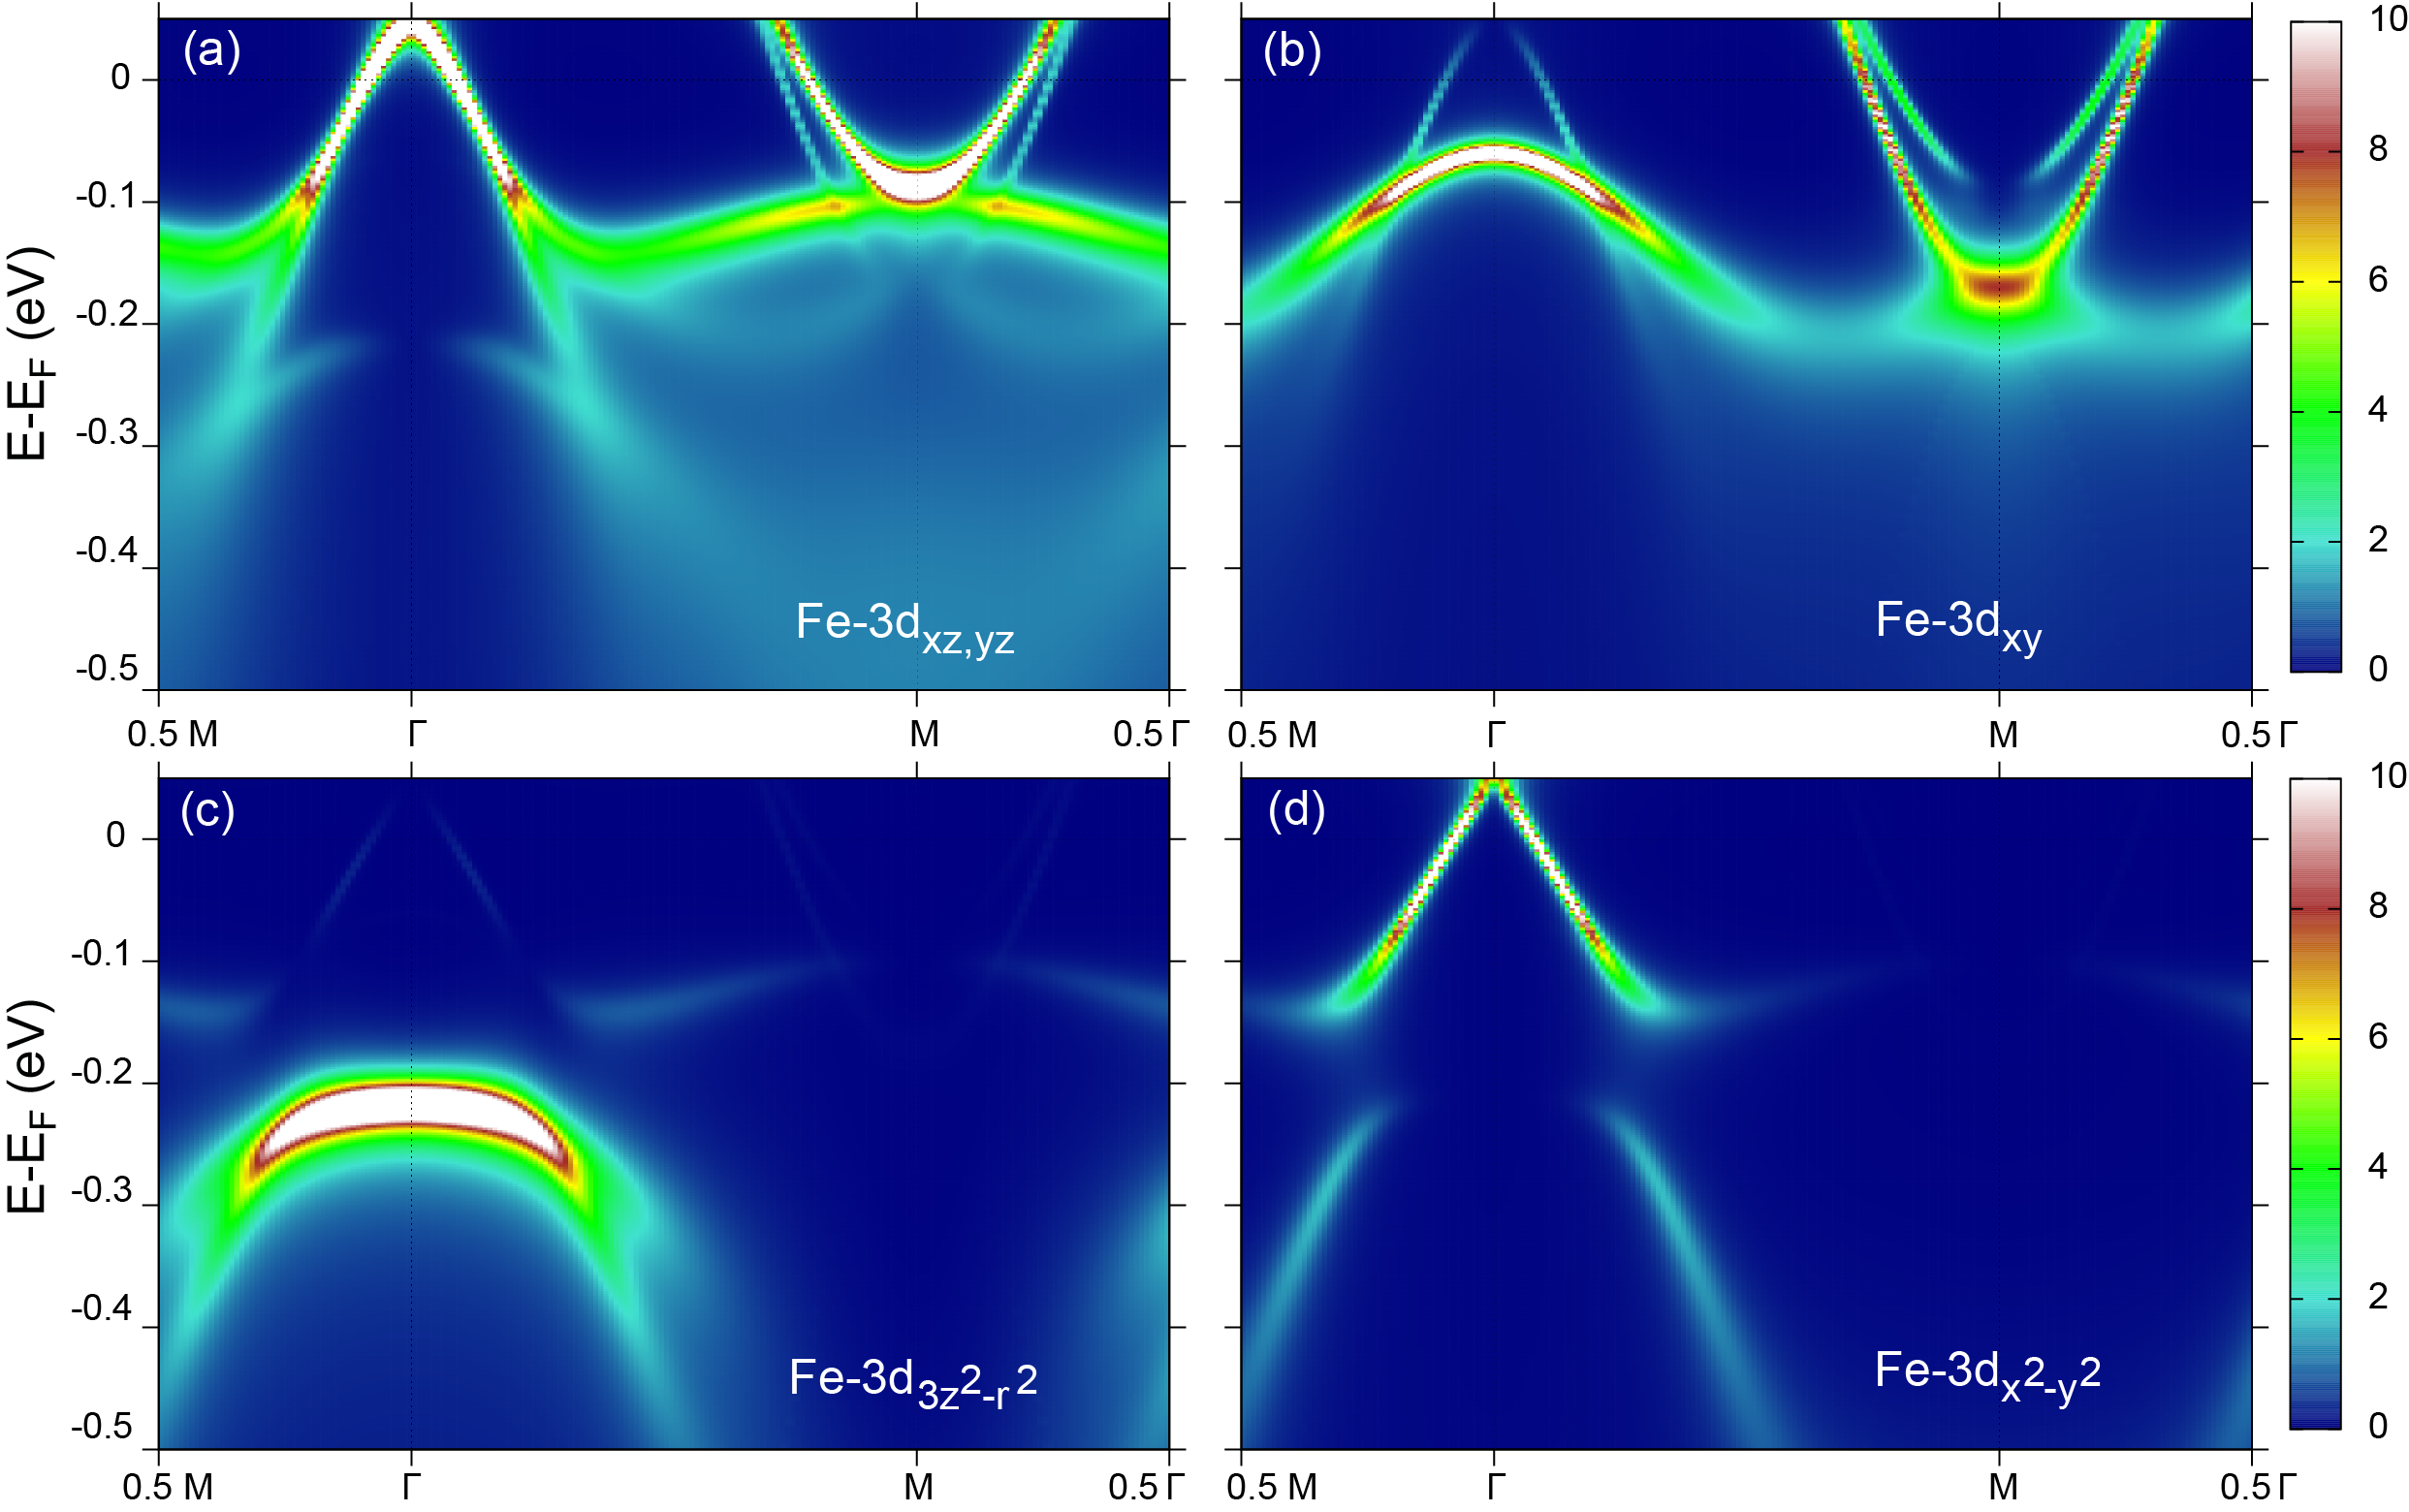
3 LDA+DMFT orbital resolved qusiparticle bands
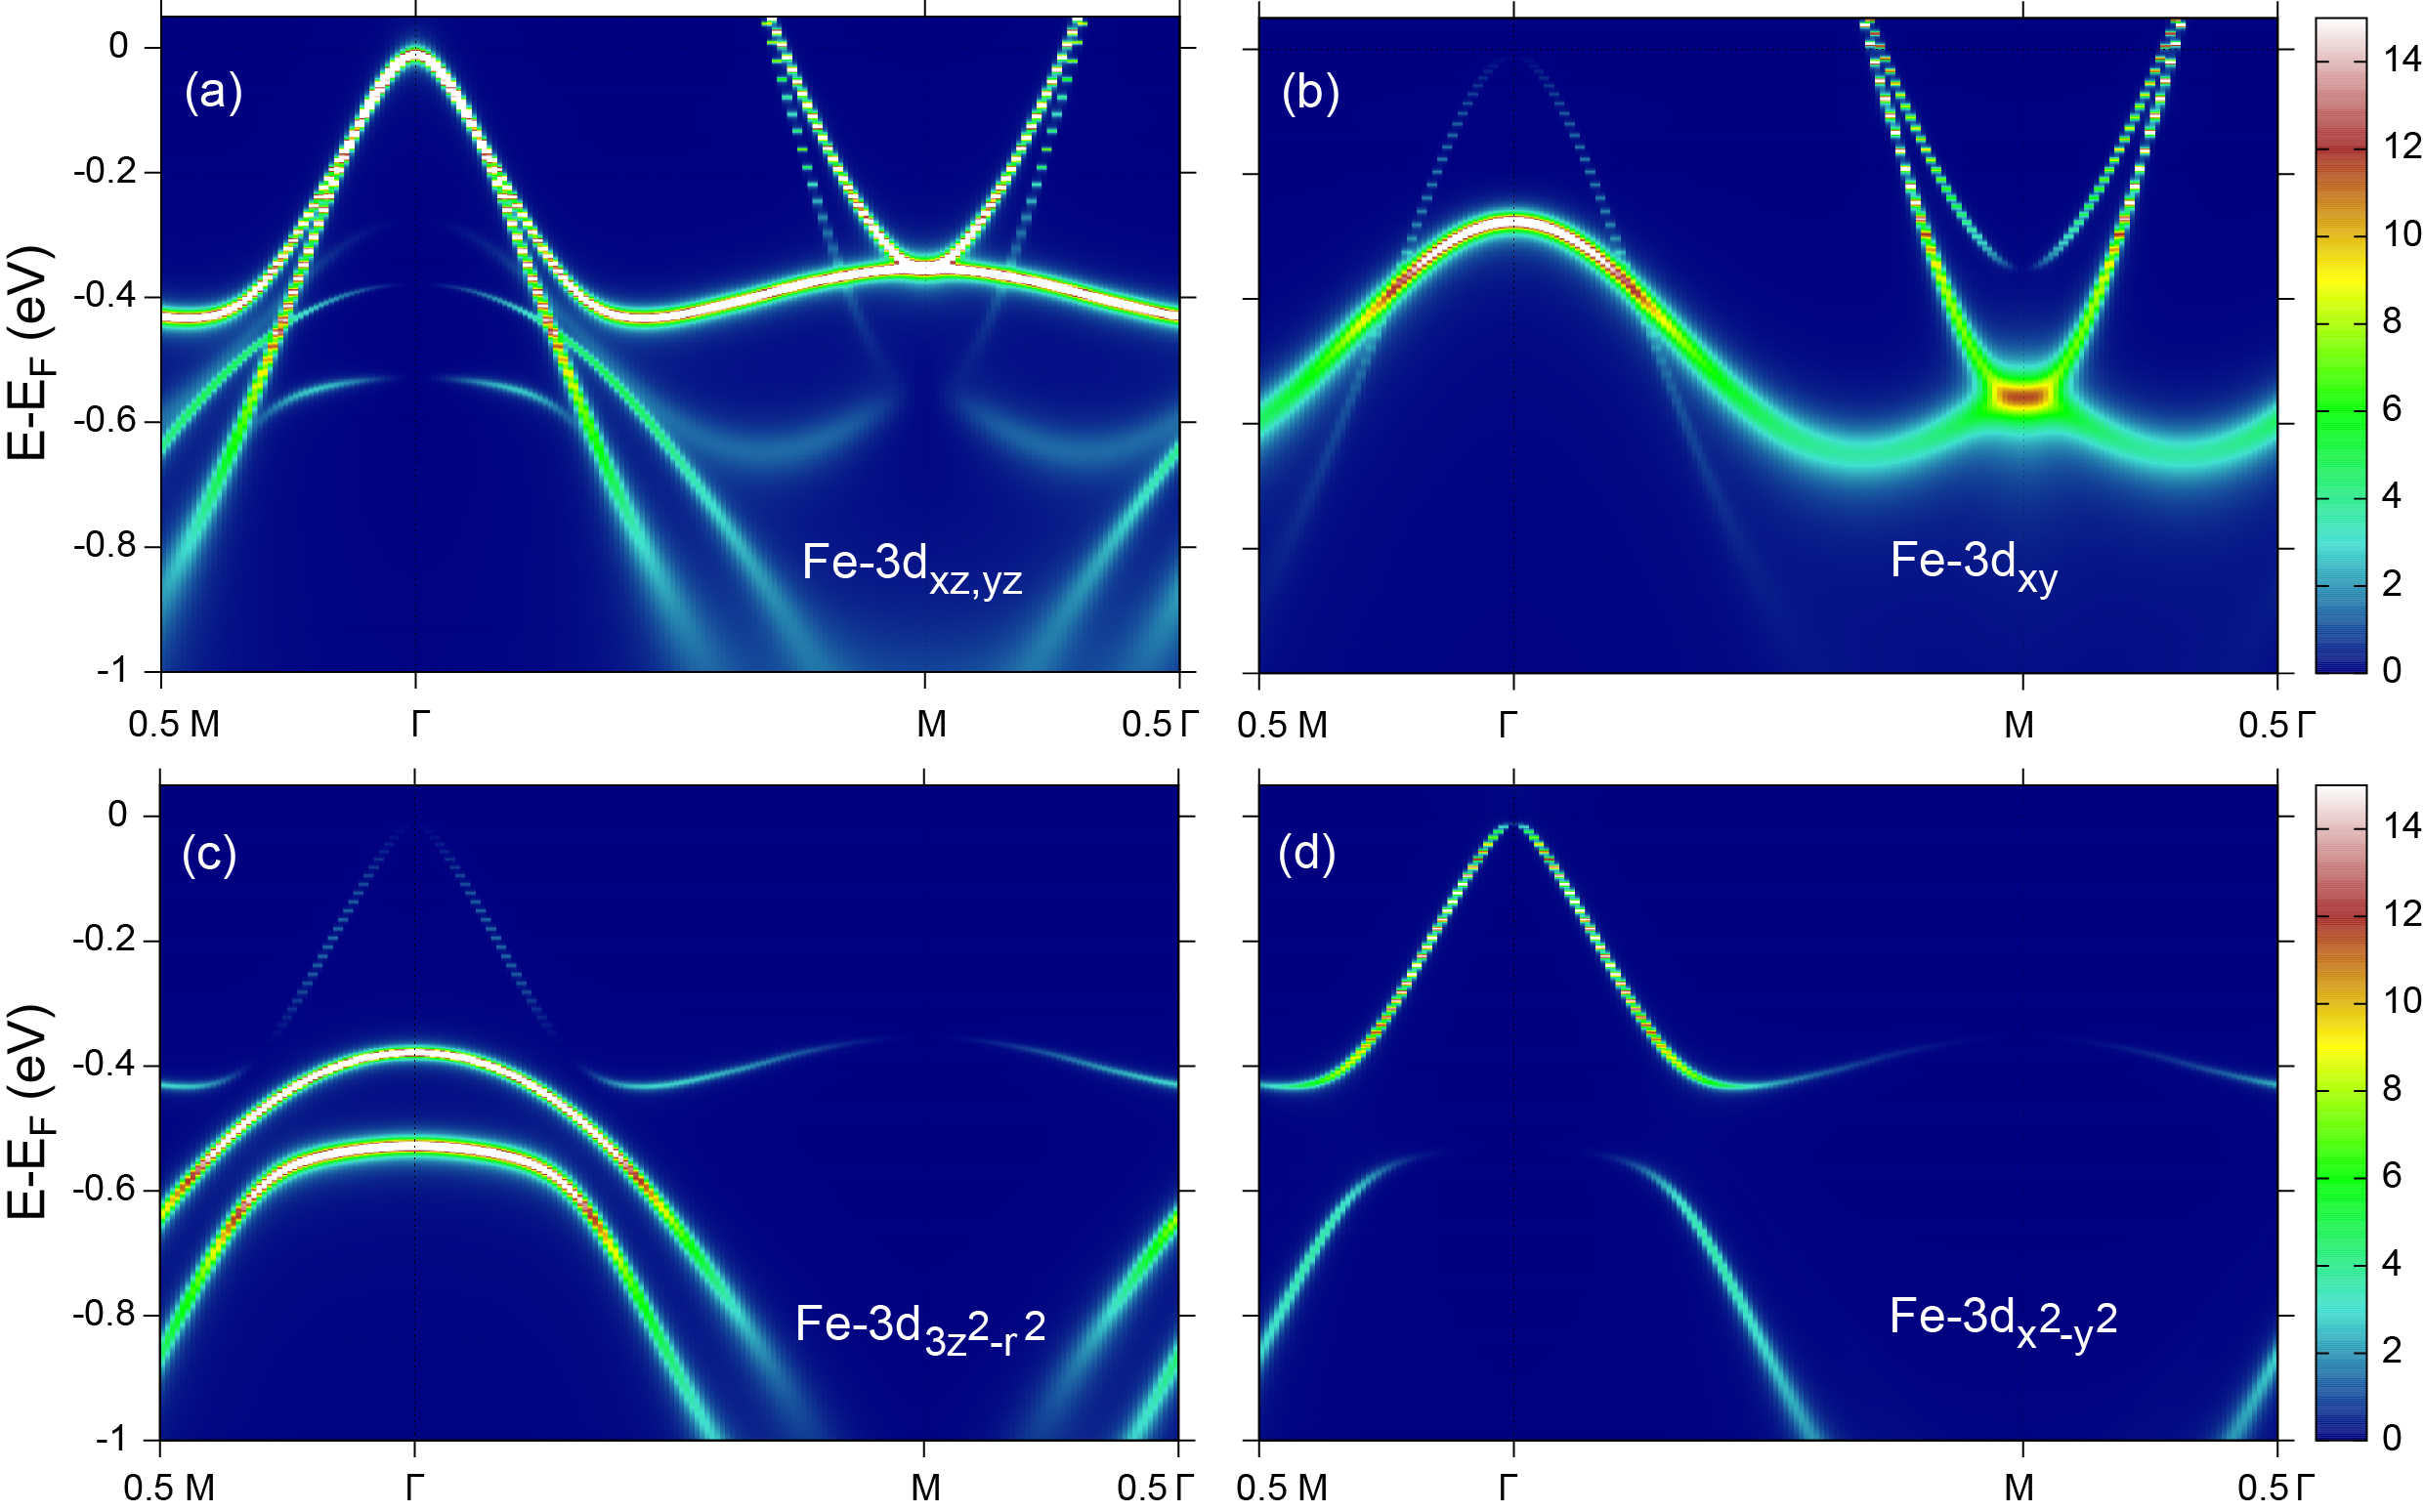
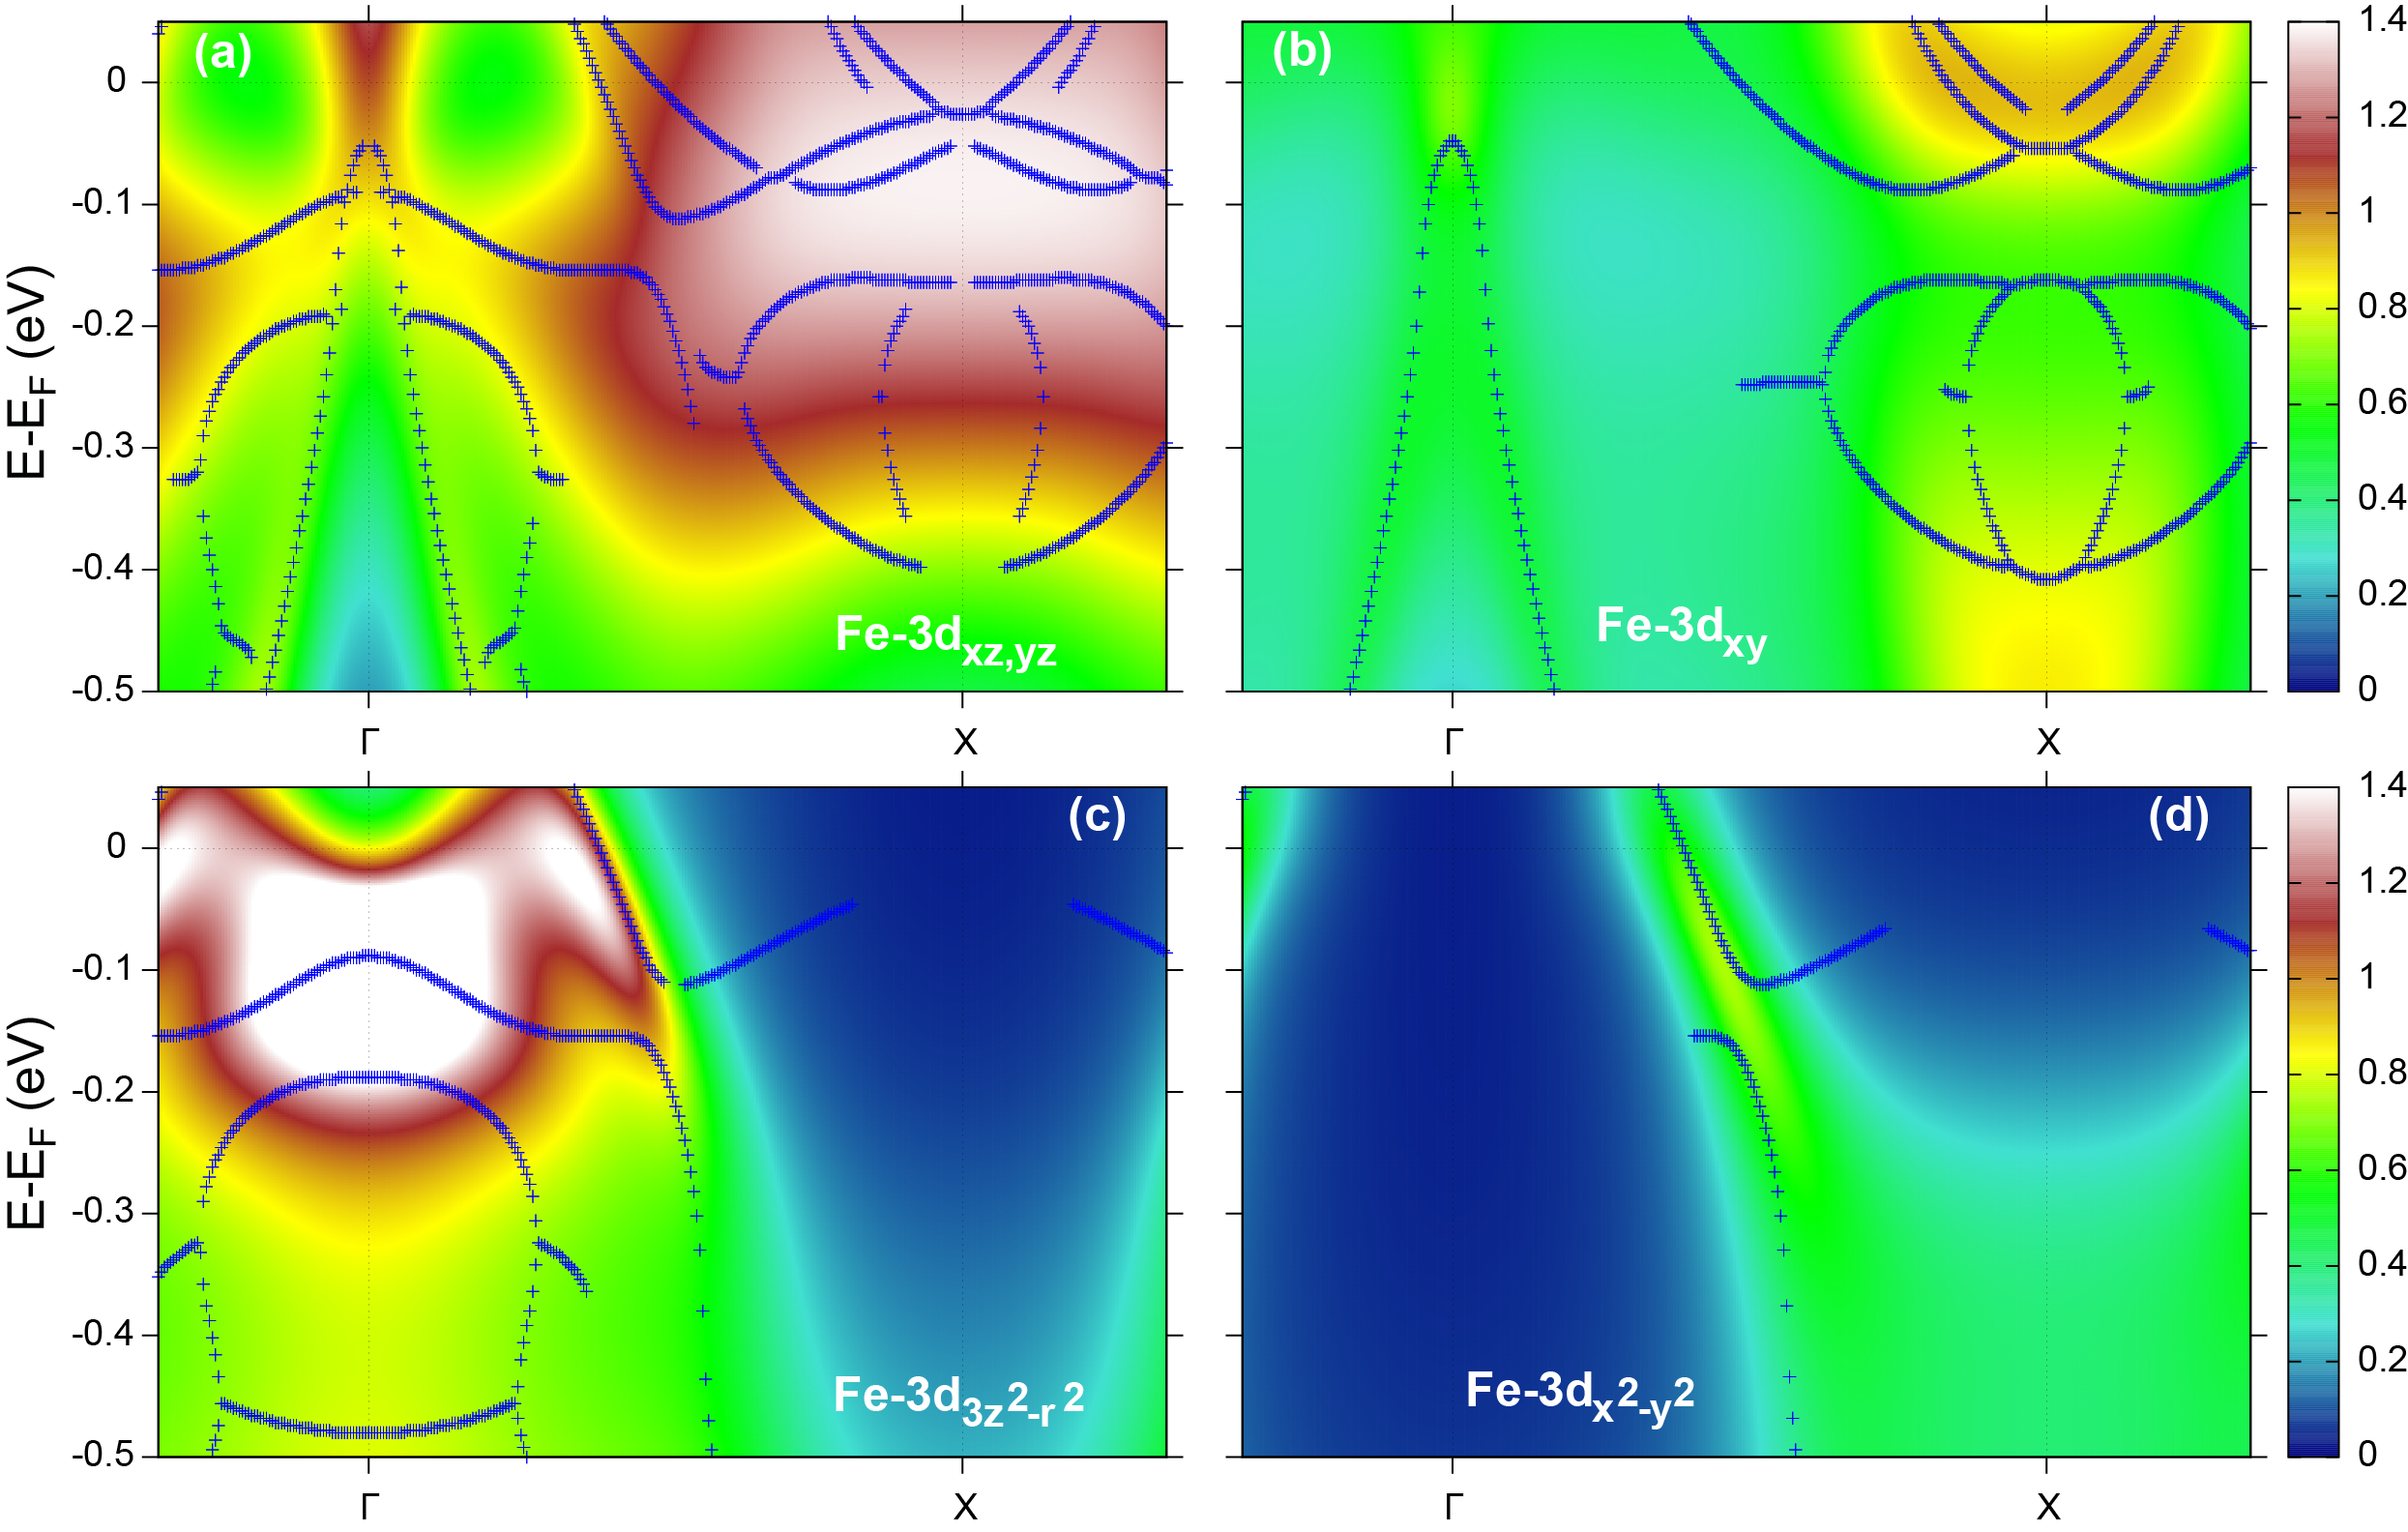
To show different Fe-3d orbitals contribution to LDA+DMFT spectral functions of FeSe based systems under consideration we present here the corresponding orbital resolved spectral function maps (Fig. S I, II.). In Fig. S I it is clearly seen that the qusiparticle bands of isolated FeSe monolayer are well defined and have similar shape to the LDA bands except correlation narrowing by the same constant factor for all bands. The qusiparticle bands of FeSe/STO are more broad but still well defined. The main contribution to spectral function near the Fermi level belongs to Fe-3dxz, Fe-3dyz and Fe-3dxy states both for the isolated FeSe layer and FeSe/STO. The spectral function of K0.76Fe1.72Se2 is shown in Fig. S II. Here the bands are strongly renormalized by correlations not only by the constant scaling factor, but also because of band shapes modifications in comparison to LDA bands. Since electronic correlations are quite strong for K0.76Fe1.72Se2 and bands are rather broadened by lifetime effects we explicitly show here the spectral function maxima positions by crosses. Despite the difference of correlation effects in both systems one can conclude that qusiparticle bands structures around the Fermi level are rather similar.
References
- [S1] I.A. Nekrasov, N.S. Pavlov, M.V. Sadovskii. Pis’ma v ZhETF 95, 659 (2012) [JETP Letters 95, 581 (2012)]
- [S2] I.A. Nekrasov, N.S. Pavlov, M.V. Sadovskii. Zh. Eksp. Teor. Fiz. 143, 713 (2013) [JETP 116, 620 (2013)]
- [S3] O.K. Andersen. Phys. Rev. B 12, 3060 (1975); O. Gunnarsson, O. Jepsen, O.K. Andersen. Phys. Rev. B 27, 7144 (1983); O.K. Andersen, O. Jepsen. Phys. Rev. Lett. 53, 2571 (1984)
- [S4] P. Blaha et al., An Augmented Plane Wave + Local Orbitals Program for Calculating Crystal Properties (Techn. Universitat Wien, Austria), 2001. ISBN 3-9501031-1-2
- [S5] P. Werner et al. Phys. Rev. Lett. 97, 076405 (2006); K. Haule. Phys. Rev. B 75, 155113 (2007); E. Gull et al. Rev. Mod. Phys. 83, 349 (2011)
- [S6] M. Ferrero, O. Parcollet. TRIQS: a Toolbox for Research in Interacting Quantum Systems, http://ipht.cea.fr/triqs; M. Aichhorn et al. Phys. Rev. B 80, 085101 (2009); L. Boehnke et al. Phys. Rev. B 84, 075145 (2011)
- [S7] I.A. Nekrasov, N.S. Pavlov, M.V. Sadovskii. Pis’ma Zh. Eksp. Teor. Fiz. 97, 18 (2013) [JETP Letters 97, 15 (2013)]
- [S8] I.A. Nekrasov, N.S. Pavlov, M.V.Sadovskii. Zh. Eksp. Teor. Fiz. 144, 1061 (2013) [JETP 117, 926 (2013)]
- [S9] J. Kunes et al., Comp. Phys. Commun. 181, 1888 (2010)
- [S10] A. A. Mostofi, J. R. Yates, Y.-S. Lee, I. Souza, D. Vanderbilt, N. Marzari. Comput. Phys. Commun. 178, 685 (2008)
- [S11] M. Yi et al. Phys. Rev. Lett. 110, 067003 (2013)
- [S12] H.J. Vidberg and J.W. Serene, J. Low Temp. Phys. 29, 179 (1977)
- [S13] M. Jarrell and J. E. Gubernatis, Physics Reports 269, 133 (1996)
- [S14] Alaska Subedi et al., Phys. Rev. B 78, 134514 (2008)
- [S15] F. Zheng, Zh. Wang, W. Kang, P. Zhang. Scientific Reports 3, 2213 (2013)
- [S16] J. Guo tt al. Phys. Rev. B 82, 180520(R) (2010)