Diversity of Abundance Patterns of Light Neutron-capture Elements in Very-metal-poor Stars
Abstract
We determine the abundances of neutron-capture elements from Sr to Eu for five very-metal-poor stars ([Fe/H]) in the Milky Way halo to reveal the origin of light neutron-capture elements. Previous spectroscopic studies have shown evidence of at least two components in the r-process; one referred to as the “main r-process” and the other as the “weak r-process,” which is mainly responsible for producing heavy and light neutron-capture elements, respectively. Observational studies of metal-poor stars suggest that there is a universal pattern in the main r-process, similar to the abundance pattern of the r-process component of solar-system material. Still, it is uncertain whether the abundance pattern of the weak r-process shows universality or diversity, due to the sparseness of measured light neutron-capture elements. We have detected the key elements, Mo, Ru, and Pd, in five target stars to give an answer to this question. The abundance patterns of light neutron-capture elements from Sr to Pd suggest a diversity in the weak r-process. In particular, scatter in the abundance ratio between Ru and Pd is significant when the abundance patterns are normalized at Zr. Our results are compared with the elemental abundances predicted by nucleosynthesis models of supernovae with parameters such as electron fraction or proto-neutron-star mass, to investigate sources of such diversity in the abundance patterns of light neutron-capture elements. This paper presents that the variation in the abundances of observed stars can be explained with a small range of parameters, which can serve as constraints on future modeling of supernova models.
Subject headings:
metal-poor stars: general — nuclear reactions, nucleosynthesis, abundances1. Introduction
One of the major questions in the current nuclear astrophysics is the site of the rapid neutron-capture process (r-process). Very-metal-poor stars are considered to be the key to constrain the site, since their chemical abundances are expected to exhibit the yields of a single to a few nucleosynthetic events (e.g., McWilliam et al., 1995; Ryan et al., 1996; Beers et al., 2005). Indeed, a small fraction of very-metal-poor stars show large excesses of neutron-capture elements that are suggested to have been processed by the r-process in the early Galaxy. Previous spectroscopic studies have measured detailed abundance of neutron-capture elements for a considerable number of very-metal-poor stars in the Milky Way halo to identify the origin of the r-process (e.g. Honda et al., 2004; Wu et al., 2015).
A distinctive feature was revealed from abundance ratios of light and heavy neutron-capture elements of a large sample of metal-poor stars measured by previous studies. Light neutron-capture elements include Sr, Y, and Zr, which locate near the first abundance peak associated with the neutron magic number 50, and those up to Ag in this study. Heavy neutron-capture elements include those near the second abundance peak and heavier elements (e.g., Ba, Eu). The abundance ratios of light and heavy neutron-capture elements such as [Sr/Ba] and [Zr/Ba] show large scatter at low metallicity, suggesting the presence of at least two r-process components (e.g., Burris et al., 2000; Johnson & Bolte, 2002; Honda et al., 2004; Aoki et al., 2005). One is well known as the “main r-process” (e.g. Truran et al., 2002), which yields both light and heavy neutron-capture elements. A remarkable feature of this process is that it appears to produce a “universal pattern,” being almost identical to the abundance pattern of the solar-system r-process component at least for those heavier than the second abundance peak (e.g., Sneden et al., 1996, 2008; Barbuy et al., 2011; Siqueira Mello et al., 2013, 2014). The other is frequently referred to as the “weak r-process” (e.g. Wanajo & Ishimaru, 2006), which yields light neutron-capture elements. The latter is not confirmed to be a type of r-process and is sometimes referred to as the Lighter Elements Primary Process (LEPP; Travaglio et al., 2004). We note that other processes like the s-process in rapidly rotating massive stars (e.g., Chiappini et al., 2011; Cescutti et al., 2013) are also suggested as sources of the scatter in [Sr/Ba]. In this paper, however, we refer to it as the weak r-process according to theoretical predictions for such a process from the studies of supernova nucleosynthesis (Wanajo et al., 2011; Wanajo, 2013).
Previous spectroscopic studies have determined detailed neutron-capture abundances for several metal-poor stars that have excesses of light-to-heavy ratios (e.g., [Sr/Ba]). One of such stars, HD 122563, is a well-studied object that shows deviation of the abundances of neutron-capture elements from the solar r-process abundance distribution (e.g., Honda et al., 2006). The abundance pattern of this star has frequently been referred to as a template for the weak r-process. The understanding of the weak r-process abundances is yet insufficient, partially due to the lack of observational constraints. The key elements for the understanding of the weak r-process are those between the first and second abundance peaks, such as Mo, Ru, Pd, and Ag. However, these elements have only weak absorption in the near-UV spectral range, which makes them difficult to measure. Abundances of such elements have been studied for r-process-enhanced stars with very low metallicity (e.g., Hill et al., 2002; Sneden et al., 2003). Pd and Ag are more generally studied for metal-poor stars (e.g., Johnson & Bolte, 2002; Hansen et al., 2012). Peterson (2011) and Hansen et al. (2014) determined abundances of Mo and/or Ru abundances, discussing the origin of these elements assuming the abundance pattern of HD 122563 for the weak r-process. Most of their sample, however, are metal-rich stars, or metal-poor stars with moderate contribution from the main r-process. In this study, we select metal-poor objects that are not main r-process rich stars, and have some excess of light-to-heavy element ratios. Further studies of such stars are required to constrain the abundance patterns of the weak r-process.
Still, it is uncertain whether the abundance of the weak r-process shows a universal pattern as found in the main r-process or shows a diversity. To obtain observational constraints, we analyze the abundance patterns of five very-metal-poor stars showing excesses of light-to-heavy ratios of neutron-capture elements. The spectroscopic data of stars were obtained with the 8.2m Subaru Telescope. Following the methods in previous studies (e.g., Sneden et al., 1996; Honda et al., 2006), we measure the stellar abundances of neutron-capture elements and compare the results to the solar r-process pattern. We also compare the abundances of light neutron-capture elements among these stars to inspect the variation of the patterns.
In §2, we describe our target stars and details of the spectroscopic observation obtained by the Subaru High Dispersion Spectrograph (HDS). §3, gives details of the chemical analysis of neutron-capture elements. We present the results and discuss the source of the weak r-process from derived abundances in §4. Finally, we summarize our study in §5.
| Object Name | R.A. | Decl. | Exp. Time | S/N | Date | |
|---|---|---|---|---|---|---|
| (J2000) | (J2000) | (s) | (4100 Å) | (UT) | (km ) | |
| BD | 04:13:12.771 | 06:35:49.43 | 1800 | 150 | 2007 February 08 | -143.50.6 |
| HD 23798 | 03:46:45.544 | 30:51:25.48 | 15,600 | 480 | 2007 February 08 | 0.6 |
| HD 85773 | 09:53:39.708 | 22:50:18.36 | 10,800 | 220 | 2007 February 08 | |
| HD 107752 | 12:22:53.449 | 11:36:18.85 | 10,800 | 340 | 2007 February 08 | |
| HD 110184 | 12:40:14.375 | 08:31:25.76 | 20,400 | 630 | 2007 February 08 |
2. Observations
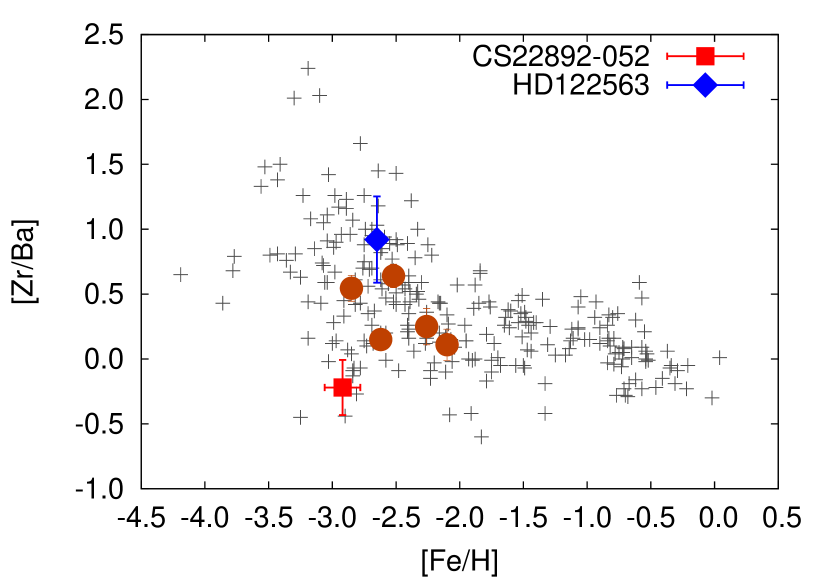
Five bright stars (HD 107752, HD 110184, HD 85773, HD 23798, and BD) are selected for our study based on high-resolution spectra of the UV-blue range. Previous studies show that these objects are very-metal-poor ([Fe/H]111The abundance ratio of two elements (A and B) are defined as [A/B]. The abundance ratio is normalized with the solar abundance of the same elements) red giants that have abundance ratios of [Zr/Ba] higher than the solar (or stars with universal patterns like CS 22892-052) value , but not as extreme as HD 122563 as shown in Figure 1.
The targets were observed on 2007 February 8th and 9th, with the 8.2m Subaru Telescope HDS (Noguchi, 2002). The wavelength coverage is from 3000 to 4630 Å with a resolving power of 90,000. The signal-to-noise ratio (S/N) of the spectrum is estimated from photon counts at 4100 Å. In addition, we use archived HDS spectra taken from the Japanese Virtual Observatory (JVO)222http://jvo.nao.ac.jp/portal/top-page.do for measuring the Ba abundance from lines at longer wavelengths (such as 4554, 4934, 5854, and 6497 Å) that are not covered with our original data. The weak Ba lines at longer wavelengths have little effect of hyperfine splitting and saturation compared to the strong 4554 Å line; therefore, we expect a more accurate measurement from these lines.
Positions of objects, exposure time, S/N, observed dates, and heliocentric radial velocities are summarized in Table 1. Radial velocities are measured using Fe lines, and their errors are estimated from standard deviation. The obtained velocities agree well with those obtained by previous studies using high dispersion data. Hence, no signature of radial velocity variation is found from our data. The reduction of the raw data is carried out in a standard process using the IRAF echelle package333IRAF is distributed by the National Optical Astronomy Observatories, which are operated by the Association of Universities for Research in Astronomy, Inc., with cooperation of the National Science Foundation.
3. Chemical Abundance Analysis
Abundance determinations are performed on the basis of the model atmospheres and spectral line data, assuming the local thermodynamic equilibrium (LTE). The model atmospheres with the revised opacity distribution function (NEWODF) by Castelli & Kurucz (2003) are adopted. We employ a one-dimensional LTE spectral synthesis code for our calculations of synthetic spectra. The code is based on the same assumptions as the model atmosphere program of Tsuji (1978), which have been used in previous studies (e.g., Aoki et al., 2009). Spectral line data for line identifications in our analysis are adopted from previous studies of Ivans et al. (2006) and Honda et al. (2006). The line list used in the analysis is given in Table LABEL:lines.
Among the model atmosphere parameters, we adopt effective temperatures () from studies given in Table 3. The exception is HD 107752 for which very different (about 400 K) has been obtained by different studies. We estimate from the color (), adopting the Two Micron All Sky Survey magnitude and magnitude by Oja (1985) taken from the SIMBAD database.444SIMBAD Astronomical Database: http://simbad.u-strasbg.fr/simbad/ We prefer to for the estimate of , because the color of giant stars is less dependent on metallicity and molecular absorption. From the empirical calibration between and color for giant stars by González Hernández & Bonifacio (2009), we estimate the of HD 107752 to be 4760 K which agrees well with the estimated from by Ishigaki et al. (2013). Surface gravity (log g), metallicity ([Fe/H]) and micro-turbulence () are determined from the analysis of Fe I and Fe II lines as their abundances measured using individual lines do not show any trend or systematic differences. The parameters determined for each target are summarized in Table 3.
| BD | HD 23798 | HD 85773 | HD 107752 | HD 110184 | |||||||||||||
| Element | Wavelength | L.E.P | log gf | log | EW | log | EW | log | EW | log | EW | log | EW | ||||
| (Å) | (eV) | (mÅ) | (mÅ) | (mÅ) | (mÅ) | (mÅ) | |||||||||||
| Sr II | 4077.71 | 0.00 | 0.17 | 201.4 | 144.0 | ||||||||||||
| Sr II | 4215.52 | 0.00 | 0.95 | 273.2 | 0.86 | 266.6 | 0.02 | 174.1 | 117.5 | 0.46 | 247.4 | ||||||
| Y II | 3549.01 | 0.13 | 0.02 | 85.3 | 83.9 | 63.8 | 42.6 | 80.6 | |||||||||
| Y II | 3600.74 | 0.18 | 0.28 | 92.6 | |||||||||||||
| Y II | 3611.04 | 0.13 | 0.10 | 90.2 | 103.7 | 68.9 | 52.6 | 93.3 | |||||||||
| Y II | 3950.36 | 0.10 | 0.21 | 93.7 | 0.03 | 96.6 | 70.5 | 41.4 | 89.7 | ||||||||
| Y II | 4398.01 | 0.13 | 0.13 | 82.6 | 21.8 | ||||||||||||
| Zr II | 3438.23 | 0.09 | 0.42 | 74.8 | |||||||||||||
| Zr II | 3457.56 | 0.56 | 0.63 | 67.9 | 44.2 | 23.5 | 64.0 | ||||||||||
| Zr II | 3479.02 | 0.53 | 14.8 | ||||||||||||||
| Zr II | 3536.94 | 0.36 | 0.54 | 39.8 | 7.2 | 30.9 | |||||||||||
| Zr II | 3573.08 | 0.32 | 0.62 | 54.3 | 0.50 | 54.2 | 29.6 | 13.6 | 43.1 | ||||||||
| Zr II | 3630.02 | 0.36 | 0.54 | 55.1 | 28.8 | 9.6 | 46.2 | ||||||||||
| Zr II | 4050.33 | 0.71 | 0.75 | 47.2 | |||||||||||||
| Zr II | 4071.09 | 1.00 | 0.99 | 18.7 | |||||||||||||
| Zr II | 4208.99 | 0.71 | 0.62 | 73.9 | 47.0 | 21.7 | 0.17 | 66.8 | |||||||||
| Zr II | 4317.32 | 0.71 | 0.91 | 33.9 | 0.85 | 32.8 | 0.23 | 24.2 | |||||||||
| Zr II | 4613.92 | 0.97 | 0.98 | 23.2 | |||||||||||||
| Mo I | 3864.10 | 0.00 | 0.03 | 41.9 | 30.0 | 11.6 | 2.0 | 23.0 | |||||||||
| Ru I | 3498.94 | 0.00 | 0.31 | 30.9 | 29.1 | 12.2 | 2.5 | 21.4 | |||||||||
| Ru I | 3728.03 | 0.00 | 0.27 | 31.7 | 38.0 | 18.9 | 2.3 | 23.0 | |||||||||
| Pd I | 3404.58 | 0.81 | 0.32 | 35.9 | 35.1 | 26.7 | 4.1 | 32.1 | |||||||||
| Ba II | 4554.03 | 0.00 | 0.14 | 0.10 | 204.3 | 196.4 | 170.6 | 123.7 | 182.2 | ||||||||
| Ba II | 4934.10 | 0.00 | 0.15 | 206.0 | 197.4 | 174.7 | 126.3 | 184.5 | |||||||||
| Ba II | 5853.69 | 0.60 | 0.30 | 93.1 | 84.1 | 50.7 | 10.6 | 30.2 | |||||||||
| Ba II | 6141.73 | 0.70 | 0.32 | 140.5 | 135.5 | 104.1 | |||||||||||
| Ba II | 6496.91 | 0.60 | 0.04 | 134.2 | 45.4 | 92.5 | |||||||||||
| La II | 3794.77 | 0.24 | 0.21 | 11.0 | |||||||||||||
| La II | 3988.52 | 0.40 | 0.21 | 8.7 | |||||||||||||
| La II | 3995.75 | 0.17 | 9.2 | ||||||||||||||
| La II | 4086.71 | 0.00 | 71.7 | 58.6 | 14.3 | 40.6 | |||||||||||
| La II | 4123.22 | 0.32 | 0.13 | 60.2 | 55.1 | 25.6 | 9.8 | 33.3 | |||||||||
| La II | 4322.51 | 0.17 | 17.2 | 14.6 | 8.9 | ||||||||||||
| La II | 4429.91 | 0.23 | 18.0 | 23.4 | |||||||||||||
| Ce II | 4014.90 | 0.53 | 5.3 | ||||||||||||||
| Ce II | 4053.50 | 0.00 | 3.1 | ||||||||||||||
| Ce II | 4073.47 | 0.48 | 0.21 | 22.0 | 9.2 | ||||||||||||
| Ce II | 4115.37 | 0.92 | 0.10 | 1.6 | |||||||||||||
| Ce II | 4165.60 | 0.91 | 0.52 | 2.1 | |||||||||||||
| Ce II | 4222.60 | 0.12 | 35.3 | 28.3 | 12.7 | 4.4 | |||||||||||
| Ce II | 4418.78 | 0.86 | 0.27 | 11.3 | 7.1 | ||||||||||||
| Ce II | 4483.89 | 0.86 | 0.10 | 7.6 | |||||||||||||
| Ce II | 4523.08 | 0.52 | 4.6 | ||||||||||||||
| Ce II | 4539.74 | 0.33 | 33.4 | 24.0 | 3.9 | ||||||||||||
| Ce II | 4551.29 | 0.74 | 3.3 | ||||||||||||||
| Ce II | 4562.36 | 0.48 | 0.21 | 39.2 | 29.8 | 14.1 | 4.9 | 17.6 | |||||||||
| Ce II | 4628.16 | 0.52 | 0.14 | 33.5 | 14.9 | ||||||||||||
| Nd II | 4012.70 | 0.00 | 5.6 | ||||||||||||||
| Nd II | 4021.33 | 0.32 | 14.1 | 25.0 | 14.1 | 4.4 | |||||||||||
| Nd II | 4059.95 | 0.20 | 15.9 | ||||||||||||||
| Nd II | 4061.08 | 0.47 | 0.55 | 33.1 | 53.8 | 33.1 | 14.8 | ||||||||||
| Nd II | 4368.63 | 0.06 | 18.0 | 10.3 | 11.4 | ||||||||||||
| Nd II | 4446.38 | 0.20 | 15.5 | 29.1 | 15.9 | 19.3 | |||||||||||
| Nd II | 4501.81 | 0.20 | 3.6 | ||||||||||||||
| Nd II | 4513.33 | 0.06 | 5.3 | 7.5 | 5.3 | 4.8 | |||||||||||
| Nd II | 4563.22 | 0.18 | 9.6 | 2.6 | |||||||||||||
| Eu II | 3819.64 | 0.00 | 0.51 | 113.8 | 78.3 | 104.7 | |||||||||||
| Eu II | 4129.70 | 0.00 | 0.22 | 111.4 | 110.7 | 76.1 | 31.2 | - | 94.4 | ||||||||
| Eu II | 4205.04 | 0.00 | 0.21 | 125.5 | 81.2 | ||||||||||||
| Pb I | 3683.46 | 0.97 | 7.6 | 2.7 | |||||||||||||
For elements for which several absorption lines are available in our spectra, the averaged abundances measured from individual lines are taken as the final results. On the other hand, for those that have only one or a few measurable lines, the spectrum synthesis technique is applied for the measurement of their abundances. The effects of hyperfine splitting are taken into account in the analysis of Ba, La, and Eu lines. A total of 11 neutron-capture elements from Sr to Eu are measured for each star. We measure the abundances of Mo, Ru, and Pd for the first time for the five stars in our sample. Sr is also obtained for HD 85773, HD 23798, and HD 107752 for the first time.
| Object Name | [Fe/H] | log g1 | log g_r 2 | _Ba 3 | References | ||
|---|---|---|---|---|---|---|---|
| (K) | (dex) | (dex) | (dex) | (km ) | (km ) | ||
| BD | 4400 | 2.11 | 0.90 | 1.30 | 1.85 | 1.80 | 1 |
| HD 23798 | 4450 | 2.26 | 1.06 | 1.26 | 2.17 | 1.92 | 2 |
| HD 85773 | 4268 | 2.62 | 0.87 | 0.87 | 1.98 | 2.00 | 3 |
| HD107752 | 4760 | 2.85 | 1.40 | 1.90 | 1.85 | ||
| HD110184 | 4240 | 2.52 | 0.30 | 0.50 | 2.21 | 2.32 | 4 |
-
1
log g from precedent research
-
2
log g regulated from abundances derived from Fe I and Fe II
-
3
determined from JVO data used for Ba abundance measurements
The Pb abundance is sensitive to the contributions of the s-process, in particular, at low metallicity. In order to verify the contribution of the s-process to the targets, the Pb 3683 and 4058 Å lines are inspected for our objects.
In the following subsections, details of the analysis and results are described. The abundances determined from individual lines are given in Table LABEL:lines. Abundance results are given in Table LABEL:tab:ElAbund. To derive the [X/Fe] values, we use the solar-system abundances obtained by Asplund et al. (2009).
3.1. Light Neutron-capture Elements (38Z48)
The Sr abundance is measured using two strong Sr II lines at 4078 and 4216 Å fitting the synthetic spectra to our observed spectra. In the fitting process, line broadening affected by the instrument, macro-turbulence, and rotation is approximated by a Gaussian profile. The Sr abundance determined from strong lines is not as certain as abundances of other elements due to the saturation effect. Hence, we do not include the abundance of this element in later sections, where we discuss the light neutron-capture elements.
| BD | HD 23798 | HD 85773 | HD 107752 | HD 110184 | |||||||||||||||||||||||||
|---|---|---|---|---|---|---|---|---|---|---|---|---|---|---|---|---|---|---|---|---|---|---|---|---|---|---|---|---|---|
| Species | log | [X/Fe] | N | log | [X/Fe] | N | log | [X/Fe] | N | log | [X/Fe] | N | log | [X/Fe] | N | ||||||||||||||
| Sr II | 0.95 | 0.15 | 0.19 | 0.19 | 2 | 0.86 | 0.15 | 0.19 | 0.25 | 2 | 0.00 | 0.16 | 0.20 | 2 | 0.15 | 0.28 | 2 | 0.46 | 0.15 | 0.28 | 0.11 | 1 | |||||||
| Y II | 0.02 | 0.15 | 0.26 | 3 | 0.15 | 0.26 | 0.01 | 4 | 0.18 | 0.28 | 3 | 0.15 | 0.16 | 4 | 0.17 | 0.18 | 4 | ||||||||||||
| Zr II | 0.76 | 0.15 | 0.18 | 0.29 | 2 | 0.71 | 0.18 | 0.20 | 0.39 | 9 | 0.16 | 0.19 | 4 | 0.15 | 0.16 | 0.05 | 7 | 0.21 | 0.21 | 6 | |||||||||
| Mo I | 0.03 | 0.15 | 0.25 | 0.25 | 1 | 0.15 | 0.25 | 0.27 | 1 | 0.16 | 0.26 | 1 | 0.15 | 0.17 | 0.07 | 1 | 0.15 | 0.17 | 1 | ||||||||||
| Ru I | 0.15 | 0.28 | 0.05 | 2 | 0.15 | 0.28 | 0.34 | 2 | 0.16 | 0.28 | 2 | 0.15 | 0.21 | 0.14 | 2 | 0.15 | 0.21 | 2 | |||||||||||
| Pd I | 0.15 | 0.21 | 1 | 0.15 | 0.21 | 1 | 0.16 | 0.22 | 1 | 0.15 | 0.18 | 1 | 0.15 | 0.18 | 1 | ||||||||||||||
| Ba II | 0.22 | 0.15 | 0.18 | 0.15 | 4 | 0.15 | 0.18 | 5 | 0.16 | 0.18 | 4 | 0.15 | 0.16 | 4 | 0.17 | 0.18 | 4 | ||||||||||||
| La II | 0.15 | 0.17 | 0.28 | 3 | 0.15 | 0.17 | 0.17 | 3 | 0.16 | 0.18 | 3 | 0.15 | 0.16 | 2 | 0.15 | 0.16 | 4 | ||||||||||||
| Ce II | 0.15 | 0.18 | 0.13 | 4 | 0.15 | 0.18 | 0.02 | 5 | 0.16 | 0.19 | 4 | 0.15 | 0.16 | 0.01 | 7 | 0.15 | 0.16 | 5 | |||||||||||
| Nd II | 0.15 | 0.18 | 0.30 | 5 | 0.15 | 0.18 | 0.17 | 6 | 0.16 | 0.19 | 5 | 0.15 | 0.16 | 0.20 | 5 | 0.15 | 0.16 | 3 | |||||||||||
| Eu II | 0.15 | 0.19 | 0.20 | 1 | 0.15 | 0.19 | 0.24 | 3 | 0.16 | 0.20 | 0.02 | 3 | 0.15 | 0.16 | 0.31 | 1 | 0.15 | 0.16 | 2 | ||||||||||
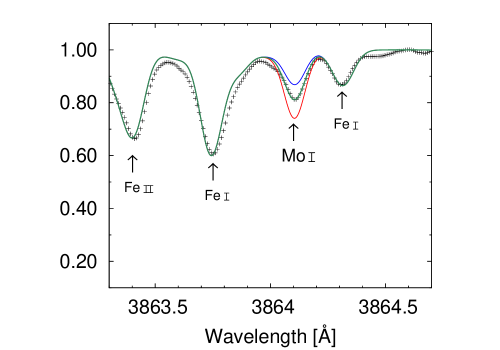
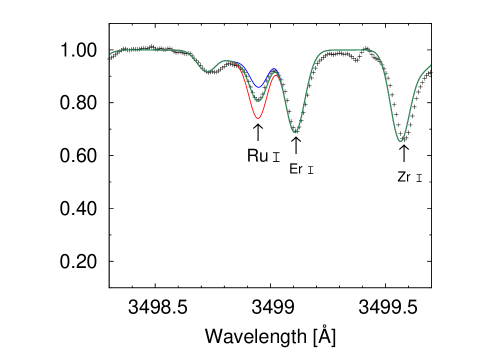
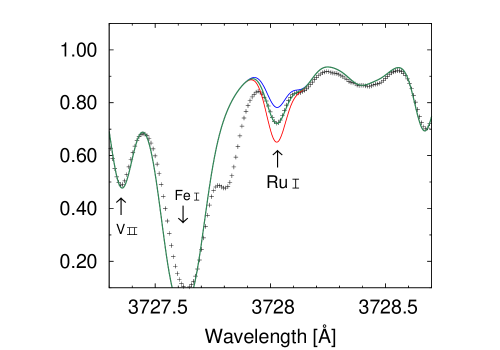
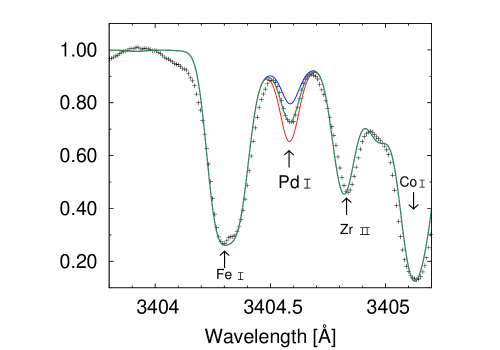
Spectrum synthesis technique is applied to determine the Mo, Ru, and Pd abundance. Examples of detected spectral lines in HD 110184 are shown in Figure 2. The Mo abundance is determined using the Mo I 3864 Å line. The line is almost free from contamination by other lines (Fig. 2). Two Ru I lines at 3499 and 3728 Å are detected, and contamination by other lines is also checked. Mo and Ru are detected for all the objects. The Pd abundance is also measured for the target stars, using the 3405 Å line. We checked the blending of other atomic lines using the atomic line list by Kurucz (1993). The spectra are analyzed using the line list around this Pd I line provided by Johnson & Bolte (2002).
3.2. Heavy Neutron-capture Elements (56Z63)
The abundance of Ba is determined including the effect of hyperfine splitting (McWilliam et al., 1998). The quality of HDS spectra from JVO for measuring 4934, 5854, and 6497 Å Ba lines is sufficient for our measurement. The isotope ratios of Ba estimated for the r-process component of solar-system material (Sneden et al., 1996) are assumed. The heavy neutron-capture elements including Ba exhibit enhancement in three out of five stars, suggesting the s-process contribution to Ba in these stars, as discussed in §4.1. We also attempt to determine the abundance assuming the s-process isotope ratios (Sneden et al., 1996) to investigate the effect on derived abundance. The abundance derived assuming the s-process isotope ratio is 0.1 dex greater at most than the abundance derived from those for the r-process case. In particular, the effects are negligible in the analysis of weak Ba lines in the red range. Hence, we employ the results obtained assuming the solar-system r-process isotope ratio as the final results.
We update the line list of Honda et al. (2006) for Ce, by adopting gf-values determined by Lawler et al. (2009). The difference of gf-values between the new and previous line lists is around 0.1 dex, and at most 0.34 dex for the 4015 Å line. This line is used for the determination of the Ce abundance of HD 85773; the abundance of Ce of this star decreased by 0.05 dex after adopting the gf-values by Lawler et al. (2009). Overall, the update of gf-values has little impact on the final results.
We have detected Eu II lines at 3820, 4130, and 4205 Å. Hyperfine splitting is taken into account, adopting the line data of Lawler et al. (2001). We assume the isotope fraction of and to be 0.5, which is close to the solar isotope fraction.
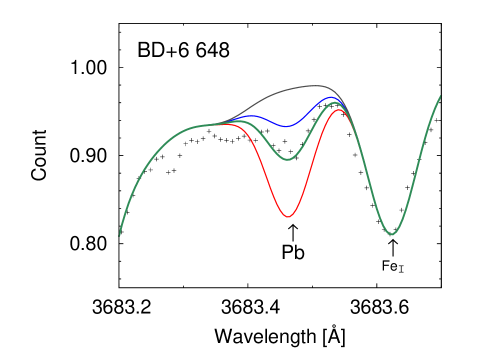
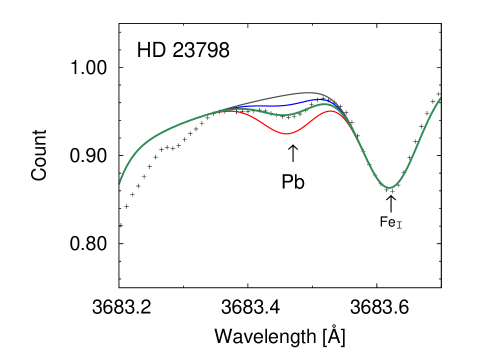
Pb abundance is measured using the Pb I 3684 Å line. We are able to measure the Pb abundance of two stars, BD and HD 23798 (Fig. 3). An upper limit of Pb is estimated for HD 85773 (Fig. 3). The Pb I 4058 Å line is not used because of the severe blend with CH molecular lines. The abundance of Pb of BD was measured using the 4058 Å line in a previous study by Aoki & Honda (2008). Although the abundance is measured using different lines, our result is in good agreement with their Pb abundance. No meaningful upper limit is obtained for the other two objects.

3.3. Re-analysis of HD 122563
To verify the consistency of our analysis with previous studies, we apply our analysis procedure to the data of HD122563 reported by Honda et al. (2006). We adopt the equivalent widths of Honda et al. (2006) as well as atomic data, except for Ce. For this element, atomic data updated by Lawler et al. (2009) are adopted. The results are given in Table LABEL:tab:honda for comparison with those obtained by Honda et al. (2006).
The chemical abundances of HD 122563 obtained by our analysis agree well with those obtained by Honda et al. (2006). The abundances of most elements are systematically lower by around 0.05–0.10 dex than those obtained by Honda et al. (2006). This difference can be attributed to the difference in model atmospheres. Honda et al. (2006) adopts models provided by Kurucz (1993) in which convective overshooting is assumed, while we adopt models of Castelli & Kurucz (2003), which are calculated assuming pure mixing-length convection with the new opacity distribution functions. The temperature structure of the models of Castelli & Kurucz (2003) is several tenths of kelvin lower than those of Kurucz (1993).
Aside from the effect of the difference in the model atmosphere, Ce abundance shows a relatively large difference (0.19 dex). The updated atomic data by Lawler et al. (2009) partially explains the discrepancy between the two studies, though the effect is less than 0.1 dex as mentioned above.
3.4. Error Estimates
The values adopted for error bars (total error) for comparisons of abundance patterns are estimated from the random errors and the systematic errors affected by uncertainties of model atmosphere parameters. We estimated the random errors from the standard deviation of abundances derived from individual lines. As for the abundances of elements that have only one or two available lines, the standard deviation of Fe
| log | |||||
|---|---|---|---|---|---|
| Species | Z | Our Measurement | Honda et al. (2006) | ||
| Sr II | 38 | ||||
| Y II | 39 | ||||
| Zr II | 40 | ||||
| Mo I | 42 | ||||
| Ru I | 44 | ||||
| Pd I | 46 | ||||
| Ba II | 56 | ||||
| La II | 57 | ||||
| Ce II | 58 | ||||
| Nd II | 60 | ||||
| Eu II | 63 | ||||
abundance ratios from individual Fe I lines is adopted. The standard deviation of Fe is also adopted for elements that have several available lines but the standard deviation of the abundances derived from these lines is smaller than that of Fe. We also independently estimated errors due to the uncertainties of equivalent width measurements based on the relation (Norris et al., 2001). For example, the error from the uncertainties of equivalent width of the Mo line at 3864 Å of BD, which has the lowest S/N at 4100 Å among the sample as shown in Table 1, is 0.10 dex. The errors due to the uncertainty of continuum placement, which is at most 2%, is 0.07 dex. These errors are smaller than those estimated from the standard deviation described above. Therefore, we adopted the standard deviations as the random errors, listed as “” in Table LABEL:tab:ElAbund.
| log g | [Fe/H] | ||||||||||
|---|---|---|---|---|---|---|---|---|---|---|---|
| Species | K | +100 K | +0.3 | +0.3 | +0.3 | ||||||
| Fe I | 0.12 | 0.04 | 0.00 | 0.14 | |||||||
| Fe II | 0.02 | 0.10 | 0.00 | 0.01 | 0.02 | ||||||
| Sr II | 0.10 | 0.05 | 0.09 | 0.26 | |||||||
| Y II | 0.08 | 0.08 | 0.01 | 0.07 | |||||||
| Zr II | 0.08 | 0.09 | 0.01 | 0.05 | |||||||
| Mo I | 0.15 | 0.01 | 0.00 | 0.00 | 0.00 | ||||||
| Ru I | 0.18 | 0.00 | 0.02 | 0.01 | |||||||
| Pd I | 0.15 | 0.02 | 0.02 | 0.00 | 0.02 | ||||||
| Ba II | 0.11 | 0.09 | 0.04 | 0.04 | |||||||
| La II | 0.08 | 0.10 | 0.01 | 0.00 | |||||||
| Ce II | 0.08 | 0.09 | 0.01 | 0.00 | 0.00 | ||||||
| Nd II | 0.08 | 0.09 | 0.01 | 0.01 | 0.00 | ||||||
| Eu II | 0.07 | 0.09 | 0.00 | 0.00 | 0.00 | ||||||
The uncertainties of model atmosphere parameters have effects mostly on the systematic errors of the abundances of neutron-capture elements. The effects of stellar parameters on abundances are given in Table 6 and Table 7 for HD 107752 ([Fe/H]=3.01) and BD ([Fe/H]=2.10), respectively, which hold the lowest and highest metallicity in our five samples. The rest of the stars, which hold similar properties, are expected to involve similar errors. Tables show differences in abundance measurements (original abundance abundance measured using changed parameter) by changing 100 K for , 0.3 dex for log , 0.3 dex for [Fe/H], and 0.3 km s-1 for .
In particular, effects of changing [Fe/H] and log are systematically different between abundances derived from neutral and ionized species. Abundances of Mo, Ru, and Pd are determined by lines of neutral species, whereas other heavy elements are measured from ionized species. This indicates that the abundance ratios derived from neutral and ionized species (e.g., Mo/Zr) could be significantly affected by parameters (e.g., ) adopted in the analysis. We investigate the effect on the abundance pattern of HD 107752, by conducting abundance analyses for and 4760 K. The log , [Fe/H], and are derived for each , resulting in 0.7dex higher log for the higher . The abundance ratios of heavy elements are dex systematically greater for 4760 K. Interestingly, however, the abundance patterns are not significantly dependent on the choice of . The effect of the changes of adopted in the analysis is larger for elements measured from neutral species. On the other hand, changes of log have little effect on the abundances of these elements, while elements measured from ionized species are affected by changes of log as well by the changes of . Hence, even though both neutral and ionized species are studied, the overall abundance pattern obtained by the present work is robust. We added the random and systematic errors in quadrature to derive the values adopted for error bars for comparison of abundance patterns, which are listed as “” in Table LABEL:tab:ElAbund.
3.5. Comparison with Previous Studies
To verify our results, we compare to the abundances measured by previous studies for the same objects. We exclude Sr from the comparison, since their abundances are less certain (§3.1). Differences of adopted atmospheric parameters and abundance results (our result minus the values of previous studies) are summarized in Table 8.
| log g | [Fe/H] | ||||||||||
|---|---|---|---|---|---|---|---|---|---|---|---|
| Species | K | +100 K | +0.3 | +0.3 | +0.3 | ||||||
| Fe I | 0.18 | 0.08 | 0.02 | 0.17 | |||||||
| Fe II | 0.03 | 0.10 | 0.05 | 0.08 | |||||||
| Sr II | 0.13 | 0.01 | 0.02 | 0.18 | |||||||
| Y II | 0.06 | 0.07 | 0.06 | 0.28 | |||||||
| Zr II | 0.04 | 0.10 | 0.07 | 0.09 | |||||||
| Mo I | 0.21 | 0.02 | 0.08 | 0.03 | |||||||
| Ru I | 0.25 | 0.05 | 0.07 | 0.02 | |||||||
| Pd I | 0.21 | 0.04 | 0.02 | 0.03 | |||||||
| Ba II | 0.07 | 0.09 | 0.06 | 0.05 | |||||||
| La II | 0.04 | 0.09 | 0.06 | 0.09 | |||||||
| Ce II | 0.05 | 0.11 | 0.07 | 0.05 | |||||||
| Nd II | 0.05 | 0.10 | 0.07 | 0.06 | |||||||
| Eu II | 0.04 | 0.09 | 0.06 | 0.00 | 0.00 | ||||||
| Pb I | 0.20 | 0.07 | 0.01 | 0.00 | 0.00 | ||||||
3.5.1 BD
Three neutron-capture elements (La, Eu, and Pb) of BD have been studied by Aoki & Honda (2008). A relatively large difference of atmospheric parameters is found in the value of log (0.4 dex). According to our error estimates (Table 7), such a difference in the value of log results in a change of the abundance of heavy elements around +0.09 dex. The difference in the value of is km s-1, which affects the abundance of La around +0.09 dex according to Table 7. The estimations are comparable with the difference between our results of La and Eu, and those of Aoki & Honda (2008). This suggests that the differences in abundance are mostly due to the difference of the adopted atmospheric parameters.
This object was also studied by Burris et al. (2000). They have measured the abundances of Y, Zr, Ba, La, Nd, and Eu. Overall, their results are in good agreement with ours as shown in Table 8. Largest disagreement is the measurement of Nd, for which their result is 0.12 dex higher than ours. The adopted by Burris et al. (2000) is lower than ours by 100 K. Such a difference in the value of results in lower abundance, while the higher log (0.20 dex) of our work partially cancels the effect.
3.5.2 HD 23798
Neutron-capture elements including La and Eu of HD 23798 have been studied by Simmerer et al. (2004). We adopt from their study. The difference of between their study and ours is km s-1, which does not significantly affect the analysis of weak lines. The abundances of the two elements are in good agreement with ours.
3.5.3 HD 85773
We adopt from Simmerer et al. (2004) for this target. The atmospheric parameters are overall in good agreement. The abundances of the two neutron-capture elements La and Eu measured by them are both higher than our results by around 0.2 dex. The ratio between La and Eu (La/Eu) is comparable. The reason for the discrepancy in abundances is unclear, due to the few available details of analysis in Simmerer et al. (2004).
The target has also been studied by Ishigaki et al. (2013). They measured abundances of Y, Zr, Ba, Nd, and Eu. The we adopt is K lower than their . [Fe/H] derived by our analysis is also lower than that of Ishigaki et al. (2013). Our overall abundance ratios are lower by 0.1 to 0.2 dex than their results, and the discrepancy is at least partially explained by the differences in adopted effective temperature.
3.5.4 HD107752
Neutron-capture elements of HD 107752 have been studied by Ishigaki et al. (2013). They measured the abundance of Y, Zr, Ba, Nd, and Eu. The and log in our analysis are 66 K and 0.2 dex lower than those in Ishigaki et al. (2013). According to our investigation on error estimates (Table 6), such differences in log and should affect the abundance about dex. The discrepancy of the abundances between the two studies is attributed to the difference in the adopted atmospheric parameters.
3.5.5 HD110184
Neutron-capture elements of HD 110184 have been studied by Honda et al. (2004). They measured abundances of Y, Zr, Ba, La, Ce, Nd, and Eu. The abundances of heavy neutron-capture elements from La to Eu obtained by our analysis are in good agreement with their results. The Ba abundance determined by our study is about 0.24 dex lower than their result. This is due to the difference in the adopted lines. Honda et al. (2004) use the two lines at 4554 and 4934 Å, which give out higher abundance compared to lines in the red range such as 5854 and 6497 Å we adopted (see §2).
| Star | [Fe/H] | log (dex) | ||||||||||
|---|---|---|---|---|---|---|---|---|---|---|---|---|
| (K) | (dex) | (dex) | (km s-1) | Y | Zr | Ba | La | Ce | Nd | Eu | References | |
| BD | 0 | 0.40 | 0.23 | 0.12 | 1 | |||||||
| 0.20 | 0.04 | 0.03 | 0.08 | 2 | ||||||||
| HD 23798 | 0 | 0.20 | 0.00 | 0.02 | 3 | |||||||
| HD 85773 | 0 | 0.00 | 0.00 | 3 | ||||||||
| 102 | 0.14 | 0.00 | 4 | |||||||||
| HD 107752 | 4 | |||||||||||
| HD 110184 | 0 | 0.20 | 0.00 | 0.30 | 0.03 | 0.19 | 0.03 | 5 | ||||
Our results of Y and Zr have differences of around 0.4 dex from theirs. The discrepancy is also due to the difference in the adopted lines. Honda et al. (2004) use five lines to determine the abundance of Y. Of these five lines, only 3950 Å is included in the lines we adopt. The equivalent width of 3950 Å measured by our study is 89.7 mÅ and abundance (log(Y)) derived is dex. Honda et al. (2004) measured 88.7 mÅ for this line, which is consistent with our measurement. Other lines used by Honda et al. (2004) are not included in our study, because some are within the gap of our spectrum and some are suspected to be affected by contamination. The abundances obtained from other lines we adopted are lower than that derived from the 3950 Å line, which renders our result, which is lower than that in Honda et al. (2004).
The abundance of Zr derived by Honda et al. (2004) is 0.32 dex higher than our result. We adopt six lines to determine the abundance of Zr, whereas Honda et al. (2004) adopted three lines (4161, 4209, and 4317 Å). Among these lines, we do not adopt 4161 Å due to contamination suspected for the line. The average of the abundance obtained from the other two lines (4209 and 4317 Å) is 0.20 dex, which is in good agreement with Honda et al. (2004), whereas the abundance derived from the rest of the lines adopted in our study is higher than theirs.
The abundances of Y, Zr, Pd, Ba, and Eu are also studied by Hansen et al. (2012). In addition, Hansen et al. (2014) measured Mo and Ru for this object. The abundances ( values) of these elements derived by Hansen et al. (2012, 2014) are 0.5 – 0.8 dex higher than our results. This is partially explained by the difference of adopted atmospheric parameters: the we adopt is 210 K lower than theirs. Differences of abundances between the two studies, however, remain to be of the 0.2 dex level, even after the differences of parameters are taken into consideration. The reason for the discrepancy is unclear, due to the few available details of abundance analysis for this object in their studies. It should be noted, however, that these differences are systematic, and the overall abundance patterns obtained by the two studies are similar to each other.
4. Results and Discussion
4.1. Comparison with the Solar r-process Pattern
Figures 4 (a) - (e) show abundances of the five target stars compared to the Eu scaled solar r-process pattern (Simmerer et al., 2004). The abundance pattern of HD 122563 (Honda et al., 2006) and CS 22892-052 (Sneden et al., 2003) are also compared to the solar r-process pattern in Figure 4 (f). The abundance patterns of HD 122563 and the solar r-process are scaled to the Eu abundance of CS 22892-052.


As shown in Figure 4 (a) and (b), the abundance patterns of heavy neutron-capture elements of the two stars, HD 107752 and HD 110184, agree with that of the scaled solar r-process. An exception is Ce, which is overabundant at about 0.4 dex compared to the scaled solar r-process pattern in both stars. Similar disagreement is also found in the abundance of HD 122563; its measurement of Ce results in the overabundance of about 0.5 dex (Figure 4 (f)).
On the contrary, the abundances of light neutron-capture elements of all the target stars tend to be overabundant compared to the solar r-process pattern normalized at Eu. The levels of overabundance are not as evident as found in HD 122563 (Fig. 4 (f)). This is expected from our target selection (Fig. 1), since our targets are known to have higher [Zr/Ba] ratios than the solar values, but not as extreme as HD 122563. Such an overabundance of light neutron-capture elements suggests contribution of the weak r-process. In particular, the abundances of Sr and Zr are significantly overabundant. An exception is Y, which shows no excess compared to the scaled solar r-process pattern. Similar trend of Y is also found in CS 22892-052 and HD 122563 (Fig. 4(f)). Mo is overabundant in all the objects. However, not all of the stars show an overabundance in Ru, while Pd is under-abundant in all of the objects.
The three target stars BD, HD 23798, and HD 85773 (Fig. 4 (c)–(d)) also show overabundances of heavy neutron-capture elements, especially of Ba. We discuss possible contributions of the s-process to these elements in section §4.2.
4.2. Contributions of Main r-process, Weak r-process and s-process
We interpret the excess of light neutron-capture elements in our objects as contamination of the weak r-process. If this is the case, the abundances of our target stars will be explained by the average of the abundances of the main and weak r-processes with certain weights, assuming that both processes have universal patterns. We attempt to explain the abundance distributions of our target stars by adopting the abundances of CS 22892-052 and HD 122563 as representative of the main r-process and the weak r-process, respectively. The contributions of the two components are determined to reproduce the abundance ratios between Zr and Eu of each target star. We calculate the weights of the main r-process (f) and the weak r-process () as
| (1) |
where and are the abundances of element for CS 22892-052 and HD 122563, respectively. is the abundance of element for each of target star. The parameter is the contribution weight of the main r-process to Zr for each star, as presented in Table 9. We apply the weight of main r-process contribution to other elements by calculating
| (2) |
where is the linear abundance of each element. Table 9 also gives the weak r-process contribution ratio calculated for Zr
| (3) |
Figures 5(a)-(e) show our target stars compared with the mixtures of the main and weak r-process patterns with contribution weights of the main r-process presented in Table 9. The lines fit well to the abundance distributions of the stars HD 107752 and HD 110184 (Fig. 5 (a) and (b)).


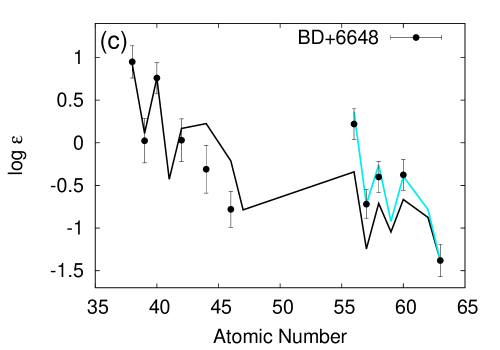
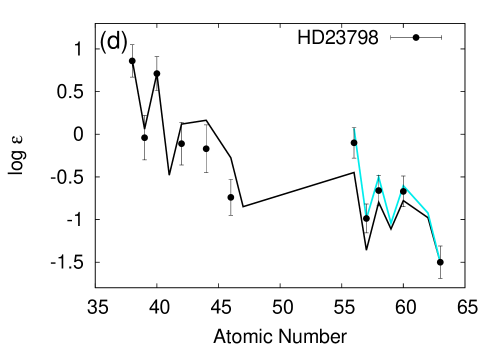
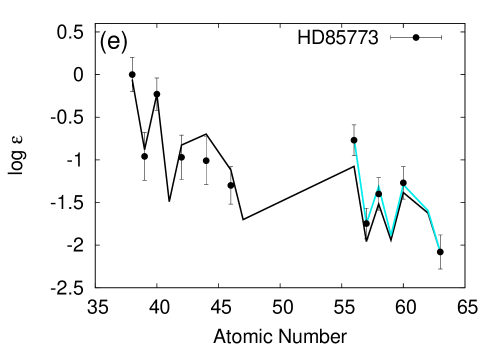

Figures 5 (c)–(e) show results of BD, HD 23798, and
| Object Name | (Zr) | (La) | ||
|---|---|---|---|---|
| BD | 0.02 | 0.94 | 0.99 | 0.71 |
| HD 23798 | 0.01 | 0.95 | 0.99 | 0.58 |
| HD 85773 | 0.06 | 0.83 | 1.00 | 0.39 |
| HD 107752 | 0.07 | 0.80 | ||
| HD 110184 | 0.04 | 0.87 |
HD 85773, respectively. Contrary to the cases for HD 107722 and HD 110184, some light elements such as Ru cannot be reproduced by the mixed abundance patterns. Furthermore, already pointed out in §4.1, some heavy neutron-capture elements such as Ba and La are overabundant compared to Eu in these three stars. In Figure 5 (c) – (e), we add cyan lines, which represent contribution of the s-process to heavy neutron-capture elements. For the s-process, the contribution weights are calculated in the same manner applied to the contribution of the weak r-process, so that the abundance ratios of La to Eu match the observational results. We adopted the solar s-process pattern by Simmerer et al. (2004). The s-process weight () and the s-process contribution to La, (La), are presented in Table 9. The abundance patterns of heavy neutron-capture elements for these three stars are well reproduced by adding s-process (Fig. 5), suggesting their overabundance is due to the s-process contamination. Honda et al. (2006) also found such overabundance in heavy neutron-capture elements of HD 122563 and investigated for the contribution of the main s-process. They searched for a combination of the solar r-process and s-process pattern that gives the best fit to the abundance patten of the star. They concluded that some heavy neutron-capture elements such as Ba and La have little contribution of s-process, and thus have no influence on the light neutron-capture elements.
We also inspect the s-process contributions from abundances of Pb. At low metallicity, Pb is sensitive to s-process nucleosynthesis (e.g., Busso et al., 1999). We measure the Pb abundance of BD and HD 23798, and estimate the upper limit for HD 85773. Figure 6(left) shows the [Pb/Fe] abundance
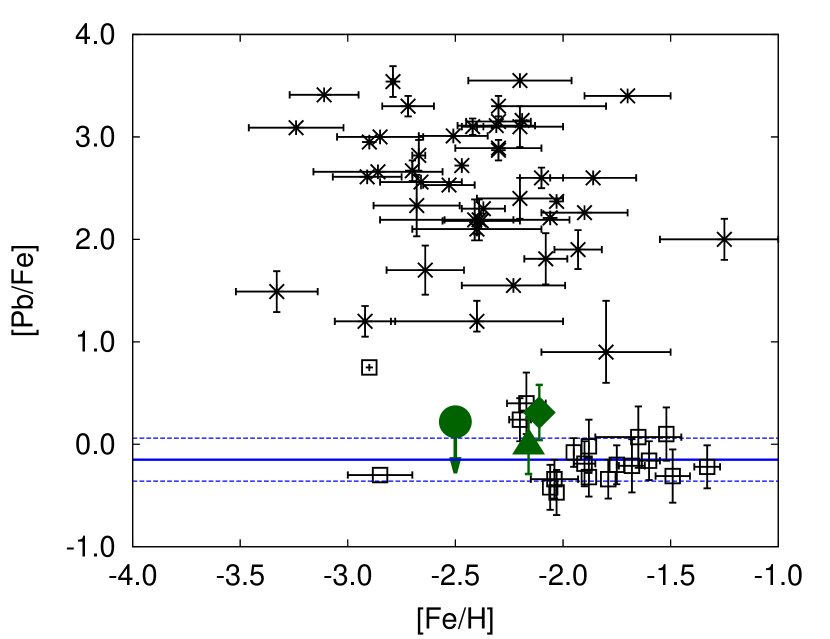
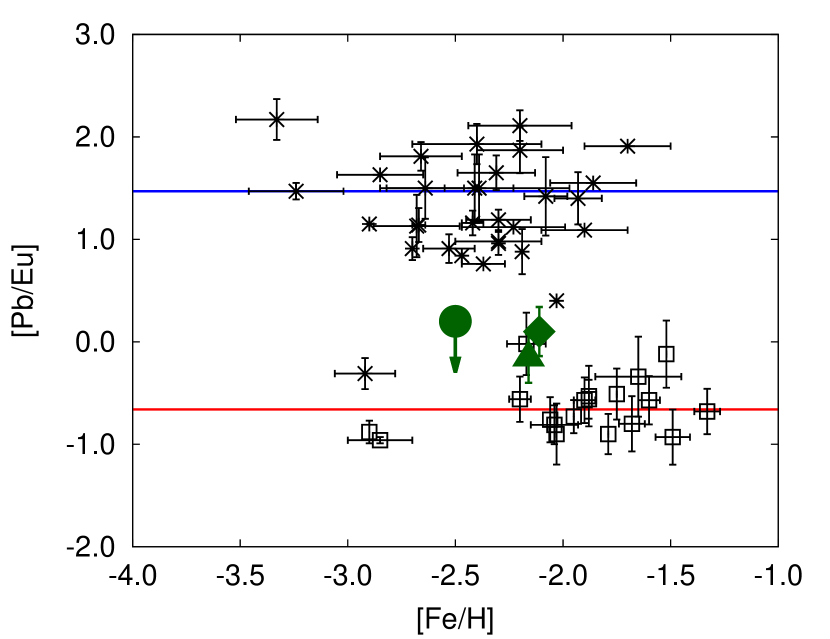
ratios as a function of [Fe/H] with plots of previous studies (Sneden et al., 1998; Hill et al., 2002; Ivans et al., 2006; Aoki & Honda, 2008; Roederer et al., 2009, 2010, 2012), with our three objects. Most Carbon-Enhanced Metal-Poor stars (CEMP) with s-process abundances have higher [Pb/Fe] than normal metal-poor stars possibly due to mass transfer from companion AGB stars. The solid line of Figure 6 shows the average abundance ratio ([Pb/Fe] dex) of normal metal-poor stars taken from previous studies, and the dotted lines show the standard deviations around the average values. Our objects have relatively high [Pb/Fe] compared to the average abundance ratio of normal metal-poor stars. Figure 6(right) shows the abundance ratios of [Pb/Eu]. Assuming that Eu represents r-process elements, the abundance ratio of Pb to Eu is an indicator of s-process contamination. The upper and lower solid lines show the abundance ratios of the solar-system s-process and r-process components, respectively (Sneden et al., 1996). The ratio of the solar r-process component is comparable to the average abundance ratio of normal metal-poor stars ( dex). Apparently, the [Pb/Eu] ratios of the two objects in our sample are also slightly higher than the average abundance ratio of normal metal-poor stars.
These results suggest small contributions of the s-process to BD and HD 23798. However, the light neutron-capture elements are considered to be less produced by the s-process. In low metallicity, the number of neutrons per seed nuclei is larger, resulting in efficiently producing the heavier neutron-capture elements (e.g., Busso et al., 1999). We interpret that the excess of light neutron-capture elements in these stars, as well as in HD 107752 and HD 110184, is attributed to contributions of the weak r-process.
4.3. Detailed Abundance Pattern of Light Neutron-capture Elements
As discussed in Section 4.2, the light neutron-capture elements of our target stars can be interpreted at least partially as the products of the weak r-process. In this subsection,
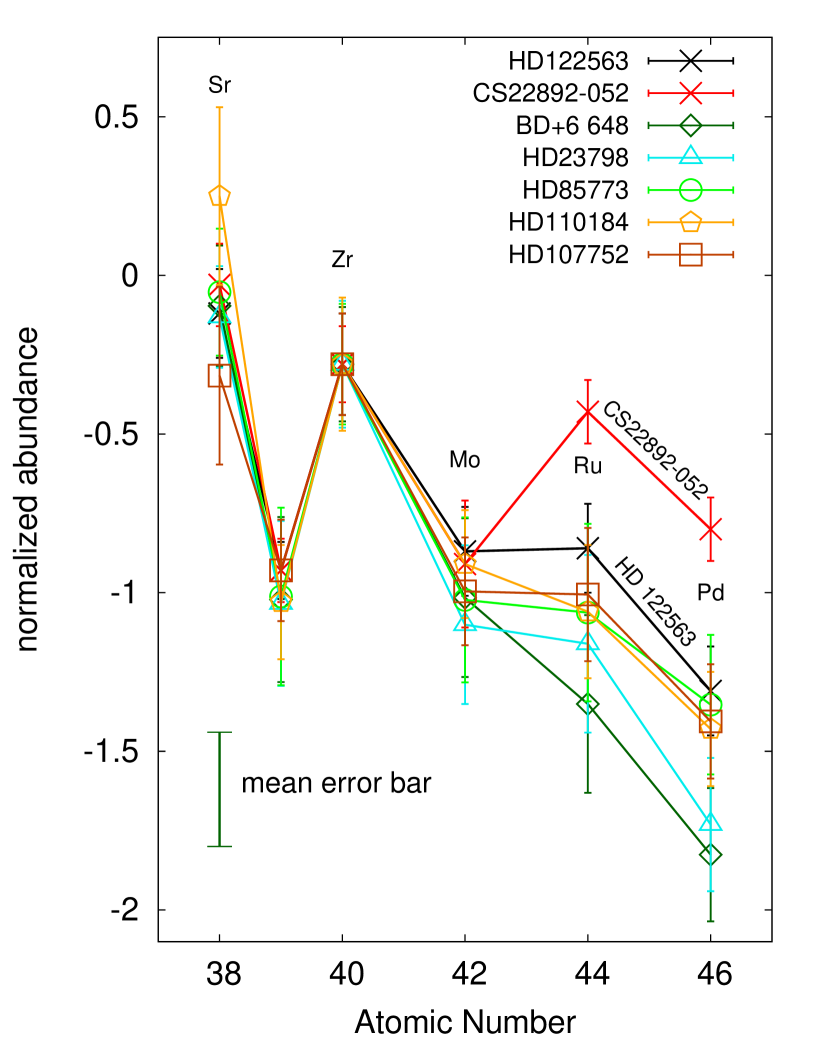

we discuss the nucleosynthetic nature of the weak r-process from our observational results. We compare the abundances of light neutron-capture elements to inspect whether the weak r-process yields a universal pattern as found in the case of the main r-process.
Figure 7 shows the abundances of light neutron-capture elements from Sr to Pd for the five observed stars. The abundances of HD 122563 and CS22892-052 are also shown for comparison purposes. The abundance patterns for the five stars are scaled to match the Zr abundance of HD 122563, since Zr can be a representative element of the weak r-process and its abundance is better determined than the Sr abundance.
As found in Figure 7, the abundance patterns of HD 107752, HD 110184 and HD 85773 agree within the measurement errors. Compared to these stars, the abundances patterns of HD 23798 and BD drastically drop toward Pd. Clearly, these drops cannot be reproduced by a combination of the abundance patterns of CS 22892-052 and HD 122563.
The steeply descending abundance patterns in BD and HD 23798 might indicate that these stars better represent the pure weak r-process pattern rather than HD 122563. Therefore, we examine whether the combination of the abundance patterns of CS 22892-052 and BD reproduces that of HD 122563. Figure 8 shows the abundances of Figure 8 shows the abundances of HD 122563 compared to the

solid line indicating a combination of the abundance patterns of CS22892-052 and BD at certain weights, in the same manner as we did for Figure 5. As found in Figure 8, the heavy neutron-capture elements expected from the mixture are much more abundant than those of HD 122563, because a significant contribution of the main r-process is required to reproduce the abundance pattern of light neutron-capture elements for this object. In addition, the mixed pattern fails to reproduce the Ru and Pd abundances of HD 122563. Hence, we conclude that the light neutron-capture elements are produced by the weak r-process, and their abundances have diversity.

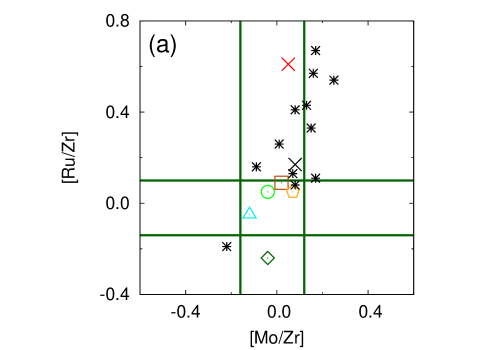
As found in Figure 7, the abundance patterns of the five stars analyzed here and the two stars previously studied show a similar trend from Sr to Mo. The diversity becomes evident from Ru. As shown in Figure 9 (a), the [Mo/Zr] ratios of all stars are within the range of random errors, while those of [Ru/Zr] show a wide distribution. This figure suggests that the abundance patterns are robust from Zr to Mo, while Ru does not show correlation with Mo and Zr. Figure 9 (b) shows [Ru/Zr] abundance ratios as a function of [Pd/Zr]. A correlation is found in the five target stars and HD 122563 as indicated by the solid regression line. The slope of the regression line is less than one, indicating that abundance spreads are more wider in Pd than in Ru. Interestingly, the value of CS 22892-052 also locates near the extension of the regression line. In Figures 9 (a) and (b), abundance ratios determined by Hansen et al. (2014) for stars with [Fe/H] are also plotted by asterisks. Most of their results are in between the results of our target stars and that of CS 22892-052. Their results distribute along the slopes estimated for our sample, supporting the above argument about the diversity of the abundance pattern found for elements heavier than Mo.
4.4. Comparison with Supernova Nucleosynthesis Models
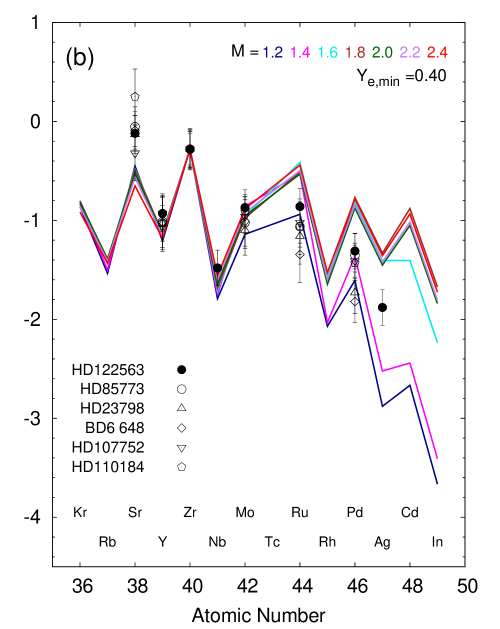
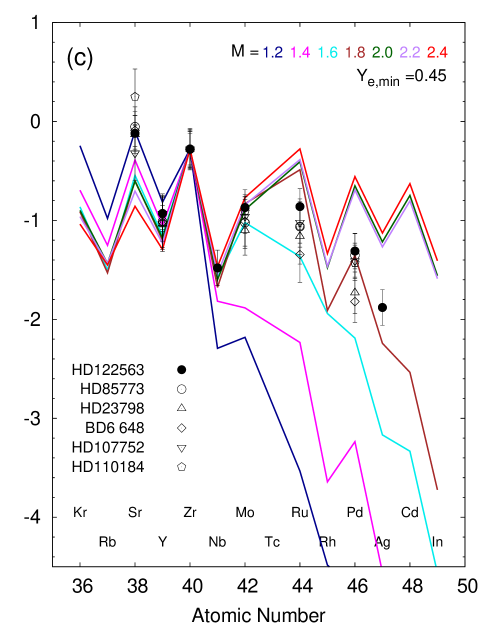
Based on the analysis of abundance patterns of our sample, we attempt to interpret the site of the weak r-process. In this subsection, we inspect the abundance patterns of our target stars by comparing them to nucleosynthesis models of types of supernovae, which are expected to be candidates of the weak r-process sites. Proposed candidates of the r-process site include supernovae (e.g., Woosley et al., 1994) and neutron-star mergers (e.g., Freiburghaus et al., 1999). Recent theoretical studies suggest traditional neutrino-driven supernovae as a major site of light r-process elements, but not for the heavy r-process elements (Wanajo et al., 2011; Wanajo, 2013). A scenario of magnetically driven supernovae has been proposed as a possible site of the main r-process, though nucleosynthetic outcomes are highly dependent on their poorly constrained physical conditions (Winteler et al., 2012; Nishimura et al., 2015). The latest nucleosynthesis studies based on general-relativistic hydrodynamical simulations show that neutron-star mergers can be a main r-process sites because they make both light and heavy r-process elements (Wanajo et al., 2014; Goriely et al., 2015). Additional support for the merger scenario has also been presented from the studies of spectroscopic analyses (“r-process galaxy,” Ji et al., 2016; Roederer et al., 2016) and galactic chemical evolution (Tsujimoto & Shigeyama, 2014; Hirai et al., 2015; Ishimaru et al., 2015; Shen et al., 2015; van de Voort et al., 2015). For these reasons, we focus on the two available models of neutrino-driven supernovae (Wanajo et al., 2011; Wanajo, 2013) to be compared with our result, though other scenarios may not be ruled out as weak r-process sites.
The supernova nucleosynthesis models by Wanajo et al. (2011) and Wanajo (2013) show diversity in elemental abundances by variations of parameters such as electron fraction and proto-neutron-star (PNS) mass. The model abundance patterns are scaled to Zr, as shown in colored lines of Figure 10, and most of the model lines show variations from the intermediate mass elements such as Ru. As shown in Section 4.3, we also find such diversity of the abundance patterns for light neutron-capture elements of metal-poor stars. While all the stars show similar trends from Sr to Mo, Ru abundances show variations; some stars show low Ru abundance compared to Mo, while some stars show higher abundance than Mo. We expect that this variation in Mo and Ru abundance ratios can serve as a hint to constrain the physical condition in supernovae.
Figure 10 (a) shows a comparison of our target stars with the two-dimensional hydrodynamical model (up to 350 ms after core bounce) of an electron-capture supernova (ECSN, Wanajo et al., 2011). ECSNe are neutrino-driven explosions from collapsing oxygen-neon-magnesium cores of the low-mass end of supernova progenitors (Nomoto, 1987; Kitaura, Janka, & Hillebrandt, 2006; Janka et al., 2008; Wanajo et al., 2009). The unique structure of a pre-supernova core with a relatively small barionic mass of (gravitational mass of ) surrounded by a dilute hydrogen-helium envelope leads to a fast explosion, ejecting less neutrino-processed, and thus, more neutron-rich material (than those expected for more massive progenitors). The original self-consistently exploding model of Wanajo et al. (2011), however, results in the production of the lightest neutron-capture elements up to Zr (red line in Figure 10(a)). They argued that a possibility of ejecting slightly more neutron-rich material could not be excluded because of the limitations of their simulation (e.g., resolution and two-dimensionality). As they demonstrated, the abundance pattern of light neutron-capture elements for HD 122563 can be reasonably explained when the original minimum electron fraction (proton-to-nucleon ratio) of is replaced by (blue line in Figure 10 (a)). We, therefore, compare our result to the abundance patterns of their modified models with various values as shown in Figure 10 (a), where the abundances are vertically shifted to match the Zr of HD 122563. Here, could be taken as a realistic range. Given the fairly robust physical conditions of ECSNe, the possible range of would be small in reality. Owing to the nucleosynthetic outcomes extremely sensitive to , we find that the variations of abundance patterns in our samples can be well bracketed with a small range of –0.33. These models cannot explain, however, the abundance ratios Mo/Ru of the presented stars. Such a ratio is given by the model with ; however, the absolute values of abundances are too small compared to the target stars.
Figure 10 (b) and (c) show the comparison with the semi-analytic, spherically symmetric, general-relativistic model of PNS wind of core-collapse supernovae (Wanajo, 2013). The model involves a gravitational mass of proto-neutron star () and a as free parameters. The neutrino-driven wind phase lasts 10 s after core bounce with (somewhat arbitrary determined) temporal evolutions of neutrino luminosity, PNS radius, and (see Figs. 1 and 2 in Wanajo, 2013). In Figures 10 (b) and (c), we compare our result with the abundance patterns obtained from the PNS models of and 0.45, respectively. A reasonable range may be according to recent hydrodynamical studies (Fischer et al., 2012; Martínez-Pinedo et al., 2012; Roberts et al., 2012), which is, however, highly uncertain because of a lack of long-term multi-dimensional simulations with neutrino transport.
The colored lines show those of –. The abundances of the stars and of models are vertically shifted to match the Zr abundance of HD 122563. A realistic range of PNS masses would be – according to recent systematic studies of one-dimensional core-collapse simulations (Ertl et al., 2016). As can be seen in Figure 10 (b) (), the abundances of the stars are reasonably bracketed with a smaller range of – (than that in Ertl et al., 2016). If a greater (=0.45) is taken as in Figure 10 (c), the range shifts to the more massive side of –, which is slightly out of that predicted from hydrodynamical studies (Ertl et al., 2016). Among the presented models, those with and satisfy the ratios Mo/Ru of the stars. It suggests, therefore, that a reasonable parameter space of and brackets the abundance variations.
In conclusion, the diversity of abundance patterns in our sample can be interpreted as a result of possible ranges of quantities, such as and , in relevant astrophysical sites. The variation of abundance patterns for the presented stars can be well explained with only small ranges of such quantities, e.g., –0.33 (ECSN models) or – (a subset of PNS models). The result implies that the weak r-process site has fairly robust physical conditions (such as ECSNe), provided that our sample well represents the diversity of light neutron-capture abundances. Alternatively, the site has various physical conditions (such as PNS winds) and the diversity of neutron-capture abundances is in fact greater than that found in this study. The ratio Mo/Ru can also serve as a constraint on theoretical modeling.
5. Summary
We analyzed the abundance patterns of five very-metal-poor stars, including Mo, Ru, and Pd, which are known to have high light-to-heavy abundance ratios of neutron-capture elements. We compared the abundances with the r-process component of the solar-system material and found that the patterns of light neutron-capture elements of our targets have diversity. We found a sizable variation in the abundances of elements starting from Ru toward Pd. We also confirmed robustness of abundance patterns up to Mo, which resulted in a small variation of abundance ratios of [Mo/Zr] as a function of [Ru/Zr] for the seven stars including our targets and reference (HD 122563 and CS 22892-052) stars. The significant decrease in light neutron-capture elements especially from Mo to Pd can be explained as a result of weak r-processing in core-collapse supernovae. In addition, the diversity found in our sample can be attributed to small variations of quantities, such as electron fraction or PNS mass, in relevant weak r-process sites. Future spectroscopic studies of additional weak r-process-like stars will be crucial to elucidate the diverseness of light neutron-capture abundances, which serve as diagnostics of the proposed supernova models.
References
- Aoki et al. (2005) Aoki, W., Honda, S., Beers, T. C., et al. 2005, ApJ, 632, 611
- Aoki & Honda (2008) Aoki, W., & Honda, S. 2008, PASJ, 60, L7
- Aoki et al. (2009) Aoki, W., Barklem, P. S., Beers, T. C., et al. 2009, ApJ, 698, 1083
- Asplund et al. (2009) Asplund, M., Grevesse, N., Sauval. A. J., & Scott, P. 2009, ARA&A, 47, 481
- Barbuy et al. (2011) Barbuy, B., Spite, M., Hill, V., et al. 2011, A&A, 534, A60
- Beers et al. (2005) Beer, T. C. & Christlieb, N. 2005, ARA&A, 43, 531-580
- Burris et al. (2000) Burris, D. L., Pilachowski, C. A., Armandroff, T. E., et al. 2000, ApJ, 544, 302
- Busso et al. (1999) Busso, M., Gallino, R., & Wasserburg, G. J. 1999, ARA&A, 37, 239
- Castelli & Kurucz (2003) Castelli, F., & Kurucz, R. L. 2003, in IAU Symp., Modelling of Stellar Atmosphere, ed. N. Piskunov, W.W. Weiss, and D.F. Gray (Cambridge: Cambridge Univ. Press), A20
- Cescutti et al. (2013) Cescutti, G., Chiappini, C., Hirschi, R., Meynet, G., & Frischknecht, U. 2013, A&A, 553, A51
- Chiappini et al. (2011) Chiappini, C., Frischknecht, U., Meynet, G., et al. 2011, Nature, 472, 454
- Ertl et al. (2016) Ertl, T., Janka, H.-Th., Woosley, S. E., Sukhbold, T., & Ugliano, M. 2016, ApJ, 818, 124
- Fischer et al. (2012) Fischer, T., Martínez-Pinedo, G., Hempel, M., & Liebendörfer, M. 2012, PhRvD, 85, 083003
- Freiburghaus et al. (1999) Freiburghaus, C., Rosswog, S., & Thielemann, F. K. 1999, ApJ, 525, L124
- González Hernández & Bonifacio (2009) González Hernández, J. I. & Bonifacio, P. 2009, A&A, 497, 497
- Goriely et al. (2015) Goriely, S., Bauswein, A., Just, O., Pllumbi, E., & Janka, H.-T. 2015, MNRAS, 452, 3894
- Hansen et al. (2012) Hansen, C. J., Primas, F., Hartman, H., et al. 2012, A&A, 545, 31
- Hansen et al. (2014) Hansen, C. J., Andersen, A. C., & Christlieb, N. 2014, A&A, 568, 47
- Hill et al. (2002) Hill, V., Plez, B., Cayrel, R., et al. 2002, A&A, 387, 560
- Hirai et al. (2015) Hirai, Y., Ishimaru, Y., Saitoh, T. R., Fujii, M. S., Hidaka, J., Kajino, T. 2015, ApJ, 814, 41
- Honda et al. (2006) Honda, S., Aoki, W., Ishimaru, Y., Wanajo, S., Ryan, S. G. 2006, ApJ, 643, 1180
- Honda et al. (2004) Honda, S., Aoki, W., Kajino, T., et al. 2004, ApJ, 607, 474
- Ishigaki et al. (2013) Ishigaki, M. N., Aoki, W., Chiba, M. 2013, ApJ, 771, 67
- Ishimaru et al. (2015) Ishimaru, Y., Wanajo, S., & Prantzos, N. 2015, ApJ, 804, L35
- Ivans et al. (2006) Ivans, I., Simmerer, J., Sneden, C., et al. 2006, ApJ, 645, 613
- Janka et al. (2008) Janka, H.-Th., Müller, B., Kitaura, F. S., & Buras, R. 2008, A&A, 485, 199
- Ji et al. (2016) Ji, A. P., Frebel, A., Chiti, A., & Simon, J. D. 2016, Nature, 531, 610
- Johnson & Bolte (2002) Johnson, J. A., & Bolte, M. 2002, ApJ, 579, 616
- Kitaura, Janka, & Hillebrandt (2006) Kitaura, F. S., Janka, H.-Th., & Hillebrandt, W. 2006, A&A, 450, 345
- Kurucz (1993) Kurucz, R. L. 1993, CD-ROM 13, ATLAS9 Stellar Atmosphere Programs and 2 km /s Grid (Cambridge: SAO)
- Lawler et al. (2009) Lawler, J. E., Sneden, C., Cowan, J. J., Ivans I. I., & Den Hartog, E. A. 2009, ApJ, 182, 51
- Lawler et al. (2001) Lawler, J. E., Wickliffe, M. E., Den Hartog, E. A., & Sneden, C. 2001, ApJ, 563, 1075
- Martínez-Pinedo et al. (2012) Martínez-Pinedo, G., Fischer, T., Lohs, A., & Huther, L. 2012, PhRvL, 109, 251104
- McWilliam et al. (1995) McWilliam, A., Preston, G. W., Sneden, C., & Searle, L. 1995, AJ, 109, 2757
- McWilliam et al. (1998) McWilliam, A. 1998, AJ, 115, 1640
- Nishimura et al. (2015) Nishimura, N., Takiwaki, T., & Thielemann, F.-K. 2015, ApJ, 810, 109
- Noguchi (2002) Noguchi, K., Aoki, W., Kawanomoto, S., et al. 2002, PASJ, 54, 855
- Nomoto (1987) Nomoto, K. 1987, ApJ, 322, 206
- Norris et al. (2001) Norris, J. E., Ryan, S. G., & Beers, T. C. 2001, ApJ, 561, 1034
- Oja (1985) Oja, T. 1985, A&AS, 61, 331
- Peterson (2011) Peterson, R. C. 2011, ApJ, 742, 21
- Roberts et al. (2012) Roberts, L. F., Reddy, S., & Shen, G. 2012, PhRvC, 86, 065803 ApJL, 736, L21
- Roederer et al. (2009) Roederer, I. U., Kratz, K., Frebel, A., et al. 2009, ApJ, 698, 1963
- Roederer et al. (2010) Roederer, I. U., Sneden, C., Thompson, I. B., Preston, G. W., & Shectman, S. A. 2010, ApJ, 711, 573
- Roederer et al. (2012) Roederer, I. U., Lawler, J. E., Sobeck, J. S. et al. 2012, ApJS, 203, 27
- Roederer et al. (2016) Roederer, I. U., Mateo, M., Bailey, J. I., et al. 2016, AJ, 151, 82
- Ryan et al. (1996) Ryan, S. G., Norris, J. E., Beers, T. C., 1996, ApJ, 471, 254
- Simmerer et al. (2004) Simmerer, J., Sneden, C., Cowan, J. J., et al. 2004, ApJ, 617, 1091
- Shen et al. (2015) Shen, S., Cooke, R. J., Ramirez-Ruiz, E., Madau, P., Mayer, L., Guedes, J. 2015, ApJ, 807, 115
- Siqueira Mello et al. (2014) Siqueira Mello, C., Hill, V., Barbuy, B., et al. 2014, A&A, 565, A93
- Siqueira Mello et al. (2013) Siqueira Mello, C., Spite, M., Barbuy, B., et al. 2013, A&A, 550, A122
- Sneden et al. (1998) Sneden, C., Cowan, J. J., Burris, D. L., & Truran, J. W. 1998, ApJ, 496, 235
- Sneden et al. (2003) Sneden, C., Cowan, J. J., Lawler, J. E., et al. 2003, ApJ, 591, 936
- Sneden et al. (2008) Sneden, C., Cowan, J. J., & Gallino, R. 2008, ARA&A, 46, 241-288
- Sneden et al. (1996) Sneden, C., McWilliam, A., Preston, G. W., et al. 1996, ApJ, 467, 819
- Truran et al. (2002) Truran, J. W., Cowan, J. J., Pilachowski, C. A., & Sneden, C. 2002, PASP, 114, 1293
- Travaglio et al. (2004) Travaglio, C., Gallino, R., Arnone, E., et al. 2004, ApJ, 601, 864
- Tsuji (1978) Tsuji, T. 1978, A&A, 62, 29
- Tsujimoto & Shigeyama (2014) Tsujimoto, T. & Shigeyama, T. 2014, A&A, 565, L5
- van de Voort et al. (2015) van de Voort, F., Quataert, E., Hopkins, P. F., Kere, D., & Faucher-Giguère, C.-A. 2015, MNRAS, 447, 140
- Wanajo & Ishimaru (2006) Wanajo, S. & Ishimaru, Y. 2006, NuPhA, 777, 676
- Wanajo et al. (2009) Wanajo, S., Nomoto, K., Janka, H.-T., Kitaura, F. S., Müller, B. 2009, ApJ, 695, 208
- Wanajo et al. (2011) Wanajo, S., Janka, H.-T., & Müller, B. 2011 ApJ, 726, L15
- Wanajo (2013) Wanajo, S. 2013 ApJ, 770, L22
- Wanajo et al. (2014) Wanajo, S., Sekiguchi, Y., Nishimura, N., Kiuchi, K., Kyutoku, K., & Shibata, M. 2014, ApJ, 789, L39
- Winteler et al. (2012) Winteler, C., Käppeli, R., Perego, A., et al. 2012, ApJL, 750, L22
- Woosley et al. (1994) Woosley, S. E., Wilson, J. R., Mathews, G. J., Hoffman, R. D., & Meyer, B. S. 1994, ApJ, 433, 229
- Wu et al. (2015) Wu, X., Wang, L., Shi, J., Zhao, G., Grupp, F. 2015, A&A, 579, A8