Interaction effects on galaxy pairs with Gemini/GMOS- III: Stellar population synthesis
Abstract
We present an observational study of the impacts of the interactions on the stellar population in a sample of galaxy pairs. Long-slit spectra in the wavelength range 3440-7300 Å obtained with the Gemini Multi-Object Spectrograph (GMOS) at Gemini South for fifteen galaxies in nine close pairs were used. The spatial distributions of the stellar population contributions were obtained using the stellar population synthesis code STARLIGHT. Taking into account the different contributions to the emitted light, we found that most of the galaxies in our sample are dominated by the young/intermediate stellar populations. This result differs from the one derived for isolated galaxies where the old stellar population dominates the disc surface brightness. We interpreted such different behavior as being due to the effect of gas inflows along the disk of interacting galaxies on the star formation in a time scale of the order of about 2 Gyr. We also found that, in general, the secondary galaxy of the pairs has a higher contribution of the young stellar population than the primary one. We compared the estimated values of the stellar and nebular extinctions derived from the synthesis method and the H/H emission-line ratio finding that the nebular extinctions are systematically higher than stellar ones by about a factor of 2. We did not find any correlation between nebular and stellar metallicities. We neither found a correlation between stellar metallicities and ages while a positive correlation between nebular metallicities and stellar ages was obtained, with the older regions being the most metal-rich.
keywords:
interactions galaxy: spectroscopy stellar population : ISM: stellar population synthesis:1 Introduction
Interactions and mergers of galaxies have a deep influence on the star formation pattern and on the chemical enrichment of the interstellar medium of these objects.
It has been well known that interacting galaxies show enhanced star formation when compared them with isolated galaxies (e.g. Larson & Tinsley 1978; Sekiguch & Wolstencroft 1992; Donzelli & Pastoriza 1997; Barton et al. 2003; Woods & Geller 2007; Scudder et al. 2012; Patton et al. 2013). The enhancement of the star formation rate (SFR) has been observed as being a function of the separation of the close pair galaxies. In fact, Patton et al. (2013), by using spectroscopic data of about 211 000 star forming galaxies taken from the Sloan Digital Sky Survey Data Release 7 (Abazajian et al., 2009), found a clear enhancement of the SFR for galaxies with projected separations up to 150 kpc, being the strongest enhancements for separations lower than kpc (see also Barton et al. 2000; Lambas et al. 2003; Nikolic et al. 2004; Scudder et al. 2012; Casteels et al. 2013; Satyapal et al. 2014). The effect of the interaction on the SFR seems to be more pronounced for galaxy pairs with low-mass (Woods & Geller, 2007; Krabbe et al., 2008) and gas-rich (Chien et al., 2007).
The SFR enhancements are accompanied of other events such as perturbations in the radial velocity field and dilution of the metallicity gradient. Interaction-induced flows of gas with low metallicity from the outer parts of the disk of a galaxy can decrease the metallicity in the inner regions and modify the radial abundance gradients. In fact, Krabbe et al. (2008), Kewley et al. (2010), Rupke et al. (2010), and Rosa et al. (2014), analyzing spectroscopic data of H ii regions located in galaxy pairs, found shallow metallicity gradients. In particular, Rosa et al. (2014) found a break in the oxygen gradient (generally used as metallicity tracer) at a certain galactocentric distance in four interacting galaxies of their sample: AM 1219A, AM 1256B, AM 2030A and AM 2030B. Interestingly, these authors reported that the extreme SFR values estimated from the H emission-line fluxes, (minimum SFR for AM1219A and AM2030B, and maximum for AM 1256B and AM 2030) are located very close to the oxygen gradient break zones. Rosa and collaborators also suggested that for the AM1219A and AM2030B systems, the minimum values of the SFRs and the break zones could be associated with corotation radii.
Determinations of SFRs based on H emission-line fluxes give information of the ionizing star forming clusters. To access to the history of the stellar population, we should perform studies based on stellar population synthesis. Studies of the spatial distribution of the stellar population components in interacting galaxies yield important insights on the effects of the interaction on the kinematics of the galaxies involved, allowing to know the periods on which occurred the bursts of star formation as well as the stage of the interaction (Krabbe et al., 2008).
On the previous papers of this series, we presented observational studies of the spatial variation
of the electron density (Krabbe et al. 2014, hereafter Paper I) and of the metallicity (Rosa et al. 2014, hereafter Paper II) of H ii regions located in a sample of interacting systems of galaxies.
In the present work, we used these data to obtain the stellar population across the disk of these galaxies and to study the impacts of the interaction on the stellar population of the galaxies in our sample.
The main goals of our study are:
i) To estimate the main epoch of star formation along the disk of the interacting galaxies.
ii) To analyze the relation between the stellar population distributions
with the metallicity of the gas phase.
iii) To investigate the relation between the age of the dominant stellar population with
several nebular parameters (e.g. metallicity, extinction).
This paper is organized as follows. In Section 2 we summarize the observations and data reduction. In Section. 3 the method used to perform the stellar population synthesis is described. Section 4 presents the detailed results of the stellar population synthesis. The discussion of our results is given in Section 5 while the conclusions are presented in Section 6.
| System name | Individual names | Designation | (2000) | (2000) | PA (°) | (Å) | E(B-V) | NS(kpc) |
|---|---|---|---|---|---|---|---|---|
| AM 1054-325 | ESO 376-IG 027 | AM 1054A | 77 | 4280-7130 | 0.084 | - | ||
| ESO-LV 37660271 | AM 1054B | 10 56 59.0 | 33 09 39 | 77 | 4280-7130 | 0.083 | 17 | |
| AM 1219-430 | ESO 267-IG 041 | AM 1219A | 12 21 57.3 | 43 20 05 | 162,341 | 3350-7130 | 0.109 | - |
| FAIRALL 0157 | AM 1219B | 12 22 04.0 | 43 20 21 | 25 | 3350-7130 | 0.110 | 33.7 | |
| AM 1256-433 | ESO 269-IG 023 NED01 | AM 1256B | 12 58 57.6 | 43 50 11 | 292,325 | 4280-7130 | 0.091 | 91.6 |
| AM 1401-324 | ESO 384-G 041 | AM 1401A | 14 04 14.7 | 33 01 32 | 294,41 | 3350-6280 | 0.078 | 23.4 |
| AM 2030-303 | ESO 463-IG 003 NED01 | AM 2030A | 20 33 56.3 | 30 22 41 | 75 | 4280-7130 | 0.070 | - |
| ESO 463-IG 003 NED02 | AM 2030B | 20 33 59.7 | 30 22 29 | 75,22 | 4280-7130 | 0.060 | - | |
| ESO 463-IG 003 NED03 | AM 2030B | 20 33 59.7 | 30 22 23 | 22 | 4280-7130 | 0.060 | 40.5 | |
| AM 2058-381 | ESO 341-G 030 | AM 2058A | 21 01 39.1 | 38 04 59 | 42,125,350 | 3350-7130 | 0.050 | - |
| ESO 341-G 030 NOTES01 | AM 2058B | 21 01 39.9 | 38 05 53 | 94,350 | 3350-7130 | 0.050 | 44 | |
| AM 2229-735 | AM 2229-735 NED01 | AM 2229A | 22 33 43.7 | 73 40 47 | 134,161 | 4280-7130 | 0.037 | 24.5 |
| AM 2306-721 | ESO 077-G 003 | AM 2306A | 23 09 39.3 | 71 01 34 | 238,190 | 3350-7130 | 0.030 | - |
| ESO 077-IG 004 | AM 2306B | 23 09 44.5 | 72 00 04 | 118,190 | 4280-7130 | 0.030 | 52.6 | |
| AM 2322-821 | ESO 012-G 001, NGC 7637 | AM 2322A | 23 26 27.6 | 81 54 42 | 59,28,318 | 3450-7130 | 0.181 | - |
| ESO 012-G 001 NOTES01 | AM 2322B | 23 25 55.4 | 81 52 41 | 318 | 3350-7130 | 0.179 | 33.7 |
Notes: Column (1): System identification from the Arp-Madore catalogue (Arp & Madore, 1987). Column (2): Individual galaxy names from Eso/Uppsala catalogue (Lauberts, 1982), New General Catalogue (Dreyer, 1888) and from Spectroscopic survey of southern compact and bright-nucleus galaxies of Fairall (1979). Column (3): Adopted designation. Columns (4) and (5): equatorial coordinates for the center of each observed galaxy. Column (6)-(9) Slit position angles, spectral wavelength coverage, B-V color excess and nuclear separation between components.
2 Observational data
The present study is based on long slit spectroscopy of a sample of nine systems of galaxies in interaction, obtained with the Gemini Multi-Object Spectrograph (GMOS) attached to the 8 m Gemini South telescope. Spectra in the range of 3450 to 7130 Å were obtained with two settings with the B600 grating, slit width of 1 and a spectral resolution of Å. The blue setting provided a wavelength coverage from 3450 to 6280 Å and the red setting of 4280 to 7130 Å, both with about the same spectral resolution.
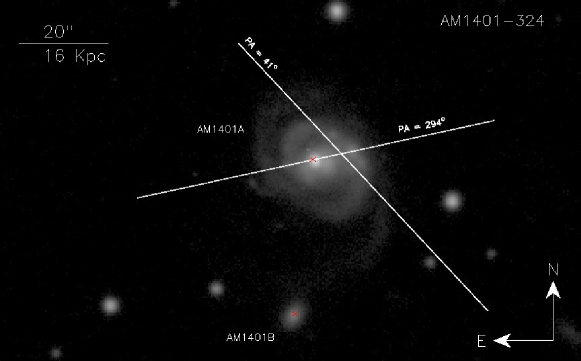
In Table 1 we listed the basic information of the observed galaxies: the name of the galaxy system, the names of the individual galaxies, our abbreviated designations, the celestial equatorial coordinates (J2000), the slit position angles, the wavelength range of the spectra, the Galactic extinction E(B-V) as listed in NED111http://ned.ipac.caltech.edu/ of each galaxy, and the nuclear separation (NS) between the individual galaxies of the pairs. Detailed information about the galaxy systems and the slit positions observed for the objects in this sample were provided in Paper I and II, with the exception of AM 1401-324 system, that was not included in the previous works due to the wavelength coverage does not include the [NII]6584 Å emission-line. For the AM 1401-324 system, the spectra were taken at two slit position on the sky (PA = 294° and PA = 41° ), with the goal of observing the nucleus and the brightest regions of the main galaxy of the system (see Fig. A:). The secondary galaxy of the AM 1401-324 system was not observed.
The data reduction followed the standard procedures and it was detailed discussed in Paper I and Paper II. Basically, the spectra comprise the flux contained in an aperture of 1 1.152 which, considering a spatially flat cosmology with = 71 (Wright, 2006) and the distances to the systems of our sample (see Paper II), corresponds to apertures from 200 to 1100 pc on the galaxies plane. The spectra taken on red and blue setting were combined applying a median filter with the IRAF task LSCOMBINE.
3 Stellar population synthesis
In order to obtain the stellar population contribution of our sample of interacting galaxies, we used the STARLIGHT stellar population synthesis code (Cid Fernandes et al., 2004, 2005; Mateus et al., 2006; Cid Fernandes et al., 2007; asari07), which is discussed in details in Cid Fernandes et al. (2004, 2005). Briefly, the code fits the observed spectrum (Oλ) of a galaxy using a combination of simple stellar populations (SSPs) obtained from evolutionary synthesis models by Bruzual & Charlot (2003). These models are composed of spectra with a resolution of 3 Å across the wavelength range 3200-9500 Å with a wide range of metallicities. The STARLIGHT assumes the Padova 1994 tracks, as recommended by Bruzual & Charlot (2003), and an initial mass function (IMF) by Chabrier (2003) for stars with masses between 0.1 and 100 M⊙.
The synthetic spectrum Mλ is solved by STARLIGHT according to the following equation:
| (1) |
where bj,λ is the reddened spectrum of the SSP normalized at =5870Å; 10 is the extinction term; represents the convolution operator; G is the Gaussian distribution used to model the line-of-sight stellar motions, centered at velocity and with a dispersion ; M is the synthetic flux at the normalization wavelength and is the population vector. The population vector represents the fractional contribution of the SSPs in terms of age and metallicity (, ) over the synthetic flux at . These spectral components can also be expressed as a function of the mass of the population, represented by the vector .
The fit between the observed and modeled spectra is calculated with the support of an algorithm that searches for the minimum value of
| (2) |
where w is the error in Oλ. Emission lines and spurious pixels are excluded of the fits establishing wλ = 0. The intrinsic reddening is modeled by STARLIGHT as due to foreground dust model, using the extinction law by Cardelli et al. (1989), with R and parametrized by the V-band extinction, AV = RV E(B-V). The SSPs considered in this work takes into account 15 ages, t = 0.001, 0.003,0.005, 0.01, 0.025, 0.04, 0.1, 0.3, 0.6, 0.9, 1.4, 2.5, 5, 11, and 13 Gyr, and three metallicities, = (0.2, 1, and 2.5 ), summing up N⋆ = 45 SSP components. The stellar spectra of the SSPs were convolved with an elliptical Gaussian function to achieve the same spectral resolution of the observed one; transformed into the rest frame; normalized to 5870 Å; and corrected by foreground Galactic extinction as in Schlegel et al. (1998).
The STARLIGHT code provides individual population vectors. However, according to Cid Fernandes et al. (2005) the individual components of are very uncertain. To troubleshoot this problem, Cid Fernandes et al. (2005) proposed that the population contribution should be combined in age bins. Following the prescription of these authors, the population vectors are binned according to the flux contribution in: young, ( years), intermediate-age, (4 years) and old, ( years) components, which have uncertainties lower than 0.05, 0.1 and 0.1, respectively, for signal-to-noise S/N10. The same bins are to be used for the fractional contribution to the stellar mass (, , ). The quality of the fitting result is quantified by the parameters and . The latter gives the relative mean deviation over all fitted pixels, between the observed and model spectra.
| Position (kpc) | (%) | (%) | (%) | (%) | (%) | (%) | AV (mag) | ||
|---|---|---|---|---|---|---|---|---|---|
| AM 1054A | |||||||||
| -0.564 | 80.3 | 13.9 | 0.5 | 52.9 | 39.0 | 8.1 | 0.8 | 4.54 | 0.37 |
| -0.282 | 68.7 | 17.1 | 10.8 | 14.0 | 8.4 | 77.6 | 0.9 | 2.85 | 0.33 |
| 0.000 | 70.5 | 15.1 | 11.4 | 13.1 | 12.7 | 74.2 | 0.9 | 2.28 | 0.40 |
| 0.282 | 59.5 | 19.9 | 16.5 | 5.4 | 4.3 | 90.3 | 0.8 | 2.58 | 0.19 |
| 0.564 | 68.5 | 17.2 | 13.0 | 7.3 | 7.7 | 85.0 | 1.3 | 3.00 | 0.12 |
| 0.846 | 75.4 | 21.1 | 0.8 | 53.0 | 40.5 | 6.5 | 1.2 | 2.99 | 0.46 |
| 1.128 | 57.4 | 38.8 | 0.0 | 17.7 | 82.3 | 0.0 | 0.6 | 3.84 | 0.16 |
| 1.410 | 35.5 | 58.2 | 0.0 | 3.1 | 96.9 | 0.0 | 1.0 | 4.94 | 0.00 |
| 1.692 | 42.7 | 43.1 | 0.0 | 22.8 | 77.2 | 0.0 | 1.1 | 4.13 | 0.34 |
| 1.974 | 50.6 | 34.2 | 8.1 | 7.2 | 11.8 | 81.0 | 0.7 | 4.23 | 0.22 |
4 Results
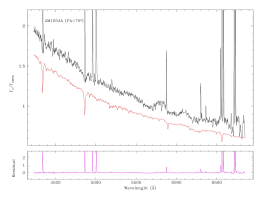
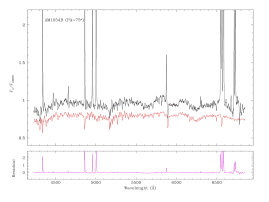
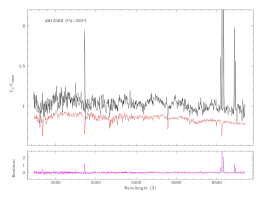
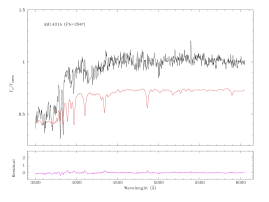
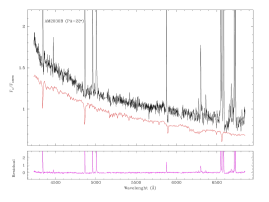
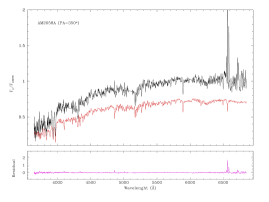
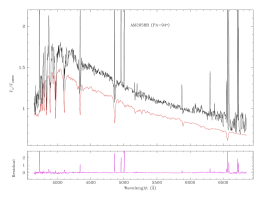
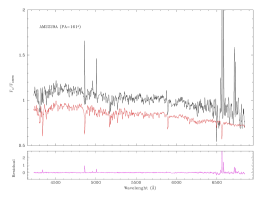
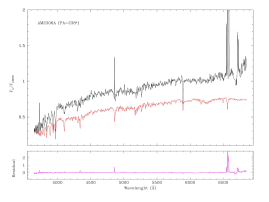
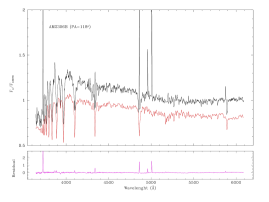
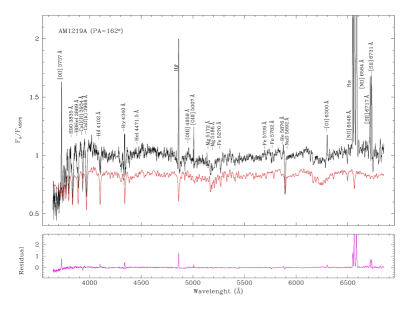
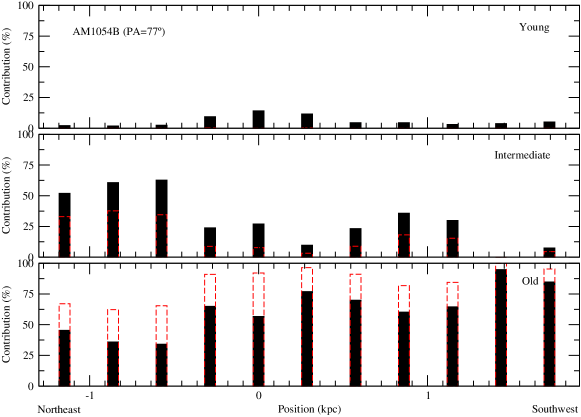
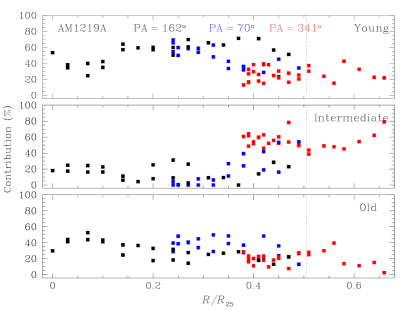
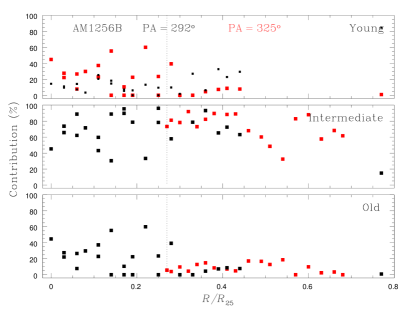
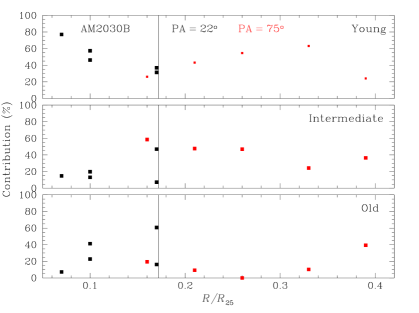
In Table 2 the stellar-population results are presented for the regions located along the disk of each galaxy in our sample. These regions are the same considered in Papers I and II. Fig. 1 shows an example of the results of the synthesized spectrum and the pure emission for the nuclear region of AM 1219A and AM 1219B, while the results for the nuclear regions of the other objects in our sample are shown in Appendix F: (Figs. 15 and 16). The results of the synthesis are summarized in Table 2, for the individual spatial bins in each galaxy, stated as the percentage contribution of each base element weighted by flux and mass. In Fig. 2 the contribution of the stellar population components along the slit position of AM 1054A and AM 1054B are shown. The nominal center of each slit was chosen to be the continuum peak at 5870Å flux. The remaining synthesis results are showed in Appendix 16, from Figs. 17 to 25, where the regions with intersection on the spectrograph slit positions are highlighted in the plots with different filling patterns. In Fig. 3 the synthesis results for AM 1219A and AM 1256B are plotted as a function of the galactocentric radius normalized by (galactocentric distance with surface brightness of 25 mag arcsec-2, see Table 2 of Paper II). In what follows, the results for each system are discussed separately.
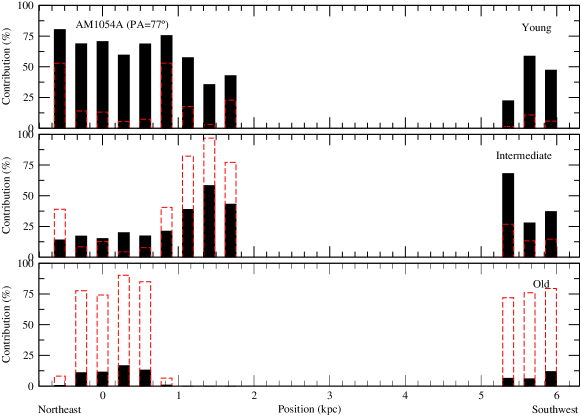

4.1 AM 1054-325
This system is composed by a main spiral galaxy (hereafter AM 1054A) and a companion galaxy (hereafter AM 1054B). AM 1054A is an optically bright spiral in the early stages of merging ( 85 Myr; Mullan et al., 2011). As can be seen in Fig. 2 (top panel) the population synthesis results indicate that the light along the disk of AM 1054A, is mainly dominated by a young stellar population component ( yr), with a not negligible contribution of an intermediate population. This spatial profile corresponds to a slit position crossing the supposed ’second’ nucleus (or starburst region?) of AM1054 A (see Paper I).
In the bottom panel of Fig. 2, we can see that AM 1054B is mainly dominated by the old stellar population component, both in the contribution of light and mass, with a mean value of 62% for light and 84% for mass. The Intermediate stellar population contributes significantly for this galaxy, with a mean value of about 30% for a light-weighted context and 16% for a mass-weighted one.
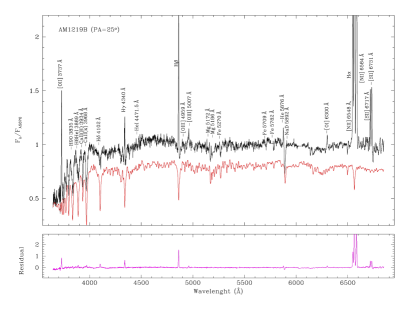
4.2 AM 1219-430
This system is composed by two galaxies, a main spiral galaxy (hereafter, AM 1219A) and a secondary one (hereafter, AM 1219B). The primary galaxy presents a normal arm to the south-west and a strong tidal arm, with several H ii regions along it. AM 1219B has a bright nuclei with smooth open spiral arms. A bridge of material connecting both galaxies and a lens structure in addition to the bulge and disc of AM 1219B were reported by Hernandez-Jimenez et al. (2014). A rough estimate of stellar population based on equivalent widths of absorption lines and on continuum for the integrated spectrum of these galaxies shows that both components have a strong flux contribution from stellar populations younger than years (Pastoriza et al., 1999). For the main galaxy, the estimations obtained in Paper I for electron densities show an increase of these ones towards the outskirts of this galaxy (). Interestingly, in this region an oxygen abundance break, that could be associated with a corotation radius, was obtained in Paper II.
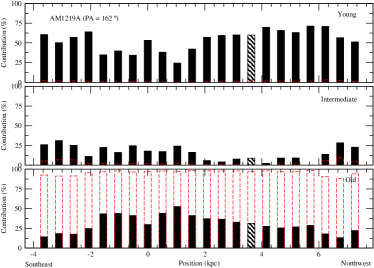
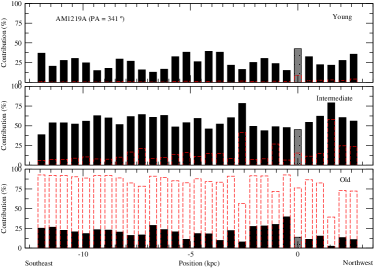
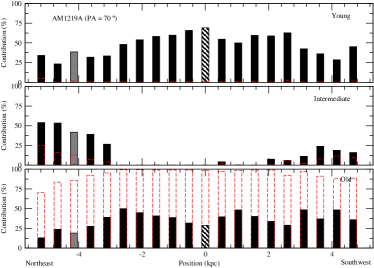
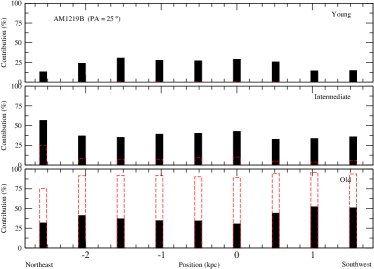
The distribution of the stellar population in both galaxies are shown in Fig. 17. Three different slit positions were observed in AM 1219A: PA = 162° and PA = 341° along the North-South direction crossing the nuclei and the disturbed arm, respectively; and PA = 70° in the Northeast-Southwest direction crossing two very bright Hii regions. For AM 1219B, we only have observations with a PA = 25°crossing its nucleus: PA = 25°.
For the slits with PA = 162° and PA = 70° the light emitted by AM 1219A is dominated by the contribution of the young stellar component (54%), with a significant contribution (35%) of the old component. The intermediate stellar population is absent around the closest zone to the nucleus mapped by the slit with a PA = 70°. This very bright zone (see Fig. 1 of Paper II) corresponds to the continuum peak of an H ii region complex. The stellar population spatial profile associated with this slit position seems to indicate an increase in the young stellar component towards this H ii region complex. Considering the slit with a PA = 341°, we can see that the intermediate stellar population dominates the light, with 56% in average, followed by the young component, with 26% in average. One possible interpretation to these results is that the intermediate stellar component could be associated with the perigalacticum passage. Preliminary estimations indicate that it occurred about 220 Myr ago (Hernandez-Jimenez et. al., private communication). Hence, along the disturbed arm, most of the stellar population could have been triggered during the perigalacticum passage, remaining a lower reservoir of gas to form the younger generation of stars than in the other mapped parts of the galaxy, and consequently decreasing the current star formation rate. As can be seen in Fig. 3, none variations of stellar population were found along the PA = 341°. It is interesting to note that the zones sampled by two different slits, which are marked in Fig. 17, show estimations of their stellar population ages in reasonable agreement to each other.
The stellar population estimated for AM 1219B is roughly homogeneous along the observed slit. In light-weighted fraction, the stellar population is distributed, in average, in the three population components as: 23% of young, 39% of intermediate and 40 % of old.
Taking into account the contribution of the different stellar populations to the mass, we found that in both components of this system the old stellar population is the clear dominant component.
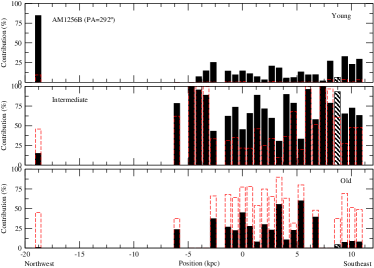
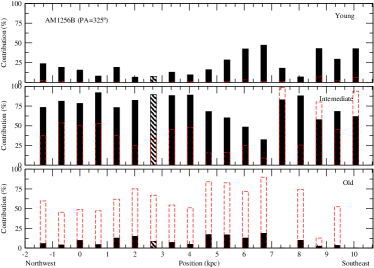
4.3 AM 1256-433
This system is composed by three galaxies, from which we only observed the secondary galaxy (hereafter AM 1256B). A break in the oxygen abundance gradient was obtained in Paper II at , which suggested that this break could be associated with a corotation radius. Interestingly, at about the same position it was found the maximum star formation rate (see Paper II).
As can be seen in the Fig. 18, the stellar population is predominantly composed by the intermediate component, in average 70%, for both slit positions. We observed variations of the stellar population across the galaxy, that in general are not dependent on the position, with exception of the region between 4 and 7 kpc along the PA = 325°. In this region, the young component increases while the intermediate one decreases. It could be probably due to the slit is not completely aligned with the curved arm. In that area, the slit cross the arm and therefore a young population is observed.
For the PA = 292° and a distance of about 18 kpc from the center of AM 1256B in the Northwest direction (see Fig. 1 of Paper I), there is a region where the young population represents about 80% of the 5870Å flux. In this zone, there is an H ii region whose age estimated by Ferreiro & Pastoriza (2004) is about 6 Myr, in agreement with our estimation. For this slit position mainly the light-dominant population is also the intermediate one. In four cases, the old population contribution to the light is comparable or even greater than that of the intermediate population. Analyzing the mass-contribution we found that in the inner zone the old population dominates. The intersection of the spectrograph slit positions (marked in Fig. 18) shows stellar population estimations in good agreement mainly for the light.
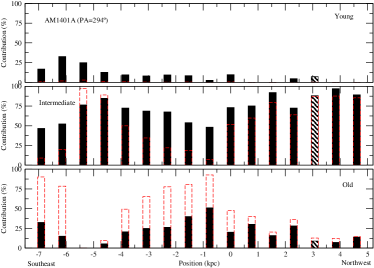
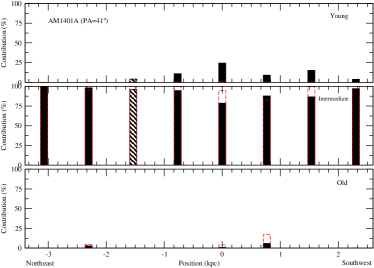
4.4 AM 1401-324
The main galaxy of this system, AM 1401A (ESO 384-G 041), has a very bright nucleus and an arm giving the appearance of a ring. Its companion is the smaller galaxy AM 1401B (ESO 384-G 041 NOTES01/PGC682060). Only the primary galaxy was observed. In Fig. A: the slit positions are shown.
The results of the stellar population synthesis for AM 1401A are presented in Fig. 19. AM 1401A is completely light-dominated by intermediate stellar populations, with a contribution at 5870 Å flux of about 50-75% in the central region and higher than 90% in the outer regions. For the slit that cross the nucleus (PA = 294°), there is a spatial variation of the stellar population and the light-contribution of the intermediate one decreases towards the center of the galaxy. The fraction of old stellar population component is found to be increasing from the outer regions to the center.
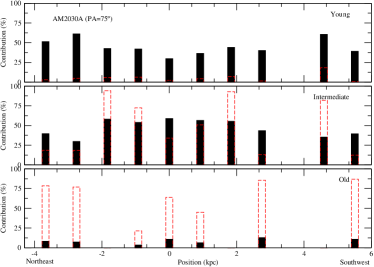
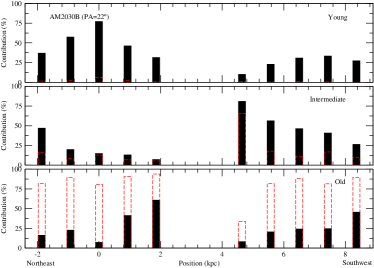
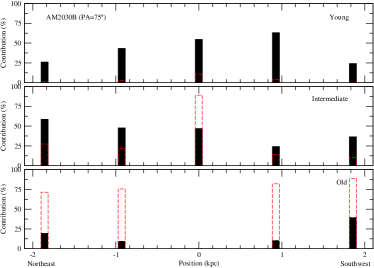
4.5 AM 2030-303
This is a system formed by a spiral galaxy as the main component (hereafter AM 2030A) and probably a triplet of irregular galaxies (see Fig. 1 of Paper II) as the secondary component (hereafter AM2030B). Two different slit positions were used to acquired the data for this system: PA = 22° and PA = 75°. The first slit maps a complex of HII regions located in an outer arm of AM 2030A and cross the one of the irregular galaxies of AM 2030B. The second slit maps part of the secondary triplet complex.
For AM 2030A, we found a light-dominant stellar population with young/intermediate age, summing up more than 90% of the optical flux at 5870 Å (see Fig. 20). This result is expected because the slit crosses a complex of H ii regions, whose estimated age by Ferreiro & Pastoriza (2004) is about 6.5 Myr. As can be seen in Fig. 21, the AM 2030B spatial profile is derived mainly from two distinct regions along the PA = 22°. One towards the northeast side and another towards the southwest, whose measurements are from ESO 463-IG 003 NED03 and ESO 463-IG 003 NED02, respectively. ESO 463-IG 003 NED03 is light-dominated by a young stellar population with a significant contribution of the old stellar population in a couple of bins. On the other hand, ESO 463-IG 003 NED02 is light-dominated by an intermediate stellar population with a significant contribution of old and young populations. For PA = 75°, the stellar population of AM 2030B is distributed mainly in young and intermediate populations. The spectra obtained from regions on the intersection of the slits presented low signal-to-noise (S/N10) and therefore they were not used to performed the synthesis.
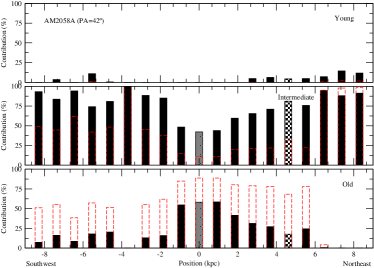
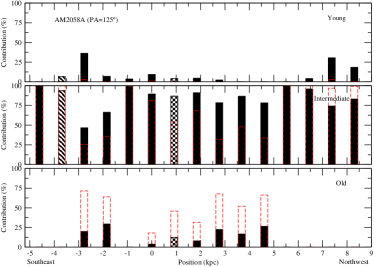
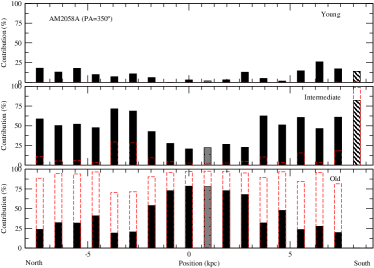
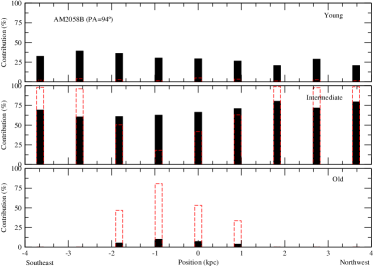
4.6 AM 2058-381
This system is composed by two arms spiral galaxy as the main component and an irregular one as the secondary, hereafter AM 2058A and AM 2058B respectively. The stellar population distributions in flux and mass of both components are shown in Fig. 22.
AM 2058A is dominated by an intermediate population component except for the inner zone where the dominant is the older one. For the slit positions that cross the center of this galaxy (PA = 42° and PA = 350°), systematic variations are observed for the intermediated stellar component, i.e. its contribution to the flux is increasing outwards. On the other hand, a decreasing in the older component can be seen in both contributions, flux and mass, from the center to the outer regions. A small contribution (generally negligible) from the young population is observed. Along the spatial profile of PA = 125°, we found two two zones on which the young stellar component is prominent. One at 3 kpc towards Southeast and another at 7.5 kpc towards the Northwest. As can be seen in Fig. 1 of Paper I these regions are located in one spiral arm, and therefore a young population is expected to be observed.
It can be seen in the bottom right panel of Fig. 22 that AM 2058B is mainly dominated by the contribution of the intermediate stellar population component in light as well as in mass, with a mean value of 69% and 74%, respectively. No significant variations along the spatial profile are present in this galaxy.
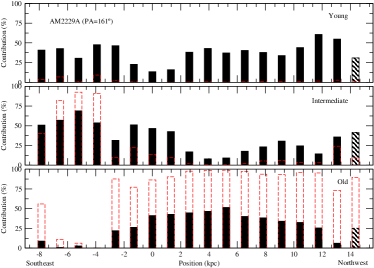
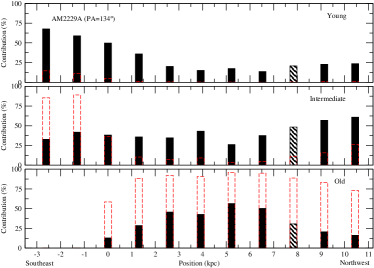
4.7 AM 2229-735
AM 2229-735 is a system composed by a main spiral galaxy (hereafter AM 2229A) interacting with a smaller disc galaxy (hereafter AM 2229B). Spectra obtained along AM 2229B are very noisy () and they were not considered.
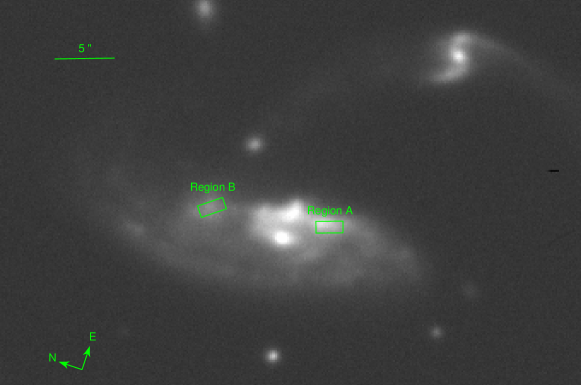
The contribution of the different stellar-population components along the disk of AM 2229A for the two distinct slits are shown in Fig. 23. For both slit positions, there is a zone whose behavior is noticeable. For the PA = 161° the region between -4 and -8 kpc (hereafter called region A) the light and mass are mainly dominated by the young and intermediate populations. Same behavior is shown by the zone between 0 and -3 kpc (hereafter called region B) for the PA = 134°. These areas are marked in Fig. B: and correspond to two complexes of H ii regions. The origin of these complexes is probably related to the interaction between the galaxies of this pair.
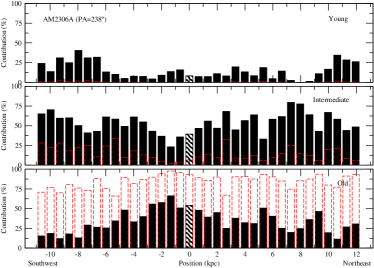
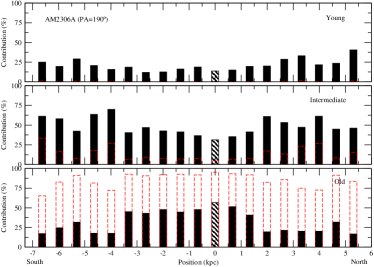
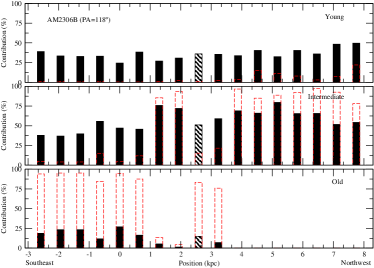
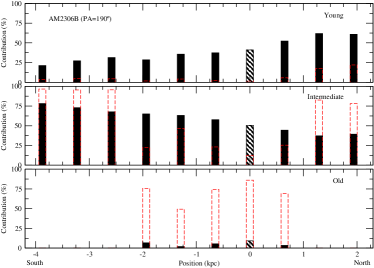
4.8 AM 2306-721
This pair is formed by a spiral galaxy (hereafter AM 2306A) and an irregular galaxy companion (hereafter AM2306B). As can be seen in Figs. 24, the optical flux of both galaxies are mainly dominated by the intermediate population component.
AM 2306A shows systematic variations for old and intermediate stellar components along the two slit positions observed. While the intermediate component is decreasing towards the center of the galaxy, the old component is increasing. Likewise it can be seen that the young stellar population is increasing towards the outer regions of AM 2306A. This behavior is more conspicuous for the regions mapped with the slit with PA = 238°, for which the more significant contributions from the young stellar component are located between -11 and -6 kpc, and from 10 to 12 kpc, that corresponds to the regions on the spiral arms. Krabbe et al. (2008) derived the stellar population for this interacting system using the stellar population synthesis method developed by Bica (1998). This method employs the equivalent widths of several spectral absorption features and the measured continuum fluxes at different wavelengths, comparing them to those of a model computed from a base of simple stellar population (SSP) elements with known ages and metallicities. Our estimated stellar populations are in good agreement with the results previously obtained by Krabbe et al. (2008). In the case of the slit with PA = 190°, this increment towards the outer zones is also observed, although the variation of the light contribution from the young population is not so significant.
Interestingly, for AM2306B there is a completely different behavior. Around the center of this galaxy we can see that the old stellar population dominates the mass content although the intermediate and young populations dominate the light. Towards the Northwest of the galaxy there is a zone, between 3.5 and 8 kpc (PA = 118°), without old stellar population component. At about 3 kpc there is a zone for which the old stellar population dominates the mass content and around it (mapped by both slits) there are zones completely dominated (in mass and light) by the intermediate and young stellar populations. Probably, this enhancement of the stellar formation was triggered by the strong interaction with AM2306A.
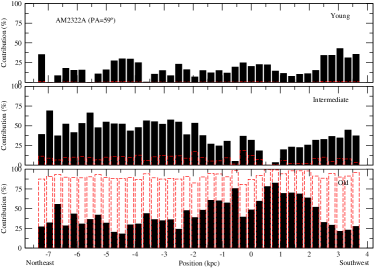
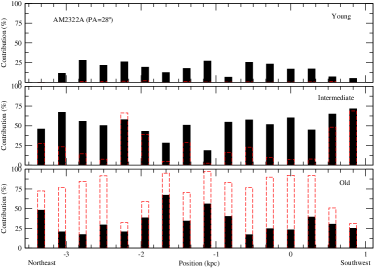
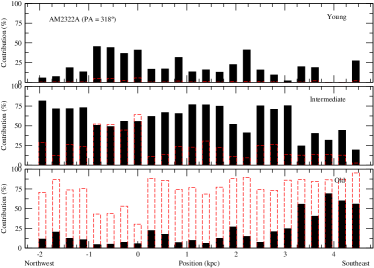
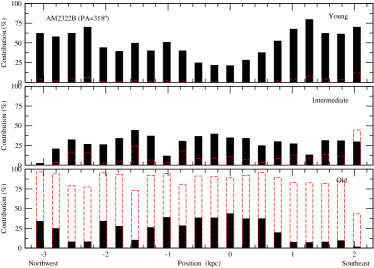
4.9 AM 2322-821
The system AM 2322-821 (see Fig. 1 of Paper II) is composed by a spiral galaxy classified as SA(r)c showing disturbed arms (hereafter AM 2322A) in interaction with an irregular galaxy (hereafter AM 2322B). Four slit position angles were used to map this system: PA = 59° crossing the nucleus of AM2322A; PA = 28° crossing the main body of the primary but not across the nucleus (an offset of about 8 arcsec north-west, NW, from the nucleus); PA = 60 ° mapping the NW spiral arm of the main component, located between the main and secondary component; PA = 318° along the main axis of the secondary component AM 2322B and also along the north-east (NE) spiral arm of AM 2322A. As was pointed out in Paper II, the spectra obtained using PA = 60° present low signal-to-noise (S/N10). Therefore they were not used to performed the synthesis. Indeed, the spectra from the regions located in the intersections of the slits present low signal-to-noise and therefore they were not considered in the synthesis.
The distribution of the stellar population in both galaxies of the AM 2322-821 system is shown in Fig. 25. The contribution to the light by the stellar populations is heterogeneous in AM 2322A for the three slit positions considered (PA = 28, 59, 318°). There are no hints of age gradients along this galaxy: the young, intermediate and old populations contribute significantly to the optical flux at 5870 Å. It is worth noting that the mass is clearly dominated by the old stellar population component in the majority of the zones.
The light emitted by AM2322B is dominated by the young stellar population component in all the galaxy except in its center, where contribution of the three populations are comparable. This young component shows a systematic variation along the slit, increasing outwards. In the outskirts the old component barely contributes to the light although it clearly dominates the mass along all the galaxy.
The stellar population in this system was studied by Krabbe et al. (2011) using the same data and a similar methodology that in this work. Even though they considered four population vectors components the results in both works are compatible. The contribution of the young population in AM 2322B was related with the perigalactic passage occurred at 90 Myr after perigalacticum (Krabbe et al., 2011).
5 Discussion
5.1 Stellar population distribution
One of the main effects of interactions on the evolution of galaxies is modify the stellar formation history of the objects involved. Our results, presented in the previous section, indicate that the light at 5870 Å emitted by most of the galaxies in our sample are dominated by young/intermediate stellar populations, i.e. by stellar populations with ages lower than years. Similar result was derived for other interacting galaxies by dametto14, whom used near-infrared data to investigate the spatial distribution of the stellar populations in three interacting starburst galaxies. Indeed, young star clusters (ages lower than 300 Myr) have been found in tidal tails of interacting galaxies (e.g. Mulia et al. 2015; de Gris et al. 2003; bastian03). In contrast, in the disks of isolated galaxies the light is dominated by an older stellar population. In fact, Morelli et al. (2015) investigated the properties of the stellar populations in the discs of ten spiral galaxies, mostly not belonging to interacting systems. These authors found that the old stellar populations (ages higher than 4 Gyr) usually dominates the disc surface brightness. The difference in the light-dominant population between interacting and isolated galaxies could be due to the induced gas inflow that increases the bursts of star formation along the disk during and after the interaction.
Other important issue is to investigate the differences between the stellar populations in the main and secondary galaxies belonging to interacting systems. Numerical simulations by Cox et al. (2008) showed that during the interaction process in minor mergers, the fractional SFR enhancement is higher in the secondary galaxy due to it is more susceptible to the tidal forces induced by the interaction. This theoretical result was confirmed by observational studies of the minor mergers AM 2306-721 by Krabbe et al. (2008) and NGC 7771+NGC 7770 by alonso12. Inspection in Figs. 22, 24 and 25, shows clearly that the secondary galaxies of the systems AM 2058-381, AM 2306-721 and AM 2322-821 have higher contributions of young stellar populations than the primary galaxies. For AM 1054-325 and AM 1219-430 systems an opposite result is derived (see Fig. 2 and 17, respectively). However, the secondary galaxy of the system AM 1219-430 and the primary one of AM 1054-325 have few positions with available synthesis results. Moreover, only AM 1054B has an old population ( years) as being the main source of the flux at 5870 Å. In Fig. 1 of Paper I we can see that this object has an elliptical form, being the old population predominant on it.
It is largely accepted that the growth of spiral galaxies follow the inside-out scenario, in the sense that inner regions of the disk are most chemically evolve and present a higher percentage of old population than the outer regions (see e.g. Minchev et al., 2014; Brook et al., 2012; few12; Pilkington et al., 2012; Mólla & Díaz, 2005). In fact, recently, González Delgado et al. (2015), by using the data of the CALIFA survey (Sánchez et al., 2012), obtained the radial structure of stellar population properties of 300 galaxies, mostly not interacting, and found negative age gradients in agreement with an inside-out growth of galaxies. Other support for the assumption that spiral galaxies are formed following the inside-out scenario is that negative metallicity gradients are generally observed in isolated spiral galaxies (e.g. Pilyugin et al. 2015; Sánchez et al. 2014; Dors & Copetti 2005; Pilyugin et al. 2004). For interacting galaxies, the metallicity gradients are modified by the gas flow and these objects present gradients significantly flatter than the ones observed in isolated galaxies (see e.g. Paper II and references therein). However, it is unclear if negative age gradients are maintained in interacting galaxies. In other words, it is ill-defined if the imprints of the inside-out scenario, in the case of a negative gradient in the stellar population age along disks, are observed in interacting galaxies.
In Figs. C:-C: the logarithm of the average of the stellar population age weighted by the light contribution of each population () versus the galactocentric distance for our sample of objects is shown. The gives information about the globally averaged star formation history in each galaxy (González Delgado et al., 2015). Taking into account the expected perturbations in a galaxy suffering stellar formation triggered by an external agent, we can note that for the most spiral components (AM 1219A, AM 1256B, AM 1401A, AM 2058A, AM 2306A and AM 2322A) of the interacting pairs belonging to our sample, the decreases with the increase of the galactocentric distance, indicating that the interactions seem do not destroy the global imprints of the galaxy formation considering the inside-out scenario. AM 1054A and AM 2229A, both spiral galaxies, not show this behavior, however for AM 1054A the slit crosses only their inner region and AM 2229A is a spiral very disturbed.
In Paper II, we found oxygen abundance breaks along the disk of AM 1219A, AM 1256B, AM 2030A and AM 2030B galaxies at galactocentric distances between 0.2 and 0.5. In particular, for AM 1219A and AM 2030B, we found a minimum in the instantaneous star formation rate (SFR) close to the break region, and for AM 1256B and AM 2030A maximum values were derived. In particular, AM 1219A presents also a minimum value of the metallicity in the break region, which could be associated with a corotation radius, in agreement with the scenario proposed by Mishurov et al. (2002). As can be seen in Fig. 3, we do not find variations of the stellar population associated with the corotation radius.
5.2 Stellar versus nebular extinction
The stellar population synthesis process gives us the extinction form the continuum A. We derive the nebular extinction A from the H/H emission-lines ratio adopting the Calzetti et al. (1994) law:
| (3) |
where (H/H and (H/H are the observed and the intrinsic ratios, respectively. We adopted the theoretical value of 2.86 for the intrinsic emission-line ratio (Osterbrock & Ferland, 2006).
The comparison between the synthesis and the nebular extinctions is plotted in Fig. D: and was done for the objects in our sample. As can be seen in this figure, the nebular extinctions are higher than the stellar ones, up to about twice. These results are in agreement with those earlier published by Calzetti et al. (1994); asari07; Martins et al. (2013); dametto14 and was interpreted by Calzetti et al. (1994) as the result of the fact that the hot (young) ionizing stars are associated with dustier regions than the cold stellar population.
5.3 Gas versus stellar parameters
We compared the nebular and stellar metallicities for our sample of galaxies, in order to search for a relation between these two quantities. We assume the oxygen abundance as a nebular metallicity estimator. For our sample, we estimated the oxygen abundances in Paper II using empirical calibrations based on strong emission-lines, and the stellar metallicitty was obtained from the synthesis results.
Fig. E: shows the nebular abundance versus stellar metallicity. As can be seen, there is no correlation between nebular and stellar metallicities. Similar results were found by Cacho et al. (2014) in a study about the gaseous-phase metallicities and stellar populations in the centers of barred galaxies. In a study of the stellar populations using Sloan Digital Sky Survey galaxies, Cid Fernandes et al. (2005) stated to have found a correlation between a mass-weighted stellar metallicities and nebular oxygen abundances, although the dispersion is very large, with a Spearman rank correlation coefficient (R) of 0.48.
We also compared nebular and stellar metallicities as a function of the stellar age. These comparisons are plotted in Fig. E:. As can be seen in the bottom panel of this figure, there is no correlation between the stellar metallicities and stellar ages. In contrast, a relationship between the nebular metallicities and stellar ages is found (see upper panel of Fig. E:), in the sense that older regions are more metal-rich.
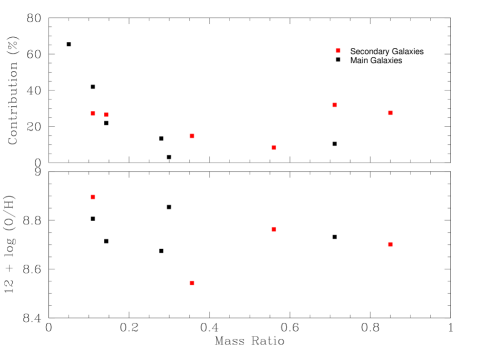
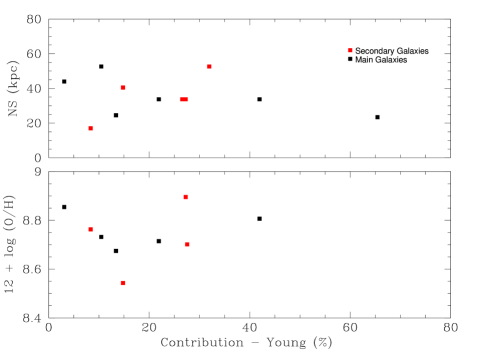
We analysed some properties of the nebular gas and the stellar populations belonging to the central region (1 kpc in diameter) of the galaxies. A comparison of the contribution (to the light) of the young stellar population component and the estimated oxygen abundances with the mass ratio between the components () was performed (see upper and lower panels of Fig. 5, respectively). The mass ratio values were taken from Ferreiro & Pastoriza (2004). We also compared the nuclear separation between the components and the estimated oxygen abundances with the contribution (to the light) of the young stellar population component (see upper and lower panels of Fig. 6, respectively). We did not find any correlation between the studied parameters. However, a more statistically significant sample is needed to reach any conclusive result.
6 Conclusions
We present an observational study about the stellar population in interacting galaxies using a synthesis method. Long-slit spectra in the azulspectral range 3440-7300 Å were obtained with the GMOS at Gemini South for fifteen galaxies in nine close pairs. The stellar population contribution was obtained using the STARLIGHT stellar population synthesis code. The main results are summarized in what follows:
-
1.
The contribution of the stellar components in relation to the optical flux at 5870 Å for most of the galaxies in our sample: AM 1054A, AM 1219A, AM 1256B, AM 1401A, AM 2030A, AM 2030B, AM 2058A, AM 2058B, AM 2306A, AM 2306B, and AM 2322B, is dominated by young/intermediate stellar populations.
-
2.
None variations in the stellar population components were found for AM 1219A, AM 1256B, AM 2030A and AM 2030B at the oxygen gradient break zones which could be associated with corotation radii (see Paper II).
-
3.
We compared the stellar extinction (A) given by the population synthesis method with the nebular extinction (A) estimated from the H/H emission-line ratio. We found that for most of the objects the nebular extinction is higher than the stellar extinction, up to about twice.
-
4.
Non correlation was found between nebular and stellar metallicities.
-
5.
We compared the nebular and stellar metallicities as a function of the stellar ages. Non correlation between stellar metallicities and stellar ages was found and a positive correlation between nebular metallicities and stellar ages was obtained showing, as expected, that the older regions are more metal-rich.
-
6.
For the central regions of the studied galaxies, we did not find any correlation between the mass ratio and the contribution of the young stellar population component to the light or the estimated oxygen abundances. We did not either find any correlation between the contribution of the young stellar population to the light and the nuclear separation of the pairs or the estimated oxygen abundances. However more observations are needed to confirm these results.
Acknowledgements
Based on observations obtained at the Gemini Observatory, which is operated by the Association of Universities for Research in Astronomy, Inc., under a cooperative agreement with the NSF on behalf of the Gemini partnership: the National Science Foundation (United States), the Science and Technology Facilities Council (United Kingdom), the National Research Council (Canada), CONICYT (Chile), the Australian Research Council (Australia), Ministério da Ciencia e Tecnologia (Brazil), and SECYT (Argentina).
D. A. Rosa and A. C. Krabbe thanks the support of FAPESP, process 2011/08202-6 and 2010/01490-3, respectively. We also thank Ms. Alene Alder-Rangel for editing the English in this manuscript.
References
- Abazajian et al. (2009) Abazajian K. N., et al., 2009, ApJS, 182, 543
- Alonso et al. (2004) Alonso, M. S., Tissera, P. B., Coldwell, G., Lambas, D. G., 2004, MNRAS, 352, 1081
- Arp & Madore (1987) Arp, H. C., & Madore, B. F. 1987, A Catalogue of Southern Peculiar Galaxies and Associations 2 volume set, by Halton C. Arp and Barry F. Madore, pp. 504. ISBN 0521343364. Cambridge, UK: Cambridge University Press, May 1987
- Barton et al. (2000) Barton, E. J., Geller, M. J., Kenyon, S. J., 2000, ApJ, 530, 660
- Barton et al. (2003) Barton Gillespie, E., Geller, M. J., & Kenyon, S. J. 2003, ApJ, 582, 668
- Bastian et al. (2009) Bastian, N., Trancho, G., Konstantopoulos, I. S., Miller, B. W. 2009, ApJ, 701, 607.
- Bica (1998) Bica, E. 1998, A&A, 195, 9
- Brook et al. (2012) Brook, C. B., Stinson, G. S., Gibson, B. K., et al. 2012, MNRAS, 426, 690
- Bruzual & Charlot (2003) Bruzual, G., & Charlot, S. 2003, MNRAS, 344, 1000
- Cacho et al. (2014) Cacho, R., Sánchez-Blázquez, P., Gorgas, J., Pérez, I. 2014, MNRAS, 442, 2496.
- Calzetti et al. (1994) Calzetti, D., Kinney, A. L., Storchi-Bergmann, T., 1994, ApJ, 429, 582.
- Cardelli et al. (1989) Cardelli, J. A., Clayton, G.C., Mathis, J.S., 1989, ApJ, 345, 245
- Casteels et al. (2013) Casteels, K. R. V., Bamford, S. P., Skibba, R. A., Masters, K. L., Lintott, C. J., Keel, W. C., Schawinski, K., Nichol, R. C., Smith, A. M. 2013, MNRAS, 429, 1051
- Chabrier (2003) Chabrier, G., 2003, PASP, 115, 763.
- Chien et al. (2007) Chien, L., Barnes, J. E., Kewley, L. J., Chambers, K. C., 2007, ApJ, 660, L105.
- Cid Fernandes et al. (2004) Cid Fernandes, R., Gu, Q., Melnick, J., Terlevich, E., Terlevich, R., Kunth, D., Rodrigues Lacerda, R., & Joguet, B. 2004, MNRAS, 355, 273
- Cid Fernandes et al. (2005) Cid Fernandes, R., Mateus A., Sodré L., Stasińska G., Gomes J. M., 2005, MNRAS, 358, 363
- Cid Fernandes et al. (2007) Cid Fernandes, R., Asari, N. V., Sodré, L., Stasińska, G., Mateus, A., Torres-Papaqui, J. P., & Schoenell, W. 2007, MNRAS, 375, 16.
- Cox et al. (2008) Cox T. J., Jonsson P., Somerville R. S., Primack J. R., Dekel A., 2008, MNRAS, 384, 386
- de Gris et al. (2003) de Grijs R., Lee J. T., Mora Herrera M. C., Fritze-v. Alvensleben, U., Anders P., 2003, NewA, 8 155
- Donzelli & Pastoriza (1997) Donzelli, C. J. & Pastoriza, M. G. 1997, ApJS, 111, 181.
- Dors & Copetti (2005) Dors, O. L., & Copetti, M. V. F., 2005, A&A, 437, 837
- Dreyer (1888) Dreyer, J. L. E. 1888, Memoirs of the Royal Astronomical Society, Vol. 49, p.1, 49, 1
- Fairall (1979) Fairall, A. P. 1979, MNRAS, 188, 349
- Ferreiro & Pastoriza (2004) Ferreiro, D. L., Pastoriza, M. G. 2004, A&A, 428, 837
- Geller et al. (2006) Geller, M. J., Kenyon, S. J., Barton, E. J., Jarrett, T. H., Kewley, L. J. 2006, AJ, 132, 2243
- González Delgado et al. (2015) González Delgado R. M. et al., 2015, A&A, 581, 103
- Hernandez-Jimenez et al. (2014) Hernandez-Jimenez, J. A, Pastoriza, M. G, Rodrigues, I., Krabbe, A. C., Winge, C., Bonatto, C., G. S., 2014, Revista Mexicana de Astronomia y Astrofisica Conference Series, 44, 178
- Kewley et al. (2010) Kewley, L. J., Rupke D., Jabran Hahid, H., Geller, M. J., Barton, E. J., 2010, ApJ, 721, L48.
- Krabbe et al. (2014) Krabbe, A. C., Rosa, D. A., Dors, O. L. et al. 2014, MNRAS 437, 1155, Paper I
- Krabbe et al. (2011) Krabbe, A. C., Pastoriza, M. G., Winge, Cláudia, Rodrigues, I., Dors, O. L., Ferreiro, D. L. 2011, MNRAS, 416, 38
- Krabbe et al. (2008) Krabbe, A. C.; Pastoriza, M. G.; Winge, Cláudia; Rodrigues, I.; Ferreiro, D. L. 2008, MNRAS, 389, 1593
- Lambas et al. (2003) Lambas, D. G., Tissera P. B., Alonso M. S., Coldwell G. 2003, MNRAS, 346, 1189
- Larson & Tinsley (1978) Larson, R. B., & Tinsley, B. M. 1978, ApJ, 219, 46
- Lauberts (1982) Lauberts, A. 1982, Garching: European Southern Observatory (ESO), 1982,
- MacArthur et al. (2009) MacArthur, L. A., González, J. J., Courteau, S. MNRAS, 2009, 395, 28.
- Martins et al. (2013) Martins, L. P., Rodríguez-Ardila, A., Diniz, S., Riffel, R., de Souza R., 2013, MNRAS, 435, 2861.
- Mateus et al. (2006) Mateus, A., Sodré, L., Cid Fernandes, R., Stasińska, G., Schoenell, W., & Gomes, M. 2006, MNRAS, 370, 721
- Minchev et al. (2014) Minchev, I., Chiappini, C., Martig, M., et al. 2014, ApJ, 781, L208
- Mishurov et al. (2002) Mishurov, Y. N., Lépine, J. R. D., Acharova, I. A., 2002, ApJ, 571, L113
- Mishurov et al. (2002) Mishurov Y. N., Lépine J. R. D., Acharova I. A., 2002, ApJ, 571, L113
- Mólla & Díaz (2005) Mollá, M. & Díaz, A. I. 2005, MNRAS, 358, 521
- Morelli et al. (2015) Morelli L. et al., MNRAS, 452, 1128
- Mullan et al. (2011) Mullan, B., Konstantopoulos, I. S., Kepley, A. A., Lee, K. H. et al. 2011, ApJ, 731,93
- Mulia et al. (2015) Mulia A. J., Chandar R., Whitmore B. C., 2015
- Nikolic et al. (2004) Nikolic, B., Cullen, H., Alexander, P. 2004, MNRAS, 355, 874
- Osterbrock & Ferland (2006) Osterbrock, D. E. & Ferland, G. J. 2006, Astrophysics of Gaseous Nebulae and Galactic Nuclei 2nd Ed. University Science Books,Sausalito, CA.
- Pastoriza et al. (1999) Pastoriza, M. G., Donzelli, C. J, Bonatto, C. 1999, 347, 55
- Patton et al. (2013) Patton, D. R., Torrey, P., 2011, Ellison, S. L., Mendel J. T., Scudder, J. M., 2013, MNRAS, 433, L59.
- Pilkington et al. (2012) Pilkington, K., Few, C. G., Gibson, B. K., et al. 2012, A&A, 540, A56
- Pilyugin et al. (2015) Pilyugin, L. S.; Grebel, E. K.; Zinchenko, I. A., MNRAS, 450, 3254
- Pilyugin et al. (2004) Pilyugin, L. S., Vílchez, J. M.; Contini, T., 2005, A&A, 425, 849
- Rosa et al. (2014) Rosa, D. A., Dors Jr, O. L., Krabbe, A. C. et al. 2014, MNRAS, 444, 2005, Paper II
- Rupke et al. (2010) Rupke D. S. N., Kewley, L. J., Chien, L.-H 2010, ApJ, 710, L156
- Sánchez et al. (2014) Sánchez, S. F., Rosales-Ortega, F. F., Iglesias-Páramo, J. et al. 2014, A&A, 563, 49
- Sánchez et al. (2012) Sánchez S. F. et al., 2012, A&A, 546, 2
- Satyapal et al. (2014) Satyapal, S., Ellison, S. L., McAlpine, W., Hickox, R. C., Patton, D. R., Mendel, J. T., 2014, MNRAS, 441, 1297
- Sekiguch & Wolstencroft (1992) Sekiguchi, K., & Wolstencroft, R. D. 1992, MNRAS, 255, 581
- Scudder et al. (2012) Scudder, J. M., Ellison, S. L., Torrey, P., Patton, D. R., Mendel, J. T., 2012, MNRAS, 426, 549
- Schlegel et al. (1998) Schlegel, D. J., Finkbeiner, D. P., Davis, M. 1998, ApJ, 500, 525
- Woods & Geller (2007) Woods, D. F., & Geller, M. J. 2007, AJ, 134, 527
- Wright (2006) Wright, E. L. 2006, PASP, 118, 1711,
Appendix A: Observed slit positions of AM 1401-324
Appendix B: Regions A and B of AM 2229-735
Appendix C: Logarithm of the average of the age stellar population


Appendix D: Gas and stellar parameters

Appendix E: Gas and stellar parameters


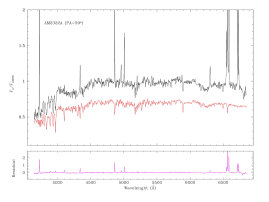
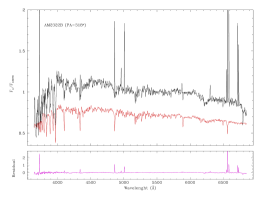
Appendix F: Stellar population synthesis