ALMA and VLA Observations: Evidence for Ongoing
Low-mass Star Formation near Sgr A*
Abstract
Using the VLA, we recently detected a large number of protoplanetary disk (proplyd) candidates lying within a couple of light years of the massive black hole Sgr A*. The bow-shock appearance of proplyd candidates point toward the young massive stars located near Sgr A*. Similar to Orion proplyds, the strong UV radiation from the cluster of massive stars at the Galactic center is expected to photoevaporate and photoionize the circumstellar disks around young, low mass stars, thus allowing detection of the ionized outflows from the photoionized layer surrounding cool and dense gaseous disks. To confirm this picture, ALMA observations detect millimeter emission at 226 GHz from five proplyd candidates that had been detected at 44 and 34 GHz with the VLA. We present the derived disk masses for four sources as a function of the assumed dust temperature. The mass of protoplanetary disks from cool dust emission ranges between 0.03 – 0.05 . These estimates are consistent with the disk masses found in star forming sites in the Galaxy. These measurements show the presence of on-going star formation with the implication that gas clouds can survive near Sgr A* and the relative importance of high vs low-mass star formation in the strong tidal and radiation fields of the Galactic center.
1 Introduction
The Galactic center hosts a population of young stars centered on a 4 black hole which coincides with the strong radio source Sgr A* (Ghez et al. 2008; Gillessen et al. 2009). A stellar cluster of about one hundred young massive OB and WR stars lie within 1 and 10′′ (0.04–0.4 pc) of Sgr A* (Paumard et al. 2006; Lu et al. 2009). An important question regarding star formation near supermassive black holes (SMBHs) is whether tidal shear in the vicinity of SMBHs is able to completely suppress star formation or whether it induces disk-based star formation, entirely distinct from the standard cloud-based mode observed in the Galactic disk. The stellar disk, the infrared excess sources as well as the molecular ring orbiting Sgr A* in the inner few parsecs of the Galactic center are excellent testing grounds to examine star formation in an extreme tidal environment. The study of these sources near Sgr A* provides us with a fantastic opportunity with far reaching implications for understanding star formation in the nuclei of more active galaxies hosting truly supermassive black holes.
A number of recent studies suggest that a disk-based mode of star formation occurred between 4 to 8 million years ago within 0.5 pc of Sgr A* (e.g., Genzel et al. 2010). There are also several signatures of star formation beyond this region suggesting a cloud-based mode of star formation (Geballe et al. 2006; Muzic et al. 2008; Eckart et al. 2013; Yusef-Zadeh et al. 2013, 2015a, 2016). If indeed star formation took place near Sgr A*, this region should contain numerous low mass stars with circumstellar disks (Haish, Lada & Lada 2001).
Low-mass stars at the Galactic center distance of 8 kpc are too faint, too far and highly extincted to be detected at near-IR and optical wavelengths. However, the strong UV radiation from the cluster of massive stars will photoevaporate and photoionize the circumstellar disks around young, low mass stars, thus allowing radio detection of ionized outflows (Johnstone et al. 1998; Störzer & Hollenbach 1990). We have recently detected 44 candidate protoplanetary disks (proplyds) at 34 GHz with cometary morphology within 20′′ of Sgr A* (Yusef-Zadeh et al. 2015a). The short expansion time scale and the low density of ionized gas associated with the cometary structures provide strong arguments in favor of proplyds (Li & Loeb 2013; Yusef-Zadeh et al. 2015a). Recent H42 recombination line observations indicate that these candidates have radial velocities ranging between 130 and 150 km s-1 (Tsuboi et al. 2016a), thus suggesting that they lie close to Sgr A*. Near-IR emission from two proplyd candidates indicate a layer of hot dust emission separated from the photoionized layer (Yusef-Zadeh et al. 2015b), thus implying that these candidates have disks with surface layers of hot dust and warm molecular gas that are photo-ionized by the stellar cluster near Sgr A*.
ALMA observations presented here are motivated to search for cool dust emission from circumstellar disk candidates and establish their proplyd nature with the implication that low-mass star formation is taking place near Sgr A*. Our measurements confirm that the brightest proplyd sources detected at 34 GHz have mm counterparts. We identify five proplyd candidates that have mm counterparts with disk mass estimates similar to those found in the Orion Nebula and NGC 2024 (Mann et al. 2014), assuming the dust temperature is 100K (Lau et al. 2013). We also determine the disk mass as a function of the dust temperature.
2 Observations and Data Reduction
ALMA and the Karl G. Jansky Very Large Array (VLA)111Karl G. Jansky Very Large Array (VLA) of the National Radio Astronomy Observatory is a facility of the National Science Foundation, operated under a cooperative agreement by Associated Universities, Inc. observations were carried out as part of a multi-wavelength observing campaign to monitor the flux variability of Sgr A*. A detailed account of these observations will be given elsewhere. Here we focus on observations related to the cluster of proplyd candidates located about 20′′ NE of Sgr A*. Observations were obtained on July 12 and July 18, 2016, as part of the director’s discretionary time given to us to join the observing campaign.
The ALMA 230 GHz data consisted of two spectral windows centered on 218.3 and 238.0 GHz, each 1.87 GHz wide. Bandpass and delay calibration was based on J1924-2914. Cross hand gain calibration was based on Titan and Pallas which were assumed to be unpolarized and subsequent calibration averaged the parallel hand (XX and YY) data sets. Initial amplitude and phase calibration was based on 1744-3116 with an assumed flux density of 0.26 Jy at 234 GHz. Phase self calibration followed by amplitude and phase calibration was used to reveal the low level emission but adds uncertainty to the overall amplitude gain calibration. The editing and calibration of the data was carried out by OBIT (Cotton 2008) before all the spectral windows were averaged prior to constructing final images. The July 18 data which has a higher spatial resolution () than the July 12 data are presented here.
We also used calibrated ALMA archival data at 100 GHz from Cycle 0 (project code 2011.0.00887.S) observed on May 18, 2012 with nineteen 12-m antennas. Neptune and Titan were used for flux calibration, while J1924-292 and NRAO530 were the bandpass and phase calibrators, respectively. The 100 GHz dataset contains contained 4 spectral windows of 2 GHz bandwidth. We imaged the continuum by combining all four spectral windows after phase and amplitude self-calibrations, using CASA version 4.5.3. The final sensitivity in the 100 GHz image presented here is 0.6 mJy/beam and the beam size is 1.58”1.31”, P.A.=-87.5∘.
Radio continuum observations were carried out with the VLA in its B configuration on the same days that ALMA observations took place. We used Ka-band (8.7 mm) and Q-band (7mm) with the 3-bit sampler system, which provided full polarization correlations in 4 basebands, each 2 GHz wide. Each baseband was composed of 16, 128 MHz wide, subbands. Each subband was made up of 64 channels, each 2 MHz wide. We used 3C286 to calibrate the flux density scale and used 3C286 and J1733-1304 (aka NRAO530) to calibrate the bandpass. We used J1744-3116 to calibrate the complex gains. We constructed a Q-band image of the 30′′ surrounding Sgr A* with a spatial resolution of (PA).
3 Results
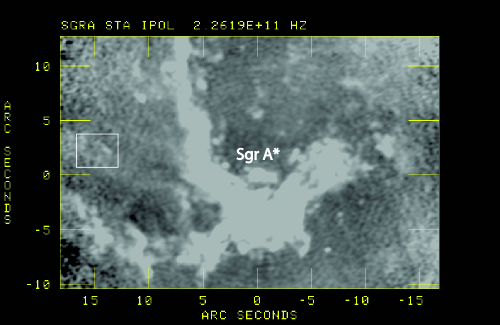
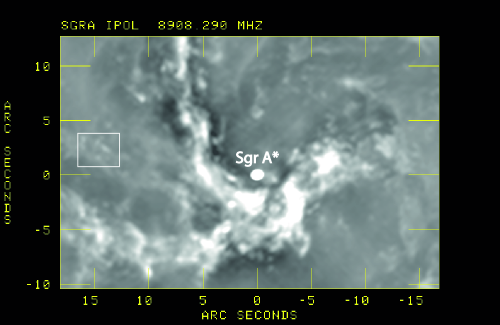
Figure 1a,b show 225 and 44 GHz grayscale images of the inner 35 of the Galactic center. The similarity of the mini-spiral in radio, mm, submm and mid-IR bands suggests that the emission arises from layers of hot dust, free-free and cool dust (Viehmann et al. 2006; Eckart et al. 2013; Kunneriath et al. 2012; Tsuboi et al. 2016b; Yusef-Zadeh et al. 2016). The ionized features are clearly accompanied by dust and molecular gas that is photoionized by 100-200 OB stars distributed within 10′′ of Sgr A*. Although, the separation of layers of dust and gas emission is complicated, it is clear that the interior to the 2-pc circumnuclear molecular ring is not entirely filled by ionized gas, as had been assumed in the past (see the review by Genzel et al. 2010). The new ALMA images of the mini-spiral provide a paradigm shift supporting direct evidence for fuels needed to accrete onto Sgr A* and to form stars in the extreme environment of Sgr A*. Based on a recent ALMA study of the mini-spiral, Tsuboi et al. (2016b) estimate molecular clumps of 10-100 distributed in the mini-spiral.
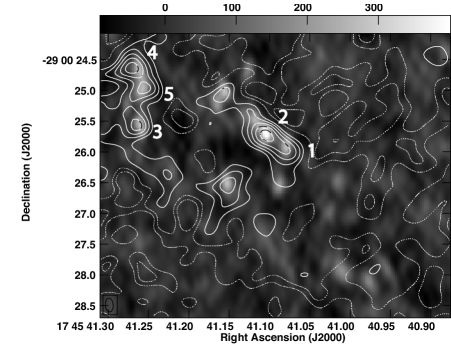
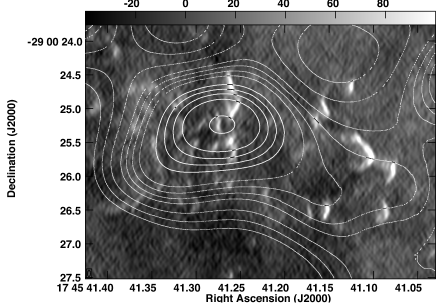
Figure 2a shows a region associated with the NE arm of the mini-spiral (see the box in Figure 1) where proplyd candidates are detected. There are at least five 44 GHz continuum sources that have 226 GHz counterparts. We also detect 100 GHz emission from a concentration of proplyds but the spatial resolution is too poor to identify individual proplyd sources. In spite of the 100 GHz low resolution, most of the proplyd candidates have 100 GHz counterparts. There are also other sites where proplyd candidates with mm counterparts are detected along the N and E arms of the mini-spiral. However, the ALMA spatial resolution at 100 GHz is not sufficient to identify individual proplyd candidates. Figure 2b, displaying a smaller region than Figure 2a, shows contours of 100 GHz emission which coincides with proplyd candidates detected at 34 GHz (Yusef-Zadeh et al. 2015a).
Table 1 shows the parameters of Gaussian fits to five individual sources that are identified as proplyd candidates (Yusef-Zadeh et al. 2015a). Columns 1 to 5 give the source numbers, the coordinates and the peak flux densities at 44 and 226 GHz, respectively. Column 6 calculates the dust emission by subtracting the 44 GHz flux densities from those of 226 GHz with the assumption that the 44 GHz emission is optically thin and is not contaminated by dust emission. Columns 7 and 8 give the disk mass and the names of individual sources from Yusef-Zadeh et al. (2015a), respectively.
To estimate the disk masses, we assume that the 44 GHz fluxes are dominated by optically-thin bremsstrahlung with electron temperature 8000 K. The frequency-dependence of the gaunt factor (e.g., equation 10.6 of Draine 2002) implies that the bremsstrahlung flux at 226 GHz is 0.76 times the 46 GHz flux. The balance of the 226 GHz continuum is presumed to be thermal continuum emission from dust, and is given as in Table 1. We follow Mann et al’s (2014, 2015) approach to estimating proplyd masses in the Orion nebula and NGC 2024 clusters, in assuming that the emission is optically thin and is dominated by dust in the outer disk with some temperature . Then
| (1) |
(e.g. Beckwith et al. 1990) where kpc is the distance to the Galactic center, is the dust grain opacity at 0.856 mm, and is the Planck function. We set , twice that adopted by Mann et al. (2014) and Beckwith et al (1990) to account for the twice solar metallicity at the Galactic center. Lau et al. (2013) derive a dust temperature at the location of proplyd candidates ranging between 90 and 105K based on the 9 to 37 m intensity ratios (see their Figure 8). We adopt K, representative of the inner parsec of the Galaxy, where dust is heated by the UV radiation from hot stars (Latvakoski et al. 1999; Lau et al. 2013). This is substantially higher than the K adopted by Mann et al. (2014, 2015) that is characteristic of molecular clouds beyond 10 pc (Pierce-Price et al. 2000) or within the Galactic disk.
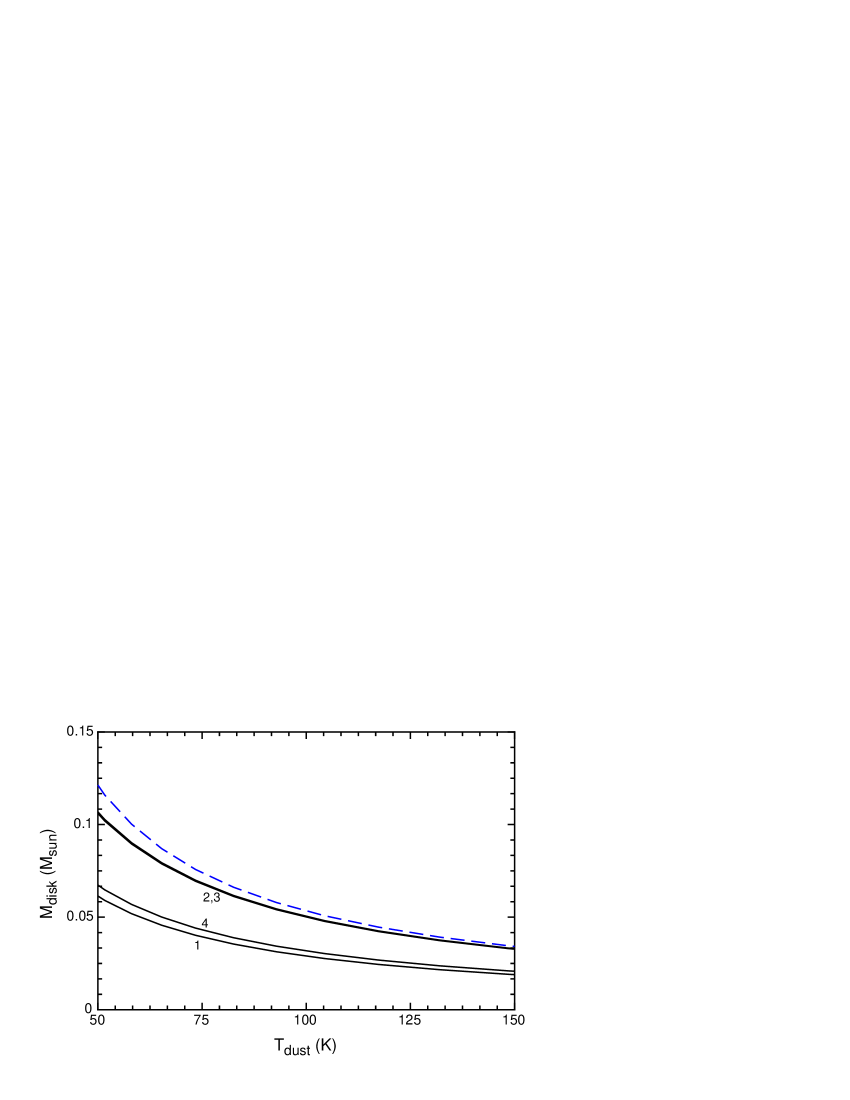
The disk masses derived using equation 1 are listed in Table 1 for sources 1–4, and a 2-sigma upper limit is provided for source 5. There is considerable uncertainty in these estimates. The 0.4′′ beam at 226 GHz may contain emission from residual cloud material within 1600 AU of the young star. The estimated disk mass is inversely proportional to the adopted values of and . Figure 3 shows the derived disk masses for sources 1–4 as a function of the assumed dust temperature. We see that for reasonable values of the estimates are consistent with the disk masses. The proplyd masses in Orion are indeed much lower (Mann et al 2014) , but these are relatively old disks ( 1-2 Myr), so that the masses have declined over time due to internal disk evolution and photo evaporation. Even then Mann et al. (2014) found that the proplyd disk masses in Orion range up to 0.078 . While many disks have masses of order 0.001 , Mann et al. (2014) detected five sources that are more massive than 0.01 . However, a comparison with proplyds in a young cluster is more appropriate. Mann et al (2015) surveyed NGC 2024 (age 0.5 Myr) and found a greater fraction of disks with masses exceeding 0.01 , consistent with our estimated masses for T100K.
These estimates are systematically low if the emission is not completely optically thin. To explore this, consider a uniform disk with semi-major and minor axes , and on the sky (in cm) that is emitting flux . The optical depth through the source is
| (2) |
and its column density is , so its mass is
| (3) |
By way of example, we adopt and compute the disk mass for source 4, which has the largest flux and for which optical depth effects will be most significant. This is plotted as the blue dashed curve in Figure 3. We see that optical depth effects add at most 10% to the derived disk mass but are typically far smaller. In particular, the effect is small for the fainter sources.
4 Discussion
A key question is whether on-going star formation is taking place along the inner couple of parsecs of the Galactic center. Here, we have shown the evidence for gaseous disks ionized by the external radiation near Sgr A*, thus providing strong support for the formation of young stars under extreme condition. After the comparison of near-IR and radio images, the newly detected proplyds do not coincide with any known massive stars. So, these sources can not be due to dusty HII regions produced by massive stars. Also, low mass stars at the Galactic center are too faint to be detected at near-IR wavelengths. The upper limits to the infrared flux from the Galactic center proplyd candidates are consistent with gaseous disks orbiting low mass stars at a projected distance of pc from Sgr A*. A recent study indicates that despite the strong tidal and UV radiation fields at the Galactic center, the formation of low-mass stars is easier than high mass stars near the strong gravitational potential of Sgr A* (Wardle & Yusef-Zadeh 2017). This is because of the criteria for the collapse of a cloud, under Roch and Jeans limits, depends on the distance from the massive black hole (Wardle and Yusef-Zadeh 2017). Thus the collapse of low-mass cloud is favored.
Although the origin of massive stars within 0.5 pc of Sgr A* is discussed in the context of the instability of massive gaseous disks and a cloud capture by Sgr A* (Nayakshin et al. 2007; Wardle and Yusef-Zadeh 2008), the formation of isolated low mass star formation has not been fully understood. Jalali et al. (2014) have recently suggested that the tidal compression of a clump of molecular gas launched from the circumnuclear ring in a highly eccentric orbit can attain densities greater than the Roche density. In another study, the gravitational stability of a cloud suggests that other forms of external pressure such as shocks and/or radiation, lower the Roche density, thus gravitation instability of a cloud near Sgr A* is possible (Yusef-Zadeh and Wardle 2016; Wardle and Yusef-Zadeh 2017).
Embedded high mass stars are easily detected in the near to mid IR (Schoedel et al. 2009). In addition, there are several constraints on embedded high-mass YSOs (Yusef-Zadeh et al. 2015b; Viehman et al. 2006). As for low mass stars, the 50% completeness limit is around 18 magnitude, and they are likely to be sub-giants on the ascending branch. Solar mass main sequence stars have K magnitude at the Galactic center (see Alexander 2005). The detection of low-mass stars would provide a strong constraint on the IMF near a supermassive black hole since arguments have been made that the Galactic center IMF may be different than that in the Galactic disk (e.g., Bartko et al. 2010). A top-heavy IMF has been suggested for stars in the central cluster (Bonnell & Rice 2008; Bartko et al. 2010; Lu et al. 2013). However, IMF determination is difficult in this region of the Galaxy and is prone to systematic effects (see Stolte et al. 2005; Kim et al. 2006; Hosek et al. 2015).
The morphology of individual sources and their clustering are the main discriminant to identify protostellar candidates at radio. The census of proplyds is incomplete due to extended emission and confusing sources dominating the eastern and northern arms of the mini-spiral. In spite of these difficulties, we have recently found two additional clusters of proplyd candidates at the western edge of the northern arm which will be reported in the future. Our measurements suggest a total of about 100 sources that are identified in the regions where extended emission is not dominant.
Although we don’t have an accurate number of low-mass stars within the inner pc of Sgr A*, we estimate that there are more than hundred proplyd candidates detected at radio wavelengths. If we assume 100 massive stars with , the expected number of low mass-stars between 1–3 with an IMF scaling as M-α where =1.25 is consistent with observations. Columns 1 to 3 of Table 2 lists the value of , the number of stars with mass range between 0.5-1 and 1-3 respectively. One of the implication of the evidence for low mass star formation near Sgr A* is that it rules out an IMF that is truncated near the bottom.
In analogy with the Orion cluster, we examine the disk mass of proplyds as a function of distance from the the extreme UV-dominated region of the stellar cluster surrounding Sgr A*. The lack of massive disks may imply a rapid dissipation of disk masses near Sgr A*. Unlike the Orion proplyds, the Galactic center proplyds suffer not only from the strong UV radiation field but also from the tidal field of Sgr A*. Tidal truncation will be significant for proplyds lying very close to Sgr A*. Our limited sample does not allows us to examine the disk mass as a function of distance from Sgr A*. However, the disk mass exceeds the minimum mass solar nebula (MMSN), thus the disk may be the birthplace of planetary systems near Sgr A*. Future sensitive ALMA observations will place strong constraints on the IMF near the Galactic center and provides further understanding of the role of environment on disk evolution and the birth of planets.
Acknowledgments: This work is partially supported by the grant AST-1517246 from the NSF. RS acknowledges funding from the European Research Council under the European Union’s Seventh Framework Programme (FP7/2007-2013) / ERC grant agreement [614922]. This paper makes use of the following ALMA data: 2015.A.00021.S (Principal Investigator Gunther Witzel) ALMA is a partnership of ESO (representing its member states), NSF (USA) and NINS (Japan), together with NRC (Canada) and NSC and ASIAA (Taiwan), in cooperation with the Republic of Chile. The Joint ALMA Observatory is operated by ESO, AUI/NRAO and NAOJ.
References
- Alexander (2005) Alexander, T. 2005, Phys. Rep., 419, 65
- Bartko (2014) Bartko, H., Martins, F., Trippe, S., et al. 2010, ApJ, 708, 834
- Beckwith et al. (1990) Beckwith, S. V. W., Sargent, A. I., Chini, R. S., & Guesten, R. 1990, AJ, 99, 924
- Bonnell & Rice (2008) Bonnell, I. A., & Rice, W. K. M. 2008, Science, 321, 1060
- Cotton (2008) Cotton, W. D. 2008, PASP, 120, 439
- Draine (2011) Draine, B. T. 2011, Physics of the Interstellar and Intergalactic Medium by Bruce T. Draine. Princeton University Press, 2011. ISBN: 978-0-691-12214-4,
- Eckart (2013) Eckart, A., Muzic, K., Yazici, S. et al. 2013, A&A, 551, 18
- Geballe et al. (2006) Geballe, T. R., Najarro, F., Rigaut, F., & Roy, J.-R. 2006, ApJ, 652, 370
- Genzel (2010) Genzel, R., Eisenhauer, F., & Gillessen, S. 2010, Reviews of Modern Physics, 82, 3121
- Ghez (2008) Ghez, A. M., Salim, S., Weinberg, N. N. et al. 2008, ApJ, 689, 1044
- Gillessen (2009) Gillessen, S., Eisenhauer, F., Trippe, S. et al. 2009, ApJ, 692, 1075
- Haisch et al. (2001) Haisch, K. E., Jr., Lada, E. A., & Lada, C. J. 2001, ApJ, 553, L153
- Hosek et al. (2015) Hosek, M. W., Jr., Lu, J. R., Anderson, J., et al. 2015, ApJ, 813, 27
- Jalali et al. (2014) Jalali, B., Pelupessy, F. I., Eckart, A., et al. 2014, MNRAS, 444, 1205
- Johnstone (1998) Johnstone, D., Hollenbach, D. & Bally, J. 1998, ApJ, 499, 758
- Kim et al. (2006) Kim, S. S., Figer, D. F., Kudritzki, R. P., & Najarro, F. 2006, ApJ, 653, L113
- Kunneriath et al. (2012) Kunneriath, D., Eckart, A., Vogel, S. N., et al. 2012, A&A, 538, A127
- Latvakoski et al. (1999) Latvakoski, H. M., Stacey, G. J., Gull, G. E., & Hayward, T. L. 1999, ApJ, 511, 761
- Lau et al. (2013) Lau, R. M., Herter, T. L., Morris, M. R., Becklin, E. E., & Adams, J. D. 2013, ApJ, 775, 37
- Li & Loeb (2013) Li, G., & Loeb, A. 2013, MNRAS, 429, 3040
- Lu (2009) Lu, J. R., Ghez, A. M., Hornstein, S. D. et al. 2009, ApJ, 690, 1463
- Lu et al. (2013) Lu, J. R., Do, T., Ghez, A. M., et al. 2013, ApJ, 764, 155
- Mann (2014) Mann, R. K., Di Francesco, J., Johnstone, D. et al. 2014, ApJ, 784, 82
- Mann et al. (2015) Mann, R. K., Andrews, S. M., Eisner, J. A., et al. 2015, ApJ, 802, 77
- MuVzić et al. (2008) MuVzić, K., Schödel, R., Eckart, A., Meyer, L., & Zensus, A. 2008, A&A, 482, 173
- Nayakshin et al. (2007) Nayakshin, S., Cuadra, J., & Springel, V. 2007, MNRAS, 379, 21
- Paumard (2006) Paumard, T., Genzel, R., Martins, F. et al. 2006, ApJ, 643, 1011
- Pierce-Price et al. (2000) Pierce-Price, D., Richer, J. S., Greaves, J. S., et al. 2000, ApJ, 545, L121
- Schödel et al. (2010) Schödel, R., Najarro, F., Muzic, K., & Eckart, A. 2010, A&A, 511, A18
- Stolte et al. (2005) Stolte, A., Brandner, W., Grebel, E. K., Lenzen, R., & Lagrange, A.-M. 2005, ApJ, 628, L113
- Storzer (1999) Störzer, H. & Hollenbach, D. 1999, ApJ, 515, 669
- Tsuboi et al. (2016) Tsuboi, M., Kitamura, Y., Uehara, K., Miyawaki, R., & Miyazaki, A. 2016b, arXiv:1609.08256
- Tsuboi et al. (2016) Tsuboi, M., Kitamura, Y., Miyoshi, M., et al. 2016b, PASJ, 68, L7
- Viehmann (2006) Viehmann, T., Eckart, A., Schod̈el, et al. 2006, ApJ, 642, 861
- Wardle & Yusef-Zadeh (2008) Wardle, M., & Yusef-Zadeh, F. 2008, ApJ, 683, L37
- Wardle et al. (2017) Wardle, M. & Yusef-Zadeh, F. 2017, in preparation
- Yusef-Zadeh (2012) Yusef-Zadeh, F. 2012, ApJ, 759, L11
- Yusef-Zadeh et al. (2013) Yusef-Zadeh, F., Royster, M., Wardle, M., et al. 2013, ApJ, 767, L32
- Yusef-Zadeh et al. (2015) Yusef-Zadeh, F., Roberts, D. A., Wardle, M., et al. 2015a, ApJ, 801, L26
- Yusef-Zadeh et al. (2015) Yusef-Zadeh, F., Bushouse, H., Schödel, R., et al. 2015b, ApJ, 809, 10
- Yusef-Zadeh et al. (2016) Yusef-Zadeh, F., Wardle, M., Schödel, R., et al. 2016, ApJ, 819, 60
- Yusef-Zadeh & Wardle (2016) Yusef-Zadeh, F., & Wardle, M. 2016, arXiv:1611.09401
| Proplyd | (J2000) | (J2000) | F | F | F | M | Notes |
|---|---|---|---|---|---|---|---|
| Name | () | (′′) | (mJy) | (mJy) | (mJy) | () | |
| 1 | 41.0856 | 25.930 | 0.710.12 | 1.490.47 | 0.95 | 0.029 | P7c |
| 2 | 41.1013 | 25.780 | 1.140.11 | 2.520.46 | 1.66 | 0.050 | P8b |
| 3 | 41.2688 | 25.507 | 0.680.12 | 2.160.46 | 1.65 | 0.0500.014 | P28b |
| 4 | 41.2691 | 24.659 | 0.760.12 | 1.620.47 | 1.05 | 0.0320.014 | P26b |
| 5 | 41.2584 | 24.961 | 0.870.11 | 0.980.49 | 0.32 | 0.045 | P26b |
| 0.5-1 | 1-3 | |
|---|---|---|
| 0.5 | 13.24 | 18.73 |
| 0.75 | 30.17 | 35.88 |
| 1 | 68.26 | 68.26 |
| 1.25 | 153.3 | 128.9 |
| 1.5 | 341.9 | 241.8 |
| 1.75 | 757.4 | 450.3 |
| 2 | 1667 | 833.3 |
| 2.35 | 4979 | 1953 |