Ultrafast Electron-Lattice Coupling Dynamics in VO2 and V2O3 Thin Films
Abstract
Ultrafast optical pump - optical probe and optical pump - terahertz probe spectroscopy were performed on vanadium dioxide (VO2) and vanadium sesquioxide (V2O3) thin films over a wide temperature range. A comparison of the experimental data from these two different techniques and two different vanadium oxides, in particular a comparison of the electronic oscillations generated by the photoinduced longitudinal acoustic modulation, reveals the strong electron-phonon coupling that exists in the metallic state of both materials. The low energy Drude response of V2O3 appears more susceptible than VO2 to ultrafast strain control. Additionally, our results provide a measurement of the temperature dependence of the sound velocity in both systems, revealing a four- to fivefold increase in VO2 and a three- to fivefold increase in V2O3 across the phase transition. Our data also confirm observations of strong damping and phonon anharmonicity in the metallic phase of VO2, and suggest that a similar phenomenon might be at play in the metallic phase of V2O3. More generally, our simple table-top approach provides relevant and detailed information about dynamical lattice properties of vanadium oxides, opening the way to similar studies in other complex materials.
I INTRODUCTION
Vanadium oxides are well known examples of materials where the phases are determined by strong interactions between different degrees of freedom. Such complex systems, where charge, lattice, orbital, and spin contributions can be equally strong and are frequently coupled, exhibit a variety of phenomena including high temperature superconductivity Hashimoto et al. (2014), colossal magnetoresistance Jin et al. (1994), multiferroicity Kubacka et al. (2014), and topological surface states Wang et al. (2013). Given the complex nature of these materials, the various phases are generally challenging to investigate experimentally. Ultrafast time resolved techniques are a successful route to approach these problems Averitt and Taylor (2002); Orenstein (2012). In particular, time resolved measurements in different energy ranges have contributed to the understanding of insulator-to-metal transitions (IMTs) in vanadium dioxide (VO2) and vanadium sesquioxide (V2O3) as a function of temperature, pressure, or doping Misochko et al. (1998); Mansart et al. (2010); Liu et al. (2011); Rodolakis et al. (2010); Cavalleri et al. (2001); Huber et al. (2016); O’Callahan et al. (2015); Lantz et al. (2017). These measurements have also shed light onto the nature of the different insulator phases in both systems Mansart et al. (2010); Pashkin et al. (2011); Wegkamp et al. (2014); Gray et al. (2016), and the electron-phonon coupling driven acoustic response in V2O3 Liu et al. (2011); Mansart et al. (2010).
Despite many ultrafast and static measurements, the exact mechanisms responsible for the IMTs in vanadium oxides and especially in VO2 remain widely debated Morin (1959); McWhan et al. (1969, 1971); Baum et al. (2007); Qazilbash et al. (2008); Pfalzer et al. (2006); Limelette et al. (2003); Maurer et al. (1999); Baldassarre et al. (2008), namely the contribution of electronic correlations (Mott-Hubbard picture) and of electron-lattice mediated effects (Peierls model) Budai et al. (2014); Qazilbash et al. (2008); Tao et al. (2012); Morrison et al. (2014); Wegkamp et al. (2014). It is clear, however, that multiple pathways are possible to initiate pressure and temperature dependent transitions, and that electronic and lattice effects are strongly coupled Wegkamp et al. (2014); Gray et al. (2016); Budai et al. (2014); Ramírez et al. (2015). Measurements that dynamically investigate this coupling are therefore essential to assist in understanding the nature of IMTs.
Bulk VO2 undergoes an IMT at 340 K, along with a monoclinic-to-rutile structural transition Morin (1959); Marezio et al. (1972) (cf. phase diagram in Fig. S1a sup ). In the low temperature phase, the vanadium ions dimerize and tilt to form a nonmagnetic insulator Qazilbash et al. (2008). Above-bandgap photoexcitation of the monoclinic insulator can promote electrons to anti-bonding states, causing repulsion between the dimerized vanadium ions and lattice expansion, followed by long-range shear rearrangements at the speed of sound Baum et al. (2007); Gray et al. (2016). Above a critical fluence threshold the metallic phase forms via nucleation and growth Hilton et al. (2007a); Lysenko et al. (2010); Morrison et al. (2014); Wegkamp et al. (2014). The acoustic and optical phonon landscape changes drastically across the IMT, and phonons have recently been seen to account for 2/3 of the entropy increase at the IMT and to stabilize the metallic phase Maurer et al. (1999); Budai et al. (2014). These observations suggest that lattice effects play a significant role in driving the IMT in VO2.
V2O3 is a low temperature monoclinic antiferromagnetic insulator which transitions to a paramagnetic rhombohedral metal above 155 K Morin (1959); McWhan and Remeika (1970) (cf. phase diagram in Fig. S1b sup ). Initial reports stated that the system exhibits a classical Mott-Hubbard transition where electrons localize to form the insulating phase McWhan et al. (1969, 1971). However, more recent work points to electron-lattice effects contributing strongly to the first order IMT in the undoped compound Budai et al. (2014); Pfalzer et al. (2006), and questions the equivalence of temperature and pressure routes in driving the phase transition in doped V2O3 Rodolakis et al. (2010). The strong strain-dependence of metallic V2O3 manifests via the large influence of ultrafast acoustic modulations on the spectral weight redistribution dynamics, particularly in the far infrared region of the spectra corresponding to the low energy Drude weight Liu et al. (2011).
In this work, we present a comparative ultrafast pump-probe study of photoinduced acoustic effects in VO2 and V2O3, present in both optical reflectivity and terahertz (THz) conductivity dynamics. Transient reflectivity measurements at 1.55 eV are sensitive to interband transitions in VO2 and V2O3, with insulating gaps of 0.6 eV and 0.5 eV, respectively Qazilbash et al. (2008), while THz probes the quasiparticle dynamics, effectively yielding a dynamical measurement of the dc conductivity.
Our results show that, similar to V2O3 Liu et al. (2011); Mansart et al. (2010), VO2 exhibits a modulation of the electronic response due to photoinduced acoustic effects. This influence of small structural variations on the electronic behavior attests to significant electron-phonon coupling. Comparing both materials, we observe that V2O3 is significantly more amenable than VO2 to Drude weight modulation via acoustic wave propagation. Also, thin film samples with varying defect density exhibit different static and dynamic electronic responses. Thin films with fewer defects have properties closer to bulk and are therefore characterized by a larger THz conductivity in the metallic state and by larger photoinduced conductivity variations. In contrast to this electronic behavior, the acoustic signatures we observe appear to be quite robust against varying defect density in the thin films. Differences in the response to photoinduced acoustic excitation between VO2 and V2O3, and between nominally equivalent samples, could be related to the strong and distinct influence of defects on the electronic response of these materials Ramírez et al. (2015).
In addition, our data provide a temperature dependent measure of the sound velocity in both VO2 and V2O3, revealing an increase in the sound velocity across the insulator-to-metal transition, four- to fivefold for VO2 and three- to fivefold for V2O3.
We also verify that acoustic damping increases in the metallic phase of VO2, compared to the insulating phase, in agreement with previous reports that present phonon entropy as a stabilization mechanism for the metallic phase Budai et al. (2014). V2O3 exhibits a similarly increased damping in the metallic phase, hinting that phonon anharmonicity might also be much stronger than in the insulating phase, and that phonon effects might play a significant role in the IMT of this material as well.
II EXPERIMENTAL METHODS
Transient optical reflectivity measurements were performed using 35 fs pulses at 800 nm (1.55 eV) from a 1 KHz repetition rate, 3 W average power Ti:sapphire regenerative amplifier. Pump and probe fluences were set at 1-4 mJ/cm2 and J/cm2, respectively, and both beams were set at approximately normal incidence to the sample. THz pulses 1 ps in duration were generated via optical rectification and detected by electro-optic sampling in ZnTe. In contrast to the optical measurements at 1.55 eV, the THz pulses (0.1 - 2.5 THz) effectively probe the low energy Drude response Qazilbash et al. (2008). Transient optical reflectivity measurements at 800 nm, yielding R/R, and THz conductivity measurements, yielding Averitt and Taylor (2002), were performed with the same pump conditions.
Of particular relevance to this work is the ability to generate coherent acoustic phonons using ultrafast optical excitation. The ultrafast above bandgap optical pulse is absorbed near the surface causing a localized temperature increase. Thermal expansion leads to a transient stress which launches a strain wave in the material. The propagating acoustic phonon modifies the refractive index and can therefore be detected optically via modulation of R/R, at 800 nm, and of , around 1 THz. When the film thickness is on the order of the longitudinal acoustic phonon wavelength an acoustic standing wave is generated and detected instead Ge et al. (2014). Analytical Thomsen et al. (1984, 1986) and conceptual Ge et al. (2014) aspects of the generation and detection of coherent acoustic modulations can be found in the literature Thomsen et al. (1984, 1986); Ge et al. (2014).
The samples consist of 75 nm and 50 nm thick films of VO2 on c-cut Al2O3 West et al. (2008), 75 nm thick films of V2O3 on c-cut Al2O3 Yun et al. (2009), and 95 nm thick films of V2O3 on r-cut Al2O3 Ramírez et al. (2015). The VO2 films have a well defined out of plane rutile c-axis, and three preferred in-plane orientations due to the hexagonal symmetry of the c-cut Al2O3 substrate Kittiwatanakul (2014). The 75 nm V2O3 film has a well-defined rhombohedral out of plane [110] axis but is polycrystalline in plane, while the 95 nm film is nearly single crystalline throughout. Details of the fabrication can be found elsewhere West et al. (2008); Yun et al. (2009); Ramírez et al. (2015). Unless otherwise specified, the results presented in this paper correspond to the 75 nm films.
The sample temperature was set using a continuous flow cryostat, pumped down to 10-6 mbar and equipped with a heating stage.
III RESULTS
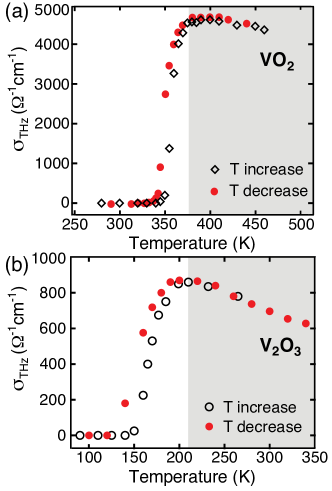
Figure 1 shows the static THz conductivity of the 75 nm VO2 and V2O3 films measured using THz spectroscopy. Fig. 1a shows that the IMT in the VO2 film occurs at K, and that a maximum conductivity of 4800 (cm)-1 is obtained at 380 K. V2O3 is seen from Fig. 1b to have K, with a peak conductivity of 900 (cm)-1 at 200 K. These measurements demonstrate that our VO2 and V2O3 films behave similarly to bulk single crystals, which attests to the generality of our conclusions. Above 200 K the V2O3 metallic state conductivity decreases dramatically (Fig. S1 sup ), beyond what would be expected from an increased electron-phonon scattering rate, due to the strongly correlated nature in this “bad” metal region Qazilbash et al. (2006, 2008). The relative conductivity decrease in the VO2 metallic state above 380 K is smaller compared to V2O3, with a 6% conductivity drop per 50 K for VO2 and an 11 % conductivity drop per 50 K for V2O3. This is consistent with suggestions that electronic correlations have a smaller impact on the metallic phase of VO2 compared to metallic V2O3 Basov et al. (2011); Stewart et al. (2012), which enters a crossover region to a pure Mott insulator phase above 450 K (Fig. S1 sup ). Corresponding temperature-dependent static conductivity data for the 95 nm V2O3 film are shown in Fig. S2 sup .
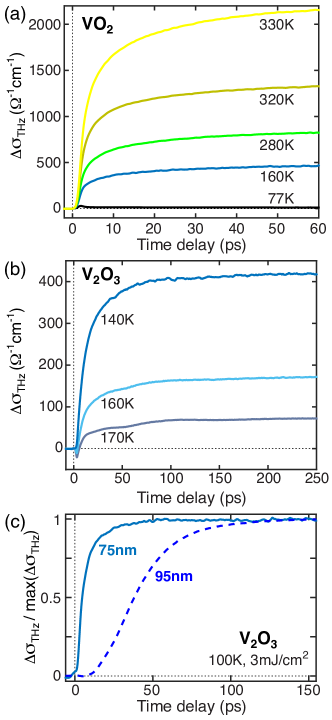
Figures 2a, 3a and 3b show the transient conductivity () and transient reflectivity at 800 nm () of VO2 at low (Fig. 2a) and high (Figs. 3a and 3b) initial temperatures for a pump fluence of 3.8 mJ/cm2. From the conductivity dynamics at , shown in Fig. 2a, it is clear that the maximum value achieved for the transient conductivity increases with initial temperature. For K, recovers in less than 10 ps, whereas for K the deposited energy is sufficient to thermally stabilize the metallic phase beyond our 350 ps measurement window sup . As previously observed, the tens of ps timescale for the conductivity increase is considerably larger than the 1 ps electron-phonon thermalization time (Fig. S9 sup ) due to the nucleation and growth process that accompanies the IMT Hilton et al. (2007a); Abreu et al. (2015).
For the metallic phase dominates the transient photothermal response of VO2. , shown in Fig. 3a, decreases following photoexcitation in agreement with Fig. 1a, and so does (Fig. 3b). Most significantly, the high temperature dynamics of both and exhibit oscillatory components (clearly isolated below, in Figs. 4a and 5b) which are direct signatures of acoustic wave propagation, similar to those reported in V2O3 Mansart et al. (2010); Liu et al. (2011). Budai et al. Budai et al. (2014) have observed that strongly anharmonic phonons rather than electronic effects stabilize the metallic phase of VO2. The results shown here confirm the strength of electron-phonon coupling in metallic VO2 since acoustic signatures are seen not only in , as expected, but also in , a clear indication that lattice dynamics modulate the Drude response of the system above .
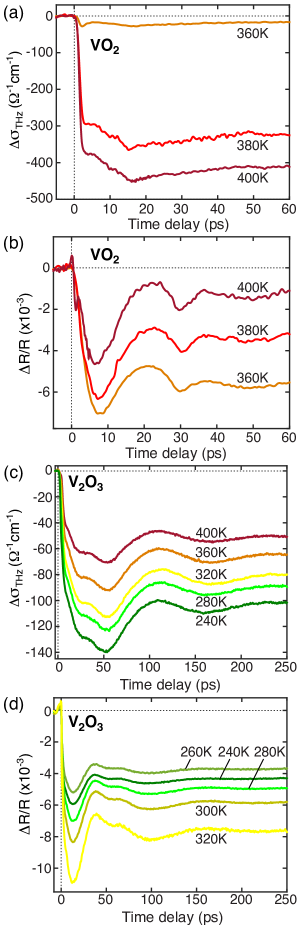
As a counterpart to the data on VO2, Figs. 2b, 3c and 3d show and for V2O3 at temperatures below (Fig. 2b) and above (Figs. 3c and 3d) for a pump fluence of 1 mJ/cm2. V2O3 also exhibits a tens of ps increase characteristic of a percolative IMT (Fig. 2b). The decrease in with increasing initial temperature stems solely from the fact that temperatures closer to are used compared to VO2, so that the initial state already has a finite conductivity (Fig. 1) and the response saturates as the full metallic state is reached. Photoexcitation of the system in the metallic phase at produces a decrease of both and in addition to clearly defined temperature dependent acoustic signatures, as previously reported Liu et al. (2011); Mansart et al. (2010).
Figure 2c compares the normalized for the 95 nm and 75 nm V2O3 films at 100 K for a pump fluence of 3 mJ/cm2. The 95 nm film has a metallic conductivity more than twice as large as the 75 nm film (Fig. 1b and Fig. S2 sup ), which is likely due to its single crystalline rather than polycrystalline nature and to its consequent smaller defect density. As discussed in an earlier publication Abreu et al. (2015), the defect density has a strong influence not only on the static properties but also on the transition dynamics of V2O3 thin films since it affects the nucleation and growth of metallic domains in the insulating phase. For V2O3 and VO2, it is important to distinguish between ultrafast transition dynamics that occur at the microscopic level, independent of the nucleation and growth process, and those that occur at the mesoscopic level where the response is dominated by nucleation and growth. Microscopic effects have been extensively discussed, particularly in the case of VO2 Hilton et al. (2007b); Qazilbash et al. (2008); Liu et al. (2013); Dönges et al. (2016). Using a THz probe, which is sensitive to the mesoscale dynamics, we observe fast transients that start during photoexcitation by the pump pulse for the 75 nm film, whereas the 95 nm film exhibits slower variations and a delayed onset relative to the pump arrival time (Fig. 2c). These significant differences in conductivity dynamics cannot be explained by the minimal difference in film thickness. Rather, they occur due to the 95 nm film containing fewer defects than the 75 nm film, and hence fewer defect-induced preferential nucleation sites, which slows down the photoinduced IMT in the thicker sample Abreu et al. (2015). Such mesoscopic effects occur independently in addition to any microscopic modifications, and their effect on the dynamics must be taken into account in studies of both V2O3 and VO2.
Despite differences in IMT timescales (Figs. 2c and S6 sup ), high temperature dynamic data for the 50 nm VO2 film and the 95 nm V2O3 film are comparable to the 75 nm films of each material and consequently are shown in Figs. S4 and S7 of the Supplemental Material sup .
Finally, dynamics for VO2 and V2O3 at also exhibit acoustic oscillations characteristic of the insulating phase. The full dynamic insulating responses have many contributing factors and are therefore less straightforward to analyze than the metallic response. As the present work focuses on the acoustic component, the full low temperature signals are shown in Fig. S3 sup . The acoustic signatures of the insulating phase can, however, be compared with the metallic phase results of Figs. 3b and 3d, as shown in Fig. 5 and discussed in Section IV below.
IV ANALYSIS AND DISCUSSION
In order to analyze the acoustic dynamics in more detail, we subtract all exponential, non-oscillatory contributions to the metallic data in Fig. 3. This procedure is described in the Supplemental Material sup , and yields the acoustic contribution to , shown in Fig. 4, and to the dynamics, shown in Fig. 5. The lack of acoustic signatures in the insulating phase response in Figs. 2a and 2b is expected since the THz probe is only sensitive to the metallic volume fraction Abreu et al. (2015).
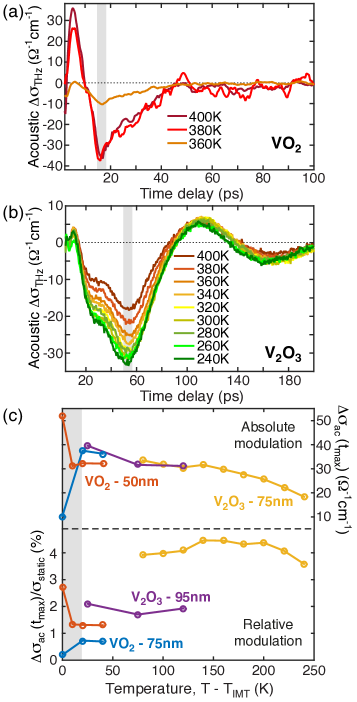
The acoustic component of the dynamics is shown in Fig. 4a and 4b for VO2 and V2O3, respectively. The modulation is significantly longer lived in V2O3, an indication that phonon damping is smaller in V2O3 than in VO2. The significance of phonon damping for the properties of VO2 and V2O3 will be discussed in more detail below.
In Fig. 4c, the maximum oscillation amplitude for both VO2 and V2O3 is plotted as a function of . The maximum is estimated at the time delays marked by vertical gray bars in Figs. 4a and 4b to avoid potential residual contributions from non-acoustic effects at shorter time delays. This choice of temperature scale enables a direct comparison between the different samples and materials. The bottom part of Fig. 4c shows the oscillation amplitude maxima normalized by the static conductivity at that temperature sup , while the top shows the non-normalized values. For K, i.e. well outside the hysteresis region (Fig. 1), the absolute value of the maximum conductivity modulation (top of Fig. 4c) decreases with increasing temperature for all films. This decrease is consistent with the negative slope of the static conductivity observed with increasing temperature in the metallic phase (Figs. 1 and S2 sup ). Interestingly, the conductivity oscillation amplitudes are very similar for all the samples examined, even after accounting for the differences in pump fluence (the fluence dependence for the two V2O3 samples is discussed in Section II G and Fig. S8 of the Supplemental Material sup ). In particular, oscillation amplitudes are comparable for VO2 and V2O3, as well as for samples of the same material with different static conductivities. The normalized plot in Fig. 4c (bottom) enables a more direct comparison of VO2 and V2O3 results. It is clear that acoustic modulations in the 75 nm thick V2O3 are stronger than in VO2, which points to larger electron-phonon induced strain modulation. This conclusion is further strengthened if the different pump fluences are taken into account when analyzing the data (cf. Section II G and Fig. S8 of the Supplemental Material sup ). The 95 nm thick V2O3 film does not show such a strikingly higher effect compared to VO2.
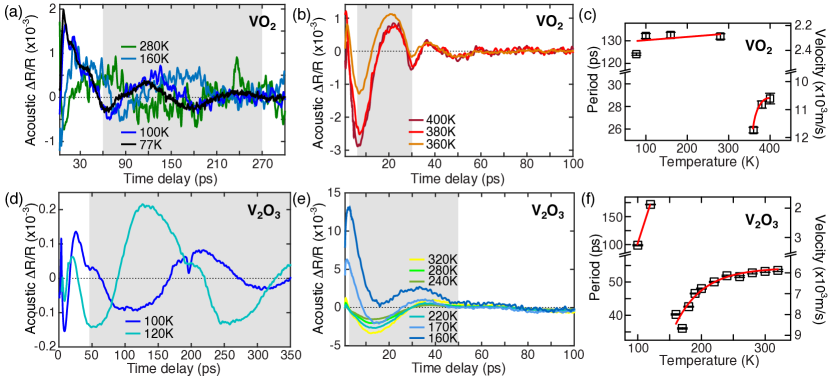
It is not trivial to relate the acoustic oscillation period in with the sound velocity in the system since the THz probe, with its 300 m wavelength, effectively probes an average acoustic modulation of the conductivity in the sub-micron thick films Liu et al. (2011). However, an approximate sound velocity value can be directly determined using oscillations of , the transient reflectivity at 800 nm Thomsen et al. (1984).
We focus on the acoustic oscillations which are isolated in Fig. 5, obtained from the data in Figs. 3b and 3d for , and in Fig. S3 sup for . Acoustic modulations of for are more difficult to observe in V2O3 than in VO2 as the current measurements are limited to temperatures above 80 K. Indeed, the lower value of for V2O3 compared to VO2, as well as the fact that the latent heat is smaller and therefore the IMT can be driven at the same fluence for lower temperatures relative to the respective , means that the acoustic response of the insulating phase in V2O3 is quickly masked by phase transition dynamics. This problem could be circumvented in future work by analyzing the response at lower temperatures or by studying doped V2O3 samples.
The period of the reflectivity oscillations shown in Figs. 5c and 5f is determined by fitting the shaded regions in the corresponding reflectivity data with a damped sinusoid. The fidelity of the fit is validated by the near unity adjusted R2 values (cf. Section II D of the Supplemental Material sup ). Given that the 75 nm thickness of the films is on the order of acoustic phonon wavelengths Seikh et al. (2006), the observed oscillations are essentially reflections of the acoustic wave that propagates in the sample between the film surface and the film-substrate interface, as described in Section I. The corresponding sound velocity can therefore be calculated from the period, , using Thomsen et al. (1984); Ge et al. (2014), where is the film thickness (a more detailed analysis is given in Section III and Fig. S9 of the Supplemental Material, for a thicker film sup ).
The most striking effect in our data is that the sound velocity associated with these oscillations, apart from a slow and monotonic increase with temperature, exhibits an abrupt increase at when going from the insulating to the metallic phase, by a factor of 4-5 in VO2 and 3-5 in V2O3. This is seen clearly in Figs. 5c and 5f. Such a large sound velocity variation is not unexpected in vanadium oxides, where lattice constants change by about 1 across the structural phase transition that accompanies the IMT Kucharczyk and Niklewski (1979); McWhan and Remeika (1970); sup . V-O and V-V bond lengths change by up to 4 across the structural transition, stabilizing an insulating phase below or a metallic phase above Dernier and Marezio (1970); Marezio et al. (1972); sup .
Sound velocity measurements for the metallic phase of VO2 yield approximately 4x m/s, measured along the rutile c-axis by Maurer et al. Maurer et al. (1999), or 8x m/s, determined from the phonon dispersion of the longitudinal acoustic mode along the -Z direction in Budai et al. Budai et al. (2014). In the metallic phase of V2O3 Seikh et al. Seikh et al. (2006) and Yelon et al. Yelon and Keem (1979) report 8x m/s, corresponding to longitudinal acoustic mode propagation. The VO2 and V2O3 metallic sound velocities measured in Fig. 5 are consistent with the order of magnitude reported previously. Some discrepancies are expected, as discussed below.
Sample to sample variation in vanadium oxides, and in particular in vanadium oxide thin films, is well known and must be taken into account when analyzing and comparing different data sets Liu et al. (2015). In particular, variation in sound velocity values is a result of the different strain environments and crystallinity of the samples. The strain sensitivity of VO2 material properties, in particular, is widely reported Goodenough (1971); Wu et al. (2006); Park et al. (2013); Kittiwatanakul et al. (2014); Liu et al. (2015) and is caused by large differences in lattice constant values along different crystallographic axes with large variations of these values across the IMT (Table SI sup ). For the measurements presented here, the sound velocity determination could be affected by acoustic waves propagating at an angle to the film normal, by substrate-induced strain in the growth direction, as well as by contributions from other acoustic modes in the system, in particular non-longitudinal waves.
Analyzing Figs. 5b and 5e from the perspective of acoustic modulation damping reveals that the amplitude of the metallic oscillations decays two times faster in VO2 than in V2O3 (Fig. 5), with damping times of about 10 ps and 20 ps, respectively sup . Damping effects are thus stronger in the metallic phase of VO2 compared to V2O3. The observations from Budai et. al. Budai et al. (2014) of increased phonon damping in the metallic phase compared to the insulating phase are verified by our analysis on VO2, where the damping time decreases from 145 ps in the insulator to 10 ps in the metal. The results for V2O3 show a decrease in damping time from 225 ps in the insulating phase to 20 ps in the metallic phase, suggesting a similar influence of phonon anharmonicity to be at play in the metallic phase of V2O3. It should be noted that an additional source of damping exists, due to transmission of the acoustic wave into the substrate. Transmission losses will depend on how well acoustic impedances are matched between the film and the substrate, and can potentially lead to an increase of the effective damping time associated with the VO2 or V2O3 material responses alone. Quantitative comparisons with damping times obtained from other methods must therefore be done with care. A detailed analysis of the observed damping is presented in Section II D of the Supplemental Material sup .
Figures 4 and 5 therefore enable us to conclude that acoustic signatures are qualitatively the same and quantitatively within a factor of two of each other in VO2 and V2O3. This is so despite differences in the mechanism that drives the IMT, in particular the larger effect expected from electronic correlations in V2O3 compared to VO2, and in the latent heat associated with the IMT (65 J/cm3 for V2O3 Keer et al. (1976) and 240 J/cm3 for VO2 Chandrashekhar et al. (1973)). In the remainder of the manuscript we discuss the possible origin of the larger acoustic modulation signal that is observed for V2O3. First, the electron-phonon coupling coefficient is higher for V2O3 (3x10¹⁸ W K-1m-3 sup ) than for VO2 (1018 W K-1m-3 Liu et al. (2012)), which partially explains the increased signal strength since energy couples more efficiently between the electrons and the lattice. This means that the strain wave generation process following electronic photoexcitation is more efficient in V2O3, and that the subsequent strain-induced modifications of the electronic spectral weight are stronger. In fact, metallic V2O3 at atmospheric conditions is seen to lie near a transition line to a pressure induced isostructural paramagnetic insulating phase (Fig. S1), so that one would indeed expect a similar pressure change to lead to a larger change in the conductivity for V2O3 than for VO2. Second, the lattice structure of V2O3 is overall more amenable to modulations, as deduced from the lower phonon damping measured in V2O3 compared to VO2 which effectively means that the structure is less rigid. This implies that photoinduced strain modulations would be larger in V2O3 for the same amount of energy transferred to the lattice. Lastly, it is important to reiterate the strong influence of differences in defect density, which lead to variations in the static and dynamic properties of both VO2 and V2O3 when comparing nominally equivalent samples. In particular, such variations are known to affect the structural response of these materials Ramírez et al. (2015), and should therefore be taken into account when attempting precise quantitative comparisons.
V CONCLUSION
This work demonstrates that strong electron-phonon coupling exists and is responsible for clear ultrafast acoustic modulations of the Drude and optical responses in V2O3 and VO2. This effect appears to be stronger for V2O3 than for VO2, suggesting that the electronic and lattice structure of V2O3 is more amenable to transient strain modulation than VO2.
We further identify a significant temperature dependence of the sound velocity in both materials, in particular a dramatic increase by a factor of about 4-5 in VO2 and 3-5 in V2O3 across the IMT. The observation (in both materials) of stronger acoustic damping in the metallic phase relative to the insulating one confirms the strong role of phonon anharmonicity in metallic VO2 and suggests that a similar mechanism is at play in V2O3. The timescale for damping of the acoustic modulations in both the THz conductivity (Drude response) and the near infrared reflectivity (spectral weight at 1.55 eV, related to the occupation of V3d orbitals) are longer for V2O3 than for VO2, indicating stronger damping in the latter and thus a potentially stronger phonon anharmonicity contribution.
Our findings demonstrate that transient strain induced by photoexcitation is a useful tool to both analyze and control the electronic properties of complex materials and their coupling to lattice excitations. The same approach could be used to investigate the modifications to the electronic and lattice properties induced by different defect densities. This is particularly relevant in the case of VO2 and V2O3, where different defect densities lead to strong sample to sample variation of static and dynamic properties, but is likely applicable to other complex materials and to their properties which are characteristically sensitive to small perturbations.
VI ACKNOWLEDGEMENTS
We thank Mariano Trigo and Gabriel Lantz for useful discussions.
E. A. acknowledges support from the ETH Zurich Postdoctoral Fellowship Program and from the Marie Curie Actions for People COFUND Program. R. D. A. and E. A. acknowledges support from DOE—Basic Energy Sciences under Grant No. DE-FG02-09ER46643. S. J. Y. and H.-T. K. acknowledge support from the MIT project at ETRI. I. K. S., S. W., J. G. R. and K. W. acknowledge support from AFOSR under Grant No. FA9550-12-1-0381. One of us (I.K.S.) acknowledges support from the Vannevar Bush Faculty Fellowship program sponsored by the Basic Research Office of the Assistant Secretary of Defense for Research and Engineering and funded by the Office of Naval Research through grant N00014-15-1-2848. J. G. R. kindly acknowledges support from FAPA program through Facultad de Ciencias and Vicerrectoria de Investigaciones of Universidad de los Andes, Bogotá, Colombia, and Colciencias No. 120471250659.
References
- Hashimoto et al. (2014) M. Hashimoto, E. A. Nowadnick, R.-H. He, I. M. Vishik, B. Moritz, Y. He, K. Tanaka, R. G. Moore, D. Lu, Y. Yoshida, M. Ishikado, T. Sasagawa, K. Fujita, S. Ishida, S. Uchida, H. Eisaki, Z. Hussain, T. P. Devereaux, and Z.-X. Shen, Nature Materials 14, 37 (2014).
- Jin et al. (1994) S. Jin, T. H. Tiefel, M. McCormack, R. A. Fastnacht, R. Ramesh, and L. H. Chen, Science 264, 413 (1994).
- Kubacka et al. (2014) T. Kubacka, J. A. Johnson, M. C. Hoffmann, C. Vicario, S. de Jong, P. Beaud, S. Grübel, S.-W. Huang, L. Huber, L. Patthey, Y.-D. Chuang, J. J. Turner, G. L. Dakovski, W.-S. Lee, M. P. Minitti, W. Schlotter, R. G. Moore, C. P. Hauri, S. M. Koohpayeh, V. Scagnoli, G. Ingold, S. L. Johnson, and U. Staub, Science 343, 1333 (2014).
- Wang et al. (2013) Y. H. Wang, H. Steinberg, P. Jarillo-Herrero, and N. Gedik, Science 342, 453 (2013).
- Averitt and Taylor (2002) R. D. Averitt and A. J. Taylor, Journal of Physics: Condensed Matter 14, R1357 (2002).
- Orenstein (2012) J. Orenstein, Physics Today 65, 44 (2012).
- Misochko et al. (1998) O. V. Misochko, M. Tani, K. Sakai, K. Kisoda, S. Nakashima, V. N. Andreev, and F. A. Chudnovsky, Physical Review B 58, 12789 (1998).
- Mansart et al. (2010) B. Mansart, D. Boschetto, S. Sauvage, A. Rousse, and M. Marsi, Europhysics Letters 92, 6 (2010).
- Liu et al. (2011) M. K. Liu, B. Pardo, J. Zhang, M. M. Qazilbash, S. J. Yun, Z. Fei, J. H. Shin, H.-T. Kim, D. N. Basov, and R. D. Averitt, Physical Review Letters 107, 066403 (2011).
- Rodolakis et al. (2010) F. Rodolakis, P. Hansmann, J. P. Rueff, A. Toschi, M. W. Haverkort, G. Sangiovanni, A. Tanaka, T. Saha-Dasgupta, O. K. Andersen, K. Held, M. Sikora, I. Alliot, J. P. Itié, F. Baudelet, P. Wzietek, P. Metcalf, and M. Marsi, Physical Review Letters 104, 047401 (2010).
- Cavalleri et al. (2001) A. Cavalleri, C. Tóth, C. W. Siders, J. A. Squier, F. Ráksi, P. Forget, and J. C. Kieffer, Physical Review Letters 87, 237401 (2001).
- Huber et al. (2016) M. A. Huber, M. Plankl, M. Eisele, R. E. Marvel, F. Sandner, T. Korn, C. Schüller, J. R. F. Haglund, R. Huber, and T. L. Cocker, Nano Letters 16, 1421 (2016).
- O’Callahan et al. (2015) B. T. O’Callahan, A. C. Jones, J. Hyung Park, D. H. Cobden, J. M. Atkin, and M. B. Raschke, Nature Communications 6, 6849 (2015).
- Lantz et al. (2017) G. Lantz, B. Mansart, D. Grieger, D. Boschetto, N. Nilforoushan, E. Papalazarou, N. Moisan, L. Perfetti, V. L. R. Jacques, D. L. Bolloc’h, C. Laulhé, S. Ravy, J. P. Rueff, T. E. Glover, M. P. Hertlein, Z. Hussain, S. Song, M. Chollet, M. Fabrizio, and M. Marsi, Nature Communications 8, 13917 (2017).
- Pashkin et al. (2011) A. Pashkin, C. Kübler, H. Ehrke, R. Lopez, A. Halabica, R. F. Haglund, R. Huber, and A. Leitenstorfer, Physical Review B 83, 195120 (2011).
- Wegkamp et al. (2014) D. Wegkamp, M. Herzog, L. Xian, M. Gatti, P. Cudazzo, C. L. McGahan, R. E. Marvel, R. F. Haglund, A. Rubio, M. Wolf, and J. Stähler, Physical Review Letters 113, 216401 (2014).
- Gray et al. (2016) A. X. Gray, J. Jeong, N. P. Aetukuri, P. Granitzka, Z. Chen, R. Kukreja, D. Higley, T. Chase, A. H. Reid, H. Ohldag, M. A. Marcus, A. Scholl, A. T. Young, A. Doran, C. A. Jenkins, P. Shafer, E. Arenholz, M. G. Samant, S. S. P. Parkin, and H. A. Dürr, Physical Review Letters 116, 116403 (2016).
- Morin (1959) F. J. Morin, Physical Review Letters 3, 34 (1959).
- McWhan et al. (1969) D. B. McWhan, T. Rice, and J. P. Remeika, Physical Review Letters 23, 1384 (1969).
- McWhan et al. (1971) D. B. McWhan, J. P. Remeika, T. M. Rice, W. F. Brinkman, J. P. Maita, and A. Menth, Physical Review Letters 27, 941 (1971).
- Baum et al. (2007) P. Baum, D.-S. Yang, and A. H. Zewail, Science 318, 788 (2007).
- Qazilbash et al. (2008) M. M. Qazilbash, A. A. Schafgans, K. S. Burch, S. J. Yun, B. G. Chae, B. J. Kim, H.-T. Kim, and D. N. Basov, Physical Review B 77, 115121 (2008).
- Pfalzer et al. (2006) P. Pfalzer, G. Obermeier, M. Klemm, S. Horn, and M. L. DenBoer, Physical Review B 73, 144106 (2006).
- Limelette et al. (2003) P. Limelette, A. Georges, D. Jérome, P. Wzietek, P. Metcalf, and J. M. Honig, Science 302, 89 (2003).
- Maurer et al. (1999) D. Maurer, A. Leue, R. Heichele, and V. Müller, Physical Review B 60, 13249 (1999).
- Baldassarre et al. (2008) L. Baldassarre, A. Perucchi, D. Nicoletti, A. Toschi, G. Sangiovanni, K. Held, M. Capone, M. Ortolani, L. Malavasi, M. Marsi, P. Metcalf, P. Postorino, and S. Lupi, Physical Review B 77, 113107 (2008).
- Budai et al. (2014) J. D. Budai, J. Hong, M. E. Manley, E. D. Specht, C. W. Li, J. Z. Tischler, D. L. Abernathy, A. H. Said, B. M. Leu, L. A. Boatner, R. J. Mcqueeney, and O. Delaire, Nature 515, 535 (2014).
- Tao et al. (2012) Z. Tao, T.-R. T. Han, S. D. Mahanti, P. M. Duxbury, F. Yuan, C.-Y. Ruan, K. Wang, and J. Wu, Physical Review Letters 109, 166406 (2012).
- Morrison et al. (2014) V. R. Morrison, R. P. Chatelain, K. L. Tiwari, A. Hendaoui, A. Bruháes, M. Chaker, and B. J. Siwick, Science 346, 445 (2014).
- Ramírez et al. (2015) J. G. Ramírez, T. Saerbeck, S. Wang, J. Trastoy, M. Malnou, J. Lesueur, J.-P. Crocombette, J. E. Villegas, and I. K. Schuller, Physical Review B 91, 205123 (2015).
- Marezio et al. (1972) M. Marezio, D. B. McWhan, J. P. Remeika, and P. D. Dernier, Physical Review B 5, 2541 (1972).
- (32) See Supplemental Material at ?
- Hilton et al. (2007a) D. J. Hilton, R. P. Prasankumar, S. Fourmaux, A. Cavalleri, D. Brassard, M. A. El Khakani, J. C. Kieffer, A. J. Taylor, and R. D. Averitt, Physical Review Letters 99, 226401 (2007a).
- Lysenko et al. (2010) S. Lysenko, V. Vikhnin, A. Rúa, F. Fernández, and H. Liu, Physical Review B 82, 205425 (2010).
- McWhan and Remeika (1970) D. B. McWhan and J. P. Remeika, Physical Review B 2, 3734 (1970).
- Ge et al. (2014) S. Ge, X. Liu, X. Qiao, Q. Wang, Z. Xu, J. Qiu, P.-H. Tan, J. Zhao, and D. Sun, Scientific Reports 4, 5722 (2014).
- Thomsen et al. (1984) C. Thomsen, J. Strait, Z. Vardeny, H. J. Maris, J. Tauc, and J. J. Hauser, Physical Review Letters 53, 989 (1984).
- Thomsen et al. (1986) C. Thomsen, H. T. Grahn, H. J. Maris, and J. Tauc, Physical Review B 34, 4129 (1986).
- West et al. (2008) K. G. West, J. Lu, J. Yu, D. Kirkwood, W. Chen, Y. Pei, J. Claassen, and S. A. Wolf, Journal of Vacuum Science & Technology A 26, 133 (2008).
- Yun et al. (2009) S. J. Yun, J. W. Lim, J. S. Noh, B. J. Kim, and H. T. Kim, Japanese Journal of Applied Physics 48, 04C139 (2009).
- Kittiwatanakul (2014) S. Kittiwatanakul, Study of metal-insulator transition in strongly correlated vanadium dioxide thin films, Ph.D. thesis (2014), section 2.3.2.
- Qazilbash et al. (2006) M. M. Qazilbash, K. S. Burch, D. Whisler, D. Shrekenhamer, B. G. Chae, H.-T. Kim, and D. N. Basov, Physical Review B 74, 205118 (2006).
- Basov et al. (2011) D. N. Basov, R. D. Averitt, D. Van Der Marel, M. Dressel, and K. Haule, Reviews of Modern Physics 83, 471 (2011).
- Stewart et al. (2012) M. K. Stewart, D. Brownstead, S. Wang, K. G. West, J. G. Ramírez, M. M. Qazilbash, N. B. Perkins, I. K. Schuller, and D. N. Basov, Physical Review B 85, 205113 (2012).
- Abreu et al. (2015) E. Abreu, S. Wang, J. G. Ramírez, M. Liu, J. Zhang, K. Geng, I. K. Schuller, and R. D. Averitt, Physical Review B 92, 085130 (2015).
- Hilton et al. (2007b) D. J. Hilton, R. P. Prasankumar, S. Fourmaux, A. Cavalleri, D. Brassard, M. A. El Khakani, J. C. Kieffer, A. J. Taylor, and R. D. Averitt, Physical Review Letters 99, 226401 (2007b).
- Liu et al. (2013) M. K. Liu, M. Wagner, E. Abreu, S. Kittiwatanakul, A. McLeod, Z. Fei, M. Goldflam, S. Dai, M. M. Fogler, J. Lu, S. A. Wolf, R. D. Averitt, and D. N. Basov, Physical Review Letters 111, 096602 (2013).
- Dönges et al. (2016) S. A. Dönges, O. Khatib, B. T. O’Callahan, J. M. Atkin, J. H. Park, D. Cobden, and M. B. Raschke, Nano Letters 16, 3029 (2016).
- Seikh et al. (2006) M. M. Seikh, C. Narayana, A. K. Sood, P. Murugavel, M. W. Kim, P. A. Metcalf, J. M. Honig, and C. N. R. Rao, Solid State Communications 138, 466 (2006).
- Kucharczyk and Niklewski (1979) D. Kucharczyk and T. Niklewski, Journal of Applied Crystallography 12, 370 (1979).
- Dernier and Marezio (1970) P. D. Dernier and M. Marezio, Physical Review B 2, 3771 (1970).
- Yelon and Keem (1979) W. B. Yelon and J. E. Keem, Solid State Communications 29, 775 (1979).
- Liu et al. (2015) M. Liu, A. J. Sternbach, M. Wagner, T. V. Slusar, T. Kong, S. L. Bud’ko, S. Kittiwatanakul, M. M. Qazilbash, A. McLeod, Z. Fei, E. Abreu, J. Zhang, M. Goldflam, S. Dai, G.-X. Ni, J. Lu, H. A. Bechtel, M. C. Martin, M. B. Raschke, R. D. Averitt, S. A. Wolf, H.-T. Kim, P. C. Canfield, and D. N. Basov, Physical Review B 91, 245155 (2015).
- Goodenough (1971) J. B. Goodenough, Journal of Solid State Chemistry 3, 490 (1971).
- Wu et al. (2006) J. Wu, Q. Gu, B. S. Guiton, N. P. D. Leon, L. Ouyang, and H. Park, Nano Letters 6, 2313 (2006).
- Park et al. (2013) J. H. Park, J. M. Coy, T. S. Kasirga, C. Huang, Z. Fei, S. Hunter, and D. H. Cobden, Nature 400, 431 (2013).
- Kittiwatanakul et al. (2014) S. Kittiwatanakul, S. A. Wolf, and J. Lu, Applied Physics Letters 105, 073112 (2014).
- Keer et al. (1976) H. Keer, D. Dickerson, H. Kuwamoto, H. Barros, and J. Honig, Journal of Solid State Chemistry 19, 95 (1976).
- Chandrashekhar et al. (1973) G. Chandrashekhar, H. Barros, and J. Honig, Materials Research Bulletin 8, 369 (1973).
- Liu et al. (2012) M. Liu, H. Y. Hwang, H. Tao, A. C. Strikwerda, K. Fan, G. R. Keiser, A. J. Sternbach, K. G. West, S. Kittiwatanakul, J. Lu, S. A. Wolf, F. G. Omenetto, X. Zhang, K. A. Nelson, and R. D. Averitt, Nature 487, 345 (2012).
See pages - of VO2V2O3SuppMat.pdf