Clustering in vibrated monolayers of granular rods
Abstract
We investigate the ordering properties of vertically-vibrated monolayers of granular cylinders in a circular container at high packing fraction. In line with previous works by other groups, we identify liquid-crystalline ordering behaviour similar to that of two-dimensional hard rectangular particles subject to thermal equilibrium fluctuations. However, due to dissipation, there is a much stronger tendency for particles to cluster into parallel arrangements in the granular system. These clusters behave as a polydisperse mixture of long life-time ‘superparticles’, and some aspects of the system behaviour can be understood by applying mean-field theories for equilibrium hard rectangles, based on two-body correlations, to these ‘superparticles’. Many other features of the granular system are different: (i) For small particle length-to-breadth ratio , we identify tetratic ordering at moderate packing fractions and smectic fluctuations at higher packing fractions, with no sharp transition between the two states. Both types of ordering can be explained in terms of clustering. (ii) For large , strong clustering precludes the stabilisation of a uniaxial nematic state, and the system exhibits a mixture of randomly-oriented clusters which, as packing fraction is increased, develops into states with smectic fluctuations, again through a diffuse transition. (iii) Vorticity excitations of the velocity field compete with smectic ordering, causing dynamic fluctuations and the absence of steady states at high densities; the tetratic state, by contrast, is very stiff against vorticity, and long-standing steady states, spatially and orientationally homogeneous except for four symmetrical defects located close to the wall, can be observed.
I Introduction
Thermal systems of particles driven by exclusion forces are governed solely by entropy and show interesting behaviours review . Hard spheres and discs crystallise at high packing fraction , while dense systems of anisometric particles can also form oriented fluid phases (nematics) when the particle aspect (length-to-breadth) ratio is larger than a critical value Frenkel . In the uniaxial nematic phase the long axes of the particles tend to orient parallel to each other and a globally oriented direction (the director) results. When is low, two-dimensional particles of rectangular shape form instead a different nematic phase, the tetratic phase schlacken , an exotic biaxial phase with two (instead of one) perpendicular, equivalent directors. The stability of the tetratic phase stems from the particularly favourable perpendicular arrangements of particles with sharp corners. For high particles form phases with partial (and eventually full) spatial order, although the exact phase diagram of, in particular, hard rectangular particles, and the dependence with aspect ratio, has not been studied in detail.
Horizontally vibrated monolayers of granular, dissipative particles have been shown to exhibit patterns that resemble those of thermal equilibrium systems hindues2 ; hindues1 ; hindues ; Aranson ; galanis1 ; galanis2 ; daniel . Granular rods of various shapes show liquid-crystal arrangements at high . In one recent experiment daniel , the transition from a fully disordered (isotropic) phase to the uniaxial nematic or tetratic phase has been characterised from the behaviour of standard order parameters obtained from adequate averages of particle orientation distributions. Depending on the aspect ratio, the isotropic was shown to order into a tetratic (low ) or uniaxial nematic (high ) phase as was increased. The critical aspect ratio that separates the two ordered phases was estimated to be . This is much higher than the value predicted by mean-field theories ( or , depending on whether three-particle correlations are neglected or not SPT ; 3body ), but close to the results from equilibrium computer simulations daniel . However, the value of packing fraction at the isotropic-uniaxial nematic transition in the granular system shows qualitatively significant deviations with respect to the equilibrium (either mean theory or simulation) calculations, indicating the existence of genuine non-equilibrium effects associated with dissipation. Clearly, in this system entropic or exclusion interactions are strongly coupled to dissipation induced by friction and inelastic collisions, and it remains to be seen to what extent entropy-driven and packing effects compete with hydrodynamic granular flow and dissipation to produce the observed ordered patterns. At least for hard spheres, there seem to exist some regimes where mean-field theories and computer simulations for equilibrium thermal hard particles (i.e. methods based on entropy maximisation) are useful in discussing results from granular systems. For example, radial distribution functions of dense systems of granular spheres and discs are quantitatively similar to the corresponding equilibrium systems gdr , but granular discs show a more complex phase behaviour and a strong phase dependence with respect to the shaking frequency and amplitude Urbach . Phase ordering of granular anisometric particles may also be strongly affected by the manner in which energy is injected into the system and dissipated.
In this paper we report on experiments using vibrated monolayer of granular cylindrical particles, which project on the horizontal plate approximately as hard rectangles. Our aim is to assess to what extent the ordered liquid-crystalline patterns predicted for thermal hard rectangles in equilibrium can be observed in the granular experiments. In doing so, we have found a strong dependence on particle aspect ratio of the liquid-crystalline patterns observed, as previously obtained daniel . We have found that the tendency for clustering of particles is very strong, and that these effects help explain most of the phenomenology observed, in particular, some of the differences with respect to equilibrium systems. Thus far, clusters and clustering effects in general have not been carefully analysed in experiments on dense packings of vibrated granular rods. We argue that clustering gives a useful picture to explain the different high-density configurations with respect to aspect ratio. Dense collections of dissipative rectangular particles exhibit a strong tendency to lie parallel to each other, and clusters of approximately parallel particles are formed easily. These clusters are very stable, and in many respect behave as single units, which we call ‘superparticles’. The clustering tendency is much stronger than in fluids of equilibrium thermal rods, as demonstrated by comparison with equilibrium Monte Carlo simulations on thermal particles. In the vibration experiments, particles of low aspect ratio, , are seen to form clusters with square or close-to-square shape quite easily, and these superparticles of still lower effective aspect ratio may orient parallel or perpendicular in relatively efficient packing configurations; bulk tetratic ordering, and smectic at even higher packing fractions, may result. However, for long rods, , large clusters involve many particles and tend to bend, so that superparticles cannot pack into tetratic or uniaxial nematic configurations: randomly oriented arrangements of large clusters or ‘patches’ are preferred, which at high density also exhibit smectic fluctuations. In addition, this granular system features the usual non-equilibrium properties of vibrated monolayers: strong dependence with excitation parameters, formation of cavities and large density fluctuations, hydrodynamic flow competing with ordering, etc. In particular, we do not observe sharp transitions between states with different ordering properties, a result which is at variance with those of Ref. daniel . However, the experiments may not necessarily be in contradiction, given that the experimental conditions of both experiments are not identical and, in addition, different protocols to calculate the order parameters could have been used. Another distinct feature of our experiment is that, in the high-density regime, there is an absence of well-defined steady states, which we explain as a competition between smectic ordering effects due to packing and disordering effects due to excitation of hydrodynamic modes. Finally, an intriguing result is that, as observed in Ref. daniel , – is a critical aspect ratio separating two types of orientational ordering, similar to equilibrium. But clustering effects and the associated formation of superparticles renormalise this value to , a value very close to that predicted by equilibrium mean-field theories. We suggest that clustering renormalises the range of interactions, which are reduced to the mean-field, two-particle level.
In Section II details on the experiment and the parameters used are given. Section III presents the results from the cluster analysis, the order parameters and the angular distribution functions, both for rectangles and for superparticles. Section IV presents a discussion and our interpretation of the results, and also contains some concluding remarks. An explanation on the analysis tools are relegated to the Appendix.
II Experiment and analysis
Our experiment uses nonmagnetic steel cylinders of length and breadth mm. Plastic cylinders were also studied in one case for comparison plastic . The packing fraction is calculated as , where is the number of cylinders and the area of the circular cavity. The vibration experiment is standard: particles are inside a cylindrical container, consisting of a thin horizontal cylindrical cavity made of aluminium, with a diameter of 14 cm. An upper plastic lid limits the free motion of cylinders in the vertical direction, which is , so that particles cannot overlap in the plane of the plate. Vertical vibration is induced by an electromagnetic shaker which generates a sine-wave vertical motion of frequency and amplitude . The value of frequency is set to Hz. Effective accelerations in the range are used. Results are observed to be rather sensitive to the frequency, but so much to the value of . Some frequencies tend to promote the formation of cavities, i.e. persistent regions with very few particles hindues , even in the high-packing-fraction regime. We have tried to avoid these states, as well as the dilute regime, by always choosing .
To analyse the experiments we use standard procedures. All measured quantities are obtained from the projected coordinates of the cylinders on the plate, , and from the projected orientations of the long particle axis of each particle. These are obtained by using the ImageJ software imageJ . Typically 98% of particles are successfully identified. Particle velocities are calculated by identifying particle positions in two consecutive frames, separated by 0.3 s, and using a simple finite-difference approximation. Success in the identification of particle trajectories decreases from 98% for to 85% (at worst) for ; the latter case, however, involves a larger number of particles, so that statistical errors are not significantly altered. Calculation of velocities allows for the computation of a local granular temperature (see Sec. III). The orientational and positional orders in the cell are quantified by the local and global uniaxial nematic, , tetratic, , and smectic, , order parameters. The nematic and tetratic order parameters were obtained through the orientational distribution , and also through properly defined order tensors. Details on the definition and calculations of these parameters are given in the Appendix.
Finally, in order to study collective properties of the cylinders from a different perspective, we analysed clustering properties. This has not been done systematically in vibrated experiments on rods, but we have concluded that these properties are extremely useful. We define a cluster as a collection of cylinders that are approximately parallel and spatially close to each other. Our connectedness criterion imposes two conditions for two cylinders to be connected: (i) their projected long axes form an angle , and (ii) their projected geometric centres are at a distance (we should mention that, as usual in cluster analysis, results turn out not to depend qualitatively on the exact definition of the connectedness criterion). Once the connection matrix for the cylinders is established, a standard routine to identify the cluster distribution is used to obtain the average number of clusters of a given size , where is the number of cylinders making up the cluster.
III Results
In this section we present results for the different quantities defined in the previous section. In all the experiments particles were initially placed in the container by hand, trying to achieve a random initial arrangement.
III.1 Clustering
We start by looking at the particle distribution from the point of view of cluster formation. Clustering effects play an important role in dense packings of dissipative rectangular particles. Clustering is known to enhance the tendency for tetratic ordering in dense packings of particles with low at thermal equilibrium. Monte Carlo simulations on equilibrium rectangular rods demonstrated this clustering effect Granada . A theory based on stable, polydisperse clusters with a distribution decaying exponentially with size was shown to lead to good agreement with simulations of equally-sized rectangles PRE . It is therefore worthwhile to discuss the cluster statistics of our experiments.
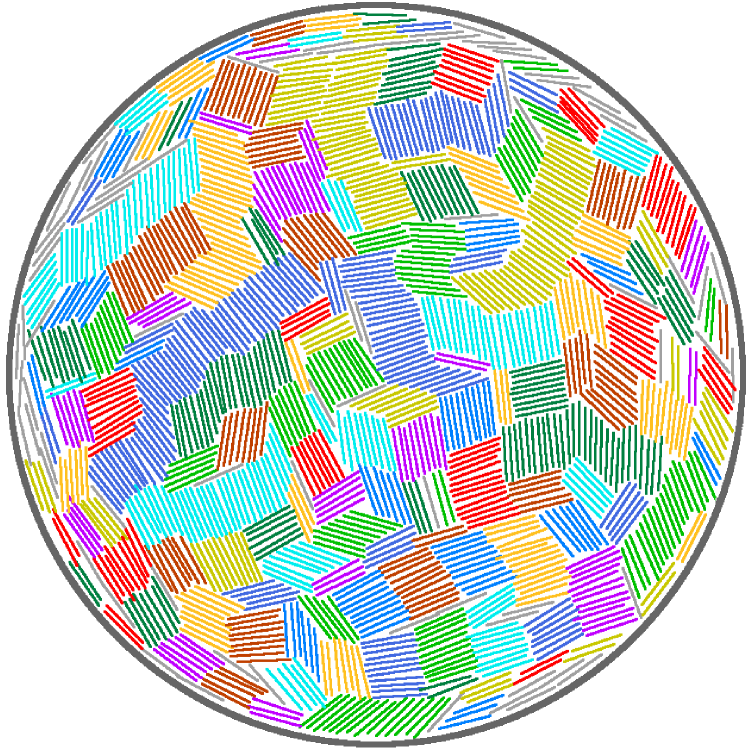
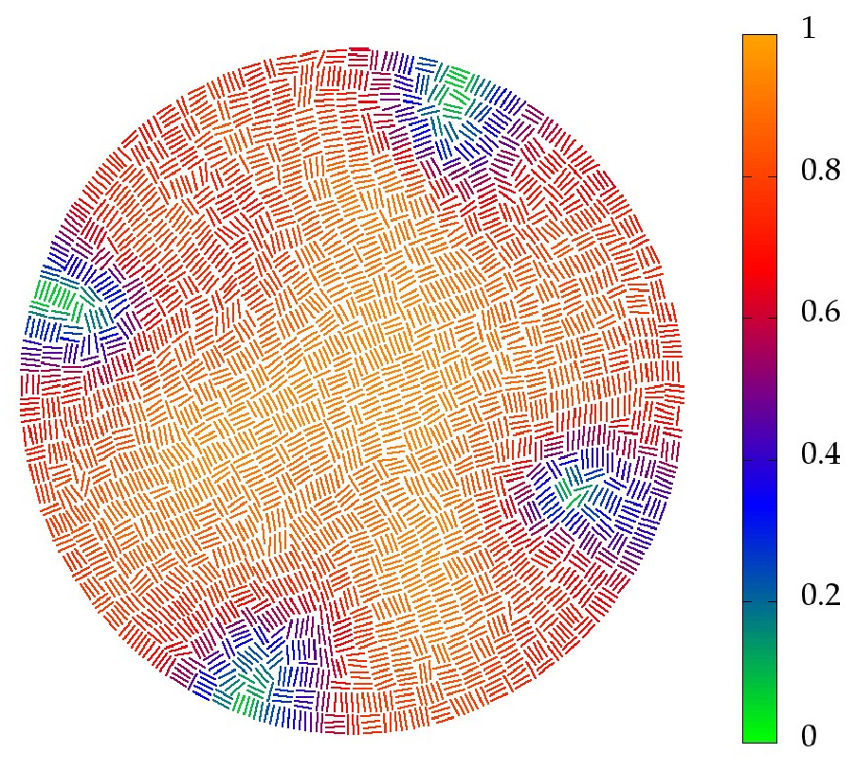
The formation of clusters is quite apparent in our dissipative vibrated system. Fig. 1 shows a picture of a typical configuration of a system with and . Particles belonging to the same cluster, as defined by the connectedness criterion mentioned in Section II, are drawn in the same colour. Well-packed clusters are formed. The dynamics of a given cluster can be followed for a significant fraction of the total experimental time.
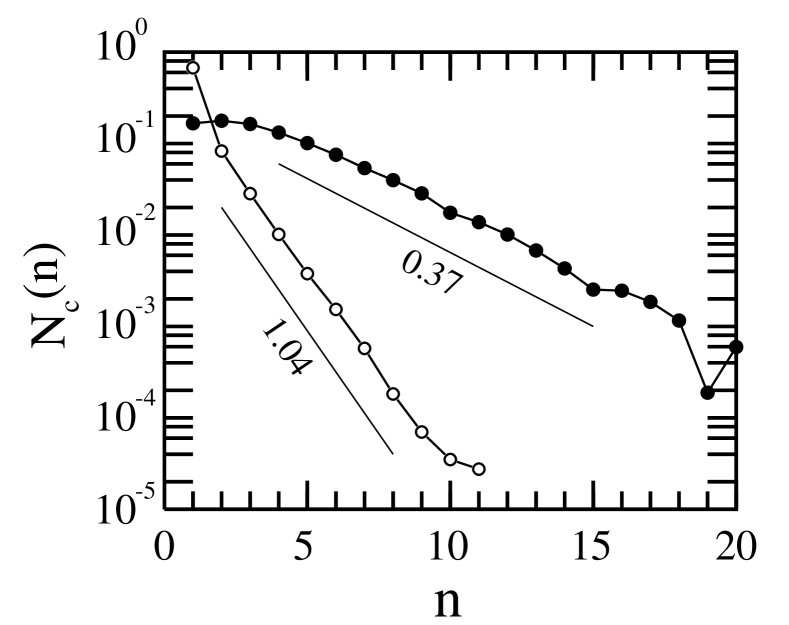
Fig. 2 shows the cluster distribution function from a real vibration experiment compared to an equivalent Monte Carlo simulation of hard rectangles in a circular cavity. The aspect ratio in both cases is , the packing fraction is set to and the number of particles was adjusted to be equal in both experiment and simulation. Although both distributions are close to exponential, , we can see that the cluster distribution of the granular system decays more slowly with cluster size (approximately a factor 3 in decay parameter), indicating the stronger tendency of the granular system to cluster than in the thermal equilibrium system.
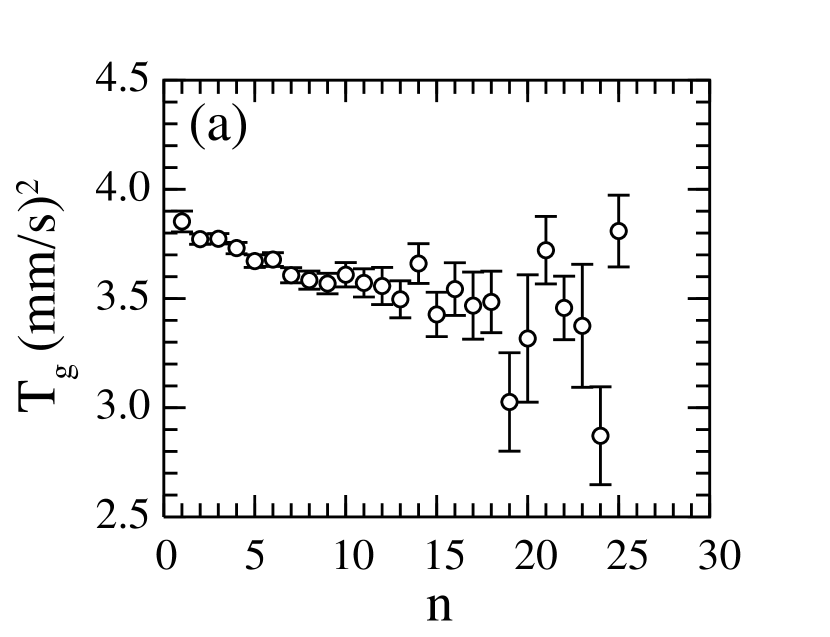
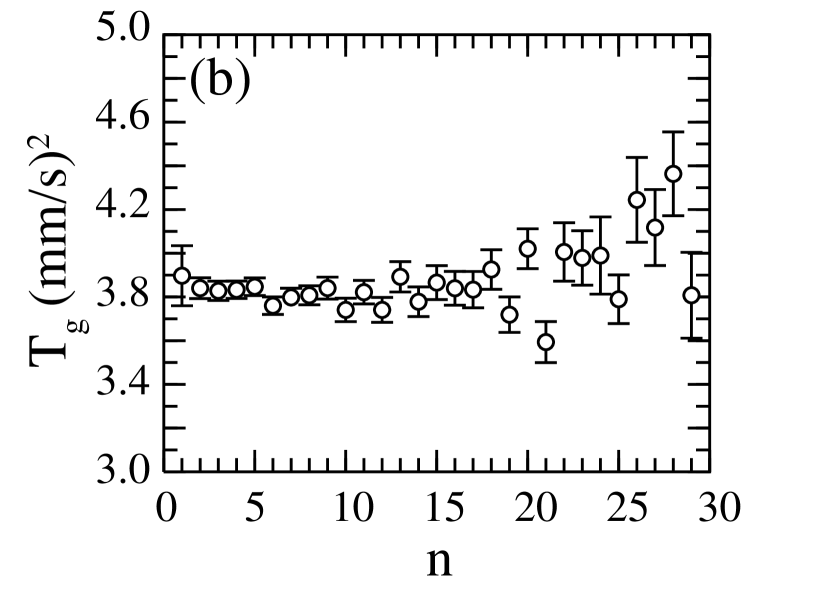
Clustering of dissipative particles stems from the locally cooling effect of inelastic particle collisions and the associated tendency of particles to align in highly dense packing configurations. Contrary to the equilibrium system, dissipation in the granular fluid can lead to local inhomogeneities of the granular temperature. Since particles organise into long-lived clusters, one could think that local inhomogeneities caused by the local cooling effect could give different granular temperatures for clusters of different sizes. We define the granular temperature for clusters of size from the mean square velocity of the particles in the cluster,
| (1) |
where is the velocity of a particle in the cluster, the local velocity of the cluster centre of mass, and is an average over clusters of size and over time. Fig. 3 shows the cluster granular temperature as a function of cluster size for two different conditions. Although we have observed that in of the experiments decreases with , as in panel (a), the effect is not robust, since in the remaining cases hardly changes with size, as in panel (b).
In Figs. 4(a-c) the cluster distribution for three different cases are plotted as a function of cluster size . The distributions are approximately exponential with a decay parameter that depends on aspect ratio and packing fraction. The exponential behaviour of was already observed in Monte Carlo simulations of thermally fluctuating hard rectangles PRE , and can be attributed to a mechanism for cluster formation where the probability of a particle joining (or leaving) a cluster is approximately independent of the cluster size frag1 .
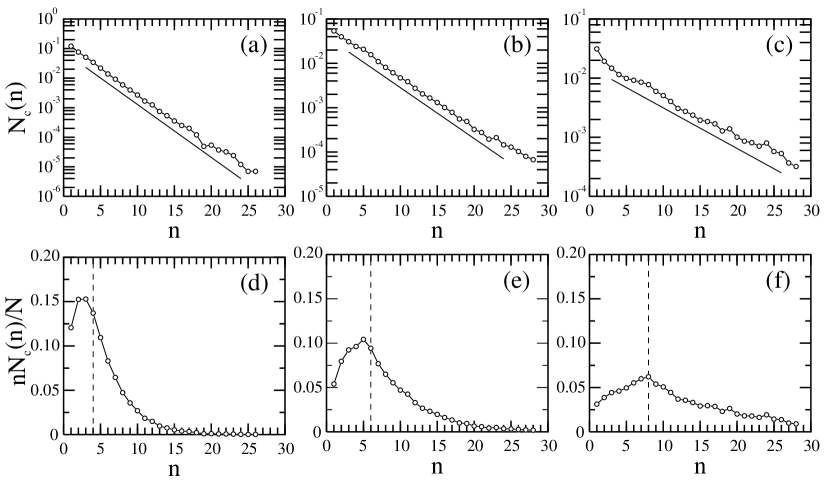
Figs. 4(d-f) show the distribution for the same cases as in panels (a-c). These distributions give the fraction of particles in the system that belong to a cluster of size . For reference, we have drawn in each case a vertical dashed line located at a cluster size equal to the corresponding aspect ratio. Note that the position of these lines are very close to the maximum of the corresponding distributions. This feature is general for , and means that particles have some preference to arrange into square clusters with size . The effect is not so clear for , see Fig. 5(a), although a change in behaviour clearly exists at . Our conclusion is that, for particles of low aspect ratio, the probability of a particle to be part of a cluster of size is maximum when , i.e. for close-to-square clusters. These clusters have a characteristic axis (along or perpendicular to the particle long axes, according to whether or , respectively) and seem to be particularly stable during the course of the experiment. Interaction between these clusters drives the formation of extended ordered patterns in the system, as will be seen below.
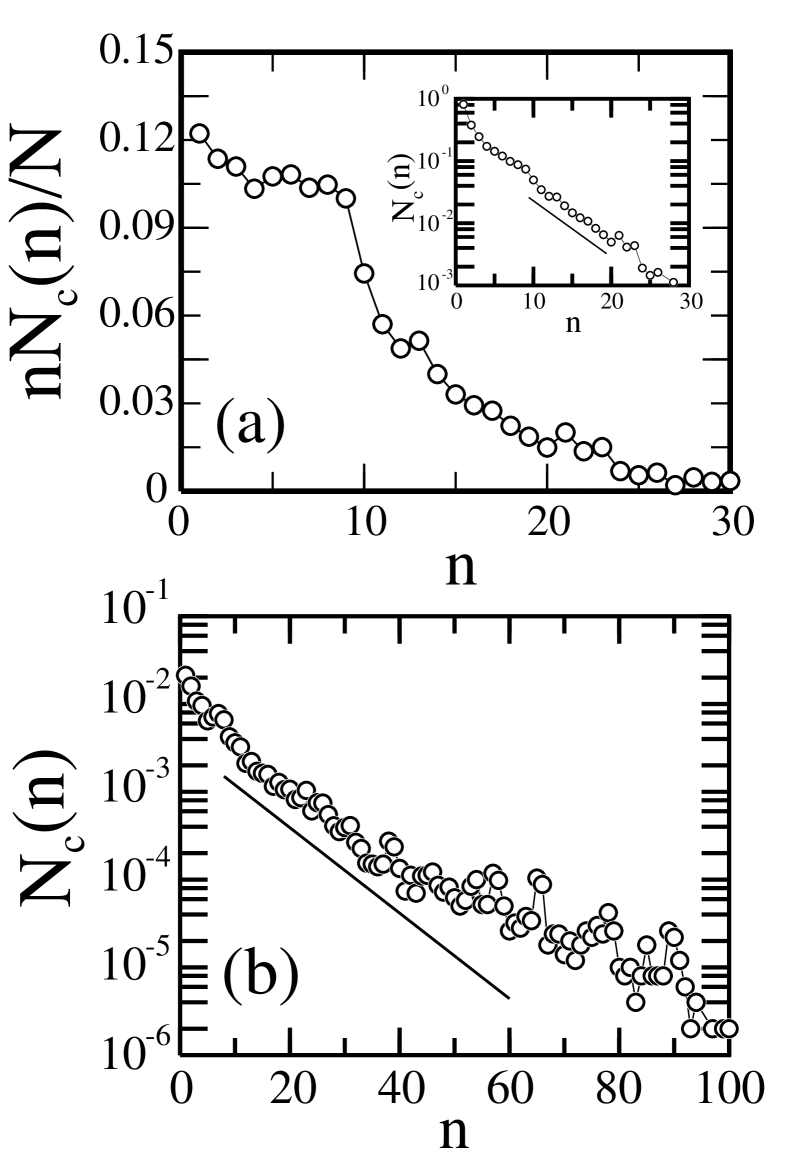
On closer inspection, some cluster distributions are seen to be more complex than a simple exponential. First, for sizes , the distribution is usually not exponential. Second, and more significant, is the fact that, as packing fraction is increased, the distributions develop a nonexponential tail at larger and larger values of . At high , they correspond to fat-tailed distributions, rather than to pure-exponential, indicating the existence of a marked process of cluster aggregation. An example is given in Fig. 5(b). This feature signals the formation of large ordered structures that will be analysed below.
III.2 Order parameters and dynamical evolution
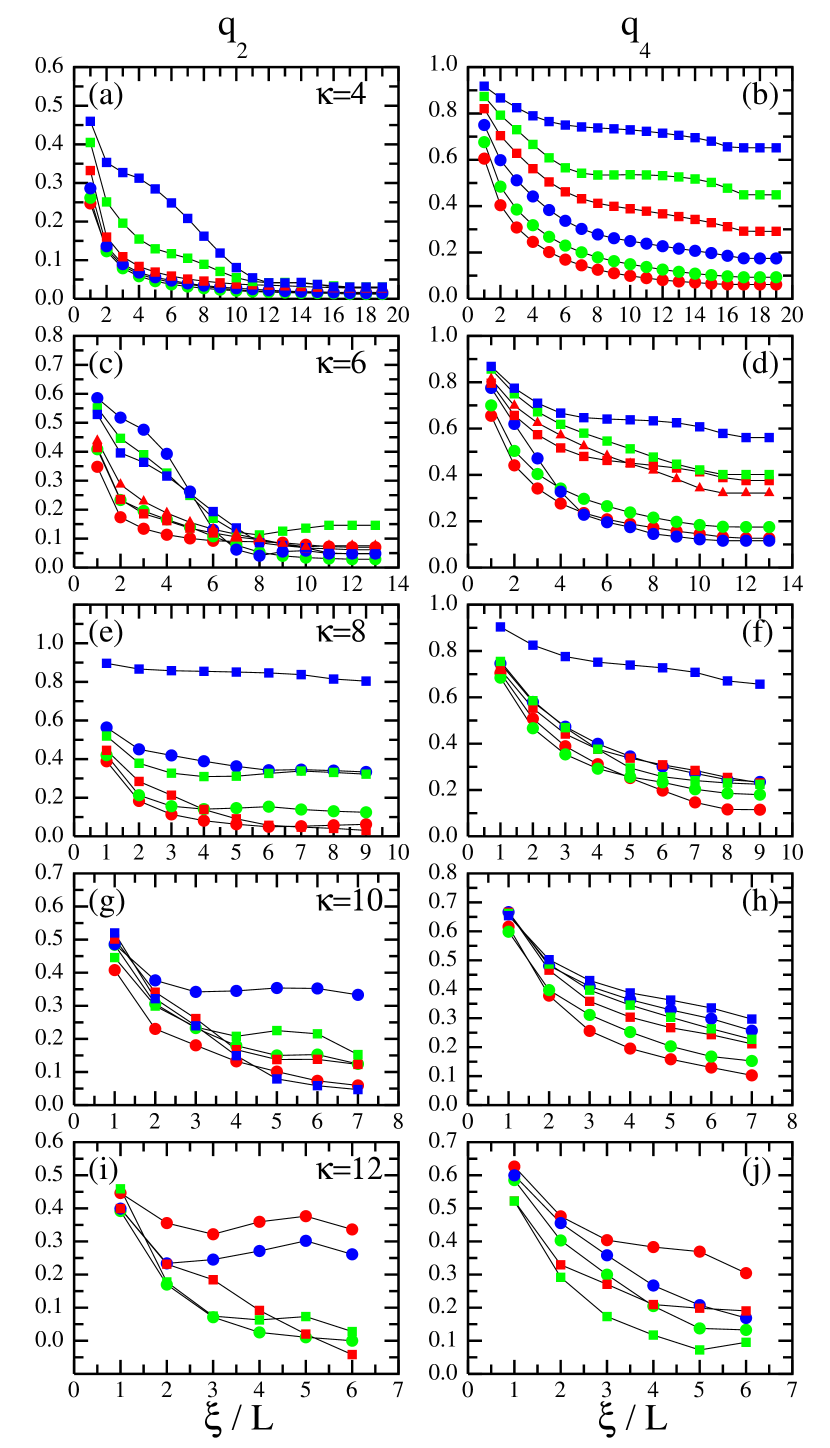
In this section we look at order parameters and angular distribution functions. These results are crucial to identify the type of ordering in the system daniel . Due to spatial and time fluctuations, the order parameters depend on both position and time, and proper local fields and have to be obtained from the particle positions. To obtain the fields at some point , we average over the particles located within a circular region of radius centred at . The values of depend on the radius ; one would expect these values to saturate for a size of the order of the coherence length or typical domain size. This is approximately the case, but it is not possible to establish a clearcut criterion. Fig. 6 shows the time-averaged values of the local parameters, as a function of , for all cases studied. In general the order parameters decrease with . From the figures, we have reached a compromise and in the following we set the values for the radius used to calculate the local order parameters to .
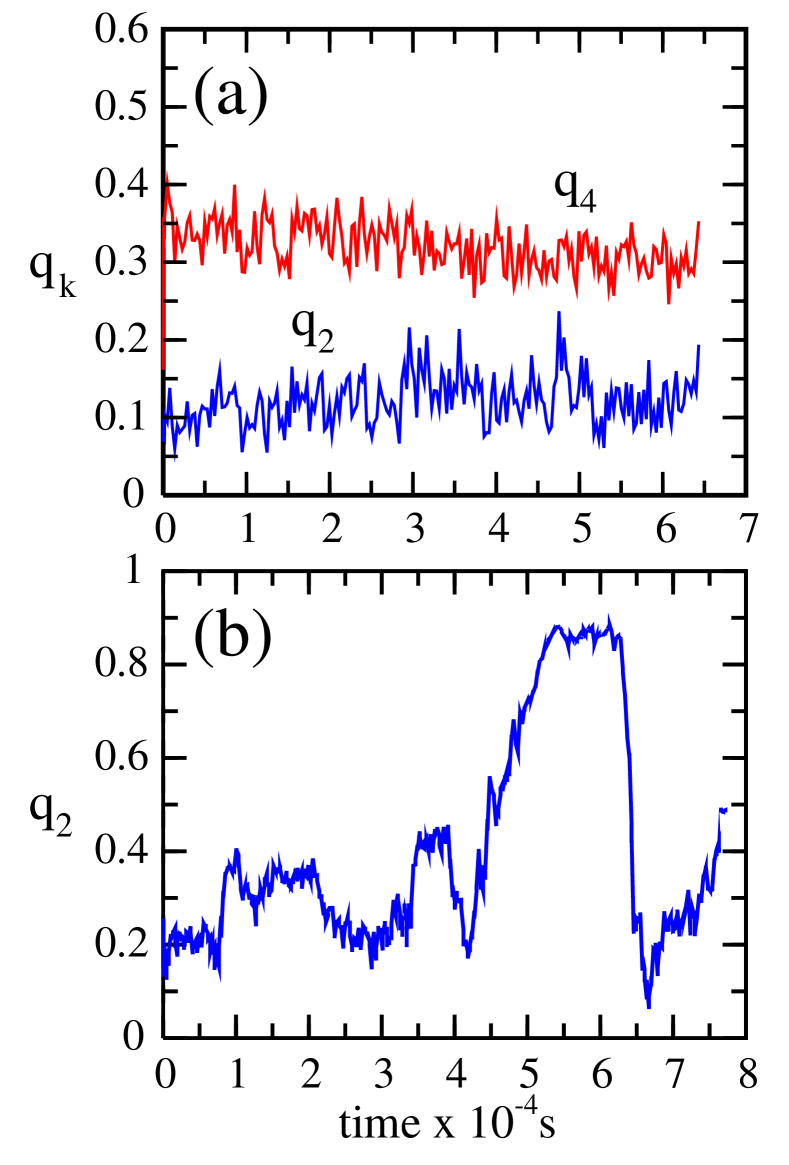
Let us now examine the time evolution of the order parameters. Fig. 7(a) shows the time evolution of the order parameters and for an experiment with and . After a short transient of approximately s, the order parameters level off at more or less constant values with large fluctuations about these values, of typically with respect to the mean. These steady-state values of the order parameters correspond to a well-developed and stable tetratic configuration. Note that a purely tetratic state would have , . In our case, where the number of particles is , we expect a non-zero value of due to the finite number of particles.
However, we have identified cases where order parameters fluctuate strongly, and a steady state does not seem to exist. These cases always correspond to high-density configurations, irrespective of the aspect ratio. An example is given in Fig. 7(b), where the time evolution of for the case and is shown. Orientational order builds up with time, but there seem to be abrupt events in the system which destroy order. We later argue that these situations are associated to the formation of smectic fluctuations at high density. Smectic domains are very sensitive to hydrodynamic shear modes, which are known to be excited in vibrated monolayers of rods Aranson . Note that the duration of the experiments in Figs. 7(a) and (b) was particularly long since the aim was to establish the existence of steady states in the system. With this information, the duration of the experiments to be reported in the following were adjusted according to the time evolution of the order parameters.
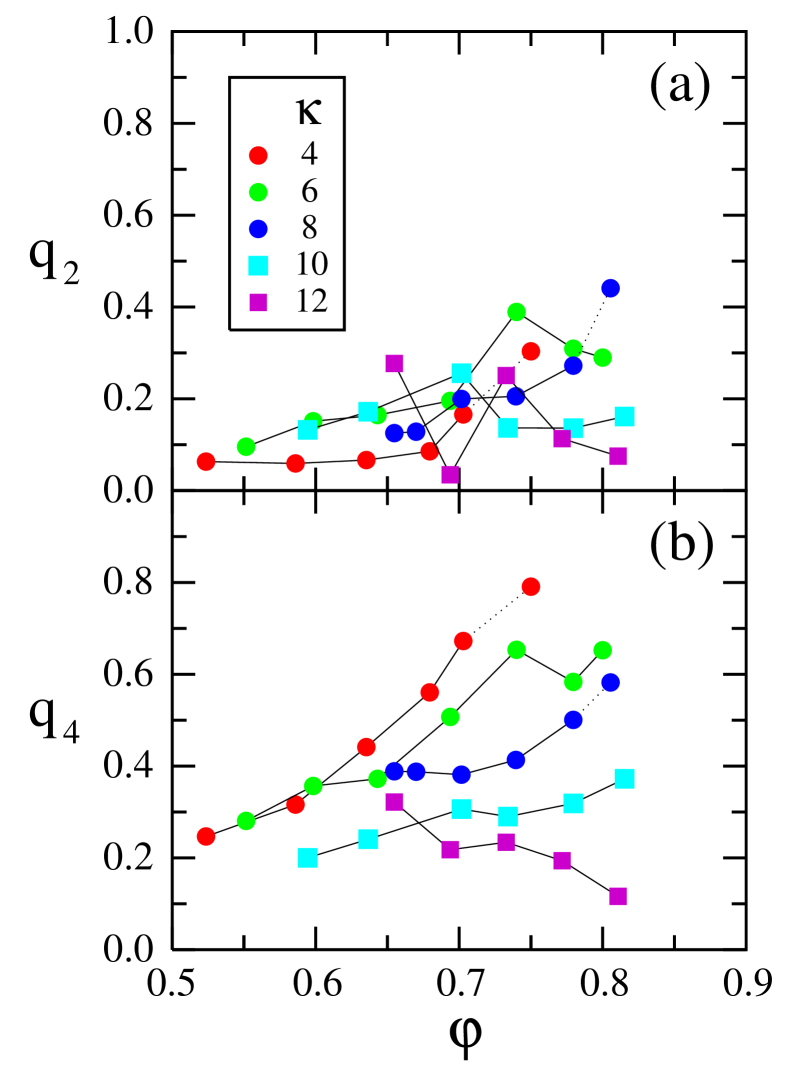
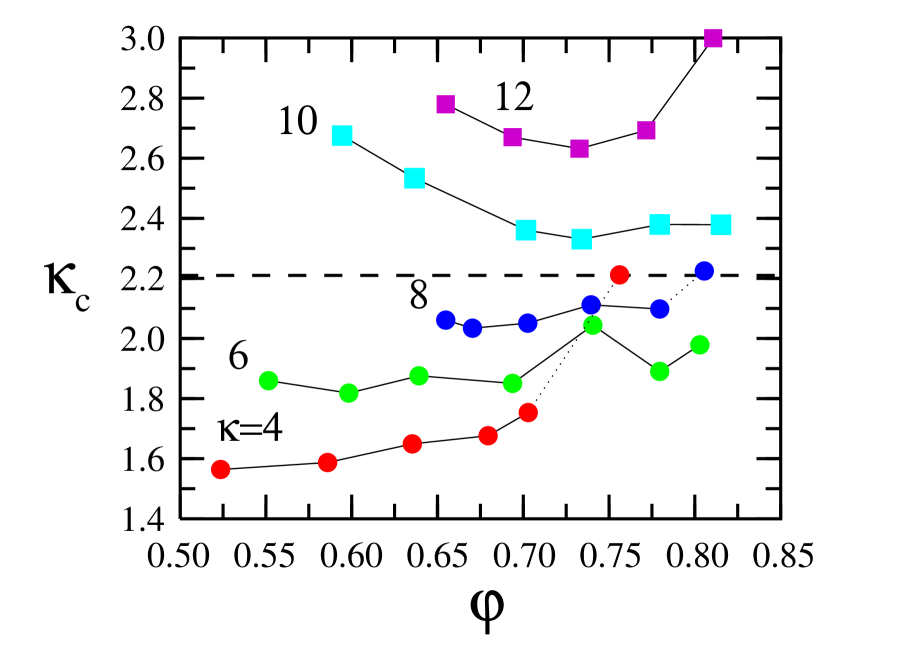
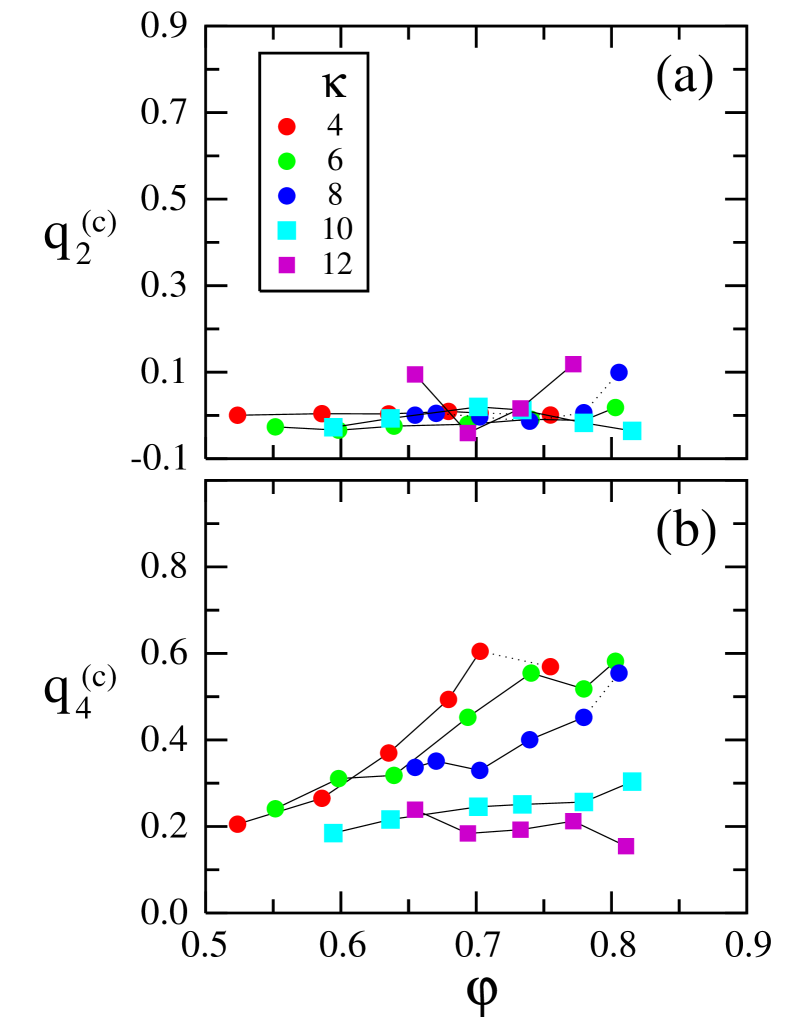
For intermediate values of , steady-state values for and can always be obtained. Fig. 8 collects the results for these order parameters from experiments with particles of different aspect ratios . We can identify two general trends: (i) the uniaxial order parameter is low (ii) the tetratic order parameter increases steadily with packing fraction for particles with and , while it remains constant for and , the case being a critical case. At even higher packing fractions the order parameter rises up to relatively high values; this is due to the appearance of smectic domains in the system. Smectic fluctuations will be covered in more detail later. Overall we can say that there are no sharp boundaries between the differently ordered states, and that large fluctuations or domains with one type of order may be found in samples with a predominance of a different type of order in large intervals of packing fraction. This observation is at variance with the findings in Ref. daniel , where a detailed ‘phase diagram’ including sharp ‘phase transitions’ was obtained. However, we must be cautious when emphasising the different results of the experiments, since different protocols to quantify the order may lead to different conclusions on the global ordering behaviour.
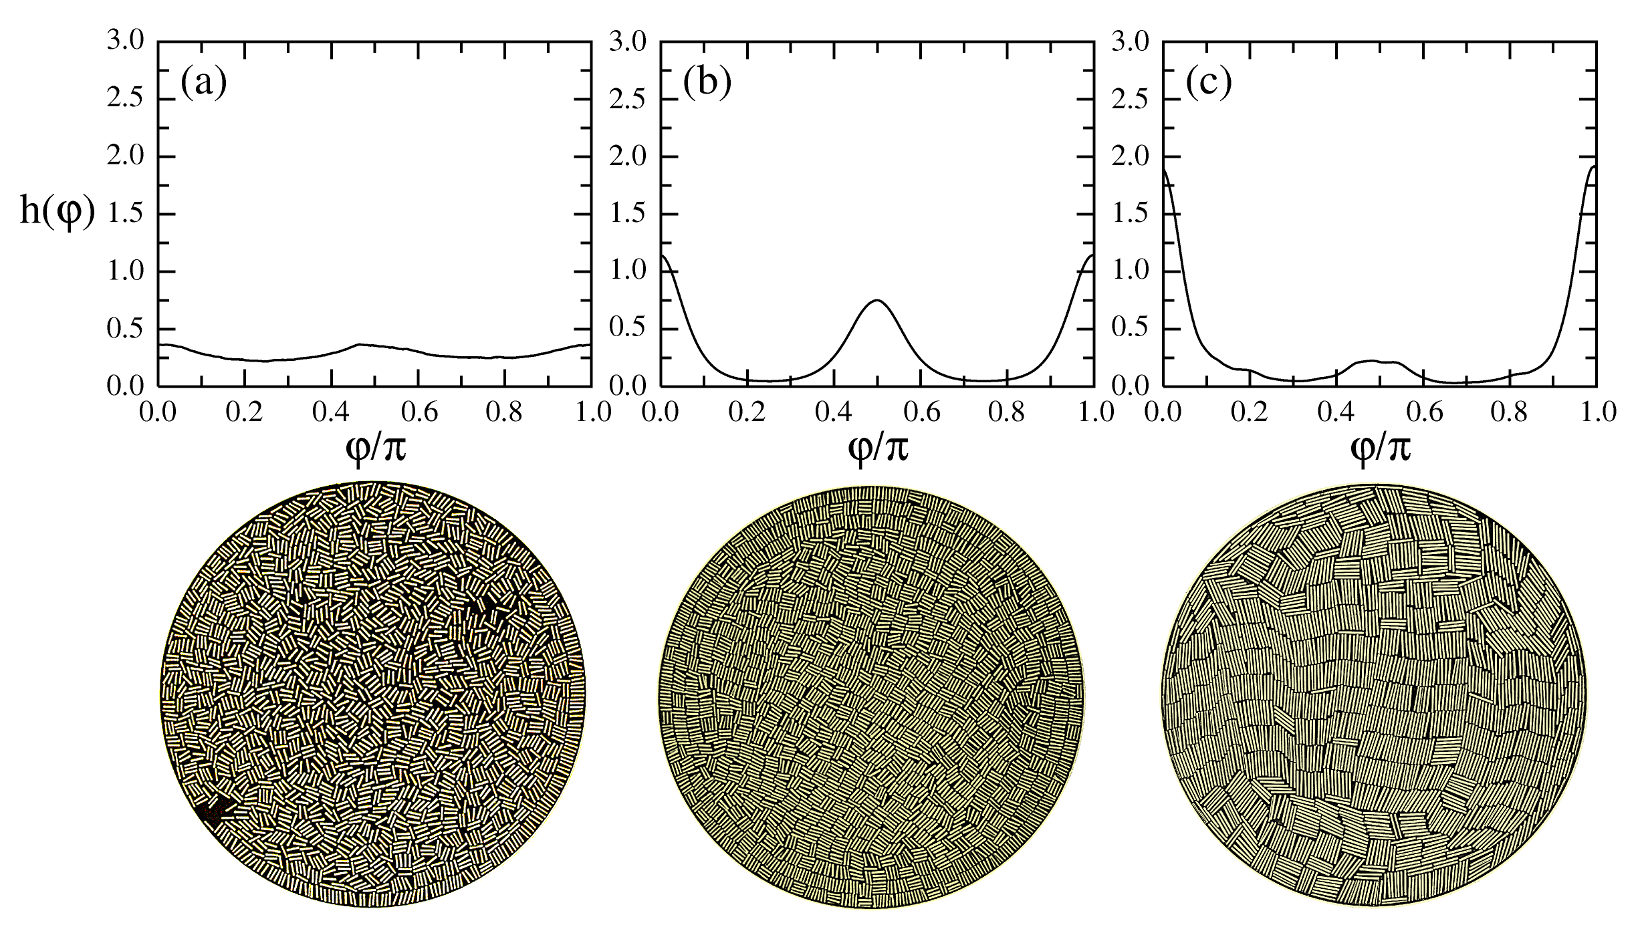
To more easily connect the order parameters with particle configurations, Fig. 9 shows distribution functions for the cases and and different packing fractions in each case, along with typical snapshots. Panel (a) corresponds to the case and . The orientation distribution is uniform and the steady-state configurations pertain to the isotropic phase. Panel (b) corresponds to the same aspect ratio, but the packing fraction is increased to . The distribution exhibits two peaks at and , which corresponds to configurations containing large domains with tetratic ordering. Note in the image the considerable layering next to the circular wall, extending up to three layers into the cavity. Finally, panel (c) corresponds to the case and . Here configurations containing large uniaxial smectic domains, with a much lower secondary maximum in the orientation distributions, are formed; this case corresponds to the high value of visible in Fig. 8. We note that, in (a), the distribution function is not completely flat, but presents some inherent structure. This is due to a bias introduced by our procedure to translate the origin of angles to the direction given by the director in each sampling region. In essence this effect gives rise to non-zero values of the order parameters for regions containing a few non-oriented rectangles.
One important result of our experiments is that it was not possible to identify truly uniaxial nematic configurations, not even locally, for all particle aspect ratios explored. This result includes the longer particles, for which both equilibrium systems and the vibration experiments of Ref. daniel predict uniaxial nematic phases. This phenomenon is signalled by the fact that the local uniaxial nematic order parameter, , is always low, regardless of the size chosen for the region where the local average is performed. This seems to indicate that uniaxial correlations in the direction of the long axis of a particle decay very fast (except in the case where well-developed smectic fluctuations are present), precluding the formation of local uniaxial nematic order. We think that this behaviour is a consequence of the strong clustering tendency exhibited by a granular system of rectangular particles. Uniaxial nematic phases have been identified by Narayan and coworkers in vibrated monolayers of steel rolling pins hindues , but cylinders only exhibited tetratic order. However, in Ref. daniel uniaxial nematic phases were identified in systems of plastic cylinders. We have used the same plastic cylinders in our vibration setup and confirm our results for steel particles. However, it is true that the experimental conditions of the two experiments (free particle height, cavity size, etc.) are not identical, and therefore the different results are not conclusive. The identification of ordered phases may be a subtle question in these dissipative granular systems subject to fluctuations and stringent geometrical constraints, and further studies on this question are desirable.
In the range of packing fractions and particle aspect ratios where Müller et al. daniel claim to find a uniaxial nematic phase, we have observed instead a random mixture of clusters or ‘patchy’ state consisting of large groups of particles in parallel arrangements, with groups oriented more or less at random with respect to each other. An example of this state is given in Fig. 1. As already discussed, these groups of particles are quite stable, since they have a long lifetime compared with the typical diffusion time (obviously the identity of a given cluster remains the same provided only a few particles are joining or leaving the cluster in a short time). The example of Fig. 1 corresponds to the uniaxial nematic region of Ref. daniel (note that the effective cavity sizes of the two experiments are equivalent). Clearly local tetratic order is absent, but so is local uniaxial nematic ordering. Again, different experimental conditions may be causing different behaviours.
Summing up our findings on orientational order in the monolayer, Fig. 6 reflects the behaviour in a very transparent way. For and is low and high, a condition for tetratic ordering. At high density begins to increase at sizes compatible with the observed fluctuating smectic domains. and exhibit low values of both order parameters, corresponding to the patchy state with locally frustated orientational order; at higher densities the order parameters increase, again reflecting the formation of small-size smectic fluctuations. seems to be a critical case.
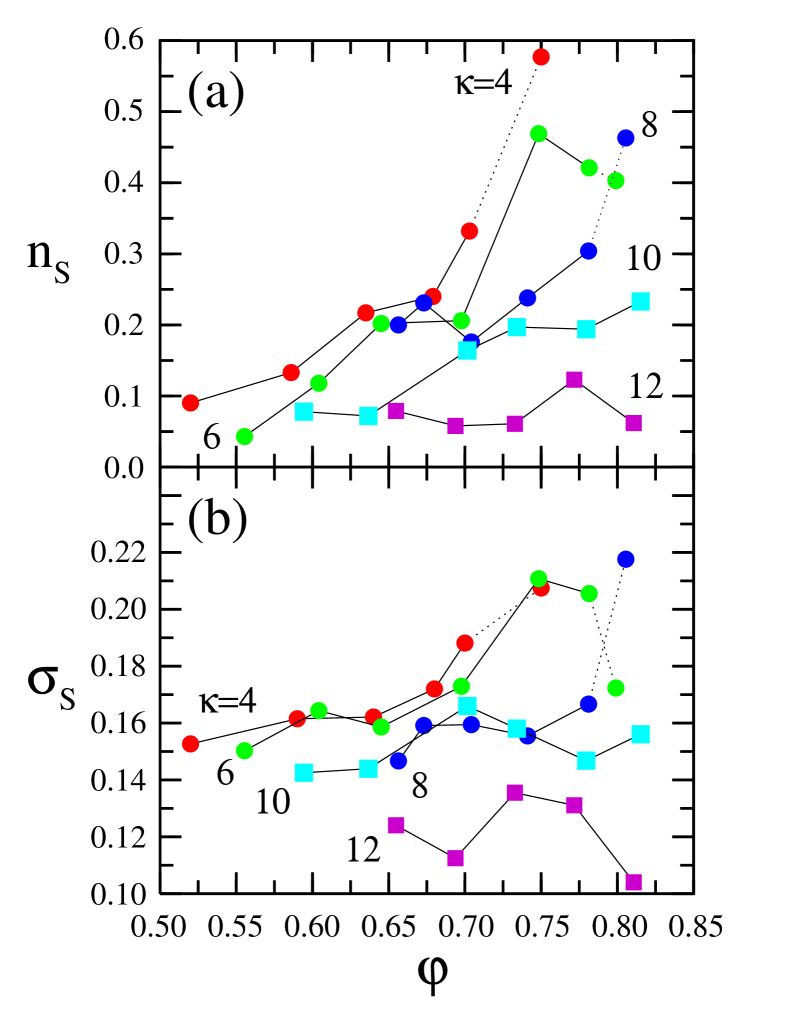
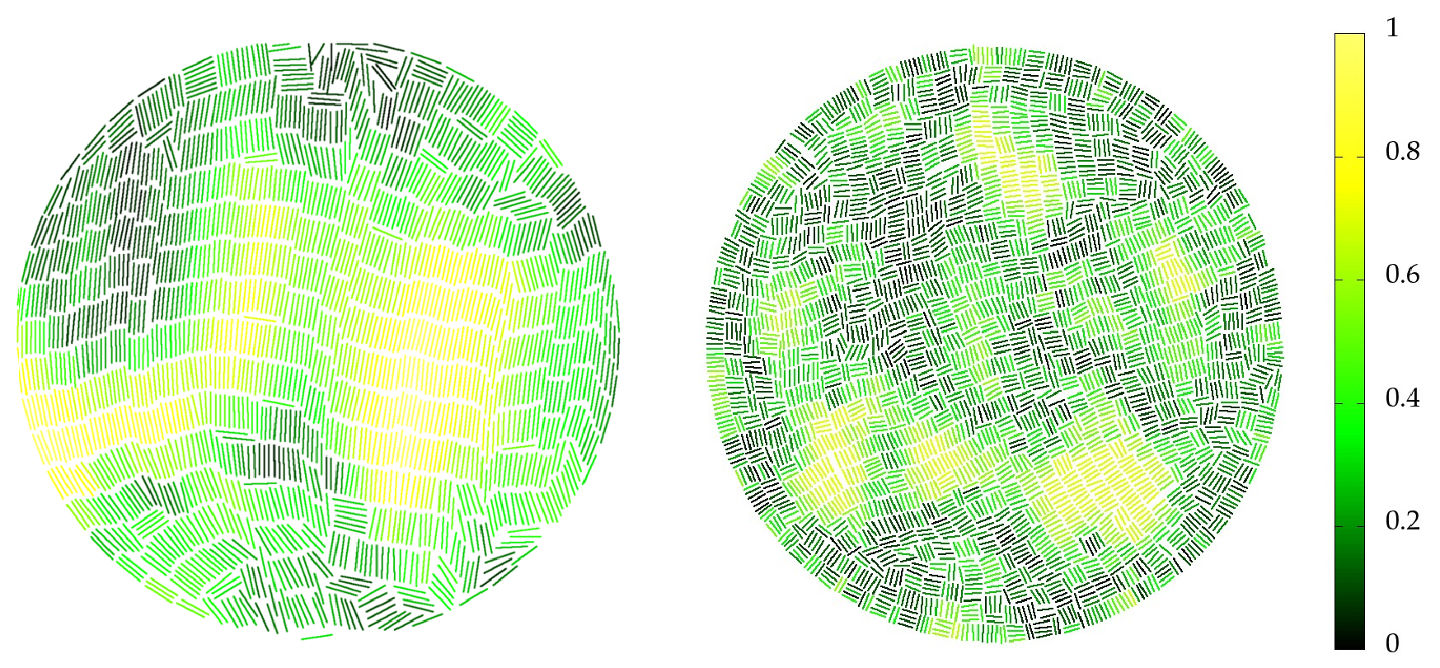
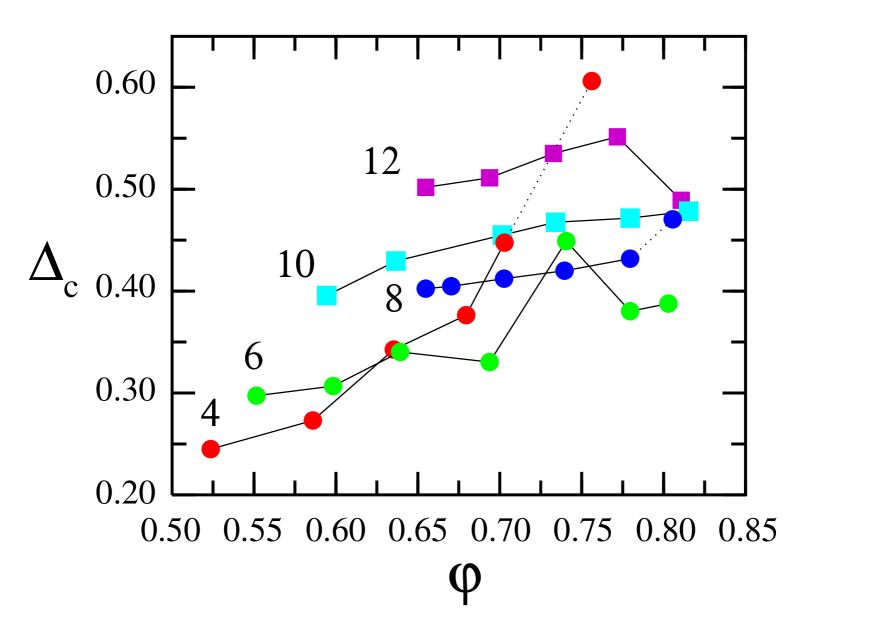
Let us now turn to the spatially-ordered, smectic fluctuations. Fig. 10 shows the changes in the smectic parameters, defined in the Appendix, as a function of packing fraction, for the different aspect ratios explored. is the standard smectic order parameter, while reflects the amount of particles belonging to large clusters. Overall both parameters become larger as density increases. Their evolution is highly correlated, but gives a clearer picture. Again, it is not possible to identify a sharp transition or at least a region where smectic order beings to increase at a significantly high ratio. In an effort to understand the gradual and rather smooth increase in smecticity with density, we looked at videos of the time evolution of the system (see Supplemental Material videos ). Obviously uniform smectic order is hampered by the circular geometry of the cavity, which is incompatible with the uniaxial symmetry of the smectic phase and should induce the presence of defects; this is not observed in our system. From a close examination of the videos, one can conclude that the time evolution of these systems at high packing fraction is very dynamic, with smectic domains forming, living for relatively short times, disappearing and reappearing at later times. An example of a smectic fluctuation is given in Fig. 11, where a false-colour map of a field of the parameter (obtained by averaging over a short time interval) is superimposed on a configuration at a corresponding instant of time. The size of smectic domains increases with density.
To support this conclusion, Fig. 7(b) shows a time evolution of the parameter for an experiment with and . In this experiment the system exhibits large smectic-domain fluctuations, which are clearly correlated with the uniaxial order parameter . Time variations of the smectic order parameter and the parameter are perfectly correlated with those of (not shown). From the figure, it is apparent that smectic order can reach high values, but there are repeated, abrupt falls in with time. We believe that these sudden falls, after which the order parameter rises up again, are related with the increase of hydrodynamic flow and vorticity Aranson . Smecticity and vorticity are present, one suppressing the other, during a given experiment. By contrast, tetratic order can develop uniformly in the cavity, as demonstrated in Fig. 12, where the false-colour map represents the local field , again supersimposed on a configuration at a corresponding instant of time. To restore the symmetry of the phase and at the same time satisfy the preferred orientation at the walls the system develops four point defects symmetrically located at relative angles of . This proves that, when the velocity flow is suppressed, the granular monolayer behaves as a liquid-crystalline material in thermal equilibrium, whose properties can be understood from a competition between surface alignment, elasticity and defects that restore the symmetry galanis2 .
III.3 Cluster-mixture view
Based on the high stability of clusters, it is tempting to regard the system as a collection of superparticles with their own ordering properties. To look at this picture in more detail, we have computed angular distribution functions and corresponding order parameters for the superparticles. Some interesting results emerge from this analysis. For example, one can calculate an effective mean and dispersion in the aspect ratio of clusters,
| (2) |
where the length and width of a cluster is , , with the maximum centre-to-centre distance between two particles in the cluster, and where index runs over all the clusters detected in the stationary regime of the experiment.
Fig. 13 shows the behaviour of as a function of for all the particles aspect ratios analysed. One observes that, for a particular , the effective mean cluster ratio is remarkably insensitive to . The dispersion (which is close to the cluster length polydispersity) is more sensitive to , see Fig. 14. All of these results suggest that, for a given , the system can be regarded as a mixture of polydisperse superparticles of rather constant aspect ratio and a relatively high polydispersity that increases with density. But still more interesting is the fact that, in all cases, , and that: (i) systems forming tetratic states ( and ) have ; (ii) systems not forming tetratic states ( and ) have ; and (iii) the critical system has . Therefore, can be regarded as a critical aspect ratio for the formation of tetratic ordering. This is surprisingly close to the critical value predicted by scaled-particle theory, which gives SPT . It is tempting to suggest that the strong clustering effects in the vibrated system somehow renormalise the interaction units from rectangles to clusters or superparticles. Since most of the important short-range particle correlations are ‘hidden’ inside the superparticles, the remaining weak correlations between superparticles can be renormalised into effective two-particle (excluded-area) correlations, well accounted for by standard mean-field theories. A further result that may support this idea is the behaviour of the cluster order parameters, and , presented in Fig. 15. This behaviour is remarkably similar to the one shown by the order parameters of particles, Fig. 8.
IV Discussion and conclusions
The results presented in the previous section point to a scenario for the ordering properties of vibrated rods a bit more complicated than previously reported daniel . On the one hand, we could not identify a sharp transition point between the disordered isotropic phase and the orientationally order phases at any value of aspect ratio. Rather, orientational order is built up in a continuous fashion as packing fraction is increased, and probably finite size and boundary effects also contribute to the smearing down of the transitions. On the other hand, the oriented configuration of the system is different for aspect ratios and . This is consistent with the critical value found in Ref. daniel , which separates tetratic from uniaxial-nematic ordering. But the nature of our phases is not completely identical. In the first case, , clear tetratic ordering is observed, as in daniel . But in the second, , the system forms large clusters of parallel particles with a random relative orientation, and uniaxial nematic configurations cannot be defined, even locally. At large packing fractions all systems form smectic domains, whose size and life-time increase with packing fraction. Smectic order, which can be understood as arising from packing maximisation, competes with the formation of vortices in the system, and uniform, well-defined steady states apparently do not exist.
The formation of ordered structures in the system may also be viewed in terms of particle clustering. The tendency of dissipative rods to cluster is much stronger than in thermal equilibrium, and the cluster concept becomes more useful. For low aspect ratio, particles organise into clusters with a close-to-square shape, low shape polydispersity and high rotational mobility. These factors favour local configurations with tetratic order where neighbouring clusters are oriented at orthogonal directions. Clusters with low aspect ratio form easily, because they involve a small number of rods and consequently recruit low-order particle correlations. By contrast, for long rods, the system forms compact clusters of large and uneven sizes that are curved and cannot arrange into tetratic or uniaxial nematic configurations, but orient randomly. These large clusters, however, easily form layered, smectic structures at high density.
The fact that vortices seem to affect tetratic and smectic configurations differently is also interesting. Tetratic configurations seem to be very stiff against the excitation of vortices Aranson , since the two mutually orthogonal local directors are inconsistent with a rotational velocity field. Therefore, uniform tetratic states, which include point defects that restore the symmetry of the system, may exist for very long times in stable configurations. On the other hand, smectic configurations are easily disrupted by vorticity and local shear modes, and uniform, well-defined steady states cannot be formed because smectic order is ‘entropically’ favoured, but competes with vortex excitations.
Acknowledgements.
Financial support from MINECO (Spain) under grants FIS2013-47350-C5-1-R, FIS2015-66523-P, MTM2012-39101 and MTM2015-63914-P, and ICMAT Severo Ochoa (Spain) under Contract No. SEV-2015-0554 are acknowledged.Appendix A Appendix
The orientational and positional orders in the cell are quantified by the local and global uniaxial nematic, tetratic and smectic order parameters. The nematic order parameters can be obtained either through the orientational distribution function, , or from the local nematic and tetratic order tensors, and , all calculated locally at the grid points and averaging over circular regions of a radius conveniently set to . is the angle between the long particle axis and a reference fixed axis defined as the axis, i.e. . The distribution function and order tensors depend on the position because particles will in general form domains with different orientational order in different regions of the cell and also through the spatial dependence of the local director, . To find the local director, the local ordering tensor, with elements , is diagonalised. The local director points along the eigenvector associated with the highest eigenvalue, which can be identified as the uniaxial order parameter . The local tetratic order parameter, , can be obtained from the tetratic tensor, . Alternatively, the local nematic order parameters can be computed from as
| (3) | |||||
In the experiments, results for these parameters obtained from the two routes are slightly different but qualitatively consistent. To obtain a global distribution function for the whole cell, , the local distribution functions are superimposed by rotating the local directors to a common reference axis. The global nematic and tetratic order parameters can be obtained by averaging the local nematic and tetratic order parameters over all the circular regions defined in the cell and over time,
| (4) |
Local and global smectic order parameters can be computed in the same way. To avoid surface effects, a shell immediately next to the surface is excluded from all the calculations. The thickness of this shell depends on the aspect ratio and experimental conditions (see Ref. daniel ).
Orientational order parameters can also be defined for the clusters. Once a cluster is identified, a long axis and a geometrical centre can be obtained. The former is defined simply by diagonalising the gyration tensor and taking the eigenvector associated to the highest eigenvalue. If the maximum centre-to-centre interparticle distance is less than , then ; otherwise we take the perpendicular vector, . Using an orientational distribution function for the clusters, , and cluster order parameters, , can be calculated.
To characterise smectic ordering, we have monitored the evolution of two parameters. One is the standard smectic order parameter , defined locally as
| (5) |
Here is the number of cylinders inside the averaging region centred at , is the position of one cylinder, and is a wavevector (tuned to the wavelength of the smectic density wave as measured directly on the images). denote the modulus of the complex argument. As usual, a global smectic order parameter can be defined for the whole sample,
| (6) |
where the average is over all the regions defined in the cavity (excluding a shell next to the circular wall) and over time.
References
- (1) Hard-body models of bulk liquid crystals, L. Mederos, E. Velasco and Y. Martínez-Ratón, J. Phys.: Cond. Matter 26, 463101 (2014).
- (2) Tracing the phase boundaries of hard spherocylinders, P. Bolhuis and D. Frenkel, J. Chem. Phys. 106, 666 (1996).
- (3) Orientational transitions of two-dimensional hard rod fluids, H. Schlacken, H. J. Mogel and P. Schiller, Mol. Phys. 93, 777 (1998).
- (4) Vortices in vibrated granular rods, D.L. Blair, T. Neicu, and A. Kudrolli, Phys. Rev. E 67, 031303 (2003).
- (5) Long-Lived Giant Number Fluctuations in a Swarming Granular Nematic, V. Narayan, S. Ramaswamy and N. Menon, Science 317, 105 (2007).
- (6) Nonequilibrium steady states in a vibrated-rod monolayer: tetratic, nematic, and smectic correlations, V. Narayan, N. Menon and S. Ramaswamy, J. Stat. Mech. 2006, P01005 (2006).
- (7) Swirling motion in a system of vibrated elongated particles, I. S. Aranson, D. Volfson and L. S. Tsimring, Phys. Rev. E 75, 051301 (2007).
- (8) Spontaneous patterning of confined granular rods, J. Galanis, D. Harries, D. L. Sackett, W. Losert and R. Nossal, Phys. Rev. Lett. 96, 028002 (2006).
- (9) Nematic Order in Small Systems: Measuring the Elastic and Wall-Anchoring Constants in Vibrofluidized Granular Rods, J. Galanis, R. Nossal, W. Losert and D. Harries, Phys. Rev. Lett. 105, 168001 (2010).
- (10) Ordering in granular-rod monolayers driven far from thermodynamic equilibrium, T. Müller, D. de las Heras, I. Rehberg and K. Huang, Phys. Rev. E 91, 062207 (2015).
- (11) Effect of particle geometry on phase transitions in two-dimensional liquid crystals, Y. Martínez-Ratón, E. Velasco and L. Mederos, J. Chem. Phys. 122, 064903 (2005).
- (12) Orientational ordering in hard rectangles: The role of three-body correlations, Y. Martínez-Ratón, E. Velasco and L. Mederos, J. Chem. Phys. 125, 014501 (2006).
- (13) Crystallization of a Quasi-Two-Dimensional Granular Fluid, P. M. Reis, R. A. Ingale and M. D. Shattuck, Phys. Rev. Lett. 96, 258001 (2006).
- (14) Clustering, Order, and Collapse in a Driven Granular Monolayer, J. S. Olafsen and J. S. Urbach, Phys. Rev. Lett. 81, 4369 (1998).
- (15) These particles were kindly provided by D. de las Heras and K. Huang.
- (16) http://imagej.nih.gov/ij/
- (17) Novel symmetries and clustering effects in two-dimensional anisotropic fluids, E. Velasco and Y. Martínez-Ratón, AIP Conf. Proc. 1091, 237 (2009).
- (18) Enhanced stability of the tetratic phase due to clustering, Y. Martínez-Ratón and E. Velasco, Phys. Rev. E 79, 011711 (2009).
- (19) An introduction to mathematical models of coagulation-fragmentation processes: A discrete deterministic mean-field approach, J. A. D. Wattis, Physica D 222, 1 (2006).
- (20) http://uam.es/personal_pdi/ciencias/evelasco/supp.html