Atomic Data Revisions for Transitions Relevant to Observations of Interstellar, Circumgalactic, and Intergalactic Matter
Abstract
Measurements of element abundances in galaxies from astrophysical spectroscopy depend sensitively on the atomic data used. With the goal of making the latest atomic data accessible to the community, we present a compilation of selected atomic data for resonant absorption lines at wavelengths longward of 911.753 Å (the H I Lyman limit), for key heavy elements (heavier than atomic number 5) of astrophysical interest. In particular, we focus on the transitions of those ions that have been observed in the Milky Way interstellar medium (ISM), the circumgalactic medium (CGM) of the Milky Way and/or other galaxies, and the intergalactic medium (IGM).
We provide wavelengths, oscillator strengths, associated accuracy grades, and references to the oscillator strength determinations. We also attempt to compare and assess the recent oscillator strength determinations. For about 22% of the lines that have updated oscillator strength values, the differences between the former values and the updated ones are 0.1 dex.
Our compilation will be a useful resource for absorption line studies of the
ISM, as well as studies of the CGM and IGM traced by sight lines to quasars and
gamma-ray bursts. Studies (including those enabled by future
generations of extremely large telescopes) of absorption by galaxies against the
light of background galaxies will also benefit from our compilation.
Keywords: atomic data — atomic processes — ISM: abundances —
Galaxies: abundances — quasars: absorption lines
Supporting material: machine readable table
1 Introduction
Atomic spectroscopy is fundamental to the study of a wide range of astrophysical environments. In the diffuse interstellar gas in the Milky Way, the atoms are often in the ground state, so that the resonant atomic transitions are of special interest. The vast majority of these atomic transitions lie in the ultraviolet. Space-based UV spectroscopy with a number of missions has made it possible to observe these interstellar transitions. Some of the earliest of these observations, carried out with the Copernicus mission led to fundamental discoveries such as the hot halo gas of the Milky Way [e.g., Rogerson et al. (1973); York (1974); Spitzer & Jenkins (1975)]. Subsequent missions such as the Far Ultraviolet Spectroscopic Explorer further extended the study of interstellar and intergalactic gas [e.g., Moos et al. (2000)]. The several generations of UV spectrographs on the Hubble Space Telescope have vastly increased the number of Galactic as well as extragalactic sight lines probed for their neutral or ionized gas. For example, these observations uncovered the existence and properties of low-redshift Lyman- forest clouds, as well as the covering fractions, element abundances, temperatures, and kinematics of the circumgalactic medium (CGM; e.g., Morris et al. (1991); Bahcall et al. (1993); Savage & Sembach (1996) and references therein; Kulkarni et al. (2005); Lehner et al. (2013); Tumlinson et al. (2013); Som et al. (2015); Werk et al. (2016)). Naturally, these observations provide crucial constraints on models of galaxy evolution, including the effect of outflows and inflows. Furthermore, determinations of relative element abundances in the interstellar medium (ISM) are important to understanding dust depletions and thus, indirectly, the composition of dust grains [e.g. Jenkins (2009) and references therein]. Relative element abundances in distant galaxies offer crucial windows in understanding the cosmic evolution of dust, as well as the evolution of stellar nucleosynthetic processes. On a larger scale, observations of key ions in the intergalactic medium (IGM) offer rich insights into the physical conditions in the diffuse regions of the cosmic web, and the large-scale cosmic processes influencing it.
In view of the sweeping consequences of atomic spectroscopy for understanding the evolution of galaxies, ISM, CGM, and IGM, it is important to be able to derive accurate physical information from the spectra. This makes it essential to employ as accurate atomic data as possible in translating the spectroscopic measurements into determinations of physical quantities.
Thanks to the extensive efforts of numerous theoretical and experimental physicists, many improvements in the atomic data relevant for astrophysical spectroscopy have been happening in recent years. However, knowledge of many of these improvements often does not trickle down to the community of observational spectroscopists rapidly enough. For example, in the CGM/IGM community, the most commonly used reference for atomic data, by far, is Morton (2003). With the goal of making the latest improvements accessible to the community, here we present a compilation of oscillator strengths for key transitions, including updates made since 2003. We focus, in particular, on the ions that have been measured in ISM/CGM/IGM studies for selected elements ranging from C to Pb. For each of the selected elements, we list lines longward of the Hydrogen Lyman limit at 911.753 Å, since, in this wavelength region, the bound-free H absorption does not contribute much to the ISM/CGM/IGM opacity. Atomic data for absorption lines shorter than 911.753 Å from the ground level can be found elsewhere, e.g. Verner et al. (1994) and Kallman & Palmeri (2007).
| Ion | Lower level | Upper level | Grade | Source | |||||||
|---|---|---|---|---|---|---|---|---|---|---|---|
| 6 | C i | 2s22p2 3P0 | 2s22p3s 3P | 1656.928 | 1656.929 | 1 | 3 | 1.43E1 | 0.845 | A | FF06 |
| 6 | C i | 2s22p2 3P0 | 2s2p3 3D | 1560.310 | 1560.309 | 1 | 3 | 7.16E2 | 1.145 | A | FF06 |
| 6 | C i | 2s22p2 3P0 | 2s2p3 3P | 1328.834 | 1 | 3 | 5.80E2 | 1.236 | B | FF06 | |
| 6 | C i | 2s22p2 3P0 | 2s22p4s 3P | 1280.135 | 1 | 3 | 2.61E2 | 1.583 | B+ | FF06 | |
| 6 | C i | 2s22p2 3P0 | 2s22p3d 3D | 1277.245 | 1277.245 | 1 | 3 | 9.22E2 | 1.035 | A | FF06 |
| 6 | C i | 2s22p2 3P0 | 2s22p5d 3D | 1157.910 | 1157.910 | 1 | 3 | 2.12E2 | 1.674 | ZF02 | |
| 6 | C ii | 2s22p 2P | 2s2p2 2D3/2 | 1334.532 | 1334.532 | 2 | 4 | 1.29E1 | 0.589 | FFT04 | |
| 6 | C ii | 2s22p 2P | 2s2p2 2S1/2 | 1036.337 | 1036.337 | 2 | 2 | 1.19E1 | 0.624 | FFT04 |
Note. — 1. Table 1 is available in its entirety as a machine readable table. A portion is shown here to illustrate its content. 2. An estimated accuracy grade is listed for each oscillator strength where available, indicated by a code letter as given below: AAA ; AA ; A+ ; A ; B+ ; B ; C+ ; C ; D+ ; D ; E .
2 Description of Compiled Data
2.1 General Terminology and Definitions
Throughout this paper, we focus on the electric dipole (E1) transitions. The absorption line corresponds to the transition between the lower level l and the upper level u, with level energies and , respectively. The statistical weights (, being the total angular momentum of the state) of the lower and upper levels are denoted and . In terms of the energy levels, the vacuum wavelength of the transition is
| (1) |
where is Planck’s constant, and is the speed of light. The Einstein transition probability (in s-1) for spontaneous emission is denoted by . The dimensionless absorption oscillator strength is related to the E1 transition probability by
| (2) |
where is in Å. The oscillator strengths compiled in this paper were obtained from either experimental techniques or theoretical calculations. In cases where oscillator strengths in both the length and velocity forms are available, we tabulate the length-form data because these are commonly used and more reliable.
2.2 Tabulated Data
In Table 1, we present the data for each ion species separately. These species and their ground levels are given in table subheaders. Table 1 lists the following information for each E1 line of interest.
-
1.
Nuclear charge .
-
2.
Ion spectroscopic notation.
-
3.
Lower level.
-
4.
Upper level.
-
5.
Vacuum rest wavelength in Å (where available).
-
6.
Ritz wavelength in Å.
-
7.
Lower level statistical weight .
-
8.
Upper level statistical weight .
-
9.
Absorption oscillator strength .
-
10.
Logarithm of weighted oscillator strength, .
-
11.
Accuracy grade (uncertainty) of the oscillator strength according to the NIST atomic spectra database (Kramida et al. 2016).
-
12.
-value data source.
2.3 Selection rules
We wish to be as consistent as possible in selecting the lines presented in Table 1. Hence we need to explain a selection procedure for the tabulated lines. The following basic rules were followed for selecting data sources in our tables or providing any additional information.
-
1.
For the species range, we consider elements with and several other elements observed in the ISM, such as Ga, Ge, Kr, and Pb. Usually we present data for a few of the lowest ionization stages. The selected ions have been observed in the ISM, CGM, and/or IGM.
-
2.
We tabulate lines with wavelengths Å. These are the vacuum wavelengths for all lines.
-
3.
We give priority to the observed wavelength, which we call over the Ritz wavelength . As a rule, the line wavelength source is the NIST database (Kramida et al. 2016). We have represented the Ritz wavelengths from the NIST database to three decimal places.
-
4.
We tabulate absorption lines originating from the ground level only. We do not tabulate lines originating from the excited levels of the ground configuration or the ground term even if their energies are just a few tenths of cm-1, e.g. the C I, C II, and N II ions.
-
5.
We tabulate only those lines that have . We present no more than three significant figures for the -values because we suppose that is enough to reflect their real accuracy.
-
6.
Usually, we tabulate -values from the newest sources giving priority to the experimental data over the theoretical values. In the cases where new data are not significantly different from the older data, we choose to rely on the older data preferring the most advanced theoretical methods for data production. Those special cases will be mentioned in Sect 3.
The accuracy grades of the tabulated oscillator strengths were either derived from the original data sources or we tabulated the grades given in the NIST database by Kramida et al. (2016). For this reason, some of the lines do not have accuracy grades. In some cases, we were able to confidently assign an accuracy grade through careful comparative analysis. These instances and their justification are specifically documented within Sect 3.
3 Comments and Assessment of Improved Data
In Table 1, wavelengths are adopted from the NIST database (Kramida et al. 2016). Theoretical -values are corrected for the inaccuracy in calculated level energies (or wavelengths ) by adjusting them according to the observed values , see Lykins et al. (2015):
| (3) |
A significant part of the new transition data are utilized from the theoretical calculation performed by Froese Fischer & Tachiev (2004), where the multiconfiguration Hartree-Fock (MCHF) method was applied to determine the transition data for the neutrals and ions starting with the beryllium isoelectronic sequence and finishing with the argon isoelectronic sequence. The same MCHF approximation is applied to produce data for the sodium to argon isoelectronic sequences by Froese Fischer et al. (2006). This method is a reliable one producing high-accuracy results, and it is difficult to exceed their accuracy when dealing with large amounts of species. We tabulate transition data from the above sources for the species up to argon complemented with data from other sources for the lines involving higher excited levels with . Another source of oscillator strength -values for ions with is the data list of Kurucz (2016). This is an online data list, which is continuously updated with new results. We give the preference to their newer data as opposed to the older values given in the previous versions of this data list. We reference this source as Kurucz (2016), though in many cases data have been produced considerably earlier.
3.1 Carbon species
For neutral carbon and the species C II and C III, we tabulate theoretical data from the calculations of Froese Fischer and co-workers published in Froese Fischer (2006), Zatsarinny & Froese Fischer (2002), and Froese Fischer & Tachiev (2004). These are very reliable data sources providing highly accurate radiative transition data. For two lines in the lithium-like C IV, which is outside the scope of the above-mentioned papers, we adopt data from Yan et al. (1998) with an accuracy grade of A. We performed an additional check for these two lines and calculated transition data using our own codes utilizing the Hartree-Fock (HF) and quasirelativistic (QR) approaches on a very extensive configuration-interaction (CI) wavefunction basis recently described by Kisielius et al. (2015). Our results confirm the high accuracy of data from Yan et al. (1998); our calculated -values agree within a few tenths of a percent.
3.2 Nitrogen species
Oscillator strengths are taken from Froese Fischer & Tachiev (2004) for the species N I, N II, and N III. The NIST database assigns them accuracy grades no worse than B. There is just one line in our investigated wavelength range in the N IV ion. It originates from the excited level 1s22s2p 3P1. However, it is rather weak because it constitutes a spin-changing E1 transition. For the lithium-like ion N V, we adopt data from Peach et al. (1988). For the N V lines, we performed an accuracy check because these data are coming from non-relativistic calculations. Our results, both in the length and velocity forms of the E1 transition operator, agree between themselves within and do not deviate more than from the results of Peach et al. (1988). This confirms a high-accuracy grade of A assigned to oscillator strengths of the tabulated absorption lines in the N V ion.
3.3 Oxygen species
For the O I ion, data from Froese Fischer & Tachiev (2004) are adopted for the lines connecting the excited states 2s22p33s, 3d, and 4s. For other lines not covered by Froese Fischer & Tachiev (2004), we use data from Butler & Zeippen (1991) and Hibbert et al. (1991). The latter is the same source used by the NIST database, and the later investigation of Tayal (2009) just confirms the reliability and high accuracy of their data. Transition data from Tayal (2009) agree with oscillator strengths of Hibbert et al. (1991) within . We also tabulate oscillator strengths for two 2s – 2p transition lines in Li-like O VI determined by Peach et al. (1988). Likewise to the situation described in Sect 3.2, we have performed our own calculation and can confirm a high-accuracy grade assigned to these data by the NIST team.
3.4 Sodium species
The oscillator strength -values are taken from Froese Fischer et al. (2006) for the lines 3s – p, (), and we retain the same accuracy grades as given by NIST. For the line 3s – 5p, we adopt the oscillator strength value determined by applying the same MCHF approach -spline method with non-orthogonal radial orbitals by Froese Fischer (2002). It was proved for neutral carbon by Zatsarinny & Froese Fischer (2002) that such an approach produces reliable results for the high- lines.
3.5 Magnesium species
For the lines representing resonance transitions from the ground 3s2 state to the excited 3s3p and 3s4p states of the Mg I ion, we use data from Froese Fischer et al. (2006) with accuracy grades of A and B+. For the transition to the 3s5p levels, more recent oscillator strength data produced using a -splines method within MCHF by Zatsarinny et al. (2009) are available, whereas for the lines representing transitions to highly excited 3sp levels (, we adopt data of Chang & Tang (1990) because more recent data do not exist.
Oscillator strength values for Mg II are taken from Froese Fischer et al. (2006). The accuracy of the data for the 3s – 3p lines has a very high A+ grade. Meanwhile, though the lines 3s – p () are in our investigated wavelength range (), only the transition to the 2p65p 2P level has satisfying our selection criteria. Other lines fall short of that criteria, though their fine-structure level unresolved oscillator strengths are within that range.
3.6 Aluminum species
We tabulate oscillator strength -values for three ions, Al I, Al II, and Al III. Here for the lines connecting the ground state with the lower levels, the theoretical data of Froese Fischer et al. (2006) are adopted. They have accuracy grades of B+ and A+. For the higher levels, we list theoretical data from Mendoza et al. (1995), which were determined by non-relativistic R-matrix calculations. Furthermore, their data for fine-structure levels were derived from the multiplet values assuming a pure -coupling. Those data usually have rather poor accuracy grades, thus further data improvement can rectify this situation. For three lines of Al I, we adopt experimental data of Vujnović et al. (2002) and Davidson et al. (1990) and assign an accuracy grade of B.
3.7 Silicon species
For the low-lying states of the 3s23p4s, 3s3p3, 3s23p3d odd-parity configurations of Si I, we list -values adopted from Froese Fischer et al. (2006). As we have mentioned before, these theoretical data are of high quality and reliability. It is necessary to admit here that these values differ noticeably from the previous oscillator strength values tabulated by Morton (2003). The case of the lines involving higher levels is more complicated. Some lines falling into our wavelength selection region are absent from the NIST database, though their corresponding level energies are presented there, e.g. the lines at Å, Å, and Å. The oscillator strength value for the line at Å is derived from the non-relativistic R-matrix calculations of collision data for several Si-like ions of Nahar & Pradhan (1993), which we consider to be less accurate compared to the pure atomic structure calculations or the experimental results. The E1 transition data for the latter line are listed in Froese Fischer et al. (2006), though their value of differs noticeably from the experimental value from Smith et al. (1987). Additional experimental data for higher levels comes from the measurements of Smith et al. (1987) and from a critical compilation of Kelleher & Podobedova (2008).
Bautista et al. (2009) have produced a benchmark data set for the Si II ion by utilizing several theoretical approaches and experimental data to determine reliable recommended absorption oscillator strengths for the levels of the 3s3p2, 3s23d, and 3s24s configurations. For the higher level of 3s24d at 989.873 Å, we list the experimental -value of Curtis & Smith (1974), which is close to the theoretical value from Charro & Martin (2000), which also serves as a source for the 3s25s level data. For the ions Si III and Si IV, we list oscillator strengths from Froese Fischer et al. (2006).
3.8 Phosphorus species
For the lines connecting the ground state 3s23p3 4S with the levels of term of the excited configuration 3s23p2()4s of P I, we adopt oscillator strengths from Froese Fischer et al. (2006). Unfortunately, that work does not list data for the transitions to the 3s23p2()3d levels. Therefore, for these levels, we resort to older theoretical data from Fawcett (1986). The -values for the lines at given by Froese Fischer et al. (2006) differ significantly, at least by two orders of magnitude from the previous data of Fawcett (1986). Since the relative intensities for these three 3s – 3p lines given by the NIST database are similar to those of 3p – 4s lines at , we believe the data from Fawcett (1986) given its D accuracy rating can be utilized for neutral phosphorus.
For the P II and P III lines, we list data from Froese Fischer et al. (2006). Five more lines below 1153 Å that are unlisted in the NIST database are entered in Table 1 for P II. These lines originate from the absorption transitions from the ground level to the levels 3p4s and 3p3d. We have derived their Ritz wavelengths using level energies listed by Kramida et al. (2016). The same process was performed for three P III lines below 999 Å. The source of the transition data chosen for the magnesium-like P IV and sodium-like P V is Froese Fischer et al. (2006).
3.9 Sulfur species
The main source of the data for the neutral sulfur lines connecting the ground level 3s23p4 3P2 with the levels of the excited 3d, 4d, 4s, 5s, and 6s configurations are the theoretical results of Deb & Hibbert (2008). As in Deb & Hibbert (2006), the data from Deb & Hibbert (2008) agree very well with most lines from the results of the -spline calculations by Zatsarinny & Bartschat (2006). They are also close to the data produced by Froese Fischer et al. (2006). Thus one has to be assured of high quality and reliability of the listed -values. We include the line at Å even though its -value is lower than our selection criterion as other theoretical predictions put it above this criterion. The data from higher configurations with the valence 5d, 6d, 7s, and 8s electrons are taken from Biémont et al. (1998). That set of -values was deduced from a combination of laser lifetime measurements and theoretical branching ratios. For the lines with Å that connect the ground state with the upper levels located above the first ionization limit at cm-1, we choose oscillator strengths from Deb & Hibbert (2008), which have an accuracy grade of C.
For the S II lines, we list a data set from Kisielius et al. (2014). The authors concluded that their data are in good agreement with other theoretical data sets of Froese Fischer et al. (2006) and Tayal & Zatsarinny (2010). For the S III, S IV, and S VI lines, we list data from Froese Fischer et al. (2006).
3.10 Chlorine species
The data for the Cl I lines are taken from the recent theoretical calculations of Oliver & Hibbert (2013). Their data accuracy grade is C+. For the two lines in Cl II and three lines of Cl III, we assume that the experimental data from Schectman et al. (2005) are the best source. The accuracy of their -values is within 5% (or an accuracy grade of B+). We list an oscillator strength from Froese Fischer et al. (2006) for a single line of Cl IV.
3.11 Argon species
For the lines of Ar I and Ar II, we recommend using oscillator strengths from Froese Fischer et al. (2006). One can safely assign the C+ accuracy grade to these data.
3.12 Potassium species
For the spectra of neutral K I we list four lines corresponding to the resonance 4s – 4p and 4s – 5p transitions in the valence shell. The lines to the higher p levels are relatively weak and do not fall into our desired -value range. The parameters of lines caused by the 4s – 4p transitions are determined by Wang et al. (1997). Their data agree very well with other high-accuracy measurements. They evaluate the accuracy of -values as 0.2% (AAA accuracy grade). Data for the 4s – 5p lines are from the measurements of Shabanova & Khlyustalov (1985). Although their accuracy grade is unlisted, by comparing these data with the results of elaborated relativistic calculations of Migdalek & Kim (1998), we confidently assign them a grade of A.
3.13 Calcium species
The data for the 4227.92 line are taken from the high-accuracy photoassociative measurements of Zinner et al. (2000), which produces reduced uncertainties compared to previous measurements. Their data have confirmed previous level-crossing measurements of Kluge & Sauter (1974). Recent theoretical values of Froese Fischer & Tachiev (2003) are also close (within error bars) to the above experimental data. The data for other resonance lines of neutral calcium are measured by Parkinson et al. (1976). They used the hook method to determine the -values of the 4s2 – 4sp absorption lines. These data for most lines agree within 5% with other measurements, e.g. Ostrovskii & Penkin (1961), Shabanova (1963), and Mitchell (1975). The 2722.450 line is the only exception, and here the differences are much higher. Even though this line has an -value below our cut-off level, we list it in our table. The list for Ca I contains lines up to 3p64s13p, while the transitions for higher Rydberg levels fall below our cut-off criterion of .
For the Ca II ion lines, we recommend recently determined oscillator strengths from Safronova & Safronova (2011). Their calculations used a high-precision relativistic method, where all single and double, and partially triple excitations of Dirac-Fock wavefunctions are included to all orders of perturbation theory. The authors estimate the relative uncertainties of their calculated oscillator strengths to be 0.9%.
3.14 Titanium species
The majority of the data for the Ti I lines come from the measurements of Lawler et al. (2013). They have used the previously measured radiative lifetimes combined with the branching fractions to yield absolute oscillator strengths. The data agree closely with the NIST data; therefore we consider it appropriate to assign them respective accuracy grades, which are no worse than B+. Some lines are missing in Lawler et al. (2013). For those lines, we recommend the high-quality experimental data from Blackwell-Whitehead et al. (2006) or data from the earlier experiment of Smith & Kühne (1978).
For the Ti II ion lines, we list data from the recent paper of Lundberg et al. (2016). The authors measured radiative level lifetimes and used the pseudo-relativistic HF method to determine oscillator strengths and theoretical lifetimes for the measured levels. Their data agree within 10% with the earlier theoretical data of Ruczkowski et al. (2014) and those from Pickering et al. (2001b). For the Ti III transition data, we adopt the theoretical results of Raassen & Uylings (1997). They performed an orthogonal operator calculation for the electric dipole transition integrals by means of the multiconfiguration Dirac-Fock method including core polarization.
3.15 Chromium species
For the lines connecting the ground state of Cr I with the levels, the data chosen were produced by Sobeck et al. (2007). The authors used branching fraction measurements from Fourier transform spectra in conjunction with radiative lifetimes to determine the transition probabilities. These data are assigned an accuracy grade of B. For the transitions to the 3d55p,6s levels, we list data from Martin et al. (1988), which are given accuracy grades of C.
For the three lines above 2050 Å in Cr II, the recommended tabulated data are from the experimental work of Nilsson et al. (2006). The accuracy grade for their data is B+. For other lines of Cr II we tabulate theoretical data from Raassen & Uylings (1998), where oscillator strengths have been determined using the orthogonal operator technique. Five listed lines of Cr III are taken from Kurucz (2016).
3.16 Manganese species
For the manganese lines, we adopt the experimental oscillator strength values from Blackwell-Whitehead et al. (2005, 2011). Their accuracy grade is B+ for the lines with Å, and C+ for the lines below 3000 Å. Unfortunately, oscillator strengths for most Mn I lines listed in our table were not measured in the above experiments. For these lines, we tabulate older data from Martin et al. (1988) or data from Kurucz (2016).
New data for some selected Mn II lines in Table 1 are listed from Den Hartog et al. (2011) who experimentally measure radiative lifetimes and branching fractions to derive transition probabilities and oscillator strengths. Other data come either from similar experimental work of Kling & Griesmann (2000) or from the configuration-interaction calculations of Toner & Hibbert (2005).
3.17 Iron species
Lines for three iron ions are listed in Table 1. For lines with Å our oscillator strength source is Blackwell et al. (1979), who measured absorption oscillator strengths and reported an accuracy of 0.5%. NIST assigns an accuracy grade of A for most of those lines. For the lines below 2913 Å, our data come from the measurements of O’Brian et al. (1991). They employed time-resolved laser-induced fluorescence to measure radiative lifetimes and derived oscillator strengths by measuring branching fractions. Their accuracy grades are slightly worse compared to those of Blackwell et al. (1979). For the remaining lines below 2260 Å, we list the data of Banfield & Huber (1973), who used the hook method to determine oscillator strengths in Fe I. Although the accuracy grade of their data is not as high, these oscillator strengths are substantially reliable.
Our main source for the Fe II lines above 2000 Å is the experimental data from Bergeson et al. (1996). The authors have measured branching ratios with a Fourier transform spectrometer and with a high-resolution grating spectrometer. The resulting measurements were used to derive transition probabilities for 56 lines. Another group of listed lines was theoretically studied by Raassen & Uylings (1998). Their accuracy grade is lower. These two sources are complemented by experimental oscillator strengths from Pickering et al. (2001a) and the critical compilation of Fuhr & Wiese (2006). For the Fe III ion line at 1122.5 Å, we tabulate the theoretical oscillator strength from Deb & Hibbert (2009).
3.18 Cobalt species
Oscillator strengths for all but one of the Co I lines are taken from the recent measurements of Lawler et al. (2015). They derived oscillator strengths from experimental branching fractions combined with radiative lifetimes from laser-induced fluorescence measurements. The NIST database assigns accuracy grades of B or B+ for their data. A rather weak line at 2436 is taken from Cardon et al. (1982), where absolute oscillator strengths were determined using the hook method. Data for the Co II lines come from the calculations using the orthogonal operator technique by Raassen et al. (1998) and the measurements of Mullman et al. (1998a) and Mullman et al. (1998b). In general, the data for Co II have relatively low accuracy grades. For the lines of Co III, we tabulate oscillator strengths from the Kurucz online data list (Kurucz 2016).
3.19 Nickel species
For the Ni I lines, we list oscillator strengths from new measurements of Wood et al. (2014), where -values were determined by combining measured branching fractions and radiative lifetimes. Most of these data are assigned high-accuracy grades (from B+ to B). Missing data are covered by the measured oscillator strengths obtained by the hook and absorption methods from Huber & Sandeman (1980). Their data accuracy evaluation is lower compared to that of Wood et al. (2014). NIST lists only a single line for transitions of Ni II. We tabulated oscillator strengths from the recent CI calculation of Cassidy et al. (2016). The authors state that it is difficult to provide a measure of the uncertainties for the large-scale CI calculations, which would cover all transitions. Nevertheless, they consider that their data are the best currently available and meet the accuracy demands for astrophysical applications. We do not assign any accuracy grades to these data, though they can be considered as having an accuracy grade of B.
3.20 Copper species
The source of oscillator strength data for the resonance 4s – 4p lines in Cu I is a critical compilation of oscillator strengths for neutral ions by Doidge (1995). The data for the transitions 3d – 4p and 4s – 5p are adopted from Hannaford & McDonald (1978). The oscillator strengths were determined from atomic absorption measurements of the radiation emitted from a copper hollow-cathode lamp. The oscillator strengths for the remaining lines 4s – p comes from the calculation of Çelik et al. (2015).
Three lines listed for Cu II originate from the transitions involving the ground level 3p63d10 1S0 and the levels with from the configuration 3d94p. Their data source is either the theoretical data from Donnelly et al. (1999) or from the beam-foil experimental data of Brown et al. (2009), which were given an accuracy grade of B.
3.21 Zinc species
The oscillator strength for the 4s2 1S0 – 4s4p1P line of Zn I is taken from the Hanle-effect experiments of Kowalski & Träger (1976), which have confirmed the earlier level-crossing technique results of Lurio et al (1964). Later beam-foil spectroscopy measurements of Martinson et al. (1979) give very similar -values (). These measurements are consistent with recent theoretical data, e.g. Froese Fischer & Zatsarinny (2007) and Głowacki & Migdałek (2006). For the line, we tabulate the oscillator strength from the line list of Kurucz (2016). The NIST database lists a rather strong line at with no transition identification or Ritz wavelength. Analyzing the level list, we can assume that this line originates from the transition 3d – 4p with Å, though this wavelength noticeably differs from the measured one. This can be explained by the fact that the level 3d94s24p 3P lies in the continuum, above the ionization limit.
Oscillator strengths for Zn II are taken from the quasirelativistic calculations of Kisielius et al. (2015). Their data are consistent and agree with other theoretical data within a range of 10%.
3.22 Gallium species
Tabulated data for neutral gallium lines are from a new compilation of Shirai et al. (2007) with an unlisted line for the 4p1/2 – 7d3/2 transition data taken from the relativistic many-body perturbation theory calculation of Safronova et al. (2005). These two data sources tabulate oscillator strengths differing by approximately 10% for most of the listed lines. For the 1414 line of Ga II, we tabulate an oscillator strength from the low-energy beam-foil measurements of Andersen et al. (1979), which have 8% measurement errors (i.e., an accuracy grade of B). Later theoretical data confirm the reliability of the listed experimental data, see, e.g. McElroy & Hibbert (2005), Jönsson et al. (2006), and Chi & Chou (2014). Oscillator strength values for two lines of the Ga III ion are from the compilation of Shirai et al. (2007).
3.23 Germanium species
There are no new reliable original oscillator strength data sources for the germanium species following Morton (2003), except for the compilation of Fuhr & Wiese (2005). For the Ge I lines, we tabulate experimental oscillator strengths of Li et al. (1999). Their experiment measured natural level radiative lifetimes by employing time-resolved UV laser-induced fluorescence from a laser-produced plasma and determined branching fractions by an inductively coupled plasma emission spectrometry technique. The derived oscillator strengths have accuracy grades of B or B+. For the Ge II lines, we list theoretical -values from Biémont et al. (1998). For the Ge III ion, we list two 4s2 – 4s4p transition lines. The 3P spin-forbidden line oscillator strength is tabulated from the empirical predictions of Curtis (1992). The resonance line -value for the 1P level was experimentally determined by Andersen et al. (1979) utilizing beam-foil spectroscopy. The oscillator strengths for Ge IV are adopted from the beam-foil measurements of Pinnington et al. (1981).
3.24 Krypton species
For the Kr I lines we tabulate experimental oscillator strengths from Chan et al. (1992). They measured photoabsorption -values using the dipole () method. The oscillator strengths have accuracy grades of B or B+. The reliability of their data was confirmed by recent -spline calculations of Zatsarinny & Bartschat (2009). The oscillator strengths for Kr II were derived from the selective pulsed monochromatized synchrotron radiation experiment of Lauer et al. (1999), where lifetimes of the 4s4p6 2S1/2 states were measured. For the Kr VI line, we list data from MCHF relativistic calculations of Pagan et al. (1996), where adjustments were made to the electrostatic parameters in order to improve theoretical level energies and -values.
3.25 Lead species
We list data for the Pb II lines. The oscillator strength for the line is adopted from Quinet et al. (2007), where transition probabilities were calculated in a relativistic multiconfiguration Dirac-Fock approach and the accuracy of the results was assessed by a new experimental determination of the radiative lifetime for the 7s1/2 level. Other listed data are from Safronova et al. (2005). The authors obtained radiative transition data using relativistic many-body perturbation theory. The remaining data for the 10s1/2 and 9d3/2 levels are adopted from the ab initio relativistic Hartree-Fock calculations of Colón et al. (2001).
4 Discussion
A complete version of Table 1 is available online in a machine-readable version. Table 1 can also be obtained on request as a formatted PDF table from the authors (Romualdas.Kisielius@tfai.vu.lt, fcashman@email.sc.edu). In the printed version of this paper, we list just a few lines from the carbon species to facilitate understanding of the form and contents of our data list.
In Table 2, we explain the source abbreviations used in Table 1. For easier guidance, we also tabulate the ion list from which oscillator strength values were sourced.
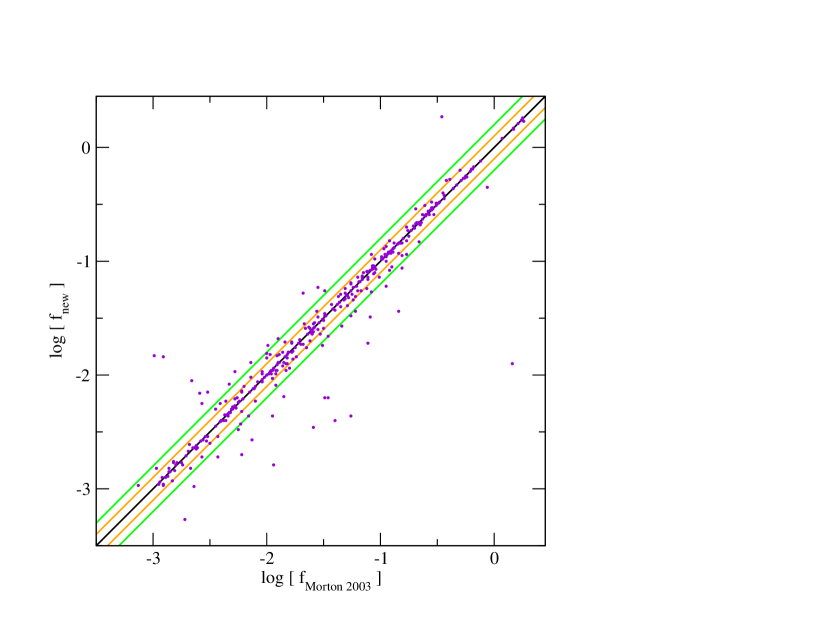
Table 1 lists 576 transitions. For 400 of these transitions, we have listed updated oscillator strength determinations. Of these, 60 transitions, though listed either in Morton (2003) or in the NIST database Kramida et al. (2016), previously had no oscillator strength value reported. Figure 1 shows a comparison of the updated and former oscillator strengths. Table 3 compares updated oscillator strength values to their former values for 340 lines. For 171 of these transitions, the new -values are smaller than the old values, while for 157 transitions, the new -values are larger. The differences from the old values are usually smaller for the stronger transitions with log . The differences are dex for of the lines with changed -values, and dex for of the lines.
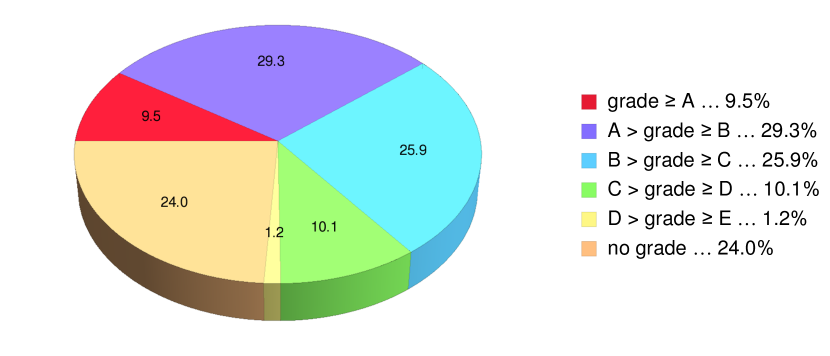
A breakdown of the accuracy grades for all 576 oscillator strengths is given in Fig. 2. Approximately 37% of the oscillator strengths have an accuracy grade worse than 10%, while approximately 11% of the oscillator strengths have an accuracy grade worse than 25%. Figure 2 highlights the need for obtaining more accurate oscillator strength values for these, as well as for obtaining the accuracy grades for the 24% of the oscillator strengths that are currently without a grade.
| Abbreviation | Citation | Ion |
|---|---|---|
| AEP79 | Andersen et al. 1979 | Ga ii, Ge iii |
| BFI09 | Brown et al. 2009 | Cu ii |
| BGF98 | Biémont et al. 1998 | S i |
| BH73 | Banfield & Huber 1973 | Fe i |
| BIP79 | Blackwell et al. 1979 | Fe i |
| BLN06 | Blackwell-Whitehead et al. 2006 | Ti i |
| BMQ98 | Biémont et al. 1998 | Ge ii |
| BMW96 | Bergeson et al. 1996 | Fe ii |
| BPN11 | Blackwell-Whitehead et al. 2011 | Mn I |
| BQP09 | Bautista et al. 2009 | Si ii |
| BXP05 | Blackwell-Whitehead et al. 2005 | Mn i |
| BZ91 | Butler & Zeippen 1991 | O i |
| C92 | Curtis 1992 | Ge iii |
| CAE15 | Çelik et al. 2015 | Cu i |
| CAM01 | Colón & Alonso-Medina 2001 | Pb ii |
| CCG92 | Chan et al. 1992 | Kr i |
| CHR16 | Cassidy et al. 2016 | Ni ii |
| CM00 | Charro & Martín 2000 | Si ii |
| CS74 | Curtis & Smith 1974 | Si ii |
| CSS82 | Cardon et al. 1982 | Co i |
| CT90 | Chang & Tang 1990 | Mg i |
| D95 | Doidge 1995 | Cu i |
| DH01 | Donnelly & Hibbert 2001 | Fe ii |
| DH08 | Deb & Hibbert 2008 | S i |
| DH09 | Deb & Hibbert 2009 | Fe iii |
| DHB99 | Donnelly et al. 1999 | Cu ii |
| DHL11 | Den Hartog et al. 2011 | Mn ii |
| DVD90 | Davidson et al. 1990 | Al i |
| F86 | Fawcett 1986 | P i |
| FF02 | Froese Fischer 2002 | Na i |
| FF06 | Froese Fischer 2006 | C i |
| FFT04 | Froese Fischer & Tachiev 2004 | C ii; iii, N i, ii, iii; |
| O i | ||
| FFT06 | Froese Fischer et al. 2006 | Na i; Mg i, ii; |
| Al i, ii, iii; | ||
| Si i, iii, iv; | ||
| P i, ii, iii, iv, v; | ||
| S iii, iv, vi; Cl iv; | ||
| Ar i, ii | ||
| FW06 | Fuhr & Wiese 2006 | Fe ii |
| HBG91 | Hibbert et al. 1991 | O i |
| HM78 | Hannaford & McDonald 1978 | Cu i |
| HS80 | Huber & Sandeman 1980 | Ni i |
| K16 | Kurucz 2016 | Fe ii, Cr iii, Mn i, |
| Co iii, Zn i | ||
| KG00 | Kling & Griesmann 2000 | Mn ii |
| KKF14 | Kisielius et al. 2014 | S ii |
| KKF15 | Kisielius et al. 2015 | Zn ii |
| KP08 | Kelleher & Podobedova 2008 | Si i |
| KT76 | Kowalski & Träger 1976 | Zn i |
| LGW13 | Lawler et al. 2013 | Ti i |
| LHE16 | Lundberg et al. 2016 | Ti ii |
| LLV99 | Lauer et al. 1998 | Kr ii |
| LNP99 | Li et al. 1999 | Ge i |
| LSC15 | Lawler et al. 2015 | Co i |
| MCL98 | Mullman et al. 1998 | Co ii |
| MEL95 | Mendoza et al. 1995 | Al i |
| MFW88 | Martin et al. 1988 | Cr i, Mn i |
| MLZ98 | Mullman et al. 1998 | Co ii |
| NLL06 | Nilsson et al. 2006 | Cr ii |
| NP93 | Nahar & Pradhan 1993 | Si i |
| OH13 | Oliver & Hibbert 2013 | Cl i |
| OWL91 | O’Brian et al. 1991 | Fe i |
| PBI81 | Pinnington et al. 1981 | Ge iv |
| PJS01 | Pickering et al. 2001 | Fe ii |
| PRB96 | Pagan et al. 1996 | Kr vi |
| PRT76 | Parkinson et al. 1976 | Ca i |
| PSS88 | Peach et al. 1988 | N v, O vi |
| QBP07 | Quinet et al. 2007 | Pb ii |
| RPU98 | Raassen et al. 1998 | Co ii |
| RU97 | Raassen & Uylings 1997 | Ti iii |
| RU98 | Raassen & Uylings 1998 | Cr ii, Fe ii |
| SCS06 | Safronova et al. (2006) | Ga i |
| SFB05 | Schectman et al. 2005 | Cl ii, iii |
| SHT87 | Smith et al. 1987 | Si i |
| SK78 | Smith & Kühne 1978 | Ti i |
| SK85 | Shabanova & Khlyustalov 1985 | K i |
| SLS07 | Sobeck et al. 2007 | Cr i |
| SMK98 | Siegel et al. 1998 | Mg ii |
| SRK07 | Shirai et al. 2007 | Ga i, iii |
| SS11 | Safronova & Safronova 2011 | Ca ii |
| SSJ05 | Safronova et al. 2005 | Pb ii |
| TH05 | Toner & Hibbert 2005 | Mn ii |
| VBF02 | Vujnović et al. 2002 | Al i |
| WLS14 | Wood et al. 2014 | Ni i |
| WWW97 | Wang et al. 1997 | K i |
| YTD98 | Yan et al. 1998 | C iv |
| ZB09 | Zatsarinny & Bartschat 2009 | Kr i |
| ZBG09 | Zatsarinny et al. 2009 | Mg i |
| ZBR00 | Zinner et al. 2000 | Ca i |
| ZF02 | Zatsarinny & Froese Fischer 2002 | C i |
We encourage future studies of interstellar, circumgalactic, and intergalactic absorption lines to use the revised oscillator strengths compiled here. This is especially important for the of the lines where the improvements of dex are larger than the typically quoted measurement uncertainties in metal column densities (usually dex for non-saturated lines observed with state-of-the-art high-resolution spectrographs used for such studies, e.g., Keck High-resolution Spectrograph, VLT UV Echelle Spectrograph, Magellan Inamori Kyocera Echelle spectrograph). It would also be useful to confirm the oscillator strengths of the 43 transitions of C I, Si I, P II, S I, Cl I, Ti I, Ti II, Mn I, Mn II, Fe II, Ni II, Kr I, and Pb II for which the differences in the oscillator strengths are dex. Such improvements in atomic data are crucial to obtain accurate element abundances in distant galaxies, which are needed to quantitatively test models of cosmic chemical evolution. Indeed, improved atomic data will be invaluable for accurately interpreting the large samples of spectra of high-redshift quasars, gamma-ray bursts, and star-forming galaxies that will be enabled by future extremely large telescopes.
| (dex) | No. of lines | % lines |
|---|---|---|
| 198 | 58.2 | |
| 55 | 16.2 | |
| 35 | 10.3 | |
| 15 | 4.4 | |
| 6 | 1.8 | |
| 19 | 5.6 | |
| no change | 12 | 3.5 |
Note. — This table compares the former and current oscillator strength values for 340 lines. The remaining 236 lines were either newly tabulated by the authors or no improved update was found for the former value.
References
- Andersen et al. (1979) Andersen, T., Eriksen, P., Poulsen, O., & Ramanujam, P. S. 1979, PhRvA, 20, 2621
- Bahcall et al. (1993) Bahcall, J. N., Bergeron, J., Boksenberg, A., et al. 1993, ApJS, 87, 1
- Banfield & Huber (1973) Banfield, F. P. & Huber, M. C. E. 1973, ApJ, 186, 335
- Bautista et al. (2009) Bautista, M. A., Quinet, P., Palmeri, P., et al. 2009, A&A, 508, 1527
- Bergeson et al. (1996) Bergeson, S. D., Mullman, K .L., Wickliffe, M. E., et al. 1996, ApJ, 464, 1044
- Biémont et al. (1998) Biémont, E., Garnir, H. P., Federman, S. R., Li, Z. S., & Svanberg, S. 1998, ApJ, 502, 1010
- Biémont et al. (1998) Biémont, E., Morton, D. C., & Quinet, P. 1998, MNRAS, 297, 713
- Blackwell et al. (1979) Blackwell, D. E., Ibbetson, P. A., Petford, A. D., & Shallis, M. J. 1979, MNRAS, 186, 633
- Blackwell-Whitehead et al. (2005) Blackwell-Whitehead, R. J., Xu, H. L., Pickering, J. C., Nave, G., & Lundberg, H. 2005, MNRAS, 361, 1281
- Blackwell-Whitehead et al. (2006) Blackwell-Whitehead, R. J., Lundberg, H., Nave, G. et al. 2006, MNRAS, 373, 1603
- Blackwell-Whitehead et al. (2011) Blackwell-Whitehead, R. J., Pavlenko, Y. V., Nave, G., et al. 2011, A&A, 525, A44
- Brown et al. (2009) Brown, M. S., Federman, S. R., Irving, R. E., Cheng, S., & Curtis, L. J. 2009, ApJ, 702, 880
- Butler & Zeippen (1991) Butler, K. & Zeippen, C. J. 1991, J. Phys. IV (France) 1, C1-141–C1-152
- Cardon et al. (1982) Cardon, B. L., Smith, P. L., Scalo, J. M., Testerman, L., & Whaling, W. 1982, ApJ, 260, 395
- Cassidy et al. (2016) Cassidy, C. M., Hibbert, A., & Ramsbottom, C. A. 2016, A&A, 587, A107
- Çelik et al. (2015) Çelik, G., Ateş, Ş., & Erol, E. 2015, CJPh, 93, 1015
- Chan et al. (1992) Chan, W. F., Cooper, G., Guo, X., Burton, G. R., & Brion, C. E. 1992, PhRvA, 46, 149
- Chang & Tang (1990) Chang, T. N. & Tang, X. 1990, JQSRT, 43, 207
- Charro & Martin (2000) Charro, E. & Martin, I. 2000, ApJS, 126, 551
- Chi & Chou (2014) Chi, H.-C., & Chou, H.-S. 2014, JPhB, 47, 055002
- Colón et al. (2001) Colón, C. & Alonso-Medina, A. 2001, CJPh, 79, 999
- Curtis (1992) Curtis, L. J. 1992, JOSAB, 9, 5
- Curtis & Smith (1974) Curtis L. J. & Smith, W. H. 1974, PhRvA, 9, 1537
- Deb & Hibbert (2006) Deb, N. C. & Hibbert, A. 2006, JPhB, 39, 4301
- Deb & Hibbert (2008) Deb, N. C. & Hibbert, A. 2008, ADNDT, 94, 561
- Deb & Hibbert (2009) Deb, N. C. & Hibbert, A. 2009, ADNDT, 95, 184
- Den Hartog et al. (2011) Den Hartog, E. A., Lawler, J. E., Sobeck, J. S., Sneden, C., & Cowan, J. J. 2011, ApJS, 194, 35
- Doidge (1995) Doidge, P. S. 1995, AcSpe, 50, 209
- Donnelly & Hibbert (2001) Donnelly, M. P. & Hibbert, A. 2001, MNRAS, 321, 247
- Donnelly et al. (1999) Donnelly, M. P., Hibbert, A., & Bell, K. L. 1999, PhyS, 59, 32
- Davidson et al. (1990) Davidson, M. D., Volten, H., & Dönszelmann, A. 1990, A&A, 238, 452
- Fawcett (1986) Fawcett, B. C. 1986, ADNDT, 35, 203
- Froese Fischer (2002) Froese Fischer, C. 2002, The MCHF/MCDHF Collection, http://nlte.nist.gov/MCHF/
- Froese Fischer (2006) Froese Fischer, C. 2006, JPhB, 39, 2159
- Froese Fischer & Tachiev (2003) Froese Fischer, C. & Tachiev, G. 2003, PhRvA, 68, 012507
- Froese Fischer & Tachiev (2004) Froese Fischer, C. & Tachiev, G. 2004, ADNDT, 87, 1
- Froese Fischer et al. (2006) Froese Fischer, C., Tachiev, G., & Irimia, A. 2006, ADNDT, 92, 607
- Froese Fischer & Zatsarinny (2007) Froese Fischer, C., & Zatsarinny, O., 2007, Theor. Chem. Accounts, 118, 623
- Fuhr & Wiese (2005) Fuhr, J. R. & Wiese, W. L. 2005, CRC Handbook of Chemistry and Physics, 86th Edition, 10-93-10-155 (Edited by D. R. Lide, CRC Press, Boca Raton, FL, 2005)
- Fuhr & Wiese (2006) Fuhr, J. R. & Wiese, W. L. 2006, JPCRD, 35, 1669
- Głowacki & Migdałek (2006) Głowacki, L., & Migdałek, J. 2006, JPhB, 39, 1721
- Hannaford & McDonald (1978) Hannaford, P. & McDonald, D. C. 1978, JPhB, 11, 1177
- Hibbert et al. (1991) Hibbert, A., Biémont, E., Godefroid, M. & Vaeck, N. 1991, JPhB, 24, 3943
- Huber & Sandeman (1980) Huber, M. C. E. & Sandeman, R. J. 1980, A&A, 86, 95
- Jenkins (2009) Jenkins, E. B. 2009, ApJ, 700, 1299
- Jönsson et al. (2006) Jönsson P., Andersson, M., Sabel, H., & Brage, T. 2006, JPhB, 39, 1813
- Kallman & Palmeri (2007) Kallman, T. R., & Palmeri, P. 2007, RvMP, 79, 79
- Kelleher & Podobedova (2008) Kelleher D. E. & Podobedova, L. I. 2008, JPCRD, 37, 1285
- Kisielius et al. (2014) Kisielius, R., Kulkarni V. P., Ferland, G. J., Bogdanovich P., & Lykins M. L. 2014, ApJ, 780, 76
- Kisielius et al. (2015) Kisielius R., Kulkarni V. P., Ferland G. J., et al. 2015, ApJ, 804, 76
- Kling & Griesmann (2000) Kling, R. & Griesmann, U. 2000, ApJ, 531, 1173
- Kluge & Sauter (1974) Kluge, H.J. & Sauter, H. 1974, ZPhy, 270, 295
- Kowalski & Träger (1976) Kowalski, J., & Träger, F. 1976, ZPhy, 278, 1
- Kramida et al. (2016) Kramida, A., Ralchenko, Yu., Reader, J., and NIST ASD Team 2016, NIST Atomic Spectra Database (version 5.4), [Online] http://physics.nist.gov/asd [2016, December 29] National Institute of Standards and Technology, Gaithersburg, MD
- Kurucz (2016) Kurucz, R. L. 2016, http://kurucz.harvard.edu/atoms.html [2016, December 29]
- Kulkarni et al. (2005) Kulkarni, V. P., Fall, S. M., Lauroesch, J. T. et al. 2005, ApJ, 618, 68
- Lauer et al. (1999) Lauer, S., Liebel, H., Vollweiler, F., et al. 1999, JPhB, 32, 2015
- Lawler et al. (2013) Lawler, J. E., Guzman, A., Wood, M. P., Sneden, C., & Cowan, J. J. 2013, ApJS, 205, 11
- Lawler et al. (2015) Lawler, J. E., Sneden, C., & Cowan, J. J. 2015, ApJS, 220, 13
- Lehner et al. (2013) Lehner, N., Howk, J. C., Tripp, T. M., et al. 2013, ApJ, 770, 138
- Li et al. (1999) Li, Z.-S., Norin, J., Persson, A., et al. 1999, PhRvA, 60, 198
- Lundberg et al. (2016) Lundberg, H., Hartman, H., L. Engström, L., et al. 2016, MNRAS, 460, 356
- Lurio et al (1964) Lurio, A., DeZafra, R. L., Goshen, R. J. 1964, PhRvA, 134, 1198
- Lykins et al. (2015) Lykins, M. L., Ferland, G. J., Kisielius R., et al. 2015, ApJ, 807, 118
- Martin et al. (1988) Martin, G. A., Fuhr, J. R., & Wiese, W. L. 1988, JPCRD, 17, Suppl. 3, 512
- Martinson et al. (1979) Martinson, I., L. J. Curtis, L. J., Huldt, S. 1979, PhyS, 19, 17
- McElroy & Hibbert (2005) McElroy, T., & Hibbert, A. 2005, PhyS, 71, 479
- Mendoza et al. (1995) Mendoza, C., Eissner, W., Le Dourneuf, M., & Zeippen, C. J. 1995, JPhB, 28, 3485
- Migdalek & Kim (1998) Migdalek, J., & Kim, Y.-K. 1998, JPhB, 31, 1947
- Mitchell (1975) Mitchell, C. J. 1975, JPhB, 8, 25
- Moos et al. (2000) Moos, H. W., Cash, W. C., Cowie, L. L., et al. 2000, ApJ, 538, L1
- Morris et al. (1991) Morris, S. L., Weymann, R. J., Savage, B. D., & Gilliland, R. L. 1991, ApJ, 377, L21
- Morton (2003) Morton, D. C. 2003, ApJS, 149, 205
- Mullman et al. (1998a) Mullman, K. L., Cooper, J. C., & Lawler, J. E. 1998a, ApJ, 495, 503
- Mullman et al. (1998b) Mullman, K. L., Lawler, J. E., Zsargó, J., & Federman, S. R. 1998b, ApJ, 500, 1064
- Nahar & Pradhan (1993) Nahar, S. N. & Pradhan, A. K. 1993, JPhB, 26, 1109
- Nilsson et al. (2006) Nilsson, H., Ljung, G., Lundberg, H., & Nielsen, K. E. 2006, A&A, 445, 1165
- O’Brian et al. (1991) O’Brian, T. R., Wickliffe, M. E., Lawler, J. E., Whaling, W., & Brault, J. W. 1991, JOSAB, 8, 1185
- Oliver & Hibbert (2013) Oliver, P. & Hibbert, A. 2013, ADNDT, 99, 459
- Ostrovskii & Penkin (1961) Ostrovskii, Yu. I. & Penkin, N. P. 1961, OpSp, 10(4), 219
- Pagan et al. (1996) Pagan, C. J. B., Raineri, M., Bredice, F., et al. 1996, JQSRT, 55, 163
- Parkinson et al. (1976) Parkinson, W. H., Reeves E. M., Tomkins, F. S. 1976, JPhB, 9, 157
- Peach et al. (1988) Peach, G., Saraph, H. E. & Seaton, M. J. 1988, JPhB, 21, 3669
- Pickering et al. (2001a) Pickering, J. C., Johansson, S., & Smith, P. L. 2001, A&A, 377, 361
- Pickering et al. (2001b) Pickering, J. C., Thorne, A. P., & Perez, R. 2001, ApJS, 132, 403
- Pinnington et al. (1981) Pinnington, E. H., Bahr, J. L., & Irwin, D. J. G. 1981, PhL, 84A, 247
- Quinet et al. (2007) Quinet, P., Biémont, E., Palmeri, P., & Xu, H. L. 2007, JPhB, 40, 1705
- Raassen et al. (1998) Raassen, A. J. J., Pickering, J. C., & Uylings, P. H. M. 1998, A&AS, 130, 541
- Raassen & Uylings (1997) Raassen, A. J. J. & Uylings, P. H. M. 1997, A&AS, 123, 147
- Raassen & Uylings (1998) Raassen, A. J. J. & Uylings, P. H. M. 1998, JPhB, 31, 2137
- Rogerson et al. (1973) Rogerson, J. B., Spitzer, L., Drake, J. F., et al. 1973, ApJ, 181, L97
- Ruczkowski et al. (2014) Ruczkowski, J., Elantkowska, M., & Dembczyński, J. 2014, JQSRT, 149, 168
- Safronova et al. (2005) Safronova, U. I., Cowan, T. R., & Safronova, M. S. 2006, JPhB, 39, 749
- Safronova & Safronova (2011) Safronova, M. S., & Safronova, U. I. 2011, PhRvA, 83, 012503
- Safronova et al. (2005) Safronova, M. S., Safronova, U. I., & Johnson, W. R. 2005, PhRvA, 71, 052506
- Savage & Sembach (1996) Savage, B. D., & Sembach, K. R. 1996, ARA&A, 34, 279
- Schectman et al. (2005) Schectman, R. M., Federman, S. R., Brown, M., et. al. 2005, ApJ, 621, 1159
- Shabanova & Khlyustalov (1985) Shabanova, L. N. & Khlyustalov, A. N. 1985, OpSp, 59, 123
- Shabanova (1963) Shabanova, L. N. 1963, OpSp, 15(6), 828
- Shirai et al. (2007) Shirai, T., Reader, J., Kramida, A. E., & Sugar, J. 2007, JPCRD, 36, 509
- Siegel et al. (1998) Siegel, W., Migdalek, J., & Kim, Y.-K. 1998, ADNDT 68, 303
- Sobeck et al. (2007) Sobeck, J. S., Lawler, J. E., & Sneden, C. 2007, ApJ, 667, 1267
- Som et al. (2015) Som, D., Kulkarni, V. P., Meiring, J., et al. 2015, ApJ, 806, 25
- Smith et al. (1987) Smith, P. L., Huber, M. C. E., Tozzi, G. P., et al. 1987, ApJ, 322, 573
- Smith & Kühne (1978) Smith, P. L. & Kühne, M. 1978, RSPSA, 362, 263
- Spitzer & Jenkins (1975) Spitzer, L., & Jenkins, E. B. 1975, ARA&A, 13, 133
- Tayal (2009) Tayal, S. S. 2009, PhyS, 79, 015303
- Tayal & Zatsarinny (2010) Tayal, S. S. & Zatsarinny, O. 2010, ApJS, 188, 32
- Toner & Hibbert (2005) Toner, A. & Hibbert, A. 2005, MNRAS, 361, 673
- Tumlinson et al. (2013) Tumlinson, J., Thom, C., Werk, J. K., et al. 2013, ApJ, 777, 59
- Verner et al. (1994) Verner, D. A., Barthel, P. D., & Tytler, D. 1994, A&AS, 108, 287
- Vujnović et al. (2002) Vujnović, V., Blagoev, K., Fürböck, C., Neger, T., & Jäger, H. 2002, A&A, 388, 704
- Wang et al. (1997) Wang, H., Li, J., Wang, X. T., et al. 1997, PhRvA, 55, R1569
- Werk et al. (2016) Werk, J. K., Prochaska, J. X., Cantalupo, S. et al. 2016, ApJ, 833, 54
- Wood et al. (2014) Wood, M. P., Lawler, J. E. Sneden, C., & Cowan, J. J. 2014, ApJS, 211, 20
- Yan et al. (1998) Yan, Z.-C., Tambasco, M., & Drake, G. W. F. 1998, PhRvA, 57, 1652
- York (1974) York, D. G. 1974, ApJ, 193, L127
- Zatsarinny & Bartschat (2006) Zatsarinny, O. & Bartschat, K. 2006, PhRvL, 39, 2861
- Zatsarinny & Bartschat (2009) Zatsarinny, O. & Bartschat, K. 2009, PhyS, T134, 014020
- Zatsarinny et al. (2009) Zatsarinny, O., Bartschat, K., Gedeon, S., et al. 2009, JPhB, 79, 052709
- Zatsarinny & Froese Fischer (2002) Zatsarinny, O. & Froese Fischer, C. 2002, JPhB, 35, 4669
- Zinner et al. (2000) Zinner, G., Binnewies, T., Riehle, F., & Tiemann E. 2000, PhRvL, 85, 2292