Galactic Dark Matter Halos and Globular Cluster Populations. III: Extension to Extreme Environments
Abstract
The total mass in the globular cluster (GC) system of a galaxy is empirically a near-constant fraction of the total mass of the galaxy, across a range of in galaxy mass. This trend is radically unlike the strongly nonlinear behavior of total stellar mass versus . We discuss extensions of this trend to two more extreme situations: (a) entire clusters of galaxies, and (b) the Ultra-Diffuse Galaxies (UDGs) recently discovered in Coma and elsewhere. Our calibration of the ratio from normal galaxies, accounting for new revisions in the adopted mass-to-light ratio for GCs, now gives as the mean absolute mass fraction. We find that the same ratio appears valid for galaxy clusters and UDGs. Estimates of in the four clusters we examine tend to be slightly higher than for individual galaxies, but more data and better constraints on the mean GC mass in such systems are needed to determine if this difference is significant. We use the constancy of to estimate total masses for several individual cases; for example, the total mass of the Milky Way is calculated to be . Physical explanations for the uniformity of are still descriptive, but point to a picture in which massive, dense star clusters in their formation stages were relatively immune to the feedback that more strongly influenced lower-density regions where most stars form.
Subject headings:
galaxies: formation — galaxies: star clusters — globular clusters: general1. Introduction
Two decades ago, Blakeslee et al. (1997) used observations of brightest cluster galaxies (BCGs) to propose that the number of globular clusters (GCs) in giant galaxies is directly proportional to the total mass of the host galaxy, which in turn is dominated by the dark matter (DM) halo. This suggestion was followed up with increasing amounts of observational evidence in several papers, including McLaughlin (1999b); Blakeslee (1999); Spitler & Forbes (2009); Georgiev et al. (2010); Kruijssen (2015), Hudson et al. (2014) (hereafter Paper I), Harris et al. (2015) (hereafter Paper II), and Forbes et al. (2016), among others (see Paper II for a more complete review of the literature). This remarkable trend may be a strong signal that the formation of GCs, most of which happened in the redshift range , was relatively resistant to the feedback processes that hampered field-star formation (e.g. Kravtsov & Gnedin, 2005; Moore et al., 2006; Li et al., 2016). If that is the case, then the total mass inside GCs at their time of formation may have been closely proportional to the original gas mass present in the dark-matter halo of their parent galaxy (Papers I, II, and Kruijssen, 2015), very unlike the total stellar mass .
Blakeslee et al. (1997) introduced the number ratio (where is the total number of GCs in a galaxy) and showed that it was approximately constant for their sample of BCGs, at least when measured within a fixed physical radius. Following Spitler & Forbes (2009), Georgiev et al. (2010), and our Papers I and II in this series, here we discuss the link between GC populations and galaxy total mass in terms of the dimensionless mass ratio , where is the total mass of all the GCs combined and is the total galaxy mass including its dark halo plus baryonic components. In some sense, represents an absolute efficiency of GC formation, after accounting for subsequent dynamical evolution up to the present day (cf. Katz & Ricotti, 2014; Kruijssen, 2015; Forbes et al., 2016). Direct estimates of for several hundred galaxies indicate that this ratio is indeed nearly uniform (Papers I and II), far more so than the more well known ratio . A second-order dependence on galaxy type has been found in the sense that S/Irr galaxies have a % lower than do E/S0 galaxies (Paper II).
So far, the case that has been built on the observed GC populations in ‘normal’ galaxies covering the range from dwarfs to giants. However, opportunities have recently arisen to extend tests of its uniformity in two new directions. The first is by using the GC populations in entire clusters of galaxies, including their GCs in the Intracluster Medium (ICM). The second is from the newly discovered ultra-diffuse galaxies (UDGs) and the GCs within them. It is also worth noting that in both these cases, the masses of the systems concerned have been measured with different methods than by the gravitational-lensing approach used to build the calibration of in our Papers I and II, which makes the test of the hypothesis even more interesting.
The plan of this paper is as follows. In Section 2, we describe improved methodology for determining , followed by a recalibration of the mass ratio . In Section 3 the discussion is extended to include four clusters of galaxies in which measurements now exist for both and , while in Section 4 the relation is extended in quite a different direction to selected UDGs. In Section 5, the key ratio is applied to several interesting sample cases with accompanying predictions for their GCS sizes. We finish with brief comments about the implications of the constancy of for understanding the conditions of formation for GCs.
2. Recalibration of the Mass Ratio: Method
The total GCS mass within a galaxy or cluster of galaxies is calculated as
| (1) |
where represents the number of GCs per unit luminosity , and is their mass-to-light ratio. Here, we use band luminosities following most previous studies. The GC luminosity function (GCLF) is assumed to have a Gaussian distribution in number per unit magnitude. The parameters defining , namely the Gaussian turnover magnitude and intrinsic dispersion , are in turn weak functions of galaxy luminosity, as described in Villegas et al. (2010); Harris et al. (2013, 2014). From the observations covering a large range of host galaxies, and both exhibit shallow increases as galaxy luminosity increases.
In the present paper, unlike all previous discussions of this topic, we now assume that the mass-to-light ratio for individual GCs is also a function of GC mass, following empirical evidence from recent literature (e.g. Rejkuba et al., 2007; Kruijssen, 2008; Kruijssen & Mieske, 2009; Strader et al., 2011). Of necessity, however, we assume that follows the same function of GC mass (or luminosity, which is the more easily observable quantity) within all galaxies.
In the Appendix below, we assemble recent observational data and define a convenient interpolation function for versus GC luminosity. Using Eq. 1, we can then readily derive a mean mass-to-light ratio averaged over all GCs in any given galaxy, defined as . We can also define a mean GC mass as .111By convention, to maintain a consistent calculation procedure, the GCLF is assumed to be Gaussian and is defined for our purposes as twice the number of GCs brighter than the GCLF turnover point; see Harris et al. (2013). For example, for a typical galaxy at (the type of galaxy within which most GCs in the universe are found; see Harris, 2016), we obtain . The mean ranges from for very small dwarfs () up to for very luminous supergiants ().
In Figure 1 the trends of GC mean mass and global are plotted versus galaxy luminosity . Accurate numerical approximations to these results are given by the interpolation curves
| (2) |
and
| (3) |
The intrinsic galaxy-to-galaxy scatter in is dex, based on the observations from the Virgo and Fornax clusters (Villegas et al., 2010).
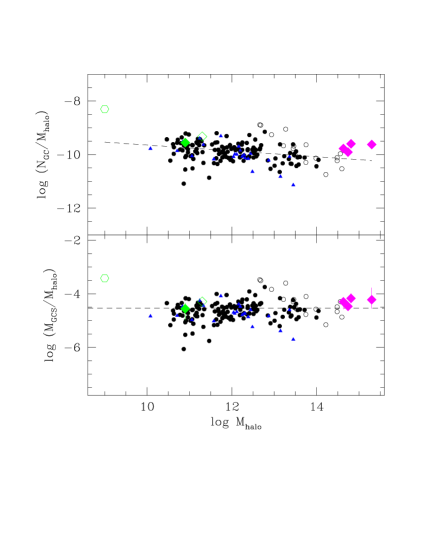
We have used these calibrations to recalculate the values of and in the complete sample of galaxies discussed in Papers I and II. In particular, for this paper we use these recalibrated values for the 175 ‘best’ galaxies of all types used in Paper II.222This ‘best’ sample consists of all the galaxies for which the raw GC photometry was of high enough quality to separate the conventional red and blue GC subpopulations. In most cases this criterion also means that the limiting magnitude of the photometry was faint enough to be near the GCLF turnover, making the calculation of the total population relatively secure. In addition, to help tie down the high-mass end of the range of galaxies, we have updated the values for five Brightest Cluster Galaxies (BCGs) including NGC 4874, 4889, 6166, UGC 9799, and UGC 10143 from the recent data of Harris et al. (2016, ApJ in press).
The results are shown in Figure 2. First, the upper panel shows the number per unit mass versus (following the notation convention of Georgiev et al. 2010). An unweighted least-squares fit to the E/S0 galaxies gives the simple linear relation
| (4) |
Thus the total number of GCs in galaxies, observed at redshift 0, scales approximately as . The rms scatter around this relation is dex.
Second, the lower panel shows the trend for the mass ratio . Because the mean mass of the GCs increases progressively with galaxy mass, the shallow decrease of with nearly cancels, leaving the mass ratio approximately constant over the entire run of galaxies. The weighted mean is , or , with a residual rms scatter dex.

In Fig. 2, the lower panel () and the upper panel () are obviously closely linked, but they are not entirely equivalent. As described in Paper I, is deduced from the band luminosity as calibrated through gravitational lensing. On the other hand, is derived from and the visual luminosity through Eq. (1).
Five points near sit anomalously high above the mean relations. These five are NGC 4636 and the BCGs NGC 3258, 3268, 3311, 5193. The cluster populations for these systems are well determined and very unlikely to be overestimated by the factor of that would be needed to bring them back to the mean lines. The alternate possibility is that their halo masses may have been underestimated, which in turn means that the band luminosities of these very large galaxies (from 2MASS; see Harris et al., 2013) would have to be underestimated (see Schombert & Smith, 2012; Scott et al., 2013, for more extensive comments in this direction).
3. Clusters of Galaxies
Useful estimates of the total GC populations within entire clusters of galaxies have now been made for four rich clusters: Virgo, Coma, Abell 1689, and Abell 2744 (sources listed below). This material has in each case taken advantage of wide-field surveys or unusually deep sets of images taken with HST. The quoted values include both the GCs associated directly with the individual member galaxies, and the intracluster globular clusters (IGCs) that are now known to be present in rich clusters. It is likely that the IGCs represent GCs stripped from many different systems during the extensive history of galaxy/galaxy merging and harassment that takes place within such environments (Peng et al., 2011). Simulations (e.g. Purcell et al., 2007) show that type galaxies contribute the most to the Intracluster light. For such galaxies the mean globular cluster mass is (Fig. 1), and the GCLF mean and dispersion are , mag (Harris et al., 2013). However, the total GC population in the entire cluster of galaxies consists of the IGCs plus the individual galaxies in roughly similar amounts. For the giant ellipticals and BCGs that dominate the individual galaxies, the GCLFs are broader with and is higher. For the present purpose, we therefore adopt averages mag and for an entire galaxy cluster. Knowing , the total mass in all the GCs within the cluster can then be directly estimated, albeit with more uncertainty than for a single galaxy.
Virgo: Durrell et al. (2014), from the Next Generation Virgo Cluster Survey, calculate that the entire cluster contains GCs brighter than , which is 0.2 mag fainter than the GCLF turnover point. Adopting the fiducial value mag as explained above, we then obtain , which then gives . Durrell et al. also quote a total Virgo mass , leading to . This estimate is 17% higher than the value quoted by Durrell et al. (2014), but the increase results entirely from the difference in assumed . Just as for the Coma survey data (discussed below), in this case the limiting magnitude of the survey is close to the GCLF turnover (peak) magnitude, so that approximately half the total GC population is directly observed, and the estimated count is virtually independent of the assumed GCLF dispersion .
Coma: Peng et al. (2011) find that within a projected radius of kpc, the cluster contains GCs (here we combine their estimates of internal and systematic uncertainties, and renormalize the total to mag instead of their value of 1.37 mag), and thus . This survey radius is well within the Coma virial radius, which is Mpc (e.g. Hughes, 1989; Colless & Dunn, 1996; Rines et al., 2003; Łokas & Mamon, 2003; Kubo et al., 2007; Gavazzi et al., 2009; Okabe et al., 2014; Falco et al., 2014). From these sources, which use methods including X-ray light, galaxy dynamics, weak lensing, and galaxy sheets to derive the Coma mass profile, the mass within the GC survey radius of 520 kpc is . The resulting mass ratio within this radius is then .
A1689: Alamo-Martínez et al. (2013) used unusually deep HST imaging of the core region of this massive cluster, which is at redshift , to find a large and extended population of GCs. In contrast to Virgo and Coma, the limiting magnitude of their photometry was 2.3 mag brighter than the expected GCLF turnover and thus only the brightest 4.0% of the GC population was measurable. From an analysis of the known statistical and systematic uncertainties, they deduced GCs within a projected 400-kpc radius of the central cD-type galaxy after using a GCLF-extrapolated fit to the observed number of GCs brighter than the photometric limit. However, that number assumed mag; converting to our fiducial mag, the total becomes (97,100, 66,000) within kpc. From gravitational lensing, the total mass within the same radius is . The resulting mass ratio is then . We can attempt to define something closer to a global value out to larger radius by extrapolating the best-fit -law derived to the full GC distribution in A1689 (their fit for the case without masking the regions around the galaxies), which suggests that the estimated number of GCs out to 1 Mpc is larger by a factor of 1.48. From the multi-probe mass profile of Umetsu et al. (2015, using ), the total mass within the same radius is . We therefore estimate, for the whole cluster, within Mpc. The total mass of A1689 out to the virial radius exceeds , and thus the global value of might be still lower. In any case, given the uncertainties, the value of in A1689 appears consistent with the standard range calculated above.
A2744: Lee & Jang (2016) have used HST imaging from the HST Frontier Field to find the brightest GCs and UCDs in this very rich cluster, which is at redshift . Intracluster Light (ICL) is also detectably present at least in the inner part of the cluster (Montes & Trujillo, 2014). From M. G. Lee (private communication), the raw number of observed GCs brighter than , after photometric completeness correction, field subtraction and removal of UCDs, is (Poisson uncertainty). This limiting magnitude is mag brighter than the GCLF turnover point, or 2.93 short of the turnover. Here, we have adopted a mag brightening of the GCLF turnover luminosity to account for passive evolution for its redshift of ; note that Alamo-Martínez et al. (2013) determined a net brightening in of 0.12 mag in A1689 (), and for small the correction scales nearly linearly. Extrapolating from the observed total, then .
Given that only 0.2% of the inferred total was actually detected, the dominant sources of error in this case are not the internal count statistics, but instead the uncertainties in the adopted GCLF turnover and dispersion, as well as the basic assumption that the GCLF follows a strictly Gaussian shape all the way to luminosities far above the turnover magnitude. These uncertainties are unimportant for situations like Virgo and Coma where the raw observations reach to limiting magnitudes approaching the turnover magnitude , but they become critically important where only the bright tip of the GCLF is observed. The turnover exhibits an intrinsic galaxy-to-galaxy scatter at the level of mag, while the dispersion has an intrinsic scatter of mag (Jordán et al., 2006; Villegas et al., 2010; Rejkuba, 2012). For the baseline values of mag and a limiting magnitude 2.93 brighter than the turnover, the fraction equals 0.0017 due to a mag uncertainty in the turnover luminosity, and an additional due to a mag uncertainty in . Treating the uncertainties as independent, we obtain . If we further assume the GC counts extend out to 600 kpc (the limit that can be probed within the ACS field of view at this redshift) and follow a similar profile to that of A1689, then the correction to a radius of 1 Mpc is a factor of 1.21, yielding .
The best-estimate mass of A2744 is also difficult to pin down, since the cluster has complex internal dynamics with two major subclusterings at quite different mean velocities, indicative of merging in progress (Boschin et al., 2006; Owers et al., 2011; Jauzac et al., 2016). For the dominant central ”a” subcluster Boschin et al. (2006) determine . With this value for the mass, we conclude for A2744.
The underlying assumption about the Gaussian GCLF shape is harder to quantify. The strongest empirical test available is the measurement of GCLFs in seven BCG galaxies from Harris et al. (2014), which extend from the turnover point to an upper limit almost 5 magnitudes brighter (equivalent to almost ), thanks to the extremely large numbers of GCs per galaxy. The results indicate that the Gaussian assumption fits the data remarkably well to that level. However, these tests all apply to single galaxies, whereas the IGCs are a composite population of GCs stripped from galaxies of all types. This composite GCLF will in general not have a simple Gaussian shape even if all the progenitor galaxies had individually normal GCLFs (see Gebhardt & Beers, 1991). Unfortunately, no direct measurements of the GCLF for a pure IGC population are yet available. For the present time, we simply adopt the parameters for galaxy clusters as described above and recognize that further observations and analysis could change the results for A2744 quite significantly. While uncertainties are also sizable for A1689, the fraction of the GC population directly observed there is 20 to 40 times greater than in A2744; thus, the results for A1689 are robust by comparison.
It is evident from the preceding discussion that estimates of on the scale of entire clusters of galaxies put us in a much more challenging regime of uncertainties than is the case for single galaxies. In particular, better results will be possible if as a function of can be more accurately established. Ideally the global value should be estimated out to the virial radius, but so far this is the case only for Virgo, the cluster for which the estimated is closest to the mean for individual galaxies. Nevertheless, for all four galaxy clusters, the weighted average result is , slightly larger than the mean value of characterizing the individual galaxies. It is difficult to say at this point whether or not the mean difference is significant. One possible evolutionary difference between the GCs within galaxies and the IGCs is that the IGCs are subjected to much lower rates of dynamical destruction than the GCs deep within the potential wells of individual galaxies, and so may have kept a higher fraction of their initial mass.
4. Ultra-Diffuse Galaxies
UDGs have recently been found within the Virgo, Fornax, and Coma clusters in large numbers (e.g. Mihos et al., 2015; van Dokkum et al., 2015; Koda et al., 2015; Muñoz et al., 2015). Deep imaging has revealed GC populations around two of the Coma UDGs, Dragonfly 44 (van Dokkum et al., 2016) and Dragonfly 17 (Peng & Lim, 2016), as well as VCC1287 in Virgo (Beasley et al., 2016). All three of these systems have anomalously high specific frequencies , but the interest for this discussion is their mass ratio. Beasley et al. (2016) and van Dokkum et al. (2016) have already commented that for the two UDGs they studied falls close to the standard level applicable for more normal galaxies.
For the Virgo dwarf VCC1287, Beasley et al. (2016) find a GC population , which would translate to if we adopt a mean GC mass of appropriate for a moderate dwarf galaxy. Fortunately, does not vary strongly across the dwarf luminosity range (see Fig. 1). From a combination of the velocity dispersion of the GCs themselves, and comparison with EAGLE simulations, they estimate a virial mass for the galaxy of , giving an approximate mass ratio .
For Dragonfly 44, van Dokkum et al. (2016) find a relatively rich GC population and, again, a specific frequency higher by an order of magnitude than normal galaxies with similar . With for the galaxy luminosity , then . Their measurement of the velocity dispersion of the stellar light gives . The total (virial) mass is likely to be at least an order of magnitude higher, but scaling from the comparable results for VCC1287 above (see Beasley et al., 2016), we obtain a very rough estimate . In turn, the final result is , again very uncertain.
5. Discussion and Conclusions
From Fig. 2, we find that the near-constancy of the mass ratio over 5 orders of magnitude in remains valid. The addition of two quite different environments to the mix, UDGs and entire galaxy clusters, has not changed the essential result. It is worth noting that the estimates for the galaxy clusters and UDGs relied on internal dynamics rather than the weak-lensing calibration used for the normal galaxies (except A1689, for which the mass is based on a combination of weak and strong lensing). The new calibration of the mean mass ratio is significantly lower than in previous papers (see Paper II for comparisons); the difference is due mainly to our lower adopted GC mass-to-light ratio and its nonlinear dependence on GC mass. An additional residual outcome is that the slight nonlinearity in the trend of (see Papers I and II) is now reduced.
5.1. Galaxy Mass Estimation
In a direct practical sense, is usable as a handy way to estimate the total mass of a galaxy (dark plus baryonic) to better than a factor of 2. This direction is the emphasis taken notably by Spitler & Forbes (2009); van Dokkum et al. (2016); Peng & Lim (2016) and Beasley et al. (2016) and was also used in Paper I to apply to M31 and the Milky Way. As these authors emphasize, it remains surprising that a method apparently unconnected with internal satellite dynamics, lensing, or other fairly direct measures of a galaxy’s gravitational field can yield such an accurate result. The prescription for determining is:
-
1.
Count the total GC population, . Given the uncertainties discussed in Section 3 above and in Harris et al. (2013), it is important to have raw photometric data that reach or approach the GCLF turnover point, which helps avoid uncomfortably large extrapolations from observations that resolve only the bright tip of the GCLF.
-
2.
Use the galaxy luminosity to define the appropriate mean GC mass (from Fig. 1 and Eq. 2). The total mass in the galaxy’s GC system follows as .
-
3.
Divide by to obtain .
More generally, this method for estimating galaxy mass is workable only for systems near enough that the GC population can be resolved and counted. The practical ‘reach’ of the procedure is Mpc through deep HST imaging (e.g. Harris et al., 2014), though with the use of SBF techniques, the effective limit may be extended somewhat further; cf. Blakeslee et al. (1997); Blakeslee (1999); Marín-Franch & Aparicio (2002).
5.2. Sample Cases
We provide some sample specific examples of the procedure:
Milky Way: Harris (1996) (2010 edition) lists 157 GCs in the Milky Way, but many of these are extremely faint or sparse objects that would be undetectable in almost all other galaxies. To treat this system in the same way as other galaxies, we note that the GCLF turnover is at and that there are 72 clusters brighter than that point. Doubling this, we then adopt in the sense that it is defined here. At (Licquia et al., 2015; Bland-Hawthorn & Gerhard, 2016), close to an galaxy, the mean GC mass is then , from which . Finally then, , which is well within the mix of estimates obtained from a wide variety of methods involving satellite dynamics and Local Group timing arguments (see, e.g. Wang et al., 2015; Eadie & Harris, 2016, for compilations and comparisons).
Dragonfly 17: For this UDG in Coma, Peng & Lim (2016) estimate a total population based on a well sampled GCLF and radial distribution. For , we have and then predict a total mass for this galaxy. Peng & Lim (2016) predicted , although the agreement with our estimate is something of a coincidence: they used a higher value of from an older calibration, but also a higher mean GC mass, and these two differences cancelled out.
M87: This centrally dominant Virgo giant is the classic “high specific frequency” elliptical. From the GCS catalog (Harris et al., 2013), and the luminosity is , giving a mean cluster mass . Thus , leading to the prediction . For comparison, Oldham & Auger (2016) give from the kinematics of the GC system and satellites. A plausible upper limit from McLaughlin (1999a) is , obtained from the GC dynamics and the X-ray gas in the Virgo potential well, while Durrell et al. (2014) quote for the entire Virgo cluster. For BCGs it is difficult to isolate the galaxy’s dark-matter halo from that of the entire galaxy cluster, but given that M87 holds % of the Virgo GC population, these estimates of seem mutually consistent.
Fornax Cluster: Fornax is the next nearest rich cluster of galaxies after Virgo, with the cD giant NGC 1399 near its center. GC populations in the individual galaxies have been studied as part of the HST/ACS Fornax Cluster Survey (Villegas et al., 2010; Jordán et al., 2015), and the NGC 1399 system particularly has been well studied photometrically and spectroscopically (e.g. Dirsch et al., 2003; Schuberth et al., 2010). The Fornax cluster as a whole is not as rich as Virgo or the others discussed here, but an ICM is present at least in the form of substructured X-ray gas (Paolillo et al., 2002). Global mass measurements from galaxy dynamics in and around Fornax (Drinkwater et al., 2001; Nasonova et al., 2011) find (1.4 Mpc), rising to perhaps as high as within 3 Mpc. For NGC 1399 itself, Schuberth et al. (2010) find approaching . If we use the mean value determined above for the other galaxy clusters, and we also use within a radius of 1.4 Mpc, then we predict that the entire Fornax cluster should contain at least clusters. NGC 1399 alone has (Dirsch et al., 2003) and the other smaller galaxies together are likely to contribute at least 6000 more (Jordán et al., 2015). Thus the prediction and the actual known total agree to within the internal scatter of , which would indicate that the GC population within Fornax is already accounted for and that few IGCs remain to be found. It will be intriguing to see if wide-field surveys (see, e.g. D’Abrusco et al., 2016) will reveal a significant IGC population.
Fornax dSph: The dwarf spheroidal satellite of the Milky Way, Fornax, is an especially interesting case. It has 5 GCs of its own and a total luminosity of just , placing it among the very faintest galaxies known to contain GCs. Since it lacks a measured band luminosity it does not appear in the GCS catalog with a lensing-calibrated . The existence of this handful of GCs presents something of an interpretive puzzle for understanding their survival over a Hubble time, with several discussions of dynamical modelling in the recent literature (e.g. Cole et al., 2012; Strigari et al., 2006; Peñarrubia et al., 2008; Martinez, 2015). The 5 Fornax clusters add up to a total mass assuming (Mackey & Gilmore, 2003). The predicted halo mass of the galaxy should then be if we adopt our normal , which would give Fornax a global mass-to-light ratio (assuming that it has kept its entire halo to the present day against tidal stripping from the Milky Way). By contrast, dynamical modelling of Fornax with various assumed dark-matter profiles tends to infer virial masses near (Peñarrubia et al., 2008; Cole et al., 2012; Angus & Diaferio, 2009). In that case, the derived mass ratio would then be , an order of magnitude larger than our standard value. Fornax is plotted in Fig. 2 with this higher value; although it is not located outrageously far from the scatter of points defined by the larger galaxies, it does leave a continuing problem for interpretation. With and our baseline value , the normal prediction would be that Fornax should contain only one GC.
The Fornax dSph case hints that the argument for a constant across the range of galaxies may begin to break down at the very lowest luminosities. For a standard , the boundary below which dwarf galaxies should be too small to have any remaining GCs is near . In this very low-mass regime, other physical factors should also come into play determining the number of surviving GCs within the galaxy, particularly massive gas loss during the earliest star-forming period in such tiny potential wells.
5.3. Cluster Formation Conditions
In the longer term, we suggest that the more important implications for the near-constancy of are for helping understand the formation conditions of the dense, massive star clusters that evolved into the present-day GCs (see Papers I and II). These clusters should have formed within very massive host Giant Molecular Clouds (GMCs) under conditions of unusually high pressure and turbulence, analogous to the Young Massive Clusters (YMCs) seen today in starburst dwarfs, galactic nuclei, and merging systems (Harris & Pudritz, 1994; Elmegreen et al., 2012; Kruijssen, 2015).
Under such conditions, star formation within these dense protoclusters will be shielded from external feedback such as active galactic nuclei, UV and stellar winds from more dilute field star formation, and cosmic reionization (e.g. Kravtsov & Gnedin, 2005; Li & Gnedin, 2014; Howard et al., 2016). In strong contrast, these forms of feedback were much more damaging to the majority of star formation happening in lower-density, lower-pressure local environments. Though such a picture needs more quantitative modelling, it is consistent with the idea (Paper II) that at high redshift may be nearly proportional to the total initial gas mass – at least, much more so than the total stellar mass .
An alternate route (Kruijssen, 2015) is that the empirical result can be viewed in some sense as a coincidence if it is written as
| (5) |
The two ratios on the right-hand side show well known opposite trends with that happen to cancel out when multiplied together. The stellar-to-halo mass ratio (SHMR) () reaches a peak efficiency near and falls off to both higher and lower mass by more than an order of magnitude (Leauthaud et al., 2012; Moster et al., 2013; Behroozi et al., 2010, 2013; Hudson et al., 2015). By contrast, the GCS number per unit (that is, the specific frequency or its mass-weighted version ) reaches a minimum near and rises by an order of magnitude on both sides. Both these trends are extremely nonlinear, and we suggest that it is difficult to see how their mutual cancellation can be so exact over such a wide range of galaxy mass if it is only a coincidence.
The common factor between the two mass ratios (, SHMR) is the galaxy stellar mass . As in Paper II, we suggest that the result can be seen as the outcome of a single physical process (the role of galaxy-scale feedback on ). If instead we essentially ignore , then is closer to representing the total initial gass mass, and thus . We recognize, however, that this argument is as yet unsatisfactorily descriptive and will require full-scale numerical simulations that track GC formation within hierarchical galaxy assembly over the full range of redshifts (Kravtsov & Gnedin, 2005; Li et al., 2016; Griffen et al., 2010; Tonini, 2013).
5.4. Conclusions
In this paper we have revisited the empirical relation between the total mass of the globular clusters in a galaxy, and that galaxy’s total mass . Our findings are the following:
-
1.
A recalibration of the mass ratio , now including the systematic trend of GC mass-to-light ratio with GC mass, yields with a dex scatter between individual galaxies.
-
2.
Evaluation of for four clusters of galaxies (Virgo, Coma, A1689, A2744) including all GCs in both the cluster galaxies and the IGM, shows that very much the same mass ratio applies for entire clusters as for individual galaxies. For these four clusters .
-
3.
Two of the recently discovered Ultra-Diffuse Galaxies in Virgo and Coma can also now be included in the relation. Within the (large) measurement uncertainties, both such galaxies fall within the normal value of at the low-mass end of the galaxy range. By contrast, the Fornax dSph in the Local Group may be a genuine extreme outlier, containing perhaps 5 times more clusters than expected.
-
4.
The near-constant mass ratio between GC systems and their host galaxy masses is strikingly different from the highly nonlinear behavior of total stellar mass versus . We favor the interpretation that GC formation – in essence, star formation under conditions of extremely dense gas in proto-GCs embedded in turn within giant molecular clouds – was nearly immune to the violent external feedback that hampered most field star formation.
Acknowledgements
WEH acknowledges financial support from NSERC (Natural Sciences and Engineering Research Council of Canada). We are grateful to Myung Gyoon Lee for helpfully transmitting their observed numbers of globular clusters in Abell 2744. JPB thanks K. Alamo-Martínez for helpful discussions about Abell 1689.
Appendix A Mass-to-Light Ratios for Globular Clusters
A key ingredient in the calculation of , the total mass in the globular cluster system of a given galaxy, is the assumed mass-to-light ratio for GCs. Along with many other GC studies in recent years, we simply used a constant in Papers I and II. However, much recent data and modelling for internal dynamical studies of GCs supports (a) a lower mean value, (b) a significant cluster-to-cluster scatter probably because of differing dynamical histories, and (c) a systematic trend for to increase with GC mass (or luminosity) particularly for masses above .
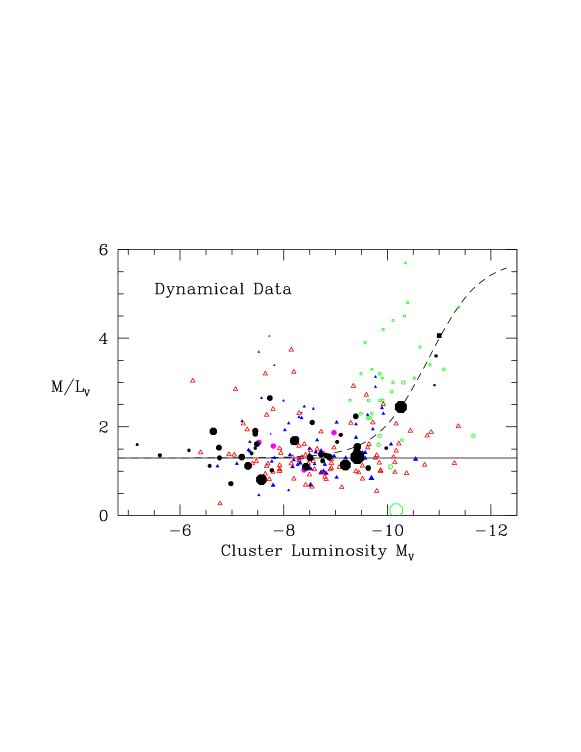
Figure 3 shows estimates of for Milky Way GCs, determined from measurements of GC internal velocity dispersion combined with dynamical modelling. Data from two widely used previous compilations (Mandushev et al., 1991; McLaughlin & van der Marel, 2005) are shown in the upper two panels of the Figure. Since then, dynamical studies have been carried out on numerous individual GCs based on both radial-velocity and proper-motion data, that are built on larger and more precise samples than in the earlier eras. Results from these post-2005 studies are listed in Table 1 and plotted in the bottom panel of Fig. 3. (Note that many clusters appear more than once because each individual study is plotted. However, the values listed in Table 1 present the weighted mean , in Solar units, for each cluster.) The cluster luminosities are from the catalog of Harris (1996) (2010 edition). For the clusters listed in Table 1, the weighted mean value for 36 GCs excluding NGC 5139 and NGC 6535 is with a cluster-to-cluster rms scatter of . For comparison, the values in the upper panel of Fig. 3 have a mean with an rms scatter of , while in the middle panel the mean is with an rms scatter of .
| Cluster | Sources | |||
|---|---|---|---|---|
| NGC104 | 1.32 | (0.03,0.03) | 6,15 | |
| NGC288 | 1.53 | (0.17,0.17) | 6,10,15 | |
| NGC362 | 1.10 | (0.10,0.10) | 6,15 | |
| NGC2419 | 1.55 | (0.10,0.10) | 1,15 | |
| NGC2808 | 2.24 | (0.19,0.19) | 6,9 | |
| NGC3201 | 1.91 | (0.17,0.17) | 15 | |
| NGC4147 | 1.47 | (0.54,0.54) | 6 | |
| NGC4590 | 1.40 | (0.43,0.43) | 6 | |
| NGC5024 | 1.38 | (0.16,0.16) | 6,10 | |
| NGC5053 | 1.30 | (0.26,0.26) | 6 | |
| NGC5139 | 2.45 | (0.04,0.04) | 12,13,15 | |
| NGC5272 | 1.32 | (0.14,0.14) | 4,6 | |
| NGC5466 | 0.72 | (0.23,0.23) | 6 | |
| NGC5904 | 1.36 | (0.21,0.21) | 6 | |
| NGC6121 | 1.32 | (0.14,0.14) | 6,15 | |
| NGC6205 | 2.10 | (0.27,0.17) | 4 | |
| NGC6218 | 1.12 | (0.10,0.10) | 6,10,15 | |
| NGC6254 | 1.61 | (0.19,0.19) | 15 | |
| NGC6341 | 1.69 | (0.07,0.07) | 4,6,15 | |
| NGC6388 | 1.45 | (0.13,0.13) | 8,14 | |
| NGC6397 | 1.9 | (0.10,0.10) | 5 | |
| NGC6402 | 1.82 | (0.35,0.35) | 6 | |
| NGC6440 | 1.23 | (0.27,0.27) | 14 | |
| NGC6441 | 1.07 | (0.19,0.19) | 6,14 | |
| NGC6528 | 1.12 | (0.39,0.42) | 14 | |
| NGC6535 | 11.06 | (2.68,2.12) | 14 | |
| NGC6553 | 1.02 | (0.31,0.36) | 14 | |
| NGC6656 | 1.30 | (0.13,0.13) | 6,15 | |
| NGC6715 | 1.52 | (0.45,0.45) | 6 | |
| NGC6752 | 2.65 | (0.19,0.19) | 6,10 | |
| NGC6809 | 0.81 | (0.05,0.05) | 3,6,10,15 | |
| NGC6838 | 1.36 | (0.39,0.39) | 6 | |
| NGC6934 | 1.52 | (0.49,0.49) | 6 | |
| NGC7078 | 1.14 | (0.05,0.05) | 6,11,15 | |
| NGC7089 | 1.66 | (0.38,0.38) | 6 | |
| NGC7099 | 1.84 | (0.19,0.19) | 6,10 | |
| Pal 5 | 1.60 | (0.85,0.59) | 7 | |
| Pal 13 | 2.4 | (5.0,2.4 ) | 2 |
Sources: (1) Bellazzini et al. (2012); (2) Bradford et al. (2011); (3) Diakogiannis et al. (2014); (4) Kamann et al. (2014); (5) Kamann et al. (2016); (6) Kimmig et al. (2015); (7) Küpper et al. (2015); (8) Lützgendorf et al. (2011); (9) Lützgendorf et al. (2012); (10) Sollima et al. (2012); (11) van den Bosch et al. (2006); (12) van de Ven et al. (2006); (13) Watkins et al. (2013); (14) Zaritsky et al. (2014); (15) Zocchi et al. (2012).

There is also now much new observational material for GC mass measurements in other nearby galaxies. For other galaxies, the spatial structures of the GCs are unresolved or only partially resolved, and the measurements most often consist of a luminosity-weighted average of the internal velocity dispersion of each cluster, converted to mass via some appropriate form of the virial theorem or mass profile model. Data from several galaxies are displayed in Figure 4, including M31 (Meylan et al., 2001; Strader et al., 2011), M33 (Larsen et al., 2002), NGC 5128 (Martini & Ho, 2004; Rejkuba et al., 2007; Taylor et al., 2010), and M87 (Haşegan et al., 2005).
The results from these different studies occupy similar ranges as in the Milky Way, but perhaps not surprisingly the scatter is much larger for these fainter targets. Some puzzling issues remain, for example in NGC 5128 for which the Taylor et al. (2010) values are roughly 50% larger than those from Rejkuba et al. (2007) and Martini & Ho (2004) for 14 objects in common, though again with considerable scatter. The source of this discrepancy is unclear. Possible trends of with GC metallicity as deduced from the M31 sample are discussed by Strader et al. (2011); Shanahan & Gieles (2015); Zonoozi et al. (2016) and are also not yet clear.
By contrast, there is general agreement that should increase systematically with GC mass (Kruijssen, 2008; Kruijssen & Mieske, 2009; Rejkuba et al., 2007; Strader et al., 2011), since the high-mass clusters have relaxation times large enough that the preferential loss of low-mass stars has not yet taken place to the same degree as for lower-mass clusters. The mean is expected to increase from at progressively up to the level for the mass range characterizing UCDs (Ultra-Compact Dwarfs) and dwarf E galaxies (e.g. Baumgardt & Mieske, 2008; Mieske et al., 2008). For convenience of later calculation, we define a simple interpolation curve for as a function of cluster luminosity,
| (A1) |
This function gives a roughly linear increase of from up to , saturating at the level of appropriate for UCDs and dE’s. The ‘baseline’ at is chosen to match the observed data for Milky Way clusters. At very low luminosity, the mass-to-light ratio should increase again because low-mass and highly dynamically evolved clusters should become relatively more dominated by binary stars and stellar remnants (cf. the datapoint for Palomar 13 as an example). However, clusters at the low-mass end are also relatively few in number, and contribute little mass per cluster to the system in any case, so the particular value adopted for them has negligible effects on the total mass of the system .
References
- Alamo-Martínez et al. (2013) Alamo-Martínez, K. A., Blakeslee, J. P., Jee, M. J., Côté, P., Ferrarese, L., González-Lópezlira, R. A., Jordán, A., Meurer, G. R., Peng, E. W., & West, M. J. 2013, ApJ, 775, 20
- Angus & Diaferio (2009) Angus, G. W. & Diaferio, A. 2009, MNRAS, 396, 887
- Baumgardt & Mieske (2008) Baumgardt, H. & Mieske, S. 2008, MNRAS, 391, 942
- Beasley et al. (2016) Beasley, M. A., Romanowsky, A. J., Pota, V., Navarro, I. M., Martinez Delgado, D., Neyer, F., & Deich, A. L. 2016, ApJ, 819, L20
- Behroozi et al. (2010) Behroozi, P. S., Conroy, C., & Wechsler, R. H. 2010, ApJ, 717, 379
- Behroozi et al. (2013) Behroozi, P. S., Wechsler, R. H., & Conroy, C. 2013, ApJ, 770, 57
- Bellazzini et al. (2012) Bellazzini, M., Dalessandro, E., Sollima, A., & Ibata, R. 2012, MNRAS, 423, 844
- Blakeslee (1999) Blakeslee, J. P. 1999, AJ, 118, 1506
- Blakeslee et al. (1997) Blakeslee, J. P., Tonry, J. L., & Metzger, M. R. 1997, AJ, 114, 482
- Bland-Hawthorn & Gerhard (2016) Bland-Hawthorn, J. & Gerhard, O. 2016, ARA&A, 54, 529
- Boschin et al. (2006) Boschin, W., Girardi, M., Spolaor, M., & Barrena, R. 2006, A&A, 449, 461
- Bradford et al. (2011) Bradford, J. D., Geha, M., Muñoz, R. R., Santana, F. A., Simon, J. D., Côté, P., Stetson, P. B., Kirby, E., & Djorgovski, S. G. 2011, ApJ, 743, 167
- Cole et al. (2012) Cole, D. R., Dehnen, W., Read, J. I., & Wilkinson, M. I. 2012, MNRAS, 426, 601
- Colless & Dunn (1996) Colless, M. & Dunn, A. M. 1996, ApJ, 458, 435
- D’Abrusco et al. (2016) D’Abrusco, R., Cantiello, M., Paolillo, M., Pota, V., Napolitano, N. R., Limatola, L., Spavone, M., Grado, A., Iodice, E., Capaccioli, M., Peletier, R., Longo, G., Hilker, M., Mieske, S., Grebel, E. K., Lisker, T., Wittmann, C., van de Ven, G., Schipani, P., & Fabbiano, G. 2016, ApJ, 819, L31
- Diakogiannis et al. (2014) Diakogiannis, F. I., Lewis, G. F., & Ibata, R. A. 2014, MNRAS, 437, 3172
- Dirsch et al. (2003) Dirsch, B., Richtler, T., Geisler, D., Forte, J. C., Bassino, L. P., & Gieren, W. P. 2003, AJ, 125, 1908
- Drinkwater et al. (2001) Drinkwater, M. J., Gregg, M. D., & Colless, M. 2001, ApJ, 548, L139
- Durrell et al. (2014) Durrell, P. R., Côté, P., Peng, E. W., Blakeslee, J. P., Ferrarese, L., Mihos, J. C., Puzia, T. H., Lançon, A., Liu, C., Zhang, H., Cuillandre, J.-C., McConnachie, A., Jordán, A., Accetta, K., Boissier, S., Boselli, A., Courteau, S., Duc, P.-A., Emsellem, E., Gwyn, S., Mei, S., & Taylor, J. E. 2014, ApJ, 794, 103
- Eadie & Harris (2016) Eadie, G. M. & Harris, W. E. 2016, ApJ, 829, 108
- Elmegreen et al. (2012) Elmegreen, B. G., Malhotra, S., & Rhoads, J. 2012, ApJ, 757, 9
- Falco et al. (2014) Falco, M., Hansen, S. H., Wojtak, R., Brinckmann, T., Lindholmer, M., & Pandolfi, S. 2014, MNRAS, 442, 1887
- Forbes et al. (2016) Forbes, D. A., Alabi, A., Romanowsky, A. J., Brodie, J. P., Strader, J., Usher, C., & Pota, V. 2016, MNRAS, 458, L44
- Gavazzi et al. (2009) Gavazzi, R., Adami, C., Durret, F., Cuillandre, J.-C., Ilbert, O., Mazure, A., Pelló, R., & Ulmer, M. P. 2009, A&A, 498, L33
- Gebhardt & Beers (1991) Gebhardt, K. & Beers, T. C. 1991, ApJ, 383, 72
- Georgiev et al. (2010) Georgiev, I. Y., Puzia, T. H., Goudfrooij, P., & Hilker, M. 2010, MNRAS, 406, 1967
- Griffen et al. (2010) Griffen, B. F., Drinkwater, M. J., Thomas, P. A., Helly, J. C., & Pimbblet, K. A. 2010, MNRAS, 405, 375
- Haşegan et al. (2005) Haşegan, M., Jordán, A., Côté, P., Djorgovski, S. G., McLaughlin, D. E., Blakeslee, J. P., Mei, S., West, M. J., Peng, E. W., Ferrarese, L., Milosavljević, M., Tonry, J. L., & Merritt, D. 2005, ApJ, 627, 203
- Harris (1996) Harris, W. E. 1996, AJ, 112, 1487
- Harris (2016) —. 2016, AJ, 151, 102
- Harris et al. (2015) Harris, W. E., Harris, G. L., & Hudson, M. J. 2015, ApJ, 806, 36
- Harris et al. (2013) Harris, W. E., Harris, G. L. H., & Alessi, M. 2013, ApJ, 772, 82
- Harris et al. (2014) Harris, W. E., Morningstar, W., Gnedin, O. Y., O’Halloran, H., Blakeslee, J. P., Whitmore, B. C., Côté, P., Geisler, D., Peng, E. W., Bailin, J., Rothberg, B., Cockcroft, R., & Barber DeGraaff, R. 2014, ApJ, 797, 128
- Harris & Pudritz (1994) Harris, W. E. & Pudritz, R. E. 1994, ApJ, 429, 177
- Howard et al. (2016) Howard, C. S., Pudritz, R. E., & Harris, W. E. 2016, MNRAS, 461, 2953
- Hudson et al. (2015) Hudson, M. J., Gillis, B. R., Coupon, J., Hildebrandt, H., Erben, T., Heymans, C., Hoekstra, H., Kitching, T. D., Mellier, Y., Miller, L., Van Waerbeke, L., Bonnett, C., Fu, L., Kuijken, K., Rowe, B., Schrabback, T., Semboloni, E., van Uitert, E., & Velander, M. 2015, MNRAS, 447, 298
- Hudson et al. (2014) Hudson, M. J., Harris, G. L., & Harris, W. E. 2014, ApJ, 787, L5
- Hughes (1989) Hughes, J. P. 1989, ApJ, 337, 21
- Jauzac et al. (2016) Jauzac, M., Eckert, D., Schwinn, J., Harvey, D., Baugh, C. M., Robertson, A., Bose, S., Massey, R., Owers, M., Ebeling, H., Shan, H. Y., Jullo, E., Kneib, J.-P., Richard, J., Atek, H., Clément, B., Egami, E., Israel, H., Knowles, K., Limousin, M., Natarajan, P., Rexroth, M., Taylor, P., & Tchernin, C. 2016, MNRAS, 463, 3876
- Jordán et al. (2006) Jordán, A., McLaughlin, D. E., Côté, P., Ferrarese, L., Peng, E. W., Blakeslee, J. P., Mei, S., Villegas, D., Merritt, D., Tonry, J. L., & West, M. J. 2006, ApJ, 651, L25
- Jordán et al. (2015) Jordán, A., Peng, E. W., Blakeslee, J. P., Côté, P., Eyheramendy, S., & Ferrarese, L. 2015, ApJS, 221, 13
- Kamann et al. (2016) Kamann, S., Husser, T.-O., Brinchmann, J., Emsellem, E., Weilbacher, P. M., Wisotzki, L., Wendt, M., Krajnović, D., Roth, M. M., Bacon, R., & Dreizler, S. 2016, A&A, 588, A149
- Kamann et al. (2014) Kamann, S., Wisotzki, L., Roth, M. M., Gerssen, J., Husser, T.-O., Sandin, C., & Weilbacher, P. 2014, A&A, 566, A58
- Katz & Ricotti (2014) Katz, H. & Ricotti, M. 2014, MNRAS, 444, 2377
- Kimmig et al. (2015) Kimmig, B., Seth, A., Ivans, I. I., Strader, J., Caldwell, N., Anderton, T., & Gregersen, D. 2015, AJ, 149, 53
- Koda et al. (2015) Koda, J., Yagi, M., Yamanoi, H., & Komiyama, Y. 2015, ApJ, 807, L2
- Kravtsov & Gnedin (2005) Kravtsov, A. V. & Gnedin, O. Y. 2005, ApJ, 623, 650
- Kruijssen (2008) Kruijssen, J. M. D. 2008, A&A, 486, L21
- Kruijssen (2015) —. 2015, MNRAS, 454, 1658
- Kruijssen & Mieske (2009) Kruijssen, J. M. D. & Mieske, S. 2009, A&A, 500, 785
- Kubo et al. (2007) Kubo, J. M., Stebbins, A., Annis, J., Dell’Antonio, I. P., Lin, H., Khiabanian, H., & Frieman, J. A. 2007, ApJ, 671, 1466
- Küpper et al. (2015) Küpper, A. H. W., Balbinot, E., Bonaca, A., Johnston, K. V., Hogg, D. W., Kroupa, P., & Santiago, B. X. 2015, ApJ, 803, 80
- Larsen et al. (2002) Larsen, S. S., Brodie, J. P., Sarajedini, A., & Huchra, J. P. 2002, AJ, 124, 2615
- Leauthaud et al. (2012) Leauthaud, A., Tinker, J., Bundy, K., Behroozi, P. S., Massey, R., Rhodes, J., George, M. R., Kneib, J.-P., Benson, A., Wechsler, R. H., Busha, M. T., Capak, P., Cortês, M., Ilbert, O., Koekemoer, A. M., Le Fèvre, O., Lilly, S., McCracken, H. J., Salvato, M., Schrabback, T., Scoville, N., Smith, T., & Taylor, J. E. 2012, ApJ, 744, 159
- Lee & Jang (2016) Lee, M. G. & Jang, I. S. 2016, ArXiv e-prints
- Li & Gnedin (2014) Li, H. & Gnedin, O. Y. 2014, ApJ, 796, 10
- Li et al. (2016) Li, H., Gnedin, O. Y., Gnedin, N. Y., Meng, X., Semenov, V. A., & Kravtsov, A. V. 2016, ArXiv e-prints
- Licquia et al. (2015) Licquia, T. C., Newman, J. A., & Brinchmann, J. 2015, ApJ, 809, 96
- Łokas & Mamon (2003) Łokas, E. L. & Mamon, G. A. 2003, MNRAS, 343, 401
- Lützgendorf et al. (2012) Lützgendorf, N., Kissler-Patig, M., Gebhardt, K., Baumgardt, H., Noyola, E., Jalali, B., de Zeeuw, P. T., & Neumayer, N. 2012, A&A, 542, A129
- Lützgendorf et al. (2011) Lützgendorf, N., Kissler-Patig, M., Noyola, E., Jalali, B., de Zeeuw, P. T., Gebhardt, K., & Baumgardt, H. 2011, A&A, 533, A36
- Mackey & Gilmore (2003) Mackey, A. D. & Gilmore, G. F. 2003, MNRAS, 340, 175
- Mandushev et al. (1991) Mandushev, G., Staneva, A., & Spasova, N. 1991, A&A, 252, 94
- Marín-Franch & Aparicio (2002) Marín-Franch, A. & Aparicio, A. 2002, ApJ, 568, 174
- Martinez (2015) Martinez, G. D. 2015, MNRAS, 451, 2524
- Martini & Ho (2004) Martini, P. & Ho, L. C. 2004, ApJ, 610, 233
- McLaughlin (1999a) McLaughlin, D. E. 1999a, ApJ, 512, L9
- McLaughlin (1999b) —. 1999b, AJ, 117, 2398
- McLaughlin & van der Marel (2005) McLaughlin, D. E. & van der Marel, R. P. 2005, ApJS, 161, 304
- Meylan et al. (2001) Meylan, G., Sarajedini, A., Jablonka, P., Djorgovski, S. G., Bridges, T., & Rich, R. M. 2001, AJ, 122, 830
- Mieske et al. (2008) Mieske, S., Hilker, M., Jordán, A., Infante, L., Kissler-Patig, M., Rejkuba, M., Richtler, T., Côté, P., Baumgardt, H., West, M. J., Ferrarese, L., & Peng, E. W. 2008, A&A, 487, 921
- Mihos et al. (2015) Mihos, J. C., Durrell, P. R., Ferrarese, L., Feldmeier, J. J., Côté, P., Peng, E. W., Harding, P., Liu, C., Gwyn, S., & Cuillandre, J.-C. 2015, ApJ, 809, L21
- Montes & Trujillo (2014) Montes, M. & Trujillo, I. 2014, ApJ, 794, 137
- Moore et al. (2006) Moore, B., Diemand, J., Madau, P., Zemp, M., & Stadel, J. 2006, MNRAS, 368, 563
- Moster et al. (2013) Moster, B. P., Naab, T., & White, S. D. M. 2013, MNRAS, 428, 3121
- Muñoz et al. (2015) Muñoz, R. P., Eigenthaler, P., Puzia, T. H., Taylor, M. A., Ordenes-Briceño, Y., Alamo-Martínez, K., Ribbeck, K. X., Ángel, S., Capaccioli, M., Côté, P., Ferrarese, L., Galaz, G., Hempel, M., Hilker, M., Jordán, A., Lançon, A., Mieske, S., Paolillo, M., Richtler, T., Sánchez-Janssen, R., & Zhang, H. 2015, ApJ, 813, L15
- Nasonova et al. (2011) Nasonova, O. G., de Freitas Pacheco, J. A., & Karachentsev, I. D. 2011, A&A, 532, A104
- Okabe et al. (2014) Okabe, N., Futamase, T., Kajisawa, M., & Kuroshima, R. 2014, ApJ, 784, 90
- Oldham & Auger (2016) Oldham, L. J. & Auger, M. W. 2016, MNRAS, 457, 421
- Owers et al. (2011) Owers, M. S., Randall, S. W., Nulsen, P. E. J., Couch, W. J., David, L. P., & Kempner, J. C. 2011, ApJ, 728, 27
- Paolillo et al. (2002) Paolillo, M., Fabbiano, G., Peres, G., & Kim, D.-W. 2002, ApJ, 565, 883
- Peñarrubia et al. (2008) Peñarrubia, J., McConnachie, A. W., & Navarro, J. F. 2008, ApJ, 672, 904
- Peng et al. (2011) Peng, E. W., Ferguson, H. C., Goudfrooij, P., Hammer, D., Lucey, J. R., Marzke, R. O., Puzia, T. H., Carter, D., Balcells, M., Bridges, T., Chiboucas, K., del Burgo, C., Graham, A. W., Guzmán, R., Hudson, M. J., Matković, A., Merritt, D., Miller, B. W., Mouhcine, M., Phillipps, S., Sharples, R., Smith, R. J., Tully, B., & Verdoes Kleijn, G. 2011, ApJ, 730, 23
- Peng & Lim (2016) Peng, E. W. & Lim, S. 2016, ApJ, 822, L31
- Purcell et al. (2007) Purcell, C. W., Bullock, J. S., & Zentner, A. R. 2007, ApJ, 666, 20
- Rejkuba (2012) Rejkuba, M. 2012, Ap&SS, 341, 195
- Rejkuba et al. (2007) Rejkuba, M., Dubath, P., Minniti, D., & Meylan, G. 2007, A&A, 469, 147
- Rines et al. (2003) Rines, K., Geller, M. J., Kurtz, M. J., & Diaferio, A. 2003, AJ, 126, 2152
- Schombert & Smith (2012) Schombert, J. & Smith, A. K. 2012, PASA, 29, 174
- Schuberth et al. (2010) Schuberth, Y., Richtler, T., Hilker, M., Dirsch, B., Bassino, L. P., Romanowsky, A. J., & Infante, L. 2010, A&A, 513, A52
- Scott et al. (2013) Scott, N., Graham, A. W., & Schombert, J. 2013, ApJ, 768, 76
- Shanahan & Gieles (2015) Shanahan, R. L. & Gieles, M. 2015, MNRAS, 448, L94
- Sollima et al. (2012) Sollima, A., Bellazzini, M., & Lee, J.-W. 2012, ApJ, 755, 156
- Spitler & Forbes (2009) Spitler, L. R. & Forbes, D. A. 2009, MNRAS, 392, L1
- Strader et al. (2011) Strader, J., Caldwell, N., & Seth, A. C. 2011, AJ, 142, 8
- Strigari et al. (2006) Strigari, L. E., Bullock, J. S., Kaplinghat, M., Kravtsov, A. V., Gnedin, O. Y., Abazajian, K., & Klypin, A. A. 2006, ApJ, 652, 306
- Taylor et al. (2010) Taylor, M. A., Puzia, T. H., Harris, G. L., Harris, W. E., Kissler-Patig, M., & Hilker, M. 2010, ApJ, 712, 1191
- Tonini (2013) Tonini, C. 2013, ApJ, 762, 39
- Umetsu et al. (2015) Umetsu, K., Sereno, M., Medezinski, E., Nonino, M., Mroczkowski, T., Diego, J. M., Ettori, S., Okabe, N., Broadhurst, T., & Lemze, D. 2015, ApJ, 806, 207
- van de Ven et al. (2006) van de Ven, G., van den Bosch, R. C. E., Verolme, E. K., & de Zeeuw, P. T. 2006, A&A, 445, 513
- van den Bosch et al. (2006) van den Bosch, R., de Zeeuw, T., Gebhardt, K., Noyola, E., & van de Ven, G. 2006, ApJ, 641, 852
- van Dokkum et al. (2016) van Dokkum, P., Abraham, R., Brodie, J., Conroy, C., Danieli, S., Merritt, A., Mowla, L., Romanowsky, A., & Zhang, J. 2016, ApJ, 828, L6
- van Dokkum et al. (2015) van Dokkum, P. G., Abraham, R., Merritt, A., Zhang, J., Geha, M., & Conroy, C. 2015, ApJ, 798, L45
- Villegas et al. (2010) Villegas, D., Jordán, A., Peng, E. W., Blakeslee, J. P., Côté, P., Ferrarese, L., Kissler-Patig, M., Mei, S., Infante, L., Tonry, J. L., & West, M. J. 2010, ApJ, 717, 603
- Wang et al. (2015) Wang, W., Han, J., Cooper, A. P., Cole, S., Frenk, C., & Lowing, B. 2015, MNRAS, 453, 377
- Watkins et al. (2013) Watkins, L. L., van de Ven, G., den Brok, M., & van den Bosch, R. C. E. 2013, MNRAS, 436, 2598
- Zaritsky et al. (2014) Zaritsky, D., Colucci, J. E., Pessev, P. M., Bernstein, R. A., & Chandar, R. 2014, ApJ, 796, 71
- Zocchi et al. (2012) Zocchi, A., Bertin, G., & Varri, A. L. 2012, A&A, 539, A65
- Zonoozi et al. (2016) Zonoozi, A. H., Haghi, H., & Kroupa, P. 2016, ApJ, 826, 89