X-ray and Optical Study of the Gamma-ray Source 3FGL J0838.82829:
Identification of a Candidate Millisecond Pulsar Binary
and an Asynchronous Polar
Abstract
We observed the field of the Fermi source 3FGL J0838.82829 in optical and X-rays, initially motivated by the cataclysmic variable (CV) 1RXS J083842.1282723 that lies within its error circle. Several X-ray sources first classified as CVs have turned out to be -ray emitting millisecond pulsars (MSPs). We find that 1RXS J083842.1282723 is in fact an unusual CV, a stream-fed asynchronous polar in which accretion switches between magnetic poles (that are apart) when the accretion rate is at minimum. High-amplitude X-ray modulation at periods of minutes and hr are seen. The former appears to be the spin period, while the latter is inferred to be one-third of the beat period between the spin and the orbit, implying an orbital period of minutes. We also measure an optical emission-line spectroscopic period of minutes, which is consistent with the orbital period inferred from the X-rays. In any case, this system is unlikely to be the -ray source. Instead, we find a fainter variable X-ray and optical source, XMMU J083850.38282756.8, that is modulated on a time scale of hours in addition to exhibiting occasional sharp flares. It resembles the black widow or redback pulsars that have been discovered as counterparts of Fermi sources, with the optical modulation due to heating of the photosphere of a low-mass companion star by, in this case, an as-yet undetected MSP. We propose XMMU J083850.38282756.8 as the MSP counterpart of 3FGL J0838.82829.
Subject headings:
cataclysmic variables — gamma rays: stars — pulsars: general — X-rays: individual (1RXS J083842.1282723, XMMU J083850.38282756.8, XMMU J083842.85282831.8)1. Introduction
The Large Area Telescope on the Fermi Gamma-ray Observatory has detected numerous young pulsars, as well as recycled millisecond pulsars (MSPs) in close binary systems. Most prominent of the new discoveries are the black widow (BW) pulsars and so-called “redback” systems (Roberts, 2013), which comprise a large fraction of the MSPs selected by Fermi. The BWs are MSPs with sub-stellar mass, degenerate companions, while the redbacks generally have evolved companions. The latter are usually close to filling their Roche-lobes, which makes them a direct link to the low-mass X-ray binary (LMXB) progenitors of MSPs.
Recently, three redbacks have been observed to transition between radio pulsar and accreting states on timescales of years: PSR J1023+0038 (Archibald et al., 2009), XSS J122704859 (Roy et al., 2015), and PSR J18242452I in the globular cluster M28 (Papitto et al., 2013). All of these are hard X-ray and/or -ray sources. PSR J1023+0038 was initially misclassified as a cataclysmic variable (CV) (Bond et al. 2002, but see Thorstensen & Armstrong 2005 for a contrary interpretation), as was XSS J122704859 (Masetti et al., 2006; Butters et al., 2008), because of the similarity of their optical emission-line spectra and luminosities to those of CVs. Now we know that transitional MSPs are distinguishable from CVs by their X-ray and optical light curves, which show characteristic dips and flares that are unique to this class (Bogdanov et al., 2015; de Martino et al., 2013). We employed this test to reevaluate two ROSAT All-Sky Survey X-ray sources in Fermi error circles that were spectroscopically classified as CVs by Masetti et al. (2013). Using X-ray and optical time-series data for one of these, 1RXS J154439.4112820/3FGL J1544.61125, we concluded that it is almost certainly an MSP binary in the accreting state (Bogdanov & Halpern, 2015). Here, we report on a similar investigation of the second Masetti et al. CV, 1RXS J083842.1282723 in the error circle of 3FGL J0838.82829 (Acero et al., 2015).
Section 2 describes the observations obtained. Section 3 presents the results of optical and X-ray observations of 1RXS J083842.1282723, which show that it is indeed a CV, probably an asynchronous polar (AM Herculis star). Section 4 reports the discovery of a second X-ray and optical source in the Fermi error circle, XMMU J083850.38282756.8, which we identify as a candidate BW pulsar system, and likely the counterpart of the -ray source. In Section 5 we show that a third X-ray source in the Fermi error circle is a QSO, probably unrelated to the -ray source. Section 6 discusses the properties of the CV and the MSP candidate in relation to other objects in their respective classes.
| Telescope/Detector | Date (UT) | Time (TDB) | Filter | Exposure (s) | Conditions |
|---|---|---|---|---|---|
| 2.4 m/Templeton | 2014 Mar 22 | 02:47–06:47 | V | 10 | Clear |
| 2.4 m/Templeton | 2014 Mar 23 | 02:40–06:51 | V | 10 | Photometric |
| 1.3 m/Templeton | 2015 Feb 17 | 06:12–09:19 | BG38 | 20 | Partly cloudy |
| 1.3 m/Templeton | 2015 Feb 18 | 03:51–09:14 | BG38 | 20 | Photometric |
| 1.3 m/Andor | 2016 Mar 16 | 04:31–06:31 | GG420 | 5 | Photometric |
| 1.3 m/Andor | 2016 Mar 17 | 04:02–06:02 | GG420 | 5 | Photometric |
| Label | Source | R.A. (h m s) | Decl. () |
|---|---|---|---|
| a | 1RXS J083842.1282723 | 08 38 43.34 | –28 27 00.9 |
| b | XMMU J083850.38282756.8 | 08 38 50.45 | –28 27 57.4 |
| c | XMMU J083842.85282831.8 | 08 38 42.80 | –28 28 31.0 |
Note. — Coordinates are equinox J2000.0
2. X-ray and Optical Observations
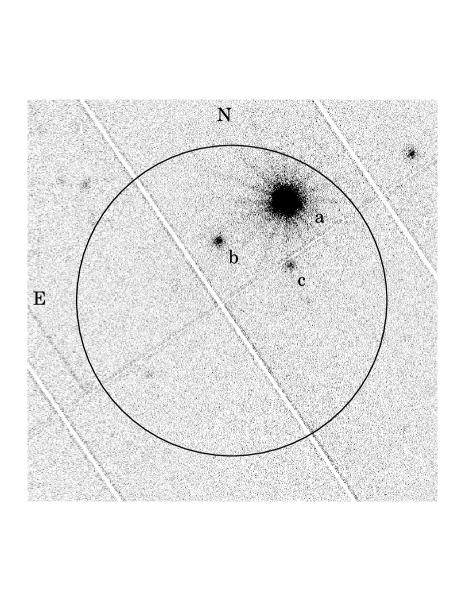
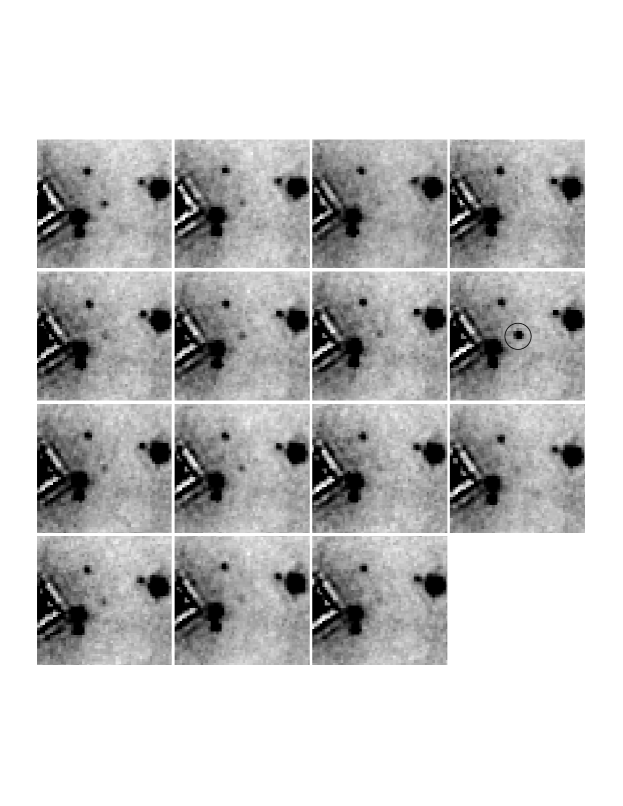
The field of 3FGL J0838.82829 was observed twice with XMM–Newton, on 2015 October 20 (ObsID 0764420101, 53 ksec) and 2015 December 2 (ObsID 0790180101, 77 ksec). The EPIC pn detector was used in large window mode, while the two MOS detectors were configured in small window mode, all with the thin filter. Time resolution is 48 ms for the pn, and 0.3 s for the MOS. In addition, the XMM–Newton Optical Monitor (OM) obtained 10 contemporaneous exposures of 5000 s or 4160 s in the -band on 2015 October 20, and 15 contemporaneous 4400 s exposures in the -band on 2015 December 2. Figure 1 (left) shows the Fermi 95% error circle superposed on the XMM–Newton pn image of 2015 December 2. In addition to 1RXS J083842.1282723 (source “a”), there are two fainter sources inside the error circle that we investigated, labeled “b” and “c”. The MOS small window only included source “a”, but all three sources have optical counterparts in the OM images.
We obtained another X-ray observation of 1RXS J083842.1282723 using Chandra ACIS on 2016 July 7 for an exposure time of 30 ks (ObsID 17769). The S3 CCD only was operated in continuous clocking (CC) mode to avoid pileup of the bright source 1RXS J083842.1282723. This gives time resolution of 2.85 ms, but sacrifices one spatial dimension. Only 1RXS J083842.1282723 is bright enough to study in CC mode.
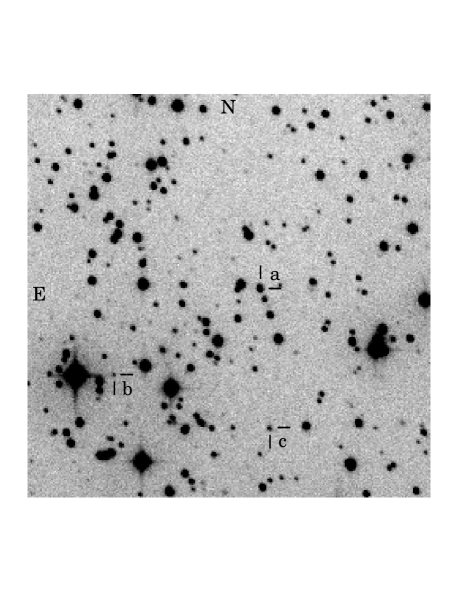
We obtained several hours of time-series optical photometry of the field using the MDM Observatory 1.3m and 2.4m telescopes om Kitt Peak during three observing runs in 2014, 2015, and 2016. The detectors used were either the pixel thinned, back-illuminated SITe CCD “Templeton,” or a thermoelectrically cooled Andor Ikon DU-937 N CCD camera. The detectors, observing parameters, and differential photometry techniques were the same as described in Thorstensen & Halpern (2013) and Halpern & Thorstensen (2015). The CCD readout was windowed and binned to reduce dead-time. Exposure times were 10 s or 20 s, with 3 s dead-time using Templeton, and 5 s exposures with 12 ms dead-time using the Andor. A log of the observations is given in Table 1. The 1.3m Templeton images (Figure 1, right) covered all three X-ray sources, while the Andor and 2.4m Templeton images only included 1RXS J083842.1282723. Optical positions for the three sources, measured from a 1.3m image using USNO B1.0 catalog stars for the astrometric solution, are given in Table 2.
We obtained 59 spectra of 1RXS J083842.1282723 during two observing runs, in 2016 January and February, using the 2.4m telescope with the modular spectrograph and a thinned, back-illuminated pixel SITe CCD detector. Our spectra covered 4210–7500 Å, with 2.0 Å pixel-1 and a FWHM resolution of Å. The observing, reduction, and analysis protocols were practically identical to those used in Thorstensen & Halpern (2013) and Halpern & Thorstensen (2015). A log of the spectroscopic observations is given in Table 3. Finally, we obtained one identification spectrum of source “c” using the Ohio State Multi-Object Spectrograph (OSMOS) on the 2.4m.
| Date | Exposure | H EW | ||
|---|---|---|---|---|
| (BJD)aaBarycentric Julian day of mid-integration in the UTC system. | (s) | (km s-1) | (km s-1) | (Å) |
| 2457402.8178 | 900 | 174 | ||
| 2457402.8286 | 900 | 162 | ||
| 2457403.8843 | 480 | 235 | ||
| 2457403.8903 | 480 | 237 | ||
| 2457403.8962 | 480 | 252 | ||
| 2457403.9021 | 480 | 217 | ||
| 2457403.9081 | 480 | 261 | ||
| 2457403.9140 | 480 | 246 | ||
| 2457403.9199 | 480 | 214 | ||
| 2457403.9259 | 480 | 167 | ||
| 2457405.7628 | 480 | 218 | ||
| 2457405.7687 | 480 | 188 | ||
| 2457405.7806 | 480 | 123 | ||
| 2457405.7865 | 480 | 158 | ||
| 2457405.7924 | 480 | 160 | ||
| 2457405.7983 | 480 | 177 | ||
| 2457405.8043 | 480 | 245 | ||
| 2457405.8102 | 480 | 213 | ||
| 2457405.8161 | 480 | 222 | ||
| 2457405.8221 | 480 | 224 | ||
| 2457405.8280 | 480 | 269 | ||
| 2457405.8339 | 480 | 243 | ||
| 2457405.8399 | 480 | 200 | ||
| 2457405.8458 | 480 | 184 | ||
| 2457405.9192 | 480 | 169 | ||
| 2457405.9251 | 480 | 188 | ||
| 2457405.9310 | 480 | 225 | ||
| 2457405.9370 | 480 | 219 | ||
| 2457405.9429 | 480 | 234 | ||
| 2457405.9488 | 480 | 277 | ||
| 2457405.9548 | 480 | 308 | ||
| 2457407.7556 | 480 | 286 | ||
| 2457407.7615 | 480 | 224 | ||
| 2457407.7734 | 480 | 199 | ||
| 2457407.8030 | 480 | 182 | ||
| 2457408.7526 | 480 | 220 | ||
| 2457408.7586 | 480 | 333 | ||
| 2457408.7645 | 480 | 200 | ||
| 2457408.7704 | 480 | 159 | ||
| 2457408.7763 | 480 | 200 | ||
| 2457408.7823 | 480 | 162 | ||
| 2457408.7882 | 480 | 213 | ||
| 2457408.7941 | 480 | 140 | ||
| 2457408.8001 | 480 | 185 | ||
| 2457408.8060 | 480 | 194 | ||
| 2457408.8119 | 480 | 222 | ||
| 2457408.8178 | 480 | 205 | ||
| 2457408.8238 | 480 | 265 | ||
| 2457408.8297 | 480 | 270 | ||
| 2457408.8356 | 480 | 189 | ||
| 2457430.8336 | 480 | 267 | ||
| 2457430.8396 | 480 | 229 | ||
| 2457430.8455 | 480 | 201 | ||
| 2457430.8515 | 480 | 200 | ||
| 2457438.7866 | 480 | 157 | ||
| 2457438.7925 | 480 | 258 | ||
| 2457438.7984 | 480 | 235 | ||
| 2457440.8426 | 600 | 205 | ||
| 2457440.8499 | 600 | 196 |


3. 1RXS J083842.1282723
3.1. Optical Spectroscopy
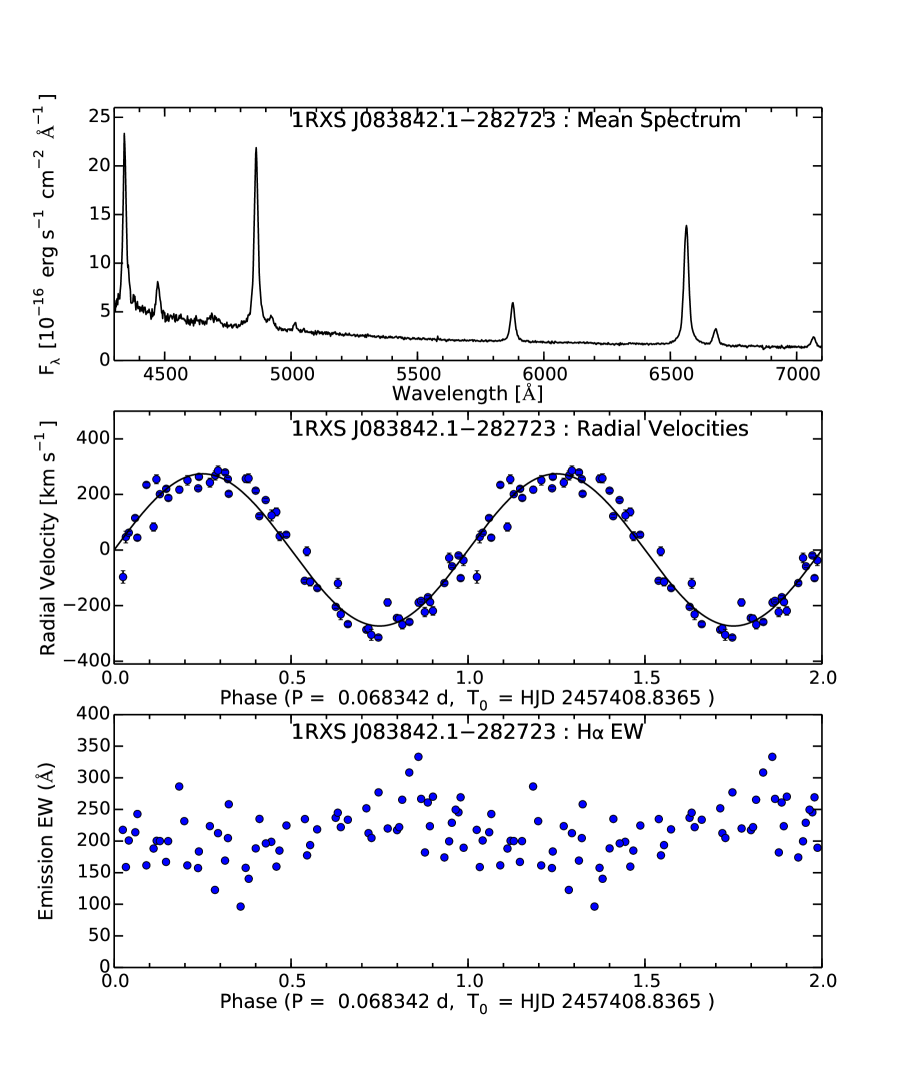
Our mean spectrum of 1RXS J083842.1282723 (Figure 2, upper panel) appears similar to that published by Masetti et al. (2013), with strong, single-peaked Balmer and He I lines on a blue continuum. He II is just detected with an emission equivalent width (EW) of Å, but is much less prominent than H (EW Å). The spectrum implies a synthetic , but this is not expected to be precise because of occasional clouds and poor seeing.
We measured radial velocities of H using a convolution function tuned to be sensitive to the steep sides of the line profile, which are about 1500 km s-1 apart. Table 3 lists the resulting radial velocities and uncertainties. To find the period we constructed a dense grid of trial frequencies and fitted the velocities with least-squares sinusoids at each frequency. This yielded a period near 98.4 minutes, with no ambiguity in the daily or month-to-month cycle count. A least-squares best fit of the form has
| (1) | |||||
| (2) | |||||
| (3) | |||||
| (4) |
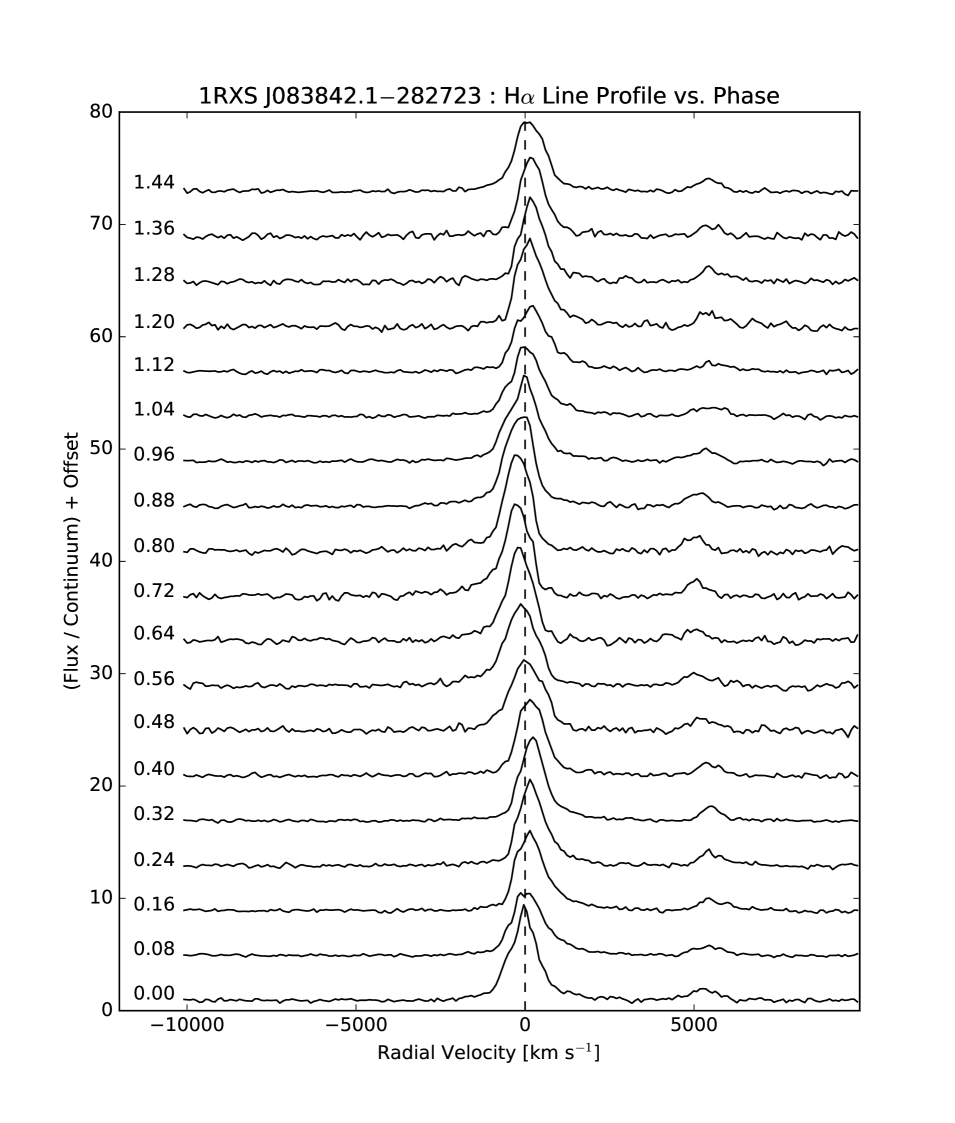
with an RMS scatter of 36 km s-1 for the 59 data points. The precise period is minutes. The middle panel of Figure 2 shows the sine fit superposed on the radial velocities, and Figure 3 shows the H line profiles as function of orbital phase.
The lower panel of Figure 2 shows the equivalent width (EW) of the H emission line as a function of spectroscopic phase. A periodogram of the EW has a peak at exactly the spectroscopic period. Although noisy, the EW varies sinusoidally with a phase lag of cycles with respect to the radial velocity curve. As will be discussed, this is a clue to the accretion geometry.
3.2. Time-series Optical Photometry
The MDM light curves of 1RXS J083842.1282723 are shown in Figure 4. Magnitudes were calibrated to stars in the UCAC4 (Zacharias et al., 2013). BG38 and GG420 are broadband filters chosen for their higher throughput, but they do not have standard calibrations. We approximated their magnitudes using and , respectively, from stars in the UCAC4.
The individual time series all display a broad oscillation with a period of d, similar to the spectroscopic period. Although some of the light curves in Figure 4 show a hint of a faster oscillation, a power-spectrum analysis does not reveal any shorter coherent period. In addition, in all three years there is a large change of magnitudes between adjacent nights. When the star is bright, the d oscillation has large amplitude; when it is faint the relative amplitude is smaller. This behavior matches the X-ray (presented in the next section) very well, with the night-to-night changes explained as modulation of the accretion rate on the beat period between the spin and the orbit of a stream-fed system.
| Label | Source | (cm-2) | (keV) | (0.3–10 keV)aaUnabsorbed flux in units of erg cm-2 s-1. | ||
|---|---|---|---|---|---|---|
| Chandra ACIS-S, ObsID 17769, 2016 July 7 | ||||||
| a | 1RXS J083842.1282723 | … | 1.25 (368) | |||
| XMM–Newton EPIC-pn, ObsID 0790180101, 2015 December 2 | ||||||
| a | 1RXS J083842.1282723 | … | 1.48 (883) | |||
| b | XMMU J083850.38282756.8 | … | 0.96 (109) | |||
| b | XMMU J083850.38282756.8 | … | 0.99 (109) | |||
| c | XMMU J083842.85282831.8 | … | 0.69 (44) | |||
Note. — Uncertainties are 90% confidence.


3.3. XMM–Newton Analysis
We fitted the pn X-ray spectrum from the longer XMM–Newton observation with a thermal bremsstrahlung model in XSPEC. The temperature is 11.7 keV (Figure 5 and Table 4), and residuals corresponding to Fe K 6.7, 6.9 keV, as well as Fe L-shell and O K-shell lines, are evident. A mekal hot plasma model gives a similar temperature. There is no evidence of a soft blackbody from the white dwarf (WD) surface that is sometimes but not always seen in polars.
X-ray photon arrival times were transformed to Barycentric Dynamical Time and extracted from a radius around 1RXS J083842.1282723. Figures 6 and 7 show the 0.2–10 keV, background subtracted, combined light curve from the pn and MOS in 60 s bins, as well as magnitudes from the OM. The X-ray light curve shows a factor of 10 variation with a period of d, as well as a broader modulation on a timescale of d. This resembles a classic beating between two closely spaced frequencies. A periodogram of the longer (December 2) observation (Figure 8a) shows three peaks, at 88.0 minutes, 98.3 minutes, and 14.7 hr, where the latter is consistent with the beat between the two shorter periods. However, a periodogram of the shorter observation (October 20; Figure 8c) has only a single peak at a period of 95 minutes, which falls in between the pair at 88.0 minutes and 98.3 minutes.
Inspection of the light curves reveals what is responsible for the difference in the power spectra. At the minimum of the 14.7 hr cycle, the phase of the shorter period jumps by . This is especially clear in Figure 7, where the periodic tick marks switch from marking flux minima before day 7360 to nearly flux maxima after day 7360. This phase jump causes the peak in the Fourier transform to split into two, straddling the true peak. By analogy with amplitude modulation of a carrier signal, one should still see the carrier in the power spectrum, with symmetric sidebands on either side. However, if the carrier (or any signal) experiences a phase jump, then its power will be split into two frequencies, neither of which is the true one. The frequency splitting of the signal should be equal to the frequency with which the phase jumps, in this case hr-1, which is consistent with the observed splitting of hr-1.
We tested this interpretation by measuring the power spectrum of the first part of the December 2 observation, before the minimum of the beat cycle at day 7360 in Figure 7. This restricted power spectrum has a single peak at 94.6 minutes (Figure 8b), consistent with the period from October 20. The same period is also confirmed in a Chandra observation described below. Therefore, we adopt the average value of minutes from the two XMM–Newton observations as the probable spin period of the WD.
We further confirm this interpretation using simulated light curves and power spectra. As an approximation of the light curve, a squared sinusoid with a 94.8 minute period was amplitude modulated at the 14.7 hr period, and a phase jump of varying angle was introduced at day 7360. This reproduced well the splitting of the spin signal in the observed power spectrum. The best match to the observed light curve and power spectrum was achieved for a phase jump of , with an uncertainty of .
We hypothesize that the WD spin modulates the apparent X-ray flux by self occultation of the base of a column that accretes onto a magnetic pole in an AM Her-like system. The 14.7 hr amplitude modulation superposed on this oscillation occurs as the secondary star migrates in the rotating frame of the WD. The phase jump of the minute signal at the minimum of the beat cycle corresponds to switching of the accretion from one magnetic pole to the other. Evidently the accretion rate drops almost to zero during the switch. In this interpretation, 14.7 hours is one-third of the beat period between the spin and the orbit; therefore, the orbital period is minutes, if it is longer than the spin period. (Here we have estimated by eye from the light curve an uncertainty of hr on the 14.7 hr period.) The 98.41 minute optical spectroscopic period is consistent with the orbital period deduced from the X-ray light curve.
The OM light curves in Figures 6 and 7, and MDM optical light curves in Figure 4, display these effects as well, with an amplitude that is smaller than the X-ray amplitude on the spin period, but similar to the X-ray amplitude on the beat period. This supports the hypothesis that the emission is from an accretion stream rather than a disk. The optical light may be less modulated by the spin of the white dwarf than the X-rays, because it is coming from higher in the accretion column. But the varying accretion rate affects the X-ray and optical luminosity equally on the beat period.
Notably, the X-ray hardness ratio shown in Figures 6 and 7 becomes softer in the dips. This may indicate that a broader, warm area of emission is present that is occulted less completely than the central, hot base of the accretion column (see review by Wickramasinghe 1989). Alternatively, there may be residual luminosity from another accreting region that is cooler and less luminous.

3.4. Chandra Analysis
We fitted the Chandra X-ray spectrum with a thermal bremsstrahlung model in XSPEC, finding a temperature of 11.2 keV (Figure 5 and Table 4), consistent with the XMM–Newton results. X-ray photon arrival times were transformed to Barycentric Dynamical Time and extracted from a radius around 1RXS J083842.1282723. Figure 9 shows the 0.2–10 keV background subtracted light curve in 100 s bins. Although observation is shorter than the XMM–Newton ones, the behavior of 1RXS J083842.1282723 is consistent with that observed previously. The spin period and the spin/orbit beating effect are both evident. A peak at 93.9 minutes appears in the power spectrum (Figure 8d), consistent with the XMM–Newton values. Since this short observation does not span a minimum of the beat cycle, it does not clearly show a phase jump in the spin cycle. However there is an “extra” dip at day 7578.37 in Figure 9 that may be due to partial pole switching of the accretion.


4. XMMU J083850.38282756.8
Given the lack of association of any cataclysmic variable with a persistent Fermi -ray source, and the absence of a plausible physical mechanism connecting 1RXS J083842.1282723 with 3FGL J0838.82829, we searched for another counterpart. In this section we describe the analysis of source “b,” XMMU J083850.38282756.8.
4.1. XMM–Newton Analysis
We extracted pn light curves of XMMU J083850.38282756.8. The MOS detectors, operated in small window mode, did not cover this source. Figure 10 shows a moderately variable light curve, and an intense flaring episode on 2015 December 2 that lasted hr, with doubling times of s or less. A power-spectrum analysis, excluding the flare, does not indicate any periodicity. Upper limits on orbital modulation in the 0.5–10 hr period range are % for a sinusoidal amplitude. The energy spectrum of XMMU J083850.38282756.8 is well fitted by a hard power law of photon index (Table 4). A thermal bremsstrahlung model is also acceptable, but its temperature is very high and poorly constrained ( keV). A blackbody fit is unacceptable, with reduced and .
On December 2, the OM observed XMMU J083850.38282756.8 for the entire span of the observation. It revealed an optical counterpart for this source that is slowly varying by magnitude, and has a bright maximum coincident with the X-ray flare, as shown in Figures 10 and 11. (The OM was windowed on 2015 October 20 so that it did not obtain continuous coverage of XMMU J083850.38282756.8.)
4.2. Time-series Optical Photometry
MDM 1.3m images from 2015 February 17 and 18 are the only ones that cover this source. Because of its faintness and the short individual exposure times, we binned the images in groups of 10. Due to weather, only the 2015 February 18 observation yields a useful light curve (Figure 12). It shows a broad minimum that is characteristic of the heating light curve of a BW companion to an MSP. The X-ray and optical behavior of XMMU J083850.38282756.8 is similar to that of BW pulsar binaries identified with Fermi sources, such as PSR J13113430, which has both optical and X-ray flares (Romani, 2012). While there is only one broad minimum during the 5.4 hr span of the data, this is not necessarily a lower limit on the orbital period because of the possibility of flaring, which may mask a second dip near the end of the time series.
5. XMMU J083842.85282831.8
A third X-ray source on the pn CCD, XMMU J083842.85282831.8, labeled “c” in the images of Figure 1, falls within the error circle of 3FGL J0838.82829. Its power-law X-ray spectrum and relatively steady optical flux in the OM and MDM 1.3m time series (Figure 12) suggest that it is a QSO. The fitted cm-2 is consistent with the total 21 cm cm-2 on the line of sight (Kalberla et al., 2005). This object was also listed as a low-probability blazar candidate for 3FGL J0838.82829 by Massaro et al. (2013), from its colors in the Wide-field Infrared Survey Explorer data. Lacking a radio detection in the NVSS, it is unlikely to be a blazar. We obtained an optical spectrum of XMMU J083842.85282831.8 using the Ohio State Multi-Object Spectrograph (OSMOS) on the MDM 2.4m telescope. In the wavelength range 3960–6880 Å it shows a single broad emission line, which we identify as Mg II at , with an equivalent width of Å (Figure 13). This confirms that it is a non-blazar AGN, and probably unrelated to the Fermi source.
6. Discussion
6.1. 1RXS J083842.1282723
The X-ray light curve of 1RXS J083842.1282723, with its deep, broad dips at a period of minutes, is typical of those polars in which self occultation of the emitting magnetic pole by the WD is responsible for the modulation. It cannot be an eclipse by the orbiting secondary star or the accretion stream, because either of those would be much narrower. Eclipse ingress or egress of the entire WD would take only a few seconds, less than one bin of the light curves, based on the orbital velocities estimated below. The eclipse duration would be cycles given the radius of the secondary star. See, e.g., Worpel & Schwope (2015) for a light curve of an eclipsing polar.
The slower but equally deep 14.7 hr modulation requires yet another explanation. It also is too broad to be an eclipse by the orbiting secondary or accretion stream. The hardness ratio does not indicate photoelectric absorption as a cause. Instead, we hypothesize that the long period results from interruption of the accretion stream due to an orbit that is asynchronous with respect to the WD rotation. This modulates the accretion rate onto the WD with a 14.7 hr period.
In addition, the spin cycle is thrown out of phase by at the minimum of the 14.7 hr modulation. This is interpreted as switching of the accretion between not quite antipodal regions, when the accretion almost stops. The effect on the power spectrum is exactly analogous to amplitude modulation of a carrier signal, with a phase jump, which splits the signal into two periods straddling the true one. We have recovered the true period, which we interpret as the WD spin, in the three X-ray observations reported here. There is no direct manifestation of the orbit in the power spectrum, but the 14.7 hr period most likely represents the time it takes for the companion star to migrate around the WD, i.e., one-third of the beat period of the spin and the orbit. The implied orbital period is minutes, assuming that it is longer than the spin period.
The emission-line radial velocity curve has a period of minutes, which is consistent with the X-ray inferred orbital period, and not with the spin. But the radial velocity amplitude of 274 km s-1 is too large to be an orbital velocity of the WD, and the lines are too broad, km s-1 to be coming from the heated face of the secondary star. A typical CV with orbital period of 100 minutes has a WD and a secondary (Savoury et al., 2011). Typical orbital velocities are then km s-1 for the WD and km s-1 for the secondary. On the other hand, free-fall velocity onto the WD is up to 3900 km s-1. So we conclude that the emission lines are located high in the accretion column.
We also examined the EW of the H emission line as a function of spectroscopic phase. The EW varies cycles out of phase with respect to the radial velocity (Figure 2). The EW is therefore greatest at the point of maximum blueshift, phase 0.75. Assuming radial accretion, this is when the accreting pole is on the far side of the WD and maximally occulted. The emission-line source could be higher up in the accretion column than the optical continuum source, and therefore less modulated. This would result in a larger EW at phase 0.75, where the continuum is weakest.
The original group of four asynchronous polars have spin and orbit periods which periods differ by (Schwarz et al. 2007, and references therein). In 1RXS J083842.1282723, the difference we infer is . A fifth asynchronous polar has been proposed to explain the post-nova light curve of V4633 Sgr (Lipkin & Leibowitz, 2008), which had transient period that decreased from 185.6 minutes to 183.9 minutes in addition to a stable period of 180.8 minutes. The authors attributed the longer period to the spin period, which was perturbed by the outburst, while the shorter period is orbital. It is generally observed that asynchronous polars are evolving toward synchronization on a short time scale, which suggests that nova eruptions may be the cause of all asynchronous polars.
Other CVs with more complex light curves and multiple periods have also been proposed as extreme asynchronous polars, most notably RX J0524+42, dubbed “Paloma” (Schwarz et al., 2007; Joshi et al., 2016), and IGR J19552+0044 (Bernardini et al., 2013; Thorstensen & Halpern, 2013). Paloma is suggested to have an orbital period of 157 minutes, and a spin period that is either 136 or 146 minutes, which are asynchronous by 14% or 7% respectively (Schwarz et al., 2007). IGR J19552+0044 has a spectroscopic period of 1.39 hr that disagrees with its photometric period of 1.36 hr (Thorstensen & Halpern, 2013), while Bernardini et al. (2013) finds X-ray periods of 1.38 hr and 1.69 hr. For these systems with highly discrepant periods, it is not yet known if they are evolving toward synchronization, but if so, it may be for the first time. Among this group, 1RXS J083842.1282723 has the simplest light curve and power spectrum, and thus may be a key to interpreting the other, more complex cases.
6.2. XMMU J083850.38282756.8
None of the properties of the CV 1RXS J083842.1282723 suggest a connection with 3FGL J0838.82829. Using machine learning algorithms, Mirabal et al. (2016) classified 3FGL J0838.82829 as a high-confidence pulsar based on its -ray spectral shape and variability index. Accordingly, we propose XMMU J083850.38282756.8 as the millisecond pulsar counterpart of 3FGL J0838.82829.
X-ray properties of BW pulsars were reviewed by Gentile et al. (2014) and Arumugasamy et al. (2015). They have hard power-law spectra and sometimes a soft thermal component from the neutron star surface. The non-thermal emission is thought to be synchrotron from an intrabinary shock between the pulsar wind and the companion stellar wind. In some cases the X-ray flux is modulated on the orbital period, due either to relativistic beaming, or self occultation of the emitting region near the surface of the companion star (Romani & Sanchez, 2016).
The optical light curves of BWs are modulated by photospheric heating. Usually the heated face of the substellar companion is much brighter than the cool photosphere on the “night” side. In some cases, the heating light curve is not symmetric with respect to the line between the stars, which could be due to an asymmetric shock, or to channeling of the pulsar wind by intrinsic magnetic fields on the companion (Tang et al., 2014; Li et al., 2014). In PSR J13113430, bright flares have been seen in optical and X-rays (Romani, 2012), which could be coming from the companion’s magnetic fields. PSR J13113430 is a short-period (94 minute) system, which, being in tidally locked rapid rotation, could enhance the coronal magnetic field (Romani et al., 2015).
The hard X-ray power-law spectrum and X-ray and optical flare seen in the XMM–Newton observation of XMMU J083850.38282756.8 strongly motivate its identification as the MSP counterpart of 3FGL J0838.82829. Typical Fermi MSPs are at distances of kpc. If so, its X-ray luminosity would be erg s-1, in the range of both BWs and redbacks in the radio pulsar state (Roberts et al., 2015). In contrast, accreting redbacks have erg s-1 (Bogdanov et al., 2015).
This would be the first time that a simultaneous X-ray and optical flare is seen from a BW. It may be a short-period system similar to PSR J13113430, but the X-ray light curve doesn’t reveal an orbital period. Any orbital modulation in the 0.5–10 hr period range has % amplitude for an assumed sinusoid. The cadence of the 4400 s OM exposures is too long to test for such a period, which may, in addition, be masked by the flaring behavior. The MDM optical data, on the other had, have adequate cadence, and a dip that is characteristic of a heating light curve, but the dip does not repeat within the 5.4 hr time series (Figure 12), which suggests that the period is hr. Alternatively, a second dip may be masked by a flaring episode.
BW optical light curves are usually modulated by several magnitudes, while the dip in XMMU J083850.38282756.8 is only magnitudes. This could mean that the inclination angle of the binary is small, or that the companion is a low-mass main sequence star, i.e., a redback, which is brighter than a BW. Optical flares have also been seen from the redback PSR J1048+2339 (Deneva et al., 2016). Additional time-series photometry, optical spectroscopy, and a radio or -ray pulsar detection, could confirm the identification, and resolve the remaining questions about the basic parameters of the binary system.
7. Conclusions
The -ray properties of 3FGL J0838.82829 have suggested that it is a pulsar. In this X-ray and optical study, we first concluded that 1RXS J083842.1282723, the brightest X-ray source in its error circle, is an unusual CV that falls there by chance. It has a simple X-ray light curve that is strongly modulated at two periods, with a phase jump that indicates pole-switching of the accretion in an asynchronous polar. The spin is manifest as a 94.8 minute X-ray period caused by self occultation of the accreting pole, while the switching interval is 14.7 hours. This implies an orbital period of 98.3 minutes, consistent with the 98.41 minute optical spectroscopic period. The strong optical and X-ray modulation on the 14.7 hr period can be explained by nearly complete interruption of the accretion stream as it switches poles. A dedicated optical monitoring campaign could obtain a more precise value for the beat period, test the proposed geometry of the accretion spots in more detail, and determine whether the spin and orbit are evolving toward synchronism.
X-ray and optical observations identify a second, highly variable object in the error circle of 3FGL J0838.82829. XMMU J083850.38282756.8 is modulated on a time scale of hours in the optical, in addition to having shown one simultaneous X-ray and optical flare. It has a hard, nonthermal X-ray spectrum. These properties are compatible with black widow or redback millisecond pulsar systems that have been discovered as counterparts of Fermi sources. A binary period, an important test of this hypothesis, is not yet revealed by the available data, but follow-up time-series photometry, optical spectroscopy, and/or a radio pulsar detection, should be able to determine the orbital parameters of the system.
8. Acknowledgements
We thank Eric Alper for obtaining time-series photometry of 1RXS J083842.1282723 in 2016 March, and Jessica Klusmeyer for the optical spectrum of the QSO XMMU J083842.85282831.8. The MDM Observatory is operated by Dartmouth College, Columbia University, the Ohio State University, Ohio University, and the University of Michigan. The results reported in this article are based in part on observations made by the Chandra X-ray Observatory. Support for this work was provided by the National Aeronautics and Space Administration through Chandra Award Number SAO GO6-17027X issued by the Chandra X-ray Observatory Center, which is operated by the Smithsonian Astrophysical Observatory for and on behalf of the National Aeronautics Space Administration under contract NAS8-03060. This investigation also uses observations obtained with XMM–Newton, an ESA science mission with instruments and contributions directly funded by ESA Member States and NASA.
References
- Acero et al. (2015) Acero, F., Ackermann, M., Ajello, M., et al. 2015, ApJS, 224, 8
- Archibald et al. (2009) Archibald, A. M., Stairs, I. H., Ransom, S. M., et al. 2009, Science, 324, 1411
- Arumugasamy et al. (2015) Arumugasamy, P., Pavlov, G. G., & Garmire, G. P. 2015, ApJ, 814, 90
- Bassa et al. (2014) Bassa, C. G., Patruno, A., Hessels, J. W. T., et al. 2014, MNRAS, 441, 1825
- Bernardini et al. (2013) Bernardini, F., de Martino, D., Mukai, K., et al. 2013, MNRAS, 435, 2822
- Bogdanov et al. (2015) Bogdanov, S., Archibald, A. M., Bassa, C., et al. 2015 ApJ, 806, 148
- Bogdanov & Halpern (2015) Bogdanov, S., & Halpern, J. P. 2015, ApJL, 803, L27
- Bond et al. (2002) Bond, H. E., White, R. L., Becker, R. H., & O’Brien, M. S. 2002, PASP, 114, 1359
- Butters et al. (2008) Butters, O. W., Norton, A. J., Hakala, P., Mukai, K., & Barlow, E. J. 2008, A&A, 487, 271
- de Martino et al. (2013) de Martino, D., Belloni, T., Falanga, M., et al. 2013, A&A, 550, A89
- Deneva et al. (2016) Deneva, J. S., Ray, P. S., Camilo, F., et al. 2016, ApJ, 823, 105
- Gentile et al. (2014) Gentile, P. A., Roberts, M. S. E., McLaughlin, M. A., et al. 2014, ApJ, 783, 69
- Halpern & Thorstensen (2015) Halpern, J. P., & Thorstensen, J. R. 2015, AJ, 150, 170
- Joshi et al. (2016) Joshi, A., Pandey, J. C., Singh, K. P., & Agrawal, P. C. 2016, ApJ, 830, 56
- Kalberla et al. (2005) Kalberla, P. M. W., Burton, W. B., Hartmann, D., et al. 2005, A&A, 440, 775
- Li et al. (2014) Li, M., Halpern, J. P., & Thorstensen, J. R. 2014, ApJ, 795, 115
- Lipkin & Leibowitz (2008) Lipkin, Y. M., & Leibowitz, E. M. 2008, MNRAS, 387, 289
- Masetti et al. (2006) Masetti, N., Morelli, L., Palazzi, E., et al. 2006, A&A, 459, 21
- Masetti et al. (2013) Masetti, N., Sbarufatti, B., Parisi, P., et al. 2013, A&A, 559, A58
- Massaro et al. (2013) Massaro, F., D’Abrusco, R., Paggi, A., et al. 2013, ApJS, 206, 13
- Mirabal et al. (2016) Mirabal, N., Charles, E., Ferrara, E. C., et al. 2016, ApJ, 825, 69
- Papitto et al. (2013) Papitto, A., Ferrigno, C., Bozzo, E., et al. 2013, Nature, 501, 517
- Roberts (2013) Roberts, M. S. E. 2013, in Proc. IAU Symp. 291, Neutron Stars and Pulsars: Challenges and Opportunities after 80 years, ed. J. van Leeuwen (Cambrige: Cambridge Univ. Press), 127
- Roberts et al. (2015) Roberts, M. S. E., McLaughlin, M. A., Gentile, P. A., et al. 2015, in Fifth Int. Fermi Symp. Proc. (arXiv:1502.07208)
- Romani (2012) Romani, R. W. 2012, ApJL, 754, L25
- Romani et al. (2015) Romani, R. W., Filippenko, A. V., & Cenko, S. B. 2015, ApJ, 804, 115
- Romani & Sanchez (2016) Romani, R. W., & Sanchez, N. 2016, ApJ, 828, 7
- Roy et al. (2015) Roy, J., Ray, P. S., Bhattacharyya, B., et al. 2015, ApJL, 800, L12
- Savoury et al. (2011) Savoury, C. D. J., Littlefair, S. P., Dhillon, V. S., et al. 2011, MNRAS, 415, 2025
- Schwarz et al. (2007) Schwarz, R., Schwope, A. D., Staude, A., et al. 2007, A&A, 473, 511
- Tang et al. (2014) Tang, S., Kaplan, D. L., Phinney, E. S., et al. 2014, ApJL, 791, 5
- Thorstensen & Armstrong (2005) Thorstensen, J. R., & Armstrong, E. 2005, ApJ, 130, 759
- Thorstensen & Halpern (2013) Thorstensen, J. R., & Halpern, J. 2013, AJ, 146, 107
- Wickramasinghe (1989) Wickramasinghe, D. T. 1989, in Proc. IAU Colloq. 114, White Dwarfs, ed. G. Wegner (Berlin: Springer), 314
- Worpel & Schwope (2015) Worpel, H., & Schwope, A. D. 2015, A&A, 583, A130
- Zacharias et al. (2013) Zacharias, N., Finch, C. T., Girard, T. M., et al. 2013, AJ, 145, 44