11email: stelzer@astropa.inaf.it 22institutetext: INAF - Osservatorio Astronomico di Capodimonte, Salita Moiariello 16, I-80131 Napoli, Italy 33institutetext: Department of Physics and Astronomy, University of Leicester, Leicester, LE1 7RH, UK
X-ray orbital modulation of a white dwarf accreting from an L dwarf
In an XMM-Newton observation of the binary SDSS J121209.31+013627.7, consisting of a white dwarf and an L dwarf, we detect X-ray orbital modulation as proof of accretion from the substellar companion onto the magnetic white dwarf. We constrain the system geometry (inclination as well as magnetic and pole-cap angle) through modelling of the X-ray light curve, and we derive a mass accretion rate of from the X-ray luminosity ( erg/s). From X-ray studies of L dwarfs, a possible wind driven from a hypothesized corona on the substellar donor is orders of magnitude too weak to explain the observed accretion rate, while the radius of the L dwarf is comparable to its Roche lobe (), making Roche-lobe overflow the likely accretion mechanism in this system.
Key Words.:
X-rays: binaries, Accretion, stars: white dwarfs, stars: brown dwarfs, stars: individual: SDSS J121209.31+013627.71 Introduction
Sensitive wide-field surveys such as SDSS and UKIDSS have boosted the number of known white dwarf (WD) main-sequence (MS) binaries. In the majority of these systems the non-degenerate component is an M dwarf.
Over systems consisting of a WD and an M dwarf (henceforth WDMD binaries) are known (Rebassa-Mansergas et al., 2013), but only about a dozen binaries that consist of a WD and an L dwarf (WDLD binaries) (see Sect. 3 for accreting systems and Casewell, 2014, for a summary of detached systems). This might be due to the difficulty of detecting such faint very late-type companions in the spectral energy distribution (SED) of WDs.
Similar to their higher-mass siblings, the WDMD binaries, the WDLD systems comprise both wide (separation tens to thousands of AU) and close binaries (period h). Only a handful of them are close systems (period 100 min) in which the low-mass companion must have survived a common-envelope phase (Nordhaus & Spiegel, 2013). The progenitors of wide systems composed of WD and brown dwarf (BD), the AU-scale BD-MS binaries, are also rarely discovered, and they define the so-called ‘brown dwarf desert’ (Marcy & Butler, 2000), suggesting that systems composed of WD and BD form rarely. However, the much more frequent WDMD binaries evolve into cataclysmic variables (CVs), and subsequently, both the binary separation and the donor mass decrease over time, which converts the donor into a close-in substellar object.
When the donor star leaves thermal equilibrium and starts to expand in response to its mass loss, the orbital evolution of a CV reverses. The period minimum that represents this change is observed and theoretically predicted to be at min (Gänsicke et al., 2009; Knigge et al., 2011), corresponding to a donor mass of . This means that the systems that have evolved beyond the period minimum, so-called period-bouncers, have a substellar donor. Binary population synthesis revealed that period-bouncing WDLD binaries are expected to be the greater portion ( %) of the whole CV population (Howell et al., 2001). The predicted high abundance of such systems is at odds with the very low detection rate. Systems with a very low-mass companion are difficult to identify because the contrast between the WD and L dwarf at optical and infrared wavelengths is low. Only a few binaries composed of a WD and a BD are confirmed spectroscopically.
The type of binary interaction in close WD / MS systems is tied to the evolutionary state. During the CV phase, accretion occurs through Roche-lobe overflow, while in detached systems wind accretion may take place. A handful of systems showing very weak mass accretion (, e.g. Schmidt et al., 2007) were defined as low accretion rate polars (LARPs; Schwope et al., 2002). However, in most of them the donor is underfilling its Roche lobe, meaning that they are in a pre-CV phase, and they must be accreting from a wind (Schwope et al., 2009). Magnetic siphons that channel the entire wind of the donor onto the WD have been proposed to explain this class of systems with a strongly magnetic WD but weak or absent X-ray emission (Webbink & Wickramasinghe, 2005).
Accretion rates of WD binaries can be inferred from the X-ray luminosity or from the broad-band UV to optical/near-IR spectral energy distribution (SED) arising from the accretion disk. H emission provides only an upper limit to the accretion rate, since this line can also have a significant contribution from the donor star’s chromospheric activity or its irradiation by the WD. For the same reason, detection of X-rays at low levels ( erg/s) from WD binaries with M-dwarf donors is not sufficient to diagnose accretion. However, magnetic activity drops sharply at late-M spectral types (e.g. West et al., 2004), and the coronal X-ray emission levels of L dwarfs are generally below the current sensitivity limits (Stelzer et al., 2006). Only one very nearby L dwarf has been detected in X-rays so far, at a level of (Audard et al., 2007). Therefore, an X-ray detection of a WDLD binary clearly points at accretion, whether through wind or Roche-lobe overflow. Only one short-period WDLD system has been detected as X-ray emitter so far, SDSS J121209.31+013627.7 (SDSS 1212 ), which has been reported as a weak Swift source by Burleigh et al. (2006).
SDSS 1212 is a magnetic WDLD binary (spectral type DA + L5/L8) with an average field strength of MG (Schmidt et al., 2005; Farihi et al., 2008). Schmidt et al. (2005) found narrow H emission with periodic radial velocity variation ( min) and large amplitude consistent with an origin in the L dwarf’s irradiated atmosphere. Photometric variability at the same period and roughly in anti-phase with the H emission also indicates that there is a hot spot on the WD surface (Burleigh et al., 2006). The -band light curve was shown by Debes et al. (2006) to be more consistent with cyclotron emission from a magnetic pole than with irradiation of a companion star. The authors also noted a clear excess in the and bands with respect to the expected SED of the WD, which was spectroscopically confirmed by Farihi et al. (2008) to be due to a late-L dwarf. Burleigh et al. (2006) determined that in an ks long Swift observation SDSS 1212 had a count rate of cts/s. They fitted the Swift X-ray spectrum with various one-temperature models, but the accretion mechanism (wind vs Roche lobe) could not be established. The photon statistics were also insufficient for studying the X-ray light curve.
Here we report on an XMM-Newton observation of SDSS 1212 from which we unambiguously confirm that it is an accreting WDLD system. We derive an improved estimate for its mass accretion rate and discuss the result in the framework of evolutionary scenarios for this system.
2 XMM-Newton observations and analysis
XMM-Newton observed SDSS 1212 on 6 June 2015 for ksec (Obs-ID 0760440101) with all EPIC instruments using the thin filter and with the Optical Monitor (OM) in fast mode using the band filter.
We restrict the analysis to EPIC/pn, which provides the highest sensitivity of the EPIC detectors. The data analysis was carried out with XMM-Newton’s Standard Science Analysis System (SAS) version 15.0.0. The observation is not affected by flaring particle background, therefore we used the full exposure time of ksec for the analysis. We filtered the data for pixel patterns (0 pattern 12), quality flag (flag = 0), and events channels (200 PI 15000). Source detection was performed in three energy bands: keV (S), keV (M), and keV (H) using a customized procedure based on the steps implemented in the SAS task edetect_chain. The net EPIC/pn source count rates are given in Table 1. We note that SDSS 1212 is also detected in the MOS cameras at a net count rate of cts/s and cts/s in the broad band for MOS 1 and MOS 2, respectively.
| Energy | Band | net source rate | |||
|---|---|---|---|---|---|
| [keV] | label | [cts/s] | |||
For the spectral and temporal analysis we allowed only pixel patterns with flag 4. We defined a circular photon extraction region with radius of centred on the EPIC/pn source position. The background was extracted from an adjacent circular region with radius of on the same CCD chip. The background subtraction of the light curve was carried out with the SAS task epiclccorr, which also corrects for instrumental effects. We then barycentre-corrected the photon arrival times using the SAS tool barycen.
The light curve shows a clear periodic modulation in all energy bands with larger amplitude for softer emission (Fig. 1). The modulation does not appear to be sinusoidal, displaying on-off behaviour that is typical of strongly magnetized accreting WDs or AM Her systems (Cropper, 1990). In the minimum the counts drop to zero, suggesting that the area of accretion, the pole cap, is completely occulted by the WD. All energy bands show flickering typical of X-ray emission from CVs.

Lomb-Scargle periodogram analysis of the broad band ( keV) light curve yields a period of min. This value and its error were derived with a bootstrap approach from simulated broad band light curves drawn randomly from the count rates and errors. This period is in good agreement with published periods for the H emission ( min; Schmidt et al., 2005), the near-IR photometry ( min; Debes et al., 2006), and the optical photometry ( min; Burleigh et al., 2006).
To first approximation we fitted a sinusoid to the light curve from which we determined the pulsed fraction () taking into account the uncertainties on y-offset and amplitude of the sine curve. The values obtained for the individual energy bands (see Table 1) are consistent with the % PF observed in polars.
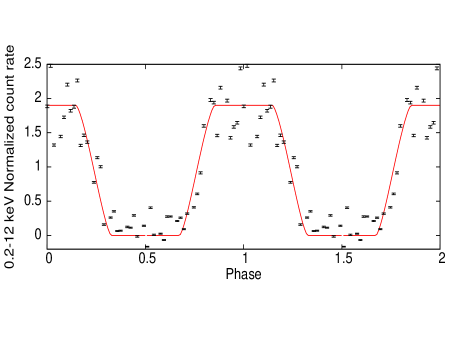
The phase-folded X-ray light curve of SDSS 1212 is displayed in Fig. 2 together with a geometric model based on the one presented by Wynn & King (1992) and Brinkworth et al. (2004), which describes direct accretion from a donor onto a WD magnetosphere with a post-shock region characterized through the angle between magnetic and rotation axis (), the pole-cap opening half-angle (), and the system inclination (). We ran the model over a range of parameter space to determine the likely values for these angles, assuming a single pole to be responsible for the variation. The modelling was performed on the X-ray light curve with a bin size of s. We found , , and . These values meet the criteria for the self-occultation as in Wynn & King (1992) and references therein. We confirmed the size of the accretion region using different binnings with lower time-resolution. We also explored the effects of a vertical extent of the column up to obtaining an upper limit of and no major effect on the values of the other parameters. A small vertical extent of the emission region is also suggested by the fact that the flux drops to zero and the ingress and the egress are steep.
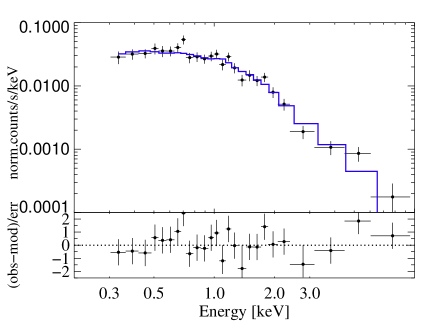
The EPIC/pn spectrum of SDSS 1212 was first fitted with single-component models: a power law, a black body, or an optically thin model, none of which adequately describes the spectral shape. When we add a simple absorber (tbabs) and leave the abundance free to vary, the thermal apec model provides a reasonable fit. However, the % confidence level of the abundance is compatible with zero, which is an unphysical result (see Table 2). We also tested representations with two spectral components. In particular, the spectrum is compatible with an absorbed two-temperature () thermal model [tbabs (apec + apec)], which yields a better than the one-temperature (1T) model. However, similar to the case of the 1T-model, the abundance cannot be constrained by the fit. If, in turn, the abundance is fixed to the value obtained from the 1T-model, the additional low-temperature component turns out to be completely unconstrained. We conclude that the observed spectrum does not provide information on a possible multi-temperature environment. There is therefore no evidence for an additional lower temperature blackbody component such as the one typically used to represent a soft excess in X-ray spectra of polars and intermediate polars ( keV, see e.g. Beuermann et al., 2012; Bernardini et al., 2012). Such a component would also be physically unacceptable as it would be locally super-Eddington.
| tbabs apec | ||||
|---|---|---|---|---|
| (dof) | [] | [keV] | [] | |
We show in Fig. 3 the observed EPIC/pn spectrum together with the 1T-model. The total galactic absorption in the direction of SDSS 1212 is (Dickey & Lockman, 1990), consistent with the value determined for the EPIC/pn spectrum. Given the distance of pc (Burleigh et al., 2006), the intrinsic absorption of the source must be very low.
The X-ray flux is , taking into account the bolometric correction to the keV range, and for the keV range. This latter value is similar to the value obtained by Burleigh et al. (2006) from the Swift spectrum () for an absorbed fit. Despite the low statistics of the Swift data, these measurements, taken about one decade apart, indicate that the X-ray source is rather stable in time. With the distance ( pc) from Burleigh et al. (2006), we determine the bolometric X-ray luminosity to . From the X-ray luminosity we derive a mass accretion rate of ; where we have used a slightly higher WD mass than Burleigh et al. (2006) (; see Sect. 3 for a justification) and a correspondingly smaller radius ( cm). This value for only includes the kinetic energy converted into X-ray luminosity. The value is higher when contributions from cyclotron emission and luminosity of the hot spot are considered.
The X-ray count rate in the minimum of the light curve () is cts/s with a standard deviation of cts/s. This corresponds to an upper limit of the X-ray luminosity. With the count-to-flux conversion factor derived from the time-averaged X-ray spectrum, we obtain . This value can be understood to represent the upper limit to any possible residual emission.
-band photometry acquired with the OM in fast mode, simultaneously with the X-ray observations, was extracted with the SAS task omfchain, and the time series was barycentre corrected. A Lomb-Scargle periodogram analysis did not yield a significant periodicity, and when folded on the X-ray period, no phase-related variability is seen (Fig. 1, lowest panel). At the time of the OM observation, SDSS 1212 was at =18.280.08 mag, which is consistent with the SED provided by Debes et al. (2006) and with the and photometry shown by Burleigh et al. (2006). The optical light curve presented by Burleigh et al. (2006) showed only a weak modulation ( % in and % in ). Given the low statistics of the OM data, it is therefore not surprising that no significant variability is detected in our -band light curve.
3 Discussion
To date, only four period-bounce candidates have infrared detections: EF Eri (Schwope et al., 2007), SDSS J 143317.78+101123.3 (Littlefair et al., 2013; Hernández Santisteban et al., 2016), WZ Sge (Harrison, 2016), and SDSS 1212 (Farihi et al., 2008). SDSS J 1433+1011 and WZ Sge are non-magnetic CVs, while EF Eri has been the textbook example for a LARP, but is also considered a candidate period bouncer (Schwope et al., 2007; Schwope & Christensen, 2010). The X-ray luminosity of EF Eri ( erg/s; see Schwope et al., 2007) is remarkably similar to our measurement for SDSS 1212 . However, no X-ray variability has be detected for EF Eri during its extended low state, implying that accretion (almost) stopped. Our detection of X-ray orbital modulation in SDSS 1212 , consistent with its binary period found with other methods, provides unambiguous proof for accretion from the L dwarf onto the WD and establishes this system as a new benchmark for interacting binaries consisting of a WD and a substellar companion with low accretion rates.
The X-ray luminosity of SDSS 1212 , both during our XMM-Newton observation in 2015 and during the Swift observation nine years before, is several orders of magnitude higher than that of any single L dwarf (; see Audard et al. 2007 and the compilation by Cook et al., 2014), clearly ruling out coronal emission from the ultracool companion. Together with its orbital modulation, the high X-ray luminosity of SDSS 1212 therefore is another clear piece of evidence for accretion onto the magnetized WD.
Following the lines of argument in Webbink & Wickramasinghe (2005), the mass flux driven by coronal X-ray emission from an L dwarf with an assumed would be at most. The detection of winds from late-type stars requires high-resolution UV spectroscopy and is at present not possible for L dwarfs. A very small number of late-type stars have measured wind accretion rates, including two M dwarfs that show much smaller than expected from the empirical vs relation for solar-type stars (Wood et al., 2015). Extrapolating from that relation to low , for an adopted for the L dwarf, its wind would be , making it difficult to provide the observed accretion rate of SDSS 1212 (considering that we measured a lower limit of ). This leaves Roche-lobe overflow as the most likely origin for the mass transfer.
Farihi et al. (2008) estimated the L-dwarf radius as and calculated the Roche lobe to be . However, this is based on the assumption that the WD mass is , a value typical of a non-magnetic, isolated WD. There is evidence that WDs in CVs have higher masses than single WDs and those in detached systems (Zorotovic et al., 2011). Moreover, single magnetic WDs have also been found to be more massive than non-magnetic WDs (Ferrario et al., 2015). Considering that the non-magnetic CV SDSS 1433+1011 – with an L-dwarf companion – has a mass of (Littlefair et al. 2008, Hernández Santisteban et al. 2016), assuming a mass of for SDSS 1212 is therefore plausible. For this value, using Eq. 5 from Breedt et al. (2012), we determine , which is closer to the L-dwarf radius. Our detection of accretion, and thus the presence of an X-ray emitting region on the WD, also provides an explanation for the H emission previously observed from SDSS 1212 , as due to irradiation of the donor by the X-ray emission from the accreting WD. As a result of the irradiation the L dwarf may be inflated, making Roche-lobe filling even more likely.
To conclude, SDSS 1212 presents the characteristics of the long-sought class of period-bounce CVs (cool WD, substellar donor mass, and weak accretion), and it is located in the observationally still nearly unpopulated ‘boomerang’ region of CV evolution models (e.g. Howell et al., 2001) that awaits observational confirmation. SDSS 1212 is the first WDLD binary found to exhibit clear accretion-induced X-ray variability at a very low accretion rate. The WDLD binary EF Eri has long been known to show X-ray orbital modulation during high states (e.g. Patterson et al., 1981), but in its current low state the X-ray emission could not be found to be modulated at the WD spin/binary orbit (Schwope et al., 2007).
The X-ray orbital modulation of SDSS 1212 suggests that accreting WDLD systems may be easy to identify in the X-ray band through the magnetically confined accretion flow onto the polar regions of the WD. Sensitive searches for X-rays from WDLD binaries can therefore be expected to provide further examples of pulsed emission, ensuing determination of mass accretion rates at very weak levels, and the characterization of the multi-wavelength properties of the so far widely elusive class of period-bounce CVs.
Acknowledgements.
DDM acknowledges financial support from ASI INAF I/037/12/0. SLC acknowledges support from the University of Leicester College of Science and Engineering.References
- Audard et al. (2007) Audard, M., Osten, R. A., Brown, A., et al. 2007, A&A, 471, L63
- Bernardini et al. (2012) Bernardini, F., de Martino, D., Falanga, M., et al. 2012, A&A, 542, A22
- Beuermann et al. (2012) Beuermann, K., Burwitz, V., & Reinsch, K. 2012, A&A, 543, A41
- Breedt et al. (2012) Breedt, E., Gänsicke, B. T., Girven, J., et al. 2012, MNRAS, 423, 1437
- Brinkworth et al. (2004) Brinkworth, C. S., Burleigh, M. R., Wynn, G. A., & Marsh, T. R. 2004, MNRAS, 348, L33
- Burleigh et al. (2006) Burleigh, M. R., Marsh, T. R., Gänsicke, B. T., et al. 2006, MNRAS, 373, 1416
- Casewell (2014) Casewell, S. L. 2014, Mem. Soc. Astron. Italiana, 85, 731
- Cook et al. (2014) Cook, B. A., Williams, P. K. G., & Berger, E. 2014, ApJ, 785, 10
- Cropper (1990) Cropper, M. 1990, Space Sci. Rev., 54, 195
- Debes et al. (2006) Debes, J. H., López-Morales, M., Bonanos, A. Z., & Weinberger, A. J. 2006, ApJ, 647, L147
- Dickey & Lockman (1990) Dickey, J. M. & Lockman, F. J. 1990, ARA&A, 28, 215
- Farihi et al. (2008) Farihi, J., Burleigh, M. R., & Hoard, D. W. 2008, ApJ, 674, 421
- Ferrario et al. (2015) Ferrario, L., de Martino, D., & Gänsicke, B. T. 2015, Space Sci. Rev., 191, 111
- Gänsicke et al. (2009) Gänsicke, B. T., Dillon, M., Southworth, J., et al. 2009, MNRAS, 397, 2170
- Harrison (2016) Harrison, T. E. 2016, ApJ, 816, 4
- Hernández Santisteban et al. (2016) Hernández Santisteban, J. V., Knigge, C., Littlefair, S. P., et al. 2016, Nature, 533, 366
- Howell et al. (2001) Howell, S. B., Nelson, L. A., & Rappaport, S. 2001, ApJ, 550, 897
- Knigge et al. (2011) Knigge, C., Baraffe, I., & Patterson, J. 2011, ApJS, 194, 28
- Littlefair et al. (2008) Littlefair, S. P., Dhillon, V. S., Marsh, T. R., et al. 2008, MNRAS, 388, 1582
- Littlefair et al. (2013) Littlefair, S. P., Savoury, C. D. J., Dhillon, V. S., et al. 2013, MNRAS, 431, 2820
- Marcy & Butler (2000) Marcy, G. W. & Butler, R. P. 2000, PASP, 112, 137
- Nordhaus & Spiegel (2013) Nordhaus, J. & Spiegel, D. S. 2013, MNRAS, 432, 500
- Patterson et al. (1981) Patterson, J., Williams, G., & Hiltner, W. A. 1981, ApJ, 245, 618
- Rebassa-Mansergas et al. (2013) Rebassa-Mansergas, A., Schreiber, M. R., & Gänsicke, B. T. 2013, MNRAS, 429, 3570
- Schmidt et al. (2007) Schmidt, G. D., Szkody, P., Henden, A., et al. 2007, ApJ, 654, 521
- Schmidt et al. (2005) Schmidt, G. D., Szkody, P., Silvestri, N. M., et al. 2005, ApJ, 630, L173
- Schwope et al. (2002) Schwope, A. D., Brunner, H., Hambaryan, V., & Schwarz, R. 2002, in Astronomical Society of the Pacific Conference Series, Vol. 261, The Physics of Cataclysmic Variables and Related Objects, ed. B. T. Gänsicke, K. Beuermann, & K. Reinsch, 102
- Schwope & Christensen (2010) Schwope, A. D. & Christensen, L. 2010, A&A, 514, A89
- Schwope et al. (2009) Schwope, A. D., Nebot Gomez-Moran, A., Schreiber, M. R., & Gänsicke, B. T. 2009, A&A, 500, 867
- Schwope et al. (2007) Schwope, A. D., Staude, A., Koester, D., & Vogel, J. 2007, A&A, 469, 1027
- Stelzer et al. (2006) Stelzer, B., Micela, G., Flaccomio, E., Neuhäuser, R., & Jayawardhana, R. 2006, A&A, 448, 293
- Webbink & Wickramasinghe (2005) Webbink, R. F. & Wickramasinghe, D. T. 2005, in Astronomical Society of the Pacific Conference Series, Vol. 330, The Astrophysics of Cataclysmic Variables and Related Objects, ed. J.-M. Hameury & J.-P. Lasota, 137
- West et al. (2004) West, A. A., Hawley, S. L., Walkowicz, L. M., et al. 2004, AJ, 128, 426
- Wood et al. (2015) Wood, B. E., Linsky, J. L., & Güdel, M. 2015, in Astrophysics and Space Science Library, Vol. 411, Characterizing Stellar and Exoplanetary Environments, ed. H. Lammer & M. Khodachenko, 19
- Wynn & King (1992) Wynn, G. A. & King, A. R. 1992, MNRAS, 255, 83
- Zorotovic et al. (2011) Zorotovic, M., Schreiber, M. R., & Gänsicke, B. T. 2011, A&A, 536, A42