Physical Properties of Molecular Clouds at 2 parsec Resolution
in the Low-Metallicity Dwarf Galaxy NGC 6822 and the Milky Way
Abstract
We present the ALMA survey of CO(2-1) emission from the 1/5 solar metallicity, Local Group dwarf galaxy NGC 6822. We achieve high ( pc) spatial resolution while covering large area: four pc pc regions that encompass of NGC 6822’s star formation. In these regions, we resolve compact CO clumps that have small radii ( pc), narrow line width ( km s-1), and low filling factor across the galaxy. This is consistent with other recent studies of low metallicity galaxies, but here shown with a larger sample. At parsec scales, CO emission correlates with emission better than with emission and anti-correlates with H, so that PAH emission may be an effective tracer of molecular gas at low metallicity. The properties of the CO clumps resemble those of similar-size structures in Galactic clouds except of slightly lower surface brightness and CO-to-H2 ratio the Galactic value. The clumps exist inside larger atomic-molecular complexes with masses typical for giant molecular cloud. Using dust to trace H2 for the entire complex, we find CO-to-H2 to be the Galactic value, but with strong dependence on spatial scale and variations between complexes that may track their evolutionary state. The H2-to-H i ratio is low globally and only mildly above unity within the complexes. The SFR-to-H2 ratio is higher in the complexes than in massive disk galaxies, but after accounting for the bias from targeting star-forming regions, we conclude that the global molecular gas depletion time may be as long as in massive disk galaxies.
Subject headings:
galaxies: individual (NGC 6822) – ISM: clouds – H ii regions – radio lines: ISM1. Introduction
Observations show that stars form in cold, dense clouds composed of molecular (H2) gas. However, our understanding of the physical processes of molecular cloud and star formation is still limited (see reviews by McKee & Ostriker, 2007; Kennicutt & Evans, 2012; Tan et al., 2014). In particular, our knowledge of how molecular cloud structure relates to star formation is rapidly evolving. Over the past decade, this link has been explored via detailed observations of clouds in our own Galaxy. These show that the density structure inside molecular clouds is governed by super-sonic turbulence, which creates a (column) density probability distribution function (pdf) of log-normal shape (see review by Mac Low & Klessen, 2004). In molecular clouds forming stars, observations also find that this pdf exhibits a power-law tail at high column densities. This tail corresponds to small, pc-sized, high (column) density gas clumps likely to collapse under their self-gravity and form a new generation of stars (e.g., Kainulainen et al., 2009; Rathborne et al., 2014; Abreu-Vicente et al., 2015). We also observe that the structure of molecular clouds has an imprint on the output stellar population: the shape of the clump mass function and the stellar initial mass function are similar (e.g., Alves et al., 2007; Rathborne et al., 2009); there is an apparent column density threshold for high mass star formation (Kauffmann & Pillai, 2010); and the maximum cloud mass and maximum stellar cluster mass in galaxies correlate and both increase with the gas pressure (Kruijssen, 2014).
The number of clouds and the diversity of physical environments and evolutionary states that can be probed in the Milky Way remain limited. With the Atacama Large Millimeter/submillimeter Array (ALMA), we can now resolve molecular cloud structure in the nearest galaxies (e.g., Indebetouw et al., 2013). This allows the prospect to measure the link between galactic environment, cloud structure, and star formation beyond only the Solar Neighborhood. A main first target of such studies are low mass, low metallicity galaxies. These “primitive” systems are of interest because they appear so different from large spiral galaxies like the Milky Way. They have large reservoirs of atomic gas in extended distributions, with long total gas consumption times and high gas mass fractions compared to present-day large spiral galaxies. Their low abundance of metals affects their observed properties and may be expected to influence the abundance of cold gas, the structure of cold clouds, and the ability of gas to form stars. These targets are of particular interest because early galaxies share many of these properties. Although present day dwarf galaxies are not perfect analogs to early-universe systems, the first galaxies were certainly born with few metals and few stars, so that the physics that we measure in these local galaxies would have also been at play there.
Metals, both in the gas phase and in the form of interstellar dust, should affect the structure of star-forming clouds. Gas-phase metals act as important coolants, while dust shields cloud interiors from external radiation, which would heat the gas and dissociate molecules. Interstellar dust also facilitates molecule formation via reactions on grain surfaces. Because low temperatures make the gas clouds susceptible to gravitational collapse, both cooling and shielding are important to the ability of gas to form stars. If the formation of cold, dense gas depends on the abundance of metals, then pristine (low metallicity) environments may be rendered inefficient or unable to form stars. On the other hand, recent theoretical work suggests that molecules may not be essential to form cold, dense gas because neutral atoms or ions (e.g., carbon and oxygen) can act as effective coolants in pristine gas (Glover & Clark, 2012a). However, these regions may also host H2 molecules because of the absence of dissociating radiation. In this case, the main effect of a lack of metals may be observational, rendering molecular gas hard to see or changing the balance of atomic and molecular gas in cold regions but not the overall ability of gas to form stars. An observational confirmation of this picture remains to be made.
We need observations to test how metals affect molecular cloud structure and star formation, but the lack of metals complicates the process of observing molecular clouds. In our Galaxy, molecular cloud structure is mapped by observing dust extinction, dust emission, or molecular line emission. Unfortunately, H2 molecules are a very inefficient emitter in the cold interstellar medium and absorption measurements require a bright background source. Less common, but more visible molecules, most commonly carbon monoxide (CO), are used to trace H2. Of course, both dust and CO are made of metals, complicating their use to trace gas in metal-poor systems. For CO the problem is even more complex, because the abundance of CO depends on shielding by dust or H2 from dissociating radiation and the conditions for CO to survive differ somewhat from those for H2 to survive. In the Solar Neighborhood, this is only a modest concern because dust absorbs energetic photons over a broad wavelength range. As result, CO and H2 are well-mixed and CO observations provide an efficient and reliable tracer of the molecular gas. In low metallicity environments this is no longer the case. With decreasing metal and thus dust abundance, H2 self-shielding becomes the primary shielding mechanism against dissociating radiation. Due to its low abundance CO cannot (effectively) self-shield and persists only in regions where H2 has absorbed all dissociating radiation in the Lyman-Werner bands (Wolfire et al., 2010). Thus, CO emission traces only the densest, most opaque parts of molecular clouds, while H2 remains to fill most of the cloud volume. These physics are thought to give a strong metallicity dependence for the CO-to-H2 conversion factor averaged over whole clouds or galaxies (see review by Bolatto et al., 2013).
Despite these concerns, CO remains the second most abundant molecule in metal-poor galaxies and CO emission is an indispensable tool to detect cold, dense clouds and map their structure. Other indirect tracers of H2, including optical extinction, dust emission, ionized or neutral atomic lines, and other molecular lines also suffer from metallicity effects. More practically, the resolution and sensitivity of ALMA still makes CO the fastest way to map molecular cloud structure at low metallicity.
Observations do show CO emission to be faint in low metallicity galaxies. The ratio of CO emission to star formation is a strong function of metallicity, with more metal-poor galaxies showing much less CO per unit star formation than metal-rich galaxies (Schruba et al., 2012). Observations of molecular clouds in the Magellanic Clouds at pc resolution show that their CO luminosities are much lower than those of Galactic clouds of comparable size (e.g., Fukui et al., 2008; Hughes et al., 2010). On the other hand, dust emission indicates significant amounts of H2 gas (i.e., excess IR emission for their H i mass) so that the CO-to-H2 conversion factor can be orders of magnitude higher than in our Galaxy (Bolatto et al., 2011; Leroy et al., 2011; Jameson et al., 2016; Shi et al., 2015). Following the physical scenario above, one popular interpretation of these observations is that CO is selectively photodissociated compared to H2 over a large area in low metallicity molecular clouds; in this case, CO molecules persist only in the most opaque, densest gas clumps (e.g., Pak et al., 1998; Bolatto et al., 2013).
The most direct test of this scenario is to resolve the structure of individual low metallicity molecular clouds. For a long time, this was only possible in the Large and Small Magellanic Clouds (LMC and SMC with and solar abundance, respectively), and even then only at pc resolution (e.g., Mizuno et al., 2001; Bolatto et al., 2003; Wong et al., 2011). ALMA changes this, allowing pc scale measurements of cloud structure in low metallicity galaxies throughout the Local Group. Indebetouw et al. (2013) demonstrated this capability, presenting a sub-pc-resolution view of a (small) part of the 30 Doradus region in the LMC. Recently, Rubio et al. (2015) presented CO(1-0) observations from the Local Group galaxy WLM, which has only solar abundance. They found CO emission to originate from small ( pc across) structures that fill only a tiny fraction of the molecular cloud area. Despite strong differences in CO morphology, Rubio et al. estimated that the physical properties (density, pressure, and self-gravity) of these CO-emitting structures are comparable to clumps of similar size in metal-rich clouds as observed in the Solar Neighborhood. This result argues that the star formation process and the resulting stellar population (e.g., stellar initial mass function and star cluster properties) may be only weakly affected by changing metallicity, with the main influence of metallicity to be changing the distribution of the CO tracer molecules.
Rubio et al. (2015) found ten CO-emitting clumps in two molecular clouds in one galaxy and Indebetouw et al. (2013) studied a single region. With the goal of a statistical measurement of the structure of CO in low metallicity clouds over a wide area, we used ALMA to map CO(2-1) emission across five star-forming complexes in the Local Group dwarf galaxy NGC 6822. These five regions contain the bulk of the ongoing star formation activity in NGC 6822. By using a set of large mosaics (260 pointings in total) at mm, we are able to cover the whole area of each complex, from cloud core to outskirts, while still achieving the highest spatial resolution (2 pc) yet reached to study cloud structure in any galaxy beyond the Magellanic Clouds.
In this paper, we present this new ALMA survey of NGC 6822 (section 2) and use it to measure the structure of the star-forming ISM at low metallicity (section 3). Our results are presented in section 4. We estimate the global CO luminosity of NGC 6822 (subsection 4.1). Then we measure the large-scale properties — size, mass, density, and phase balance — of the atomic-molecular complexes that host the CO emission (subsection 4.2). Subsequently we characterize the spatial and spectral intensity distribution of CO emission from these complexes by comparing it to other PDR tracers (subsection 4.3) and to those in Galactic molecular clouds (subsection 4.4). Finally, we derive the small-scale properties — size, line width, mass, and gravitational boundedness — of the CO-bright clumps in our data and compare them to comparable-size structures in WLM and our own Galaxy (subsection 4.5). We conclude by discussing these results (section 5) and providing a brief summary (section 6).
1.1. The Low Metallicity Dwarf Galaxy NGC 6822
Table 1 summarizes the global properties of NGC 6822. In many ways NGC 6822 resembles a two times less massive version of the SMC (e.g., Jameson et al., 2016) except that the SMC is currently undergoing a strong interaction with the LMC and Milky Way. The proximity ( kpc; Rich et al., 2014) makes NGC 6822 an ideal target to study cloud structure and star formation at high resolution; at this distance, pc so that ALMA easily resolves cloud sub-structure. Like other comparatively isolated dwarf irregular galaxies, NGC 6822 is rich in gas with an atomic gas mass111Throughout the paper, all gas masses include a factor of to account for heavy elements and literature values are re-scaled to our adopted distance where necessary. of (Weldrake et al., 2003; de Blok & Walter, 2006a). This is comparable to the galaxy’s stellar mass, (Madden et al., 2014), so that the gas mass fraction is . NGC 6822 is actively forming stars, the star formation rate (SFR) derived from various tracers is M⊙ yr-1 (Efremova et al., 2011, and references therein), giving it a specific star formation rate, yr-1, typical of a star-forming galaxy.
| Property | Value | Reference |
|---|---|---|
| Hubble Type | IB(s)m (9.8) | NED/LEDA |
| R. A. aaOptical center, the Hi dynamical center is nearby. | 19h 44m 57.74s | NED |
| DEC. aaOptical center, the Hi dynamical center is nearby. | 14d 48m 12.4s | NED |
| Distance | kpc | Rich et al. (2014) |
| Systemic Vel. | km s-1 | Koribalski et al. (2004) |
| Inclination | deg | Weldrake et al. (2003) |
| Position Angle | deg | Weldrake et al. (2003) |
| E(B-V)foregrnd | mag | Schlafly & Finkbeiner (2011) |
| E(B-V)internal | mag | Efremova et al. (2011) |
| dex | García-Rojas et al. (2016) | |
| arcmin | LEDA | |
| mag | Dale et al. (2007) | |
| Madden et al. (2014) | ||
| Weldrake et al. (2003) | ||
| Gratier et al. (2010) | ||
| bbDust mass derived for an amorphous carbonaceous component. | Rémy-Ruyer et al. (2015) | |
| GDR bbDust mass derived for an amorphous carbonaceous component. | for above values | |
| SFR(mix) | M⊙ yr-1 | Efremova et al. (2011) |
Note. — All masses scaled according to our adopted distance.
Despite abundant atomic gas and signatures of high mass star formation, NGC 6822 has a modest reservoir of molecular gas. The molecular gas mass is (based on IRAM 30-m observations by Gratier et al., 2010, but also see subsection 4.1 & 5.5 below). Like other low mass galaxies, NGC 6822 is poor in metals, with metallicity the Solar value222Throughout the paper, we assume a solar oxygen abundance and a total solar mass fraction of metals (Asplund et al., 2009). (, García-Rojas et al., 2016; Hernández-Martínez et al., 2009). It is also poor in dust, with dust mass333We adopt their dust mass estimate derived from fitting the Galliano et al. (2011) semi-empirical dust model and assuming an amorphous carbon composition. (Rémy-Ruyer et al., 2015). The implied gas-to-dust ratio is , which is times the Solar Neighborhood value of (Zubko et al., 2004; Rémy-Ruyer et al., 2014), but with a factor of uncertainty.
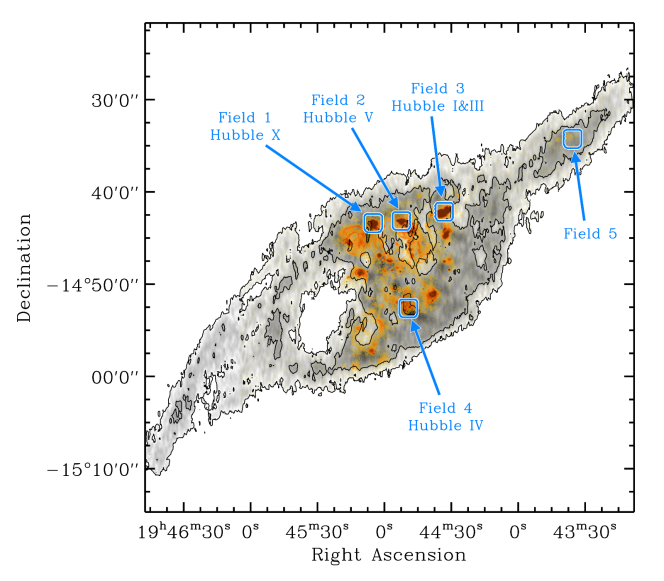
Figure 1 shows the morphology of NGC 6822 in atomic gas (gray scale) and recent star formation traced by H (orange color) with our ALMA survey fields marked (blue boxes). Star formation is concentrated in the inner part of the H i distribution, coincident with the main stellar disk. Our four inner ALMA fields target prominent star-forming (H ii) regions in this active area. Together, these harbor 63% of the global H flux and 65% of the global Spitzer flux (a tracer of embedded star formation), so that with our ALMA survey we probe the cloud complexes responsible for of the current star formation activity in NGC 6822. Our fifth field targets a region in the north-west part of the H i disk, selected to search for cold gas associated with low-level star formation activity evidenced in optical, ultraviolet, and H imaging (de Blok & Walter, 2003, 2006b).
| Property | Unit | Field 1 | Field 2 | Field 3 | Field 4 | Field 5 |
|---|---|---|---|---|---|---|
| H ii Region Name | Hubble X | Hubble V | Hubble I & III | Hubble IV | ||
| Cluster Name | OB 13 | OB 8 | OB 1 & 3 | OB 5 | ||
| Cluster Mass | M⊙ | |||||
| No. O-type stars | 35 OB2V | |||||
| No. OB-type stars | 70 OB5V | 80 OB5V | ||||
| H Luminosity | erg s-1 | 3.362 (18%) | 4.100 (22%) | 3.409 (18%) | 0.941 (5.0%) | 0.010 (0.1%) |
| 8 m Flux Density | micro Jy | 0.087 (2.3%) | 0.211 (5.5%) | 0.055 (1.5%) | 0.150 (3.9%) | |
| 24 m Flux Density | micro Jy | 0.241 (9.4%) | 0.931 (36%) | 0.155 (6.0%) | 0.332 (13%) | |
| ALMA Cycle 1 CO(2-1) Data (Natural Weighting) | ||||||
| Beam Major Axis | arcsec | 0.97 | 1.03 | 1.04 | 1.55 | 1.16 |
| Beam Minor Axis | arcsec | 0.71 | 0.69 | 0.69 | 0.68 | 0.74 |
| Beam Size | arcsec | 0.83 | 0.85 | 0.85 | 1.03 | 0.92 |
| parsec | 1.90 | 1.94 | 1.96 | 2.36 | 2.13 | |
| Rms Noise | milly Jy | 18.7 | 14.1 | 14.9 | 12.4 | 13.1 |
| K | 0.63 | 0.45 | 0.47 | 0.27 | 0.35 | |
| Sensitivity | K km s-1 | 1.1 | 0.8 | 0.8 | 0.5 | 0.6 |
| M⊙ pc-2 | 4.9 | 3.5 | 3.7 | 2.1 | 2.7 | |
| 17.5 | 13.3 | 14.0 | 11.7 | 12.3 | ||
| Flux | K km s-1 | 15.1 | 117.6 | 24.3 | 123.5 | |
| Luminosity | K km s-1 pc2 | 1.8 | 14.0 | 2.9 | 14.7 | |
| Mass (for ) | 7.8 | 60.8 | 12.6 | 63.8 | ||
| ALMA Cycle 1 1.3 mm Continuum Data (Natural Weighting) | ||||||
| Beam Size | arcsec | 0.87 | 0.89 | 0.90 | 1.08 | 0.96 |
| Rms Noise | milly Jy | 0.19 | 0.16 | 0.17 | 0.14 | 0.13 |
| Atomic-Molecular Complex Masses as derived from Herschel Dust Modelling | ||||||
| H i mass | ||||||
| Dust mass | ||||||
| GDR | ||||||
| Inferred H i+H2 mass | ||||||
| Inferred H2 mass | ||||||
| Inferred | pc (K km s) | |||||
Note. — Adopted distance kpc; CO brightness temperature ratio ; and CO-to-H2 conversion factor M⊙ pc-2 (K km s-1)-1. Sensitivity () determined over km s-1. Percentages (given in parantheses) for H, , fluxes state fractions of NGC 6822’s global fluxes.
Table 2 summarizes the properties of our target regions. All four inner regions have been studied extensively and two of them, Hubble V & X (our ALMA Fields 2 & 1), are classic targets for extragalactic studies of young stellar clusters. As a result, they have been studied via ground-based optical broadband (Bianchi et al., 2001; de Blok & Walter, 2000) and narrowband (H) imaging (Hodge et al., 1989; de Blok & Walter, 2006b), as well as space-based broadband (Bianchi & Efremova, 2006; Bianchi et al., 2012; Efremova et al., 2011) and narrowband (various nebular lines) imaging (O’Dell et al., 1999). These studies show that all four inner regions are actively forming massive stars and have likely done so for the past Myr. They contain up to OB-type stars each and have H luminosities of a few times erg s-1, which would rank them among the brightest and most massive star-forming regions in our Galaxy. There is no clear evolutionary sequence established in the literature, but Hubble IV & V (our ALMA Fields 4 & 2) show more compact CO and SFR morphologies than Hubble I&III & X (our ALMA Fields 3 & 1) and higher ratios of embedded to exposed SFR tracer luminosities ( or versus H; Table 2). Based on this, we argue below that these two regions (Fields 4 & 2) may be currently more active (i.e., younger) than the others.
2. ALMA Survey
| Target Field | Execution Block | Start Time | No. of Antennas | Average Elevation | Precipitable Water Vapor |
|---|---|---|---|---|---|
| (UTC) | (degrees) | (mm) | |||
| Field 1 | uid://A002/X7d44e7/X1d11 | 2014-03-23 10:06:34 | 32 (2 flagged) | 63 | 2.6 |
| Field 2 | uid://A002/X7d727d/X63 | 2014-03-24 09:44:57 | 33 (1 flagged) | 60 | 1.4 |
| Field 3 | uid://A002/X7d727d/X1d6 | 2014-03-24 10:29:44 | 33 (2 flagged) | 70 | 1.3 |
| Field 4 | uid://A002/X7d76cc/X19aa | 2014-03-25 08:51:45 | 32 (0 flagged) | 49 | |
| Field 5 | uid://A002/X7d76cc/X1e03 | 2014-03-25 11:22:38 | 31 (0 flagged) | 80 | 0.6 |
We observed five fields in NGC 6822 with ALMA in Cycle 1 using the 1.3-mm Band 6 receivers (project code: 2013.1.00351.S; PI. A. Schruba). Each field consists of 52 pointings distributed in a Nyquist-spaced hexagonal grid and covers a area at kpc. The fields are centered on prominent H ii regions. They are shown in Figure 1 with their properties listed in Table 2. Our spectral setup includes one “line” spectral window targeting CO(2-1). This window has bandwidth GHz with channel width kHz ( km s-1) and is centered at 230.612 GHz. This “line” spectral window covers the CO(2-1) line (rest frequency 230.538 GHz) over a velocity range of to km s-1 (LSRK), easily enough to capture all emission from NGC 6822 (systemic velocity km s-1 LSRK).
Table 3 reports dates and weather conditions for each observing session. Each session contains observations of a bandpass calibrator. This was the quasar J1924-2914 (flux density Jy at the time of observations) for Fields 1, 2, 3, 5 and J1733-1304 (flux density Jy at the time of observations) for Field 4. For all sessions, the phase calibrator was J1939-1525 (inferred flux density of 0.23 Jy at the time of observation). Titan was observed during three observing sessions (Fields 2, 3, 4) to set the absolute flux scale with an estimated uncertainty of using the Butler-JPL Horizons-2012 model (ALMA Memo #594). The same flux scale was imposed on the other two data sets that lack observations of Titan (Fields 1, 5) by requiring the two quasars to have the same flux densities for all observations.
The data were processed in the Common Astronomy Software Applications package (CASA, version 4.2.2; Petry & CASA Development Team, 2012) using the “analyst-calibrated” data sets created with help of the QA2 script-generator tool. The calibrated visibilities were imaged and deconvolved with the clean task using standard parameters. We chose an angular pixel scale of and a channel width of km s-1 and imaged the data using natural weighting. We restored the deconvolved image using a single fixed elliptical Gaussian for each mosaic, so that each image has a single beam.
The properties of the final data cubes are listed in Table 2. The average synthesized beam size has FWHM pc and the achieved rms brightness sensitivity is K. This translates to a surface brightness sensitivity of K km s-1 over 5 km s-1 (about 2 the FWHM for a typical CO structure; see below). For an appropriate choice of conversion factor (see below), the implied sensitivity in molecular gas mass surface density is M⊙ pc-2 and the point source sensitivity is .
The ALMA observations include baselines of m length. Thus, emission extending over scales larger than the maximum recoverable scale of about pc is missing in our data sets. We can estimate the amount of missing flux from existing IRAM 30-m CO(2-1) mapping at pc resolution (Gratier et al., 2010), which covers the ALMA Fields 1, 2, 3. However, only Field 2 has been robustly detected in the IRAM 30-m data at a noise level of mK over km s-1. For this field, the ALMA observations recover of the single-dish flux. The large uncertainty reflects the difficulty to determine the total flux in the IRAM 30-m cube due to baseline instabilities. The spatial distribution of CO in our other fields is comparable to that in Field 2 or more compact, so we expect a similar level of flux recovery throughout the survey.
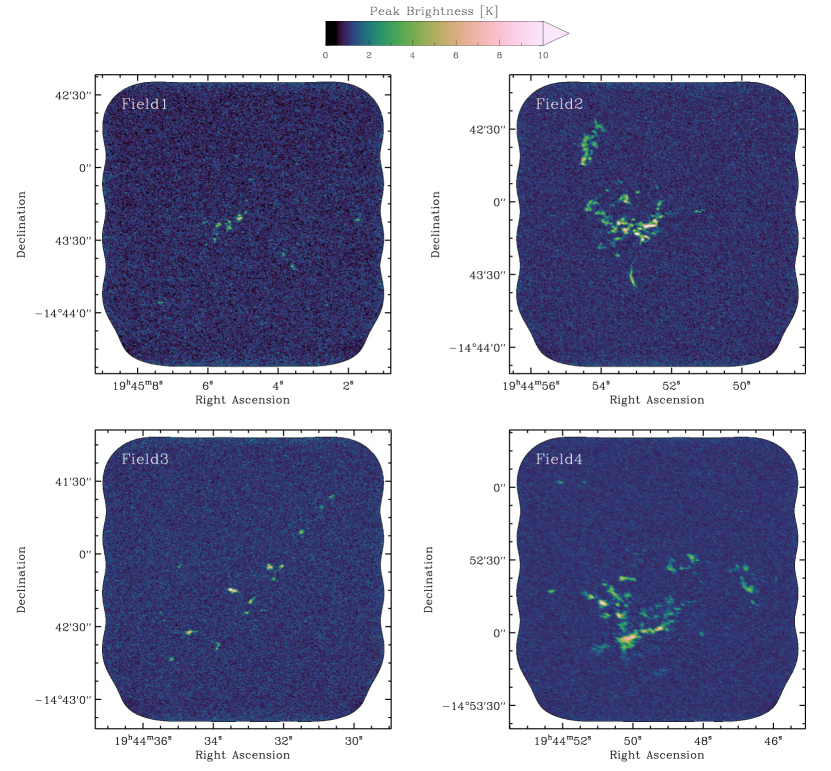
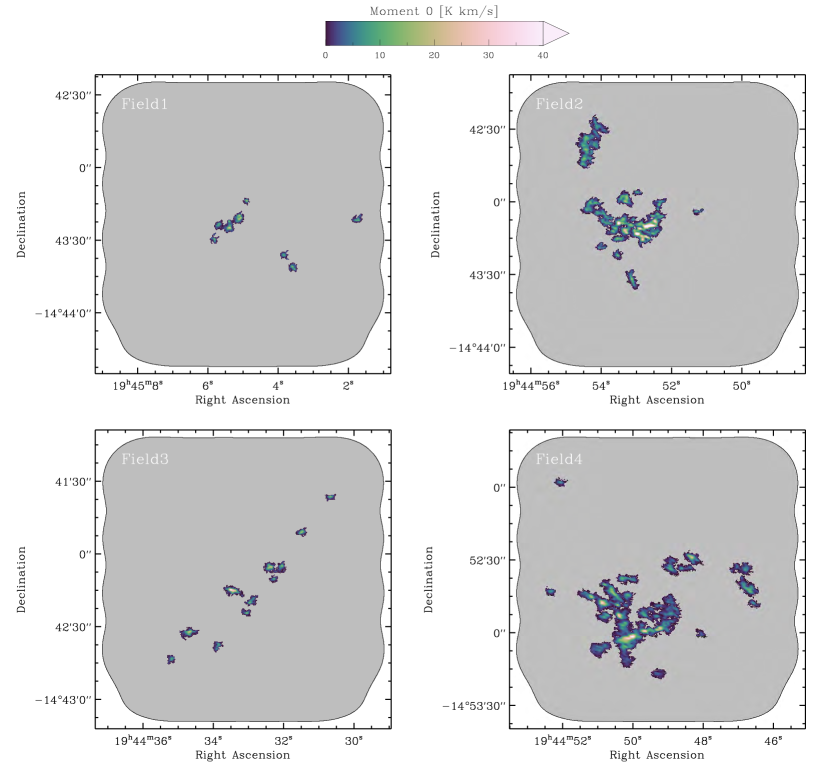
We identify genuine emission in the cubes by searching for emission peaks above in two adjacent channels which we then grow to include all neighboring pixels above . This method is somewhat conservative and holds the potential to miss real but low signal-to-noise emission. However, the comparison to the IRAM 30-m data suggests that the amount of signal missed has to be small.
In addition to CO(2-1), we also observed three “continuum” spectral windows, each with 2 GHz bandwidth and 15.625 MHz channel width, centered at 229.196 GHz, 215.063 GHz, and 213.188 GHz. We imaged these using the clean task with the “multi-frequency synthesis” (mfs) mode. The synthesized beam sizes ( pc) and achieved rms sensitivity ( mJy) are also listed in Table 2. Despite a few bright pixels, widespread continuum emission is not detected and we defer discussion of this part of the data to future work.
3. Other Data & Methodology
We analyze the results of our survey in four ways. First, we extrapolate the results of our survey to make some observations about NGC 6822 as a whole. Then we consider the large-scale structure of star-forming atomic-molecular complexes, comparing the distributions of atomic gas, molecular gas, and dust across each field. Because atomic gas and dust are observed at much coarser resolution than our CO survey, this comparison is restricted to large spatial scales, reducing each of our fields to a element grid. After this, we examine the distribution of CO at high resolution, including cross-comparison with tracers of hot dust and recent star formation. Finally, we report the detailed properties of the compact CO clumps in our maps.
3.1. Tracers of Recent Star Formation
We compare the CO emission to H and dust emission. At low resolution, the H map (de Blok & Walter, 2006b) traces the distribution of recent star formation. At the high, pc, resolution of our ALMA data, H traces the structure of Hii regions. We compare CO to dust emission at and , both from the Spitzer Infrared Nearby Galaxy Survey (SINGS, Kennicutt et al., 2003) and first presented in Cannon et al. (2006). The map is dominated by emission from polycyclic aromatic hydrocarbons (PAH) and traces photon dominated regions (PDR); the map measures hot dust and traces embedded star formation.
3.2. Atomic Gas and Dust
We use H i and dust surface density maps to measure the large scale structure of the star-forming complexes. The H i data are from the Very Large Array (VLA) taken as part of the LITTLE THINGS survey (Hunter et al., 2012). Due to calibration complications, these were not released with the rest of the survey, however, will be presented in I. Bagetakos et al. (in preparation) and have been kindly provided for use in this paper.
The distribution of dust mass surface density is inferred from infrared data from the Herschel Dwarf Galaxy Survey (Madden et al., 2013). We model the infrared spectral energy distribution (SED) between m using a modified blackbody, the Draine & Li (2007) model, and the Galliano et al. (2011) model with an amorphous carbonaceous component (see Galametz et al., 2010; Rémy-Ruyer et al., 2015, for details). The latter data set has been kindly provided by M. Galametz and S. Madden (private communication). The agreement between the three dust maps is generally poor. The Galactic cirrus toward NGC 6822 has similar brightness as NGC 6822 itself which severely complicates the usability of the infrared data. We have tested several methods to remove the Galactic cirrus but failed to converge on robust results. In addition, we suspect problems in the Herschel PACS and SPIRE data products themselves (e.g., potentially related to the dynamic range or recovery of extended emission; see also Abreu-Vicente et al., 2016) as individual bands show inconsistencies in their intensities (by a factor of a few) with any reasonable infrared SEDs in either faint or bright regions. For that reason, we reverted using SPIRE’s band as dust proxy but note that results derived from more complex dust modeling (i.e., modified blackbody, Galliano et al., or Draine & Li model) agree within a factor of a few. This uncertainty dominates the error budget in our analysis of dust-inferred gas masses.
The H i and dust maps are evaluated at a common resolution of pc, set by the diffraction limit of SPIRE’s band. At this resolution, each of our fields has almost independent pc elements. The outer 50 pc wide ring lacks signatures of high mass star formation and molecular gas; we use it to measure the local gas-to-dust ratio and to measure the amount of foreground and background emission from dust and H i.
3.3. Matched Resolution Comparison Data from the Milky Way and WLM
| Property | Orion | W3/W4 | Carina |
|---|---|---|---|
| Distance (kpc) | 0.45 | 2.0 | 2.3 |
| No. O-type stars | 3 | 10 | 70 |
| No. OB-type stars | 43 | 105 | 135 (200) |
| Cloud Mass (M⊙) |
In order to interpret our results, we use matched resolution CO data from the Milky Way and WLM. Matched spatial resolution measurements of CO emission from Milky Way clouds offer a view on cloud structure at high (solar) metallicity, while WLM is the only other low metallicity galaxy observed so far with data quality matching our own. The contrast of these clouds with our results in NGC 6822 illuminates how conditions in our target galaxy affect cloud structure and the degree to which conclusions about the impact of metallicity may be general (if they apply to both WLM and NGC 6822).
In the Milky Way, we use CO maps of Orion, Carina, and W3/W4. As subsection 3.3 shows, these clouds have masses only a bit lower than the atomic-molecular complexes targeted in NGC 6822. They span a range of massive star formation activity, with Orion showing modest high mass star formation and with Carina and W3/W4 being two of the most active star-forming regions in the Galaxy. The CO(1-0) data for Orion and Carina are part of the CfA 1.2-m Galactic Plane Survey444https://www.cfa.harvard.edu/rtdc/CO/ and have been presented in Wilson et al. (2005) and Grabelsky et al. (1987). The CO(2-1) data for the molecular cloud complex W3/W4 have been obtained with the 10-m Heinrich Hertz Submillimeter Telescope (HHT) by Bieging & Peters (2011). For a rigorous comparison, we convolve the Orion and W3/W4 data to the same spatial (2 pc) and spectral (0.635 km s-1) resolution as our NGC 6822 data. We do not match the sensitivities, which typically are a factor of a few better for the Galactic data. The Carina data from the CfA 1.2-m telescope have a native resolution of ; we compare these to our data at their native resolution.
We compare the clump properties that we measure for NGC 6822 to those measured from the FCRAO Outer Galaxy Survey (Heyer et al., 2001). These data, as reprocessed by Brunt et al. (2003), have a resolution of km s-1. At the distance of the Perseus arm ( kpc), this corresponds to pc. They are thus closely matched to the resolution of our ALMA data and provide an ideal Galactic point of reference.
We also compare to the ALMA observations of WLM by Rubio et al. (2015). WLM is a Local Group dwarf galaxy with solar metallicity. Its stellar mass and current star formation activity are both times lower than NGC 6822. Rubio et al. have observed CO(1-0) at and km s-1 resolution in two atomic-molecular complexes and report the detection of ten CO-emitting structures. In our analysis of the macroscopic properties of the CO-emitting structures in NGC 6822 (subsection 4.5) we include their measurements for WLM as listed in their Table 1.
3.4. Cloud Property Measurements
We identify discrete objects in our data set, measure their size, line width, and luminosity, and compare them to the properties of similarly sized objects in our comparison data sets. To do this, we use an updated version of the CPROPS algorithm555https://github.com/akleroy/cpropstoo/ (Rosolowsky & Leroy, 2006, and A. K. Leroy & E. Rosolowsky, in preparation). For details on CPROPS, we refer to Rosolowsky & Leroy (2006), Leroy et al. (2015), and A. Schruba et al. (in preparation). Briefly, we consider only significant emission, identified by a signal-to-noise cut across several channels. Within this mask, we find all significant local maxima. For each maximum, we identify the nearby pixels that can be associated with only that peak (and no others) in an iso-intensity contour. For each region of emission, we measure its size, line width, and luminosity. We use several methods to do this: spatial and spectral moments, area measurements at half-peak value or some threshold, and ellipse fitting. Each measurement is corrected for the fact that it is made at finite sensitivity and resolution. The sensitivity calculations assume either a Gaussian profile or use a curve of growth method to account for the finite sensitivity of the data. The resolution corrections are made after the correction for sensitivity and use quadratic subtraction of the two-dimensional beam and channel width. The values reported here are the mean across all of these characterization methods. We adopt the scatter in results from different measurement approaches as our best estimate of the uncertainty of the size, line width, and luminosity, because this tends to be as large as any statistical or calibration uncertainty.
3.5. CO Excitation and CO-to-H2
We observe CO(2-1) at high ( pc) spatial resolution. Similar to CO(1-0), we find CO(2-1) emission to emerge from cold dense gas, especially gas with significant optical depth, though it can also be emitted under other conditions. However, the ratio of the brightness temperatures of the two lines, , can vary. If CO(2-1) is sub-thermally excited or when the Rayleigh-Jeans approximation breaks down at low temperatures, then . On the other hand, gas of low opacity has . Observations in our Galaxy find at a few 10’s of parsec spatial scale; this is an average of diffuse emission from low density gas and opaque emission from dense gas (Yoda et al., 2010, J. Mottram et al., in preparation). Observations of nearby disk galaxies suggest a very similar line ratio of measured on kpc spatial scale (e.g., Leroy et al., 2009, 2013). On the other hand, values of are found in molecular clouds at 20 pc resolution in the LMC and SMC (Israel et al., 2003; Bolatto et al., 2003) or on larger ( pc) spatial scales in IC 10 (L. Bittle et al., in preparation). More detailed multi-transition studies of the CO emission from molecular clouds in the SMC indicate that the CO emission originates from two gas components: a more tenuous and not very dense ( cm-3) component of high temperature ( K) and a population of much denser clumps ( cm-3) of low temperature ( K) (Israel et al., 2003; Bolatto et al., 2005). As we will see in subsection 4.5, we do not probe the very dense clumps with our ALMA data, and most of the admittedly scarce observations of low metallicity star-forming galaxies seem to favor ; therefore, we adopt throughout the paper. This mainly affects comparisons to Galactic data and we discuss possible variations when they become relevant.
We measure CO emission but are often interested in the distribution of H2. The metallicity of NGC 6822 and the high spatial resolution of our data both complicate the translation of CO to H2. The CO abundance strongly depends on shielding of the dissociating radiation field and thus is a strong function of metallicity (Wolfire et al., 2010). So far, the exact metallicity dependence of remains poorly known, as does any secondary dependence on radiation field, cloud structure, and other quantities. We will derive our own estimates for for NGC 6822 using alternative ISM tracers (dust) and dynamical methods. Doing so, we reference to the commonly adopted Milky Way value, M⊙ pc-2 (K km s-1)-1, which includes a factor of to account for heavy elements (Bolatto et al., 2013).
Because of our high resolution, the scale-dependence of the CO-to-H2 conversion factor will also be relevant. The conventional extragalactic definition of is the mass-to-light ratio of H2 mass to CO emission over a large part of a galaxy. In this definition cloud substructure and even, to some degree, cloud populations are averaged over. Within an individual cloud, the relationship between CO and H2 can be more complex, especially at low metallicity where a large envelope of CO-poor H2 may exist. We will consider three scales for : the scale of CO-bright clumps, the scale of whole individual complexes, and the whole galaxy. At the small scales of clumps we disregard the H2-rich but CO-poor envelopes of molecular clouds. At the scale of individual atomic-molecular complexes we account for all gas (including CO-poor H2) but results may reflect the local environment or evolutionary state of an individual region. At the scale of the whole galaxy we somewhat marginalize over these conditions.
3.6. H I Opacity Correction
Throughout the paper we work with the H i emission without opacity correction. Galaxy-wide studies conclude that local opacity corrections to the column density can exceed an order of magnitude and add globally % to the atomic gas mass (see Braun et al., 2009; Kalberla & Kerp, 2009; Bolatto et al., 2013, and references therein), but without providing clear quantitative prescriptions how to correct observed 21-cm H i data sets for optical depth effects. Small-scale or pencil-beam studies within the Milky Way suggest the cold neutral medium (that causes the absorption) to be in compact clouds of parsec-size or narrow filaments and sheets with up to pc length (Heiles & Troland, 2003; Kalberla & Kerp, 2009), but here it remains unknown how these findings extend to galactic scales. Recently, Bihr et al. (2015) presented work on the massive cloud complex W43 and advocated for opacity corrections as high as over pc scales but the mass and surface density of W43 is a factor higher than the cloud complexes studied in NGC 6822. Overall, these results highlight that optical depth effects are present in H i observations but also show that we lack a conclusive understanding how to correct 21-cm H i observations. Therefore, we adopt the standard assumption of optically thin H i emission and work without opacity correction.
4. Results
We consider CO emission and molecular gas in NGC 6822 moving from large to small scales. First we derive an estimate of the galaxy-wide CO flux for NGC 6822. Then we consider the structure of the atomic-molecular star-forming complexes that fill our survey fields. We then analyze the local correspondence of CO emission to tracers of the ISM and recent star formation and study the distribution of CO intensities in our survey fields. Finally, we characterize the compact structures seen in our maps, comparing them to similar structures measured in our Galaxy and WLM.
4.1. Total CO Luminosity of NGC 6822
The whole area of NGC 6822 has not yet been mapped in CO, but the galaxy-integrated CO luminosity is important to compare the galaxy to other systems. We estimate this quantity via an “aperture correction” from our observed fields to the whole galaxy. To do this, we consider several tracers of recent star formation, H, , . These tracers should scale linearly with molecular gas, and so CO emission, over large, kpc, spatial scales (e.g., Schruba et al., 2011; Leroy et al., 2013). We measure CO luminosity in our fields, and then also measure the luminosity of these tracers of recent star formation both within our fields and over the whole galaxy. Our “aperture correction” is the ratio of total star formation tracer luminosity of the galaxy to the luminosity inside our fields. Applying this scale factor to the CO emission from our fields, we estimate the total CO luminosity of the galaxy.
The sum of CO(2-1) luminosities inside our four inner ALMA fields is K km s-1 pc2 and these fields harbor 63% of the global H flux and 65% of the global Spitzer flux. Scaling our observed CO luminosity by , we estimate the global CO(2-1) luminosity to be K km s-1 pc2. Because ALMA recovers only of the total flux (see section 2), we scale this further by to arrive at a best-estimate global CO(2-1) luminosity of NGC 6822 of K km s-1 pc2. This value agrees within the uncertainty with a similarly derived estimate by Gratier et al. (2010), who scaled from their IRAM 30-m map to estimate a global CO(2-1) luminosity of K km s-1 pc2.
To calculate the CO(1-0) luminosity, we need to further scale by the ratio . We argue by analogy to other systems that but uncertain. Our best-estimate of the global CO(1-0) luminosity for NGC 6822 is thus K km s-1 pc2.
This integrated luminosity is small, establishing that NGC 6822 resembles other star-forming, low metallicity dwarf galaxies in showing a low amount of CO luminosity compared to its present day star formation rate, stellar mass, and atomic gas mass. For comparison, our estimate for the total CO luminosity of NGC 6822 is comparable to the CO luminosity of one of our individual Galactic comparison clouds, which have CO luminosities K km s-1 pc2.
4.2. Atomic-Molecular Complexes Hosting the CO Clumps
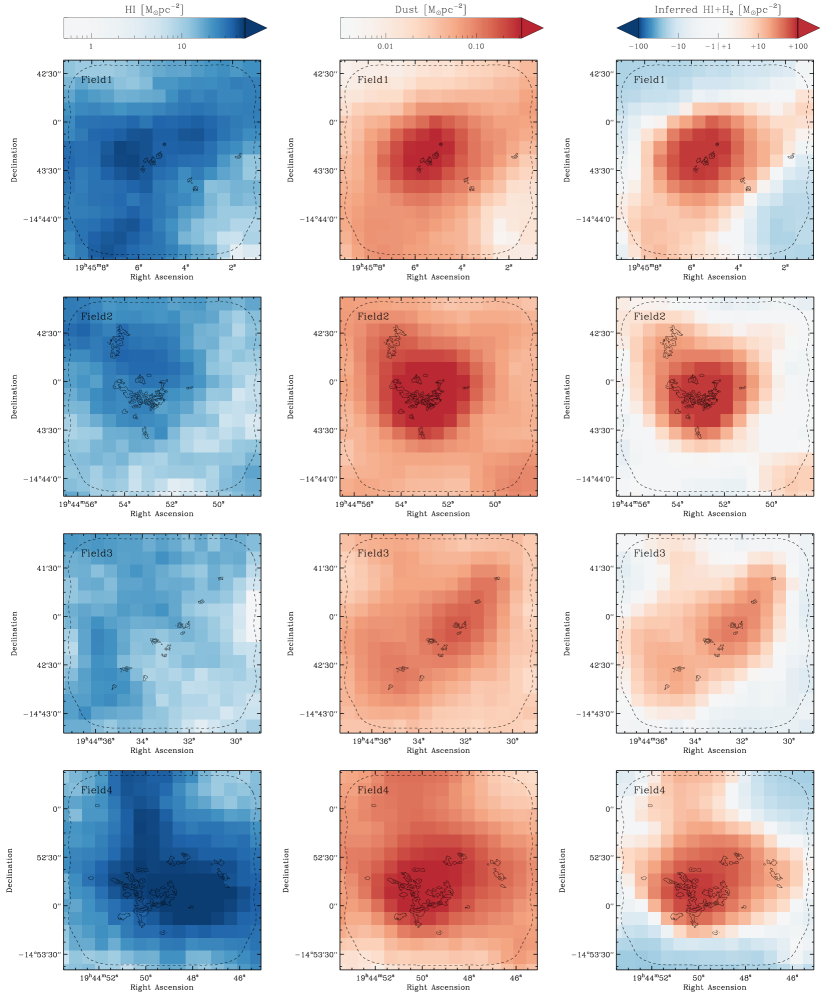
Our four inner fields host of the star formation activity in NGC 6822. The H and dust morphology, visible in Figure 4 & 5, extend for many tens of parsecs in each region. Though measured at much lower resolution ( pc), the H i and dust maps show that our observed CO clumps exist inside larger structures of gas and dust. We expect optically thin dust emission to trace the distribution of gas and H i emission to show the dominant atomic gas reservoir, modulo optical depth effects. We use these to estimate the overall mass and atomic-molecular balance in the star-forming complexes.
We use dust, combined with a gas-to-dust ratio, , to trace the total gas reservoir,
| (1) |
Because can be measured directly, we estimate the GDR by comparing and in regions where atomic gas makes up most of the gas. We use the outer 50 pc wide ring in each of our regions, assuming based on the lack of CO emission and bright signatures of high mass star formation that the gas in this ring is mostly atomic. Table 2 lists the GDR with scatter for each of our regions.
On average, we find with only moderate variation among the four fields. This is times higher than the Galactic value but only half the value expected for the solar metallicity of NGC 6822 when assuming an inverse linear scaling of GDR and metallicity (Rémy-Ruyer et al., 2014). However, the absolute normalization of dust masses estimated from IR SED modeling remains uncertain at a level that could resolve this discrepancy (see subsection 3.2). Our application of the dust map is to trace gas. For that purpose we require only a linear scaling of dust and gas, any normalization issues are controlled by measuring GDR in the local control field.
Before calculating the mass of the complexes, we subtract a local background from the H i and the dust maps. To do this, we measure the mean surface density in the outer 50 pc ring and subtract this value from the whole H i and dust map for the complex. This isolates the star-forming complex as the excess emission over the diffuse interstellar medium. This is a particular concern for dwarf galaxies which (warm atomic) interstellar medium has large spatial extent, large scale height, and high filling factor (e.g., Bagetakos et al., 2011). This also lets us assess if the star-forming complexes have an atomic gas component in excess of the diffuse atomic gas. No similar subtraction appears necessary for the CO emission.
After background subtraction, we find for each region a large concentration of dust (and thus gas) coincident with the star-forming complex (Figure 5). Applying our measured GDR to the dust distribution, we derive total gas masses of for each complex. We subtract from the dust-inferred total gas mass the local excess H i mass and find that about of the mass in these complexes is atomic gas traced by the 21-cm line. The rest is visible in dust but not in 21-cm emission. This is either opaque H i, H2, or the signature of small-scale variations in the gas-to-dust ratio with the sense of a times lower gas-to-dust ratio. We proceed interpreting the signal as molecular gas, but note the need for more work in this area (see discussions in Leroy et al., 2007, 2011; Sandstrom et al., 2013; Jameson et al., 2016). In this case, the gas structures hosting star formation in NGC 6822 are about the mass of the biggest Galactic high mass star-forming clouds of order , with of their mass in the molecular form and of their mass in the atomic form.
The impact of the background subtraction is to remove the diffuse atomic interstellar medium from the excess gas that we associate with the star-forming complexes. This diffuse medium has M⊙ pc-2 in our survey regions and makes of the atomic gas columns along the lines of sight toward the star-forming complexes. In case the reader prefers to associate this diffuse gas to the star-forming complexes, then their total gas masses increase by a factor of and the atomic and molecular gas phases contribute roughly equal amounts to the complexes’ mass. We note that the mass of the molecular component of the star-forming complexes — and thus all results that consider only the molecular gas and its CO emission — remain unchanged (within ) by (not) applying the background subtraction.
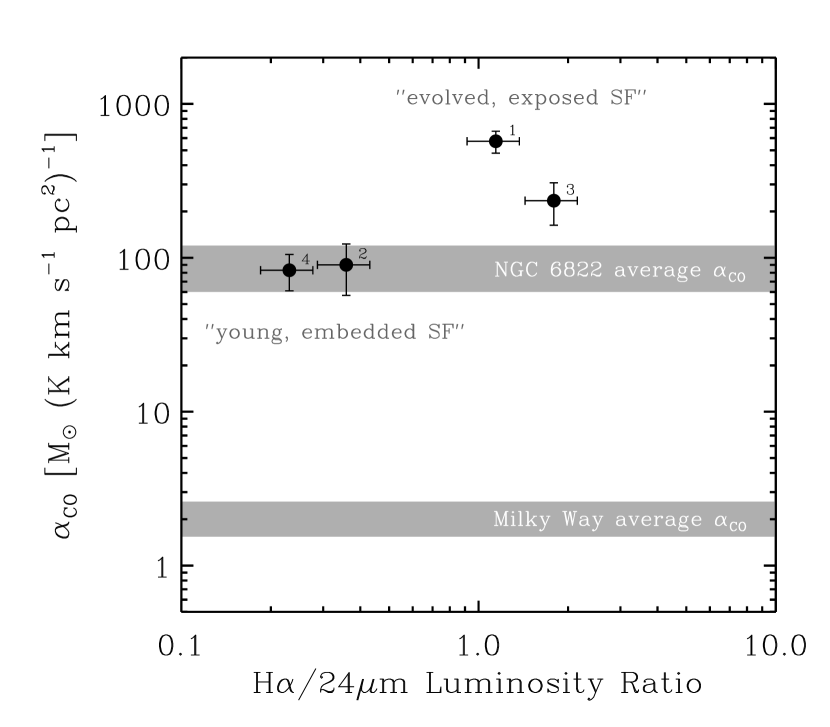
From the ratio of H2 derived from dust to CO emission, this analysis implies a CO-to-H2 conversion factor. If we carry out a joint solution for and GDR across the galaxy (following Sandstrom et al., 2013; Leroy et al., 2011), we derive and M⊙ pc-2 (K km s-1)-1, about times and times the Galactic values, respectively. However, this obscures strong variations among our four fields. Figure 6 shows that varies systematically with the CO, H, and morphology and luminosity. For the two Fields 2 & 4 with compact CO and H morphology, dominated by embedded star formation (i.e., low Hm ratio), and bright CO emission, we determine M⊙ pc-2 (K km s-1)-1, about times the Galactic value. In the other two Fields 1 & 3, which have more extended and exposed SFR tracer emission (i.e., high Hm ratio) and much lower CO luminosity, appears much larger, though uncertain, and M⊙ pc-2 (K km s-1)-1, respectively. We stress that considerable uncertainties remain in this analysis mainly due to the large uncertainty in the dust mass.
We speculate that the large discrepancy in between fields is linked to the evolutionary state of the star-forming complex. Early in the history of the complex, the gas is compact and dense. Such structures are good at forming CO and effective at shielding it from dissociating radiation. In this case is relatively small (Fields 2 & 4). Later in a complex’s life, the gas gets disrupted by stellar feedback, which is visible as an evolving H ii region. With lower density, the ability of gas to form and shield CO is suppressed, driving to larger values as more and more H2 survives without CO (Fields 1 & 3).
4.3. Coincidence of CO with , , and H Emission
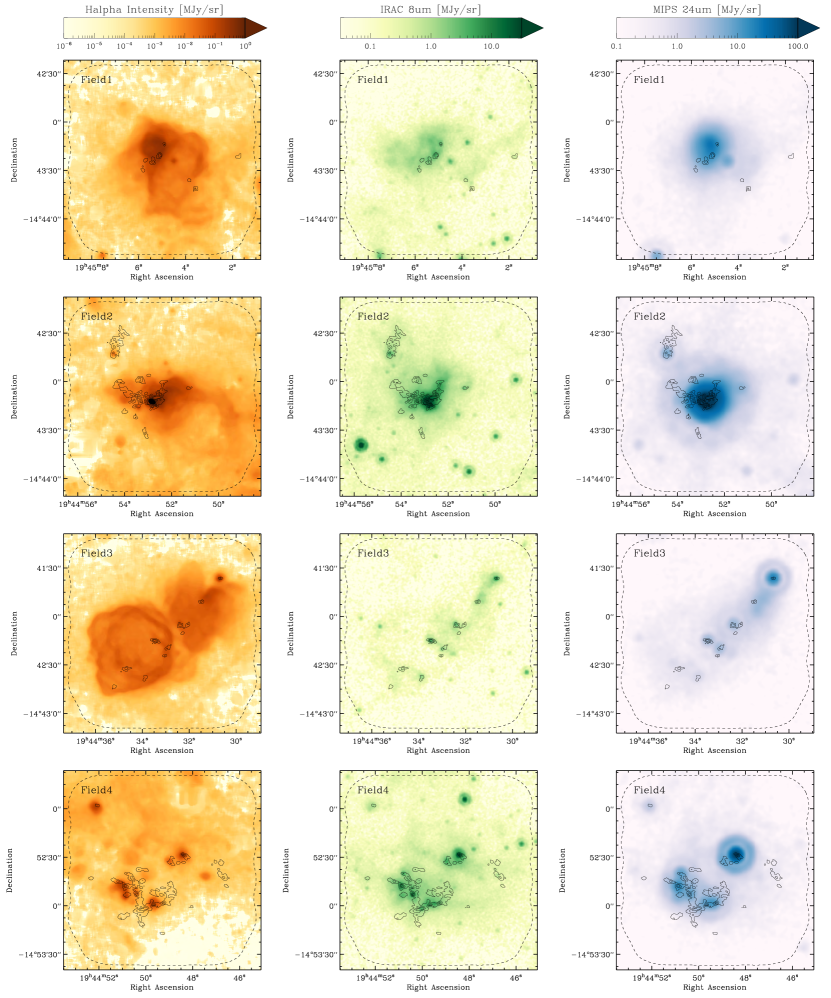
We targeted our survey toward regions of active star formation, traced by bright H and mid-IR emission. CO emission tracks these other wavelengths on much larger scales because stars form out of molecular gas. Figure 4 shows a more complicated relationship on smaller scales, reflecting the evolution of young stellar populations and the different emission mechanisms at play. In Table 5 we quantify how CO emission correlates with H and IR emission at resolutions of pc (H and ) and pc (all three tracers).
First, we determine the maximum intensity contour for each tracer that encompasses of the total CO emission; that is, we ask what threshold in H or is needed to capture most of the CO. This threshold usually also encompasses a large area with little or no CO emission. To quantify how large this area is, and so the closeness of correspondence with CO, we report an “area fraction,” which is the ratio of the area inside the 80% CO threshold for that tracer to the 80% threshold for CO. Finally, we report the Spearman rank correlation coefficient between each tracer and CO above this threshold.
| Data | Flux CutaaCommon flux threshold for CO [K km s], or H or IR [MJy sr] holding 80% of the CO flux within each region. | Flux FractionbbFraction of CO, H, IR flux in each regions above common threshold. | Area FractionccFraction of area covered by H or IR common threshold versus area holding of the CO emission. | Rank Corr. |
|---|---|---|---|---|
| Resolution of pc | ||||
| CO | 1.0 | 1.0 | ||
| H | ||||
| 8 m | ||||
| Resolution of pc | ||||
| CO | 1.0 | 1.0 | ||
| H | ||||
| 8 m | ||||
| 24 m | ||||
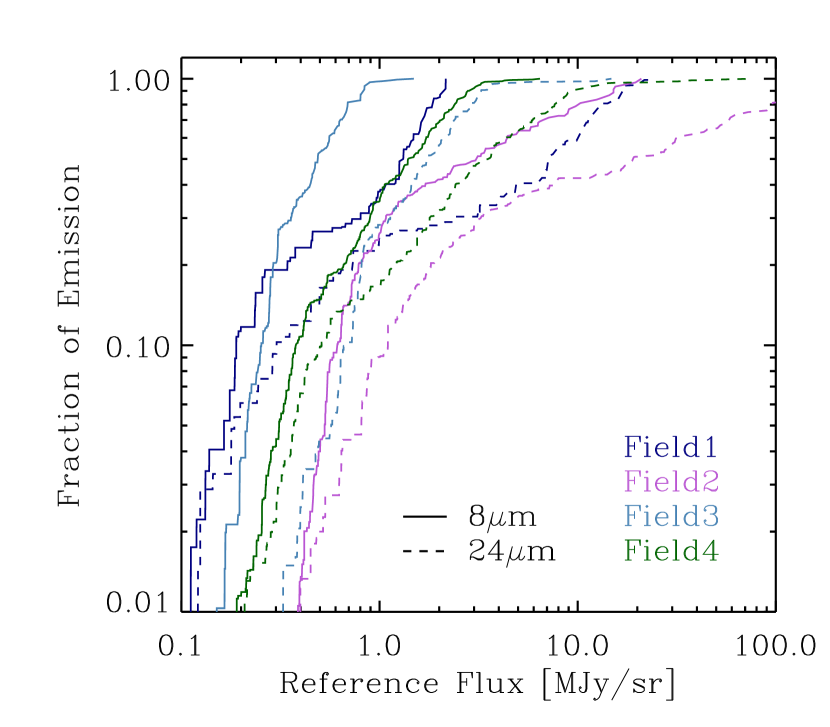
We find the closest correspondence between CO and emission and the weakest relationship between CO and H, with intermediate. This reflects the different emission mechanisms at play. The emission originates from PAH molecules and traces PDRs. Despite a few compact sources, most emission comes from extended, diffuse structures which coincide with the CO emission. Overall, the distribution of the two tracers matches well. Gratier et al. (2010) noted a similar good correspondence at larger scales.
The emission traces warm dust heated by young, embedded stars. At this scale, sources correspond to an early, embedded phase of star formation that takes place before feedback can disrupt the parent gas cloud. The distribution of intensity is concentrated into a few () bright sources per survey field. Each source is associated with a CO-bright structure, but the reverse is not true. Many CO peaks lack a corresponding source.
H and photospheric UV emission are most visible after the embedded phase traced by emission. At the scales that we probe, H emission is not co-spatial with the CO emission, reflecting both the disruption of clouds and the finite extent of H ii regions. Instead, we see the neutral gas (including the CO-bright clumps) swept up at the boundary of the H ii region bubbles — a picture that is well known from Galactic star-forming clouds (e.g., the W3/W4 molecular cloud–H ii region complex; see images by Bieging & Peters, 2011).
Thus the emission correlates most directly with CO emission. The areal extent of the contour needed to capture 80% of the CO emission is the smallest of the tracers that we test but the correspondence is not perfect. This contour is still a factor of larger than the actual CO-bright regions. The shows the second best correlation over similar areal coverage, but the scaling between CO and emission on these scales is strongly nonlinear. H shows only marginal correlation and the encompassing H contour has large areal extent.
Figure 7 shows this result by plotting the cumulative distribution of CO integrated intensity as function of the threshold intensity at or at 2 pc resolution. The curves for are steep, and high CO fractions are reached over a small intensity range near MJy sr-1. A contour with this intensity does a good job of predicting where bright CO emission may be found. Our results reinforce the idea from Sandstrom et al. (2010) and Gratier et al. (2010) that PAH emission can provide a predictor of the location, and perhaps strength, of CO emission in low metallicity environments. We have used here; given the full-sky coverage of the Wide-field Infrared Survey Explorer (WISE) it will be important to test whether the same conclusions would apply using the PAH feature covered by WISE’s band 3.
4.4. Distribution of CO Intensities
The distribution of intensities in our survey provides a basic measure of the structure of the CO-emitting gas in NGC 6822. We show this in Figure 8, where we plot the fraction of total flux above a specified CO pixel intensity threshold (expressed as intensity times channel width, ). For reference we also plot the distributions for our three Galactic comparison clouds after convolving them to the resolution of our data (2 pc 0.635 km s-1) and applying the same masking procedure that we use for NGC 6822.
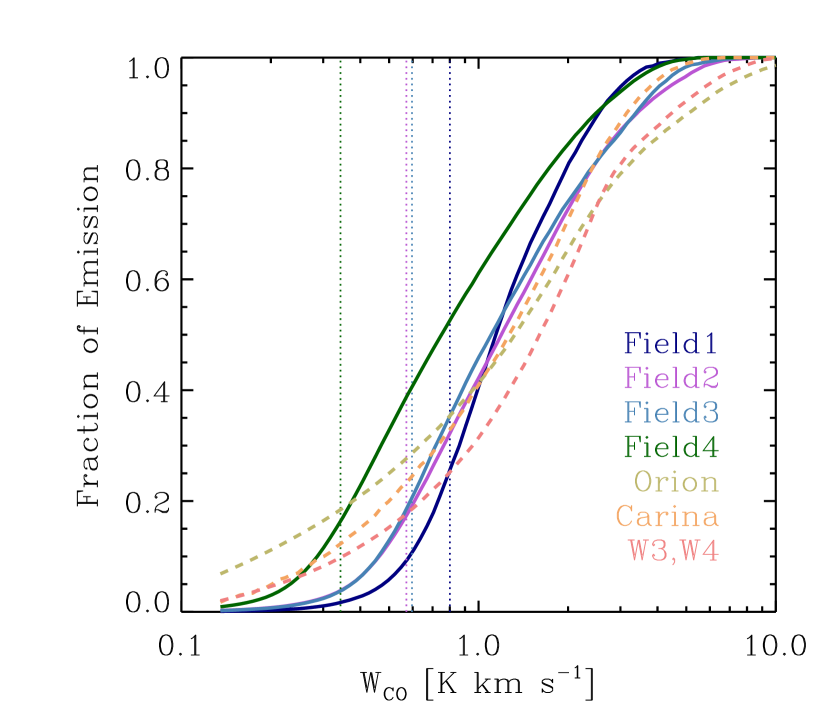
The distributions in NGC 6822 differ from those of the Milky Way clouds, with emission coming from a narrower range of intensities in the NGC 6822 data. Less flux and less pixels show either low or high intensities. The absence of low intensity emission may be explained physically, corresponding to a suppression of CO abundance in regions that are weakly shielded. However, given uncertainties in flux recovery and the limited sensitivity of our data, this difference is not significant. The difference at higher intensity does appear significant but modest in strength: on average, the NGC 6822 cdfs are shifted to lower pixel intensities with less flux in the brightest regions than the Orion or Carina molecular clouds.
4.5. CO Clump Properties
| ID | R.A. | Decl. | PA | ||||||||||
|---|---|---|---|---|---|---|---|---|---|---|---|---|---|
| (hh:mm:ss.s) | (dd:mm:ss) | (km s) | (K) | (pc) | (pc) | (deg) | (pc) | (km s) | (caption) | ( ) | |||
| (1) | (2) | (3) | (4) | (5) | (6) | (7) | (8) | (9) | (10) | (11) | (12) | (13) | (14) |
| 1 | 19:45:03.8 | -14:43:36 | -45.0 | 1.5 | 2.4 | 0.9 | 0.3 | 96 | 0.5 0.1 | 0.19 0.00 | 0.0 0.0 | 0.2 0.0 | 1.3 0.2 |
| 2 | 19:45:03.6 | -14:43:40 | -44.0 | 3.3 | 5.2 | 3.3 | 2.5 | 62 | 2.9 0.6 | 0.58 0.12 | 0.5 0.2 | 10.1 3.8 | 5.0 2.8 |
| 3 | 19:45:01.7 | -14:43:21 | -42.0 | 2.4 | 3.8 | 2.9 | 1.8 | 148 | 2.3 0.9 | 0.46 0.02 | 0.2 0.0 | 5.1 2.1 | 6.9 2.9 |
| 4 | 19:45:03.8 | -14:43:36 | -40.0 | 4.2 | 6.6 | 3.6 | 2.7 | 131 | 3.1 0.8 | 1.26 0.02 | 1.2 0.0 | 51.9 13.9 | 9.6 2.6 |
| 5 | 19:45:01.7 | -14:43:20 | -40.0 | 2.3 | 3.7 | 2.3 | 1.2 | 6 | 1.7 0.4 | 0.39 0.05 | 0.1 0.0 | 2.6 0.9 | 4.5 1.7 |
| 6 | 19:45:03.6 | -14:43:41 | -39.0 | 5.4 | 8.5 | 3.7 | 1.9 | 144 | 2.6 0.5 | 2.06 0.28 | 1.8 0.5 | 116.9 30.9 | 14.5 5.7 |
| 7 | 19:45:01.9 | -14:43:21 | -39.0 | 2.1 | 3.4 | 1.1 0 | 0.36 0.04 | 0.1 0.0 | 1.5 0.0 | 3.6 0.0 | |||
| 8 | 19:45:01.7 | -14:43:21 | -37.0 | 4.6 | 7.4 | 4.4 | 1.1 | 2 | 2.2 0.5 | 1.10 0.11 | 1.4 0.5 | 27.4 7.4 | 4.3 1.9 |
| 9 | 19:45:01.7 | -14:43:19 | -36.0 | 3.5 | 5.5 | 0.5 0 | 0.53 0.08 | 0.3 0.1 | 1.4 0.0 | 1.2 0.0 | |||
| 10 | 19:45:05.1 | -14:43:20 | -35.0 | 2.1 | 3.3 | 5.8 | 1.2 | 176 | 2.6 0.2 | 0.45 0.01 | 0.2 0.0 | 5.6 0.6 | 8.3 0.8 |
| 156 | 19:44:49.0 | -14:52:55 | -41.0 | 2.7 | 10.0 | 7.5 | 2.2 | 6 | 4.1 0.3 | 1.63 0.11 | 2.2 0.0 | 113.4 13.7 | 12.0 1.5 |
Note. — (1) Cloud identification number (ID); (2) right ascension (R.A. (J2000)); (3) declination (Decl. (J2000)); (4) velocity (); (5) peak brightness temperature (); (6) peak signal-to-noise ratio (); (7) semi-major axis length (); (8) semi-minor axis length (); (9) position angle of cloud major axis, measured from R.A. through Decl. (PA); (10) radius (); (11) velocity dispersion (); (12) CO luminosity ( [ K km s pc2]); (13) virial mass (); (14) virial parameter ().
(This table is available in its entirety in a machine-readable form in the online journal. A portion is shown here for guidance.)
| Target | WLM | NGC 6822 | Outer Milky Way | |||||||||||
|---|---|---|---|---|---|---|---|---|---|---|---|---|---|---|
| Property | Unit | Median | Min | Median | Max | Min | Median | Max | ||||||
| pc | 2.21 | 0.27 | 1.64 | 2.29 | 3.14 | 7.23 | 0.50 | 1.25 | 1.87 | 2.79 | 14.87 | |||
| km s-1 | 0.77 | 0.17 | 0.68 | 1.06 | 1.40 | 2.84 | 0.30 | 0.60 | 0.82 | 1.14 | 8.47 | |||
| km2 s-2 pc-1 | 0.35 | 0.01 | 0.26 | 0.45 | 0.82 | 2.62 | 0.03 | 0.21 | 0.36 | 0.65 | 12.16 | |||
| K km s pc2 | 0.69 | 0.02 | 0.40 | 1.13 | 2.42 | 8.05 | 0.04 | 0.41 | 0.90 | 2.34 | 180.05 | |||
| 2.99 | 0.09 | 1.75 | 4.90 | 10.54 | 35.03 | 0.15 | 1.67 | 3.70 | 9.61 | 738.22 | ||||
| 13.91 | 0.18 | 8.52 | 27.41 | 63.13 | 530.69 | 0.57 | 5.40 | 12.90 | 31.83 | 2096.26 | ||||
| 4.38 | 0.46 | 3.22 | 5.00 | 8.27 | 83.07 | 0.44 | 1.97 | 3.11 | 5.32 | 61.25 | ||||
| 3.92 | 0.89 | 3.48 | 5.39 | 7.14 | 14.46 | 1.54 | 3.07 | 4.20 | 5.80 | 43.13 | ||||
| pc-2 | 17.59 | 1.02 | 11.46 | 22.97 | 40.95 | 302.62 | 4.69 | 18.81 | 27.27 | 42.28 | 382.70 | |||
| cm-3 | 1.47 | 0.12 | 1.40 | 3.63 | 7.46 | 156.09 | 0.18 | 1.56 | 2.79 | 5.04 | 44.01 | |||
| Myr | 2.83 | 0.35 | 1.61 | 2.31 | 3.73 | 12.75 | 0.38 | 1.39 | 1.87 | 2.50 | 9.51 | |||
| Myr | 2.22 | 0.41 | 1.15 | 1.64 | 2.21 | 4.61 | 0.21 | 1.07 | 1.57 | 2.31 | 12.29 | |||
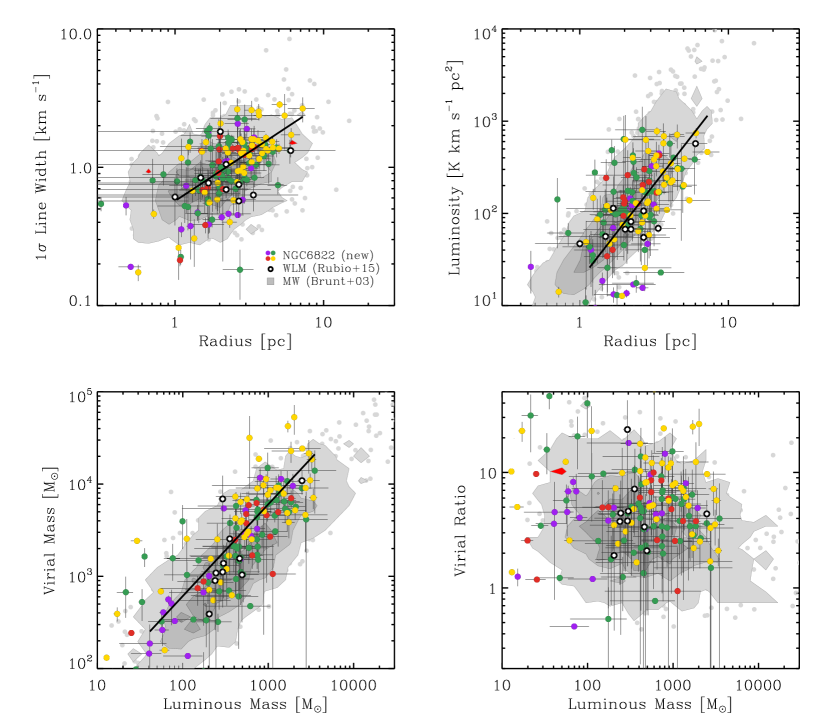
Our survey recovers a number of compact CO structures. We identify and measure the properties of of these roughly pc-scale “clumps,” estimating a size, line width, and CO luminosity for each. We use combinations of these properties to assess the surface and volume density, strength of turbulence, and dynamical state of the clumps. Table 6 lists the inferred properties of each clump while Table 7 lists their average values and dynamic range. We compare these to results for similarly sized structures in WLM (Rubio et al., 2015) and the outer Milky Way (Brunt et al., 2003); their average values and dynamic range666For WLM we only state the median due to small sample size. are also listed in Table 7. Figure 9 shows these comparisons, with the WLM data shown as open black dots and the Galactic clumps shown as grayscale contours of data density. Black lines show power law fits to the NGC 6822 clumps, which are useful for comparison to the Galactic distribution.
The upper left panel of Figure 9 shows the line width of a clump as a function of its size. For clumps in virial equilibrium, the amplitude of turbulence at fixed size reflects the surface density of the structure. Regardless of dynamical state, one might interpret a higher dispersion at fixed size as stronger turbulence — modulo temperature effects this will correspond to a higher Mach number. Differences among the three populations are small in this parameter space, but there is some tendency for NGC 6822 clumps to have higher line width at pc sizes.
Beyond the scaling, the absolute values shown in the top left panel of Figure 9 bear comment. The bright CO-emitting structures in NGC 6822 are remarkably small, a few pc across, with typical rms line widths km s-1. This highlights a fundamental result for CO in dwarf galaxies, seen by Rubio et al. (2015) and extended here to 150 objects: CO emission comes mostly from compact, narrow line width structures. This observation is only possible with the high resolution and sensitivity of ALMA, so that to our knowledge this is the first time that a large set of clump properties at 2 pc spatial scale have been measured for an external galaxy.
The upper right panel shows the CO luminosity as a function of clump size. As shown in the previous section, clumps in NGC 6822 have average CO surface brightness lower than those in the Milky Way. This is within the systematic uncertainties on flux recovery and excitation, but could also indicate suppressed CO emission in NGC 6822 or that the clumps are not fully resolved. Again, agreement among clump properties for the three galaxies is more notable than differences given how under-luminous NGC 6822 appears in its ratio of global CO luminosity to other quantities.
The bottom left panel shows the virial mass, the mass implied by the clump’s size and line width when assuming a simple geometry and virial equilibrium (), as a function of clump mass estimated from the CO luminosity using a fiducial Galactic CO-to-H2 conversion factor M⊙ pc-2 (K km s-1)-1 and . There is a good correspondence between clump virial mass and clump luminosity within each sample, but the NGC 6822 clumps show higher virial masses at a given CO luminosity than Milky Way clumps. This offset is not large, less than a factor of , but appears significant.
The bottom right panel shows similar information. We plot the virial parameter, the ratio of virial to luminous mass, as a function of the luminous mass. Assuming that the conversion factor adopted to estimate the luminous mass is correct, then clumps with virial ratio of are in virial equilibrium, while clumps with virial ratios of are marginally bound. Those with higher ratios are either pressure-confined or gravitationally unbound. This plot shows clumps in the outer Galaxy to be marginally bound, with , while clumps in NGC 6822 are offset by a factor of toward larger virial parameters. This has two natural interpretations. Either the use of a Galactic conversion factor leads us to underestimate the clump mass in NGC 6822 or the clumps in this galaxy are unbound or pressure-confined.
The main result from Figure 9 is that the properties of clumps in the three galaxies are similar independently of their host galaxy’s mass or metallicity. Differences are small, a factor of , and comparable to what we might expect from differing methodologies, flux recovery issues, assumptions about excitation. Still, there is evidence here for either a different, more pressure-confined dynamical state for the NGC 6822 clumps or a slightly higher CO-to-H2 conversion factor on scales of a few parsecs. We return to the implications of these results in subsection 5.4 & 5.5.
5. Discussion
5.1. The CO-bright Clumps
We identify compact CO structures in our cubes. These CO-bright clumps have an average size of pc, velocity dispersion of km s-1, and virial mass of (see Table 7). These sizes and masses are small compared to a whole giant molecular cloud, so we have referred to these as “clumps.” The very small size of these clumps is a main observational result of this paper. It shows that many previous results regarding the faintness of CO in dwarf galaxies can be explained in terms of beam filling: bright CO is confined to small structures that occupy only a small portion of the available area. Observations with physical beams larger than our 2 pc will dilute this intensity and so will recover faint CO emission.
Following an analysis presented by Rubio et al. (2015) for WLM, we evaluate the dynamical state of the clumps in three ways: (a) Assuming approximate virialization, so that , the clumps have a gas mass surface density of M⊙ pc-2 and an H2 volume density of cm-3. (b) We can consider pressure equilibrium between the internal turbulent pressure of the CO clumps and external pressure by the weight of the overlaying gas layers of the atomic-molecular complex and the diffuse atomic medium. The external pressure due to self-gravity on the CO clump is K cm-3 where M⊙ pc-2 is the sum of gas columns of the atomic-molecular complex and the diffuse ISM. This pressure has to be balanced by the internal pressure due to turbulence which, if turned around, requires an H2 density of the clumps of cm-3. (c) The volume density required for collisional excitation of CO rotational transitions is cm-3 (Glover & Clark, 2012b). Overall, we conclude that the virial density, excitation density, and pressure equilibrium density for the H2 gas in the CO-bright clumps are quite similar around cm-3 and therefore considering these gas structures to be in (quasi) dynamical equilibrium seems justified.
5.2. The Comparison to Milky Way Clumps
Our analysis of the CO-bright clumps in NGC 6822 has shown that their macroscopic properties are very similar (with possible offsets less than a factor of two) to CO-bright structures within our Galaxy. For our adopted and M⊙ pc-2 (K km s-1)-1, the clumps in NGC 6822 have lower surface brightness and a factor of higher virial masses or virial ratios for fixed (CO-inferred) luminous masses. There are three easy explanations which can explain the (apparent) small difference to the Galactic observations. (1) The CO excitation is sub-thermal and is closer to the standard value () derived for Milky Way clouds or massive disk galaxies. This would directly remove the difference in surface brightness but leave clumps in NGC 6822 to be slightly less bounded than in the Milky Way. (2) The CO-to-H2 conversion factor is larger (by a factor of ) than the standard value for Milky Way clouds or massive disk galaxies, which would be motivated by the lower surface brightness (due to a lower beam filling factor) and results in identical virial ratios in NGC 6822 and the Milky Way. (3) The more massive shielding layers around the CO-bright clumps in NGC 6822 provide sufficient external pressure to bring the internal turbulent pressure and self-gravity into a dynamical balance. In the previous sections we have seen that the required changes listed here are all consistent with our measurements within the uncertainties and thus either of the three cases or a combination of them provide a viable pathway to explain our observations.
We can therefore conclude that the structure of the atomic-molecular complexes and the CO-bright clumps in NGC 6822 seems normal in terms of density, pressure, and column density, and that they appear to be marginally gravitationally bound. The main effect of the lower CO abundance in NGC 6822 is to lower the brightness and extent of the CO-bright structures. This explains why the clumps in NGC 6822 and the Milky Way populate the same loci in plots of scaling relations of their macroscopic properties (see subsection 4.5). Rubio et al. (2015) have arrived at the same set of conclusions in their analysis of ten CO-bright clumps in WLM which has only solar metallicity. Taken these results together, we conclude that clumps inside molecular clouds appear to be in virial equilibrium after the non-negligible contribution of surface pressure from the surrounding gas is accounted for. We find no dependence on gas phase metallicity over solar metallicity. The dynamical state of dense clumps — the location where stars form — is thus indistinguishable between clouds in the Milky Way or nearby low metallicity dwarf galaxies.
5.3. The CO-to-H2 Conversion Factor
We have determined the CO-to-H2 conversion factor, , on several scales. On the largest scales, our result mirrors the discussion in subsection 5.2: integrating over our dust-inferred molecular gas masses and dividing by the ALMA CO(2-1) luminosity, we find M⊙ pc-2 (K km s-1)-1. Adjusting this to account for our expectation of flux recovery lowers this number to M⊙ pc-2 (K km s-1)-1. For a CO(1-0) conversion factor, this should be modified by the appropriate line ratio; we argue that a value close to thermal ( in K units) is likely appropriate for a dwarf irregular galaxy like NGC 6822. This large-scale value is times larger than the Milky Way value of M⊙ pc-2 (K km s-1)-1. Our estimate is a factor of larger than the calculations by Leroy et al. (2011), who used Spitzer and IRAM 30-m data by Gratier et al. (2010) to derive M⊙ pc-2 (K km s-1)-1 with dex uncertainty. These two results agree within of their uncertainties.
Motivated by the dust-inferred values derived for Local Group galaxies by Leroy et al. (2011) and 27 nearby spiral galaxies by Sandstrom et al. (2013), Bolatto et al. (2013) proposed the formula in which may deviate from the Galactic value for two reasons: the factor accounts for the H2 mass in the outer complex CO-faint (COF) layers where CO is dissociated; and accounts for changes in the CO surface brightness (SB) due to temperature and velocity dispersion. The former term may scale as as derived by Wolfire et al. (2010). For the cloud complexes in NGC 6822 ( and M⊙ pc-2) this results in and thus a similar increase in (assuming no change in given the similarity of the CO-bright clumps in NGC 6822 and the Milky Way). This prediction is times below our measurement of for complexes in NGC 6822. This deviation does not come as a surprise as Bolatto et al. (2013) empirically calibrated their formula against the values derived by Leroy et al. (2011) and Sandstrom et al. (2013), and we already noted the difference of our and Leroy et al.’s results above. The underlying reason for this discrepancy remains unclear, but dust maps of higher fidelity seem necessary to resolve these questions.
As Figure 6 has shown, we find different values for different complexes with a substantial difference between the two CO-bright Fields 2 & 4, where M⊙ pc-2 (K km s-1)-1, and the CO-faint Fields 1 & 3, where M⊙ pc-2 (K km s-1)-1. The difference may be linked to the evolutionary state of the complexes. The two CO-faint complexes (Fields 1 & 3) with high also have prominent H ii regions with fewer signatures of compact embedded star formation at . This might also lead to more dissociating photons and weaker shielding because the gas has been dispersed by stellar feedback, in which case we might expect a larger component of H2 without CO. By contrast, the other two complexes (Fields 2 & 4) may be in an earlier state, with embedded star formation and gas more concentrated and better shielded. This could lead to the overall brighter CO emission and the lower conversion factors. While this scenario does make sense “by eye,” we might also expect this case to produce CO intensity distributions that differentiate the fields in this way. However, this does not appear to be the case for our four complexes and warrants further investigation with larger samples.
We also constrain the CO-to-H2 conversion factor via dynamical measurements at small scales of individual dense clumps. If we assume that the dynamical state of the clumps in NGC 6822 and WLM is the same as for those in the Milky Way, then the difference in the apparent ratio of virial mass to luminosity reflects differences in as small as a factor of despite metallicity variations of when measured for dense clumps on spatial scales of only a few parsec.
In summary, this highlights the strong dependence of on both metallicity and spatial scale. The CO-to-H2 ratio can be very low in low metallicity systems on spatial scales (few ) of whole molecular clouds to the entire galaxy while it can approach Galactic values inside small (pc), dense, well-shielded gas clumps. Accounting for the scale dependence of seems to bring previous, apparently differing estimates of the metallicity dependence of together (see also Bolatto et al., 2013; Schruba, 2013). Using dust modeling to infer H2 masses, Lee et al. (2015) derived on spatial scales of pc in the LMC and SMC, while Leroy et al. (2011) and Sandstrom et al. (2013) derived on kpc scales in local galaxies. From scaling the SFR by a depletion time to get H2 masses, Genzel et al. (2012), Schruba et al. (2012), and Hunt et al. (2015) derived for entire galaxies in the local and distant universe. Furthermore, we find that as measured for individual molecular clouds depends on the cloud’s evolutionary state driven by particular dynamical, chemical, and feedback timescales (see Figure 6). Here we suggest that these measurements can be brought together when considering the interlinked metallicity and spatial scale dependence of ; but sensitive observations of CO and dust continuum at high resolution for a set of low metallicity galaxies are critical for a definite answer.
5.4. The Atomic-Molecular Complexes
We can use the derived properties (i.e., size, mass, surface and volume density) of the atomic-molecular complexes and the CO-bright clumps to analyze their “state of equilibrium” and determine if they share the same properties as clouds in the Milky Way. The basic idea consists of (numerous) CO clumps residing in an atomic-molecular complex that have to be close to pressure and chemical equilibrium so that the entire gas cloud is in a (quasi) static state. In subsection 5.1 we have determined that the pc-sized, CO-bright clumps have properties suggesting that these structures are in gravitational, excitation, and pressure equilibrium, and that their properties are similar to Galactic clumps. Here we extend this analysis to consider the equilibrium state of the times larger atomic-molecular complexes.
The atomic-molecular complexes have a (dust-inferred) typical diameter of pc and gas mass of , the average surface density is M⊙ pc-2, and about of their mass is in atomic form and in molecular form. These complexes are surrounded by a diffuse atomic medium with average surface density of M⊙ pc-2, as determined from the 21-cm observations.
In a static picture, the reservoir of H2 and CO gas has to be in an equilibrium between formation and destruction processes. This requires that H2 and CO are sufficiently shielded from dissociating radiation. In the Milky Way and Magellanic Clouds, H2 molecules require an extinction of mag and CO molecules require mag (we note that these numbers are rough, first order estimates, they reflect the good agreement among theoretical and observations studies on the magnitude of but may neglect a minor, still debated metallicity dependence, e.g., Krumholz et al., 2008; Pineda et al., 2008; Wolfire et al., 2010; Glover & Mac Low, 2011; Sternberg et al., 2014; Lee et al., 2015, and Lee et al., ApJ subm.). At solar metallicities, this corresponds to gas columns of M⊙ pc-2 and M⊙ pc-2, respectively. In NGC 6822, which has solar metallicity, the corresponding gas columns are expected to be M⊙ pc-2 and M⊙ pc-2, under the assumption that is linearly proportional to metallicity. The former is satisfied by the atomic component of the atomic-molecular complexes with M⊙ pc-2 plus additional shielding from the diffuse atomic medium, and the latter by the total gas column of M⊙ pc-2 calculated from the atomic and molecular gas of the complex plus the molecular gas from the embedded CO-bright clumps. In regions of strong radiation fields — our ALMA survey specifically targets prominent H ii regions — the required shielding columns will need to be somewhat higher, what our derived numbers allow for. In summary, the atomic-molecular complexes have properties (i.e., column densities) conforming with chemical equilibrium. The dynamical state cannot be evaluated as we lack information on the gas (turbulent) velocities of the entire complex.
5.5. Star-forming Gas Content and Depletion Time
We have estimated the global CO(1-0) luminosity and the H i and H2 mass of the star-forming complexes hosting of the star formation activity in NGC 6822. Using these, we are in a position to discuss the relative abundance of gas, molecular gas, and star formation on large scales. NGC 6822 appears typical of dwarf galaxies in two respects: The timescale for the current star formation rate, M⊙ yr-1, to consume all (atomic and molecular) gas of the entire galaxy is long, Gyr. Such a long timescale is typical of dwarf galaxies and the outer disks of spiral galaxies (e.g., Lee et al., 2009; Bigiel et al., 2010; Schruba et al., 2011; Huang et al., 2012; Roychowdhury et al., 2015). This is usually interpreted as reflecting the inability of dwarf galaxies to effectively convert their atomic material into dense, cold, star-forming clouds.
NGC 6822 also displays a small CO luminosity relative to its apparent rate of star formation. With a CO luminosity of K km s-1 pc2, the whole galaxy compares to only the CO luminosity of a single Milky Way high mass star-forming cloud. In this sense it resembles the SMC (Mizuno et al., 2001), which also has of order K km s-1 pc2 and a star formation rate of M⊙ yr-1. In its very high ratio of SFR-to-CO, times higher than in (massive) disk galaxies, it conforms to a broader population of dwarf galaxies (see Schruba et al., 2012). This low CO luminosity relative to star formation rate is usually interpreted as a selective destruction of CO molecules, as discussed in the introduction.
In detail, however, our mass budget for NGC 6822 holds a surprise. When focusing on our four star-forming complexes, at face value, the ratio of the recent star formation rate to the apparent gas reservoir — H2, H i, or both — appears high. That means, the apparent consumption time of the star-forming gas is quite short. We compare the integrated H2 mass of our complexes (as inferred from dust modeling) to their star formation rate and find that present day star formation will consume the molecular gas content of the complexes in Myr. This is much shorter than the typical Gyr molecular gas depletion time seen for massive disk galaxies (e.g., Bigiel et al., 2011; Saintonge et al., 2011; Schruba et al., 2011; Leroy et al., 2013). Even including the atomic gas associated with the complexes, this consumption time appears short, with star formation being able to consume the all of the complex’s atomic and molecular gas (as inferred from dust) in Myr (or Myr if we add the diffuse atomic gas component that we had removed by our background subtraction). At first glance, these “short” depletion timescales seem to be in good agreement with estimates for other nearby low mass ( ), low metallicity () galaxies (Gardan et al., 2007; Gratier et al., 2010; Bolatto et al., 2011; Bothwell et al., 2014; Cormier et al., 2014; Hunt et al., 2015; Jameson et al., 2016), but are in conflict with the very long depletion times ( Gyr) found by Shi et al. (2014). All these studies (with the exception of Shi et al.) suggest that the molecular gas depletion time in low mass, low metallicity dwarf galaxies is a factor shorter than in massive disk galaxies.
Here we want to bring forward a line of thought why the depletion time in NGC 6822 (and potentially other dwarf galaxies) may be considerably longer than the Gyr repeatedly stated. Our survey of NGC 6822 has selectively targeted regions of current active star formation; a selection bias that frequently applies to observations of (dwarf) galaxies. However, when considering the time evolution of the gas-star cycle in galaxies, these actively star-forming regions may not be the regions that host most star-forming gas. Especially if the formation timescale of star-forming gas clouds in much longer than the star formation process itself, then a significant amount of the star-forming gas is in “quiescent” clouds that may have been missed by surveys that selectively targeted regions of active star formation. This caveat especially applies to studies of nearby galaxies with large angular extent on the sky.
The biasing in the gas depletion time for small apertures selectively targeting star-forming or gas-rich regions has been studied observationally by Schruba et al. (2010) and theoretically by Kruijssen & Longmore (2014). Here we utilize the Kruijssen & Longmore model to estimate the bias in the depletion time when focusing selectively on star-forming regions as compared to a complete survey of the entire galaxy. In detail, we use their Eq. 16 which is
| (2) |
and adopt the following parameters: lifetime of the complexes Myr (one dynamical timescale at the location of our survey fields; Weldrake et al., 2003); duration of star formation Myr (age spread of massive stars from HST; O’Dell et al., 1999); visibility timescale of (H) star formation tracer Myr (with Myr from stellar synthesis modelling; Leroy et al., 2012, and D. T. Haydon et al., in preparation); total time range ; separation of SF regions pc (estimated from H map); fraction of gas decrease during SF process ; and the aperture size as independent variable. We note that these parameters are rough estimates; a detailed derivation and analysis of uncertainties is beyond the scope of this paper and will be presented in forthcoming papers.
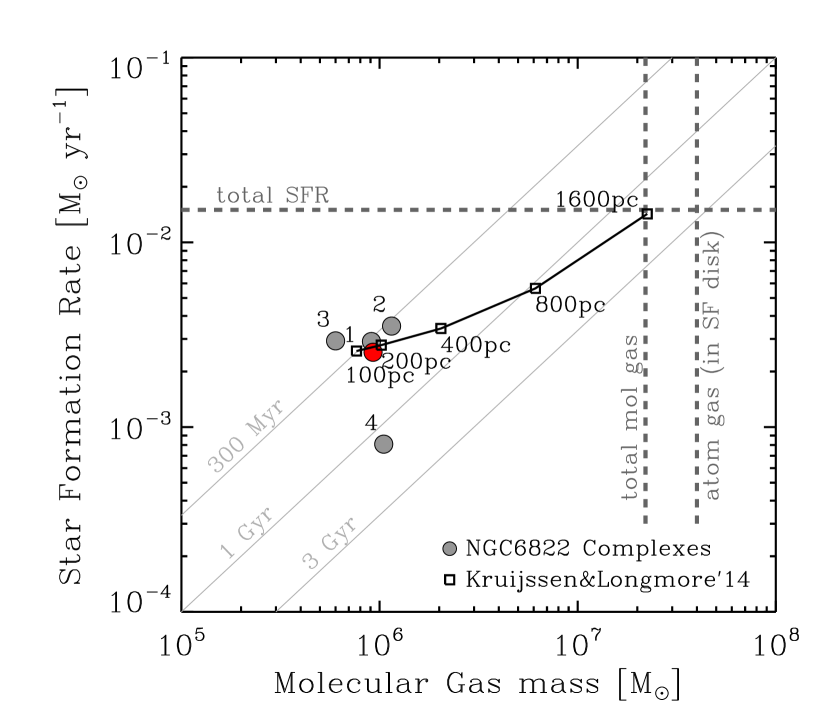
Figure 10 quantifies the bias in the molecular gas depletion time as derived by the Kruijssen & Longmore (2014) model. It shows the molecular gas mass (as inferred from the dust) and SFR measurements for the four complexes (gray circles) and their mean average (red circle), as well as the model-predicted scale-dependence of the bias (black curve) for the adopted parameters. In detail, the model predicts how and scale with aperture size, ,
| (3) | |||||
| (4) |
In Equation 3, the first term in parentheses reflects the ‘random’ background population of clouds and star-forming regions, whereas the second term reflects the contribution of the region that the aperture is focussed on, with the ratio indicating the probability that the region contains a representative gas reservoir. In Equation 4, the bias of the gas depletion time from Equation 2 is used to convert the molecular gas mass to an SFR. The model is constrained at small aperture size ( pc) by the average and for the star-forming complexes and at large aperture size ( kpc) by the total over the star-forming disk of NGC 6822 (a rectangle of kpc2). These boundary conditions fully constrain the galaxy’s molecular gas depletion time and total molecular gas mass which estimate as Gyr and , respectively. This implies a molecular gas fraction of over the star-forming disk or for all of NGC 6822; values that are in good agreement with estimates for other dwarf galaxies (Bothwell et al., 2014; Hunt et al., 2015).
If all molecular gas is in massive complexes of (as estimated for our four targeted complexes), then we expect such complexes in NGC 6822. It remains unclear though if this expectation holds. Gratier et al. (2010) identified 15 CO-bright clouds in their IRAM 30-m CO map (covering about half the star-forming disk) but those have typically a lower mass of . Alternatively, (the dust component of) the predicted clouds should be visible in the Spitzer and Herschel infrared maps, but those do not provide a conclusive answer due to confusion with Galactic foreground emission. On the other hand, our estimate of a long depletion time is in agreement with theoretical predictions that on large ( kpc) scales, star formation and the amount of molecular gas may show a nearly constant ratio for metallicity Z⊙ because star formation and H2 formation have similar density and shielding requirements (e.g., Krumholz et al., 2011; Glover & Clark, 2012a, b).
The presence or absence of a large CO-faint H2 component pivots on joint analysis of the dust and gas data. This process has a number of subtleties and uncertainties, which are discussed in detail in, e.g., Leroy et al. (2007, 2011) and Sandstrom et al. (2013). This analysis is not the focus of this paper; given the apparent discrepancy between our results and those of other recent analyses, we defer a detailed commentary until we are able to achieve a better determination of the dust content and analyze the whole set of Local Group galaxies in a self consistent way. Furthermore, a large-scale survey of neutral or ionized carbon line emission could verify the existence of a large CO-faint H2 component.
Another explanation leading to a short depletion time could be invoked in time rather than space: if NGC 6822 recently experienced a large burst of star formation then we might observe this burst in star formation tracers but the reservoir for the burst might have been dispersed by feedback. This scenario also does not appear viable. The star formation rate in NGC 6822 has been roughly constant over the past Myr (with variations of a factor over durations of a few 10’s of Myr; Efremova et al., 2011) and the galaxy displays a typical specific star formation rate (). There is no evidence that NGC 6822 has recently undergone a galaxy-wide starburst.
6. Summary
We present the first ALMA maps of the molecular gas in the Local Group star-forming dwarf irregular galaxy NGC 6822. We observe five fields, detecting CO(2-1) in the four fields showing active high mass star formation. These regions together encompass of the star formation activity in the galaxy and within them we resolve compact CO clumps. We measure the properties of these clumps at a resolution of 2 pc, a sharpness of view previously only achievable in the Milky Way. We find the bright CO emission to correlate well with the location of PAH emission seen in Spitzer imaging. The relationship of CO to emission is less straightforward at these high resolutions, and the correspondence with H on these scales is poor. Compared to high mass Galactic star-forming clouds, the regions that we observe in NGC 6822 have a narrower distribution of CO intensities on average and are less bright.
In agreement with Rubio et al. (2015) but considering a times larger sample of clumps, we show that CO emission from low metallicity galaxies originates from very compact, bright regions with small radii of pc and narrow line widths of km s-1. The macroscopic properties of these CO bright clumps are very similar (with possible offsets ) to CO-bright structures within the Milky Way’s Perseus arm and WLM. The only noticeable difference between NGC 6822 and the Galaxy on these scales appear to be lower surface brightnesses and a factor of higher virial masses or virial ratios for fixed (CO-inferred) luminous masses. These differences can be resolved by either sub-thermal excitation of the observed CO(2-1) transition, a CO-to-H2 conversion factor times larger than the standard galactic value, or due to the additional weight (i.e., surface pressure) of the increasing shielding layers. Within their confidence level all three explanations are viable. One of our main results is that the (well-shielded) CO-bright clumps in NGC 6822 have similar physical properties such as size, column and volume density, and dynamical equilibrium state as equally-sized structures in the Milky Way and largely unaffected by the low ( solar) metallicity of NGC 6822.
By modeling the infrared emission of dust, we infer total gas masses of the atomic-molecular complexes hosting the CO-bright clumps of . About of their mass is in atomic form and in molecular form. The inferred surface densities are sufficiently high to shield H2 within the entire complexes and CO within the dense clumps. This disparate distribution of H2 and CO leads to a strong dependence of the CO-to-H2 conversion factor, , on both metallicity and spatial scale. The CO-to-H2 ratio can be very low in low metallicity systems on spatial scales (few ) of whole molecular clouds to the entire galaxy while it can approach Galactic values inside small (pc), dense, well-shielded gas clumps.
At the current star formation rate, the molecular gas component of the complexes will be exhausted within Myr; a timescale in agreement with previous measurements of other nearby, low mass galaxies. However, we caution that this short timescale may not apply to the entire galaxy since our survey targeted selectively regions of active star formation. We apply the theoretical model by Kruijssen & Longmore (2014) to estimate the bias in the depletion time for small apertures focused on star-forming regions and find that the global molecular gas depletion time may be as long as Gyr and thus similar to massive disk galaxies. This analysis also suggest a significant population of quiescent molecular clouds and a considerable molecular gas fraction of within the star-forming disk of NGC 6822 or the entire galaxy. The alternative explanation to explain the short depletion times – a recent burst in star formation – does not seem to apply to NGC 6822. We caution that these results require detailed follow-up but they raise the possibility that low metallicity dwarf galaxies may harbor significantly more molecular gas than inferred by previous surveys and that low and high mass galaxies may share similar molecular gas depletion times as has been proposed in several theoretical models (e.g., Krumholz et al., 2011; Glover & Clark, 2012a, b). A future homogeneous analysis of gas and dust tracers of all Local Group galaxies will provide a definitive answer.
Beyond the mystery of the complex-scale accounting, this work raises several prospects for fruitful follow-up. The good correspondence between high resolution and CO emission reinforces the potential, already highlighted by Sandstrom et al. (2010) and Gratier et al. (2010), for PAH signatures including those observed by WISE at to trace molecular gas in the low metallicity galaxies. The compact, confined nature of the CO emission in NGC 6822 agrees with the physical picture that a lack of dust shielding pushes CO emission deep into molecular clouds at low metallicity; a direct, pc-scale comparison of the distributions of dust and CO could measure whether the threshold for CO emission is indeed the same in dwarf galaxies and the Milky Way (see, e.g., Lee et al., 2015). Finally, the highly structured nature of the emission in our fields offers the possibility to employ a combination of CO and H i kinematics to probe the kinematics of gas in atomic-molecular complexes across the whole range of scales present in one of our fields, in the process offering additional constraints on the dynamical mass.
References
- Abreu-Vicente et al. (2015) Abreu-Vicente, J., Kainulainen, J., Stutz, A., Henning, T., & Beuther, H. 2015, A&A, 581, A74
- Abreu-Vicente et al. (2016) Abreu-Vicente, J., Stutz, A., Robitaille, T., Henning, T., & Keto, E. 2016, ArXiv e-prints, arXiv:1605.03195
- Alves et al. (2007) Alves, J., Lombardi, M., & Lada, C. J. 2007, A&A, 462, L17
- Asplund et al. (2009) Asplund, M., Grevesse, N., Sauval, A. J., & Scott, P. 2009, ARA&A, 47, 481
- Bagetakos et al. (2011) Bagetakos, I., Brinks, E., Walter, F., et al. 2011, AJ, 141, 23
- Bianchi et al. (2012) Bianchi, L., Efremova, B., Hodge, P., Massey, P., & Olsen, K. A. G. 2012, AJ, 143, 74
- Bianchi & Efremova (2006) Bianchi, L., & Efremova, B. V. 2006, AJ, 132, 378
- Bianchi et al. (2001) Bianchi, L., Scuderi, S., Massey, P., & Romaniello, M. 2001, AJ, 121, 2020
- Bieging & Peters (2011) Bieging, J. H., & Peters, W. L. 2011, ApJS, 196, 18
- Bigiel et al. (2010) Bigiel, F., Leroy, A., Walter, F., et al. 2010, AJ, 140, 1194
- Bigiel et al. (2011) Bigiel, F., Leroy, A. K., Walter, F., et al. 2011, ApJ, 730, L13+
- Bihr et al. (2015) Bihr, S., Beuther, H., Ott, J., et al. 2015, A&A, 580, A112
- Bolatto et al. (2005) Bolatto, A. D., Israel, F. P., & Martin, C. L. 2005, ApJ, 633, 210
- Bolatto et al. (2003) Bolatto, A. D., Leroy, A., Israel, F. P., & Jackson, J. M. 2003, ApJ, 595, 167
- Bolatto et al. (2013) Bolatto, A. D., Wolfire, M., & Leroy, A. K. 2013, ARA&A, 51, 207
- Bolatto et al. (2011) Bolatto, A. D., Leroy, A. K., Jameson, K., et al. 2011, ApJ, 741, 12
- Bothwell et al. (2014) Bothwell, M. S., Wagg, J., Cicone, C., et al. 2014, MNRAS, 445, 2599
- Braun et al. (2009) Braun, R., Thilker, D. A., Walterbos, R. A. M., & Corbelli, E. 2009, ApJ, 695, 937
- Brunt et al. (2003) Brunt, C. M., Kerton, C. R., & Pomerleau, C. 2003, ApJS, 144, 47
- Cannon et al. (2006) Cannon, J. M., Walter, F., Armus, L., et al. 2006, ApJ, 652, 1170
- Cormier et al. (2014) Cormier, D., Madden, S. C., Lebouteiller, V., et al. 2014, A&A, 564, A121
- Dale et al. (2007) Dale, D. A., Gil de Paz, A., Gordon, K. D., et al. 2007, ApJ, 655, 863
- de Blok & Walter (2000) de Blok, W. J. G., & Walter, F. 2000, ApJ, 537, L95
- de Blok & Walter (2003) —. 2003, MNRAS, 341, L39
- de Blok & Walter (2006a) —. 2006a, AJ, 131, 363
- de Blok & Walter (2006b) —. 2006b, AJ, 131, 343
- Draine & Li (2007) Draine, B. T., & Li, A. 2007, ApJ, 657, 810
- Efremova et al. (2011) Efremova, B. V., Bianchi, L., Thilker, D. A., et al. 2011, ApJ, 730, 88
- Fukui et al. (2008) Fukui, Y., Kawamura, A., Minamidani, T., et al. 2008, ApJS, 178, 56
- Galametz et al. (2010) Galametz, M., Madden, S. C., Galliano, F., et al. 2010, A&A, 518, L55
- Galliano et al. (2011) Galliano, F., Hony, S., Bernard, J.-P., et al. 2011, A&A, 536, A88
- García-Rojas et al. (2016) García-Rojas, J., Peña, M., Flores-Durán, S., & Hernández-Martínez, L. 2016, A&A, 586, A59
- Gardan et al. (2007) Gardan, E., Braine, J., Schuster, K. F., Brouillet, N., & Sievers, A. 2007, A&A, 473, 91
- Genzel et al. (2012) Genzel, R., Tacconi, L. J., Combes, F., et al. 2012, ApJ, 746, 69
- Glover & Clark (2012a) Glover, S. C. O., & Clark, P. C. 2012a, MNRAS, 421, 9
- Glover & Clark (2012b) —. 2012b, MNRAS, 426, 377
- Glover & Mac Low (2011) Glover, S. C. O., & Mac Low, M.-M. 2011, MNRAS, 412, 337
- Grabelsky et al. (1987) Grabelsky, D. A., Cohen, R. S., Bronfman, L., Thaddeus, P., & May, J. 1987, ApJ, 315, 122
- Gratier et al. (2010) Gratier, P., Braine, J., Rodriguez-Fernandez, N. J., et al. 2010, A&A, 512, A68+
- Heiles & Troland (2003) Heiles, C., & Troland, T. H. 2003, ApJ, 586, 1067
- Hernández-Martínez et al. (2009) Hernández-Martínez, L., Peña, M., Carigi, L., & García-Rojas, J. 2009, A&A, 505, 1027
- Heyer et al. (2001) Heyer, M. H., Carpenter, J. M., & Snell, R. L. 2001, ApJ, 551, 852
- Hodge et al. (1989) Hodge, P., Lee, M. G., & Kennicutt, Jr., R. C. 1989, PASP, 101, 32
- Huang et al. (2012) Huang, S., Haynes, M. P., Giovanelli, R., et al. 2012, AJ, 143, 133
- Hughes et al. (2010) Hughes, A., Wong, T., Ott, J., et al. 2010, MNRAS, 406, 2065
- Hunt et al. (2015) Hunt, L. K., García-Burillo, S., Casasola, V., et al. 2015, A&A, 583, A114
- Hunter et al. (2012) Hunter, D. A., Ficut-Vicas, D., Ashley, T., et al. 2012, AJ, 144, 134
- Indebetouw et al. (2013) Indebetouw, R., Brogan, C., Chen, C.-H. R., et al. 2013, ApJ, 774, 73
- Israel et al. (2003) Israel, F. P., Baas, F., Rudy, R. J., Skillman, E. D., & Woodward, C. E. 2003, A&A, 397, 87
- Jameson et al. (2016) Jameson, K. E., Bolatto, A. D., Leroy, A. K., et al. 2016, ApJ, 825, 12
- Kainulainen et al. (2009) Kainulainen, J., Beuther, H., Henning, T., & Plume, R. 2009, A&A, 508, L35
- Kalberla & Kerp (2009) Kalberla, P. M. W., & Kerp, J. 2009, ARA&A, 47, 27
- Kauffmann & Pillai (2010) Kauffmann, J., & Pillai, T. 2010, ApJ, 723, L7
- Kennicutt & Evans (2012) Kennicutt, R. C., & Evans, N. J. 2012, ARA&A, 50, 531
- Kennicutt et al. (2003) Kennicutt, Jr., R. C., Bresolin, F., & Garnett, D. R. 2003, ApJ, 591, 801
- Kiminki et al. (2015) Kiminki, M. M., Kim, J. S., Bagley, M. B., Sherry, W. H., & Rieke, G. H. 2015, ApJ, 813, 42
- Koribalski et al. (2004) Koribalski, B. S., Staveley-Smith, L., Kilborn, V. A., et al. 2004, AJ, 128, 16
- Kruijssen (2014) Kruijssen, J. M. D. 2014, Classical and Quantum Gravity, 31, 244006
- Kruijssen & Longmore (2014) Kruijssen, J. M. D., & Longmore, S. N. 2014, MNRAS, 439, 3239
- Krumholz et al. (2011) Krumholz, M. R., Leroy, A. K., & McKee, C. F. 2011, ApJ, 731, 25
- Krumholz et al. (2008) Krumholz, M. R., McKee, C. F., & Tumlinson, J. 2008, ApJ, 689, 865
- Lee et al. (2015) Lee, C., Leroy, A. K., Schnee, S., et al. 2015, MNRAS, 450, 2708
- Lee et al. (2009) Lee, J. C., Kennicutt, Jr., R. C., Funes, S. J. J. G., Sakai, S., & Akiyama, S. 2009, ApJ, 692, 1305
- Leroy et al. (2007) Leroy, A., Bolatto, A., Stanimirovic, S., et al. 2007, ApJ, 658, 1027
- Leroy et al. (2009) Leroy, A. K., Walter, F., Bigiel, F., et al. 2009, AJ, 137, 4670
- Leroy et al. (2011) Leroy, A. K., Bolatto, A., Gordon, K., et al. 2011, ApJ, 737, 12
- Leroy et al. (2012) Leroy, A. K., Bigiel, F., de Blok, W. J. G., et al. 2012, AJ, 144, 3
- Leroy et al. (2013) Leroy, A. K., Walter, F., Sandstrom, K., et al. 2013, AJ, 146, 19
- Leroy et al. (2015) Leroy, A. K., Bolatto, A. D., Ostriker, E. C., et al. 2015, ApJ, 801, 25
- Mac Low & Klessen (2004) Mac Low, M.-M., & Klessen, R. S. 2004, Reviews of Modern Physics, 76, 125
- Madden et al. (2013) Madden, S. C., Rémy-Ruyer, A., Galametz, M., et al. 2013, PASP, 125, 600
- Madden et al. (2014) —. 2014, PASP, 126, 1079
- McKee & Ostriker (2007) McKee, C. F., & Ostriker, E. C. 2007, ARA&A, 45, 565
- Mizuno et al. (2001) Mizuno, N., Rubio, M., Mizuno, A., et al. 2001, PASJ, 53, L45
- Muench et al. (2008) Muench, A., Getman, K., Hillenbrand, L., & Preibisch, T. 2008, in The Northern Sky ASP Monograph Publications, Vol. 4, Handbook of Star Forming Regions, Volume I, ed. B. Reipurth, 483
- O’Dell et al. (1999) O’Dell, C. R., Hodge, P. W., & Kennicutt, Jr., R. C. 1999, PASP, 111, 1382
- Pak et al. (1998) Pak, S., Jaffe, D. T., van Dishoeck, E. F., Johansson, L. E. B., & Booth, R. S. 1998, ApJ, 498, 735
- Petry & CASA Development Team (2012) Petry, D., & CASA Development Team. 2012, in Astronomical Society of the Pacific Conference Series, Vol. 461, Astronomical Data Analysis Software and Systems XXI, ed. P. Ballester, D. Egret, & N. P. F. Lorente, 849
- Pineda et al. (2008) Pineda, J. E., Caselli, P., & Goodman, A. A. 2008, ApJ, 679, 481
- Polychroni et al. (2012) Polychroni, D., Moore, T. J. T., & Allsopp, J. 2012, MNRAS, 422, 2992
- Rathborne et al. (2009) Rathborne, J. M., Lada, C. J., Muench, A. A., et al. 2009, ApJ, 699, 742
- Rathborne et al. (2014) Rathborne, J. M., Longmore, S. N., Jackson, J. M., et al. 2014, ApJ, 795, L25
- Rémy-Ruyer et al. (2014) Rémy-Ruyer, A., Madden, S. C., Galliano, F., et al. 2014, A&A, 563, A31
- Rémy-Ruyer et al. (2015) —. 2015, A&A, 582, A121
- Rich et al. (2014) Rich, J. A., Persson, S. E., Freedman, W. L., et al. 2014, ApJ, 794, 107
- Roccatagliata et al. (2013) Roccatagliata, V., Preibisch, T., Ratzka, T., & Gaczkowski, B. 2013, A&A, 554, A6
- Rosolowsky & Leroy (2006) Rosolowsky, E., & Leroy, A. 2006, PASP, 118, 590
- Roychowdhury et al. (2015) Roychowdhury, S., Huang, M.-L., Kauffmann, G., Wang, J., & Chengalur, J. N. 2015, MNRAS, 449, 3700
- Rubio et al. (2015) Rubio, M., Elmegreen, B. G., Hunter, D. A., et al. 2015, Nature, 525, 218
- Saintonge et al. (2011) Saintonge, A., Kauffmann, G., Wang, J., et al. 2011, MNRAS, 415, 61
- Sandstrom et al. (2010) Sandstrom, K. M., Bolatto, A. D., Draine, B. T., Bot, C., & Stanimirović, S. 2010, ApJ, 715, 701
- Sandstrom et al. (2013) Sandstrom, K. M., Leroy, A. K., Walter, F., et al. 2013, ApJ, 777, 5
- Schlafly & Finkbeiner (2011) Schlafly, E. F., & Finkbeiner, D. P. 2011, ApJ, 737, 103
- Schruba (2013) Schruba, A. 2013, in IAU Symposium, Vol. 292, Molecular Gas, Dust, and Star Formation in Galaxies, ed. T. Wong & J. Ott, 311–318
- Schruba et al. (2010) Schruba, A., Leroy, A. K., Walter, F., Sandstrom, K., & Rosolowsky, E. 2010, ApJ, 722, 1699
- Schruba et al. (2011) Schruba, A., Leroy, A. K., Walter, F., et al. 2011, AJ, 142, 37
- Schruba et al. (2012) —. 2012, AJ, 143, 138
- Shi et al. (2014) Shi, Y., Armus, L., Helou, G., et al. 2014, Nature, 514, 335
- Shi et al. (2015) Shi, Y., Wang, J., Zhang, Z.-Y., et al. 2015, ApJ, 804, L11
- Smith & Brooks (2008) Smith, N., & Brooks, K. J. 2008, in The Southern Sky ASP Monograph Publications, Vol. 5, Handbook of Star Forming Regions, Volume II, ed. B. Reipurth, 138
- Sternberg et al. (2014) Sternberg, A., Le Petit, F., Roueff, E., & Le Bourlot, J. 2014, ApJ, 790, 10
- Tan et al. (2014) Tan, J. C., Beltrán, M. T., Caselli, P., et al. 2014, Protostars and Planets VI, 149
- Weldrake et al. (2003) Weldrake, D. T. F., de Blok, W. J. G., & Walter, F. 2003, MNRAS, 340, 12
- Wilson et al. (2005) Wilson, B. A., Dame, T. M., Masheder, M. R. W., & Thaddeus, P. 2005, A&A, 430, 523
- Wolfire et al. (2010) Wolfire, M. G., Hollenbach, D., & McKee, C. F. 2010, ApJ, 716, 1191
- Wong et al. (2011) Wong, T., Hughes, A., Ott, J., et al. 2011, ApJS, 197, 16
- Yoda et al. (2010) Yoda, T., Handa, T., Kohno, K., et al. 2010, PASJ, 62, 1277
- Zubko et al. (2004) Zubko, V., Dwek, E., & Arendt, R. G. 2004, ApJS, 152, 211