The accreted stellar halo as a window on halo assembly in L∗ galaxies
Abstract
Theory and observations agree that the accreted stellar halos (ASHs) of Milky Way-like galaxies display significant scatter. I take advantage of this stochasticity to invert the link between halo assembly history (HAH) and ASH, using mock ASHs corresponding to 750 CDM HAHs, sharing a final virial mass of . Hosts with poor/rich ASHs assemble following orthogonal growth-patterns. Hosts with rich ASHs experience accretion events (AEs) with high virial mass ratios (HVMRs, ) at , in a phase of fast growth. This maximizes the accreted stellar mass under the condition these satellites are disrupted by . At similar times, hosts with poor ASHs grow slowly through minor mergers, with only very recent HVMR AEs: this results in a globally more abundant satellite population and in distinctive surviving massive satellites (stellar mass ). Several properties of the Milky Way are in agreement with the predictions of this framework for hosts with poor, concentrated ASHs, including: i) the recent infall of Sagittarius and Magellanic Clouds, ii) the likely higher-than-average concentration of its dark halo, iii) the signatures of fast chemical enrichment of a sizable fraction of its halo stellar populations.
keywords:
dark matter – galaxies: evolution – galaxies: formation – galaxies: halos – galaxies: structure1 Introduction
The accreted stellar halo (ASH) of a galaxy collects all those stars that were born ex-situ, within another less massive galaxy, and that accumulated around their current host through hierarchical merging (e.g. Eggen et al., 1962; Searle & Zinn, 1978; White & Frenk, 1991; Johnston et al., 2008). As such, the ASH represents a record of the assembly process of galaxies through cosmic time, by means of which it is possible, at least in theory, to test the prevailing cosmological paradigm.
Currently, however, a clear bridge between halo assembly history (HAH) and the properties of the ASH is missing, and the inversion of this connection appears difficult, despite significant effort (e.g. Bullock & Johnston, 2005; Cooper et al., 2010; Deason et al., 2013; Pillepich et al., 2014, and references therein). A fundamental reason for this is that the properties of the ASH are a function of an extremely large number of free parameters: at least a handful are needed to determine how each single ‘building block’ deposits its stars, even under the crudest simplifications (Amorisco, 2017a). This needs to be factored by the number of contributing satellite galaxies, and by the stochasticity of merging histories. As a result, it remains difficult and possibly misleading to draw conclusions based on small samples of simulations, regardless of their realism. Here, I use tens of thousands of toy models (Amorisco, 2016, 2017b, in prep.) to systematically compare the HAHs of galaxies differing in their ASHs.
It is interesting to note that, within a CDM universe, the link between HAH and ASH can be expected to become less clear with increasing host halo mass. CDM mean merging histories are approximately independent of host mass (e.g., Guo & White, 2008; Fakhouri et al., 2010), implying very similar numbers of minor mergers per virial mass ratio , where and are respectively the virial masses of satellite and host, at the redshift of infall. In turn, the efficiency of haloes at forming galaxies is instead a strong function of halo mass (e.g., Moster et al., 2010; Guo et al., 2010). As a consequence:
-
•
for Milky Way-like (MW) hosts, the break in the stellar-to-halo mass relation (SHMR) and its steepness below the break (e.g., Behroozi et al., 2013; Garrison-Kimmel et al., 2014), ensure that accretion events (AEs) with high virial mass ratios (HVMRs) dominate the budget of accreted stars (e.g., Cooper et al., 2010; Amorisco, 2016; Deason et al., 2016), leaving their distinctive fingerprints on both global and local properties of the ASH;
-
•
in massive ellipticals, instead, the numerous minor mergers contribute sufficient stellar material that ASHs better ‘converge’ towards similar properties. This has an analogue in dark matter haloes themselves, where convergence is complete and a ‘universal profile’ emerges (e.g., Navarro et al., 1997; Syer & White, 1998; Ludlow et al., 2013).
Results of both theoretical analyses (e.g., Purcell et al., 2007; Cooper et al., 2013; Pillepich et al., 2014; Rodriguez-Gomez et al., 2016) and recent observations (e.g., Merritt et al., 2016; Harmsen et al., 2016; Monachesi et al., 2016; Gilbert et al., 2012; Ibata et al., 2014; Sesar et al., 2011; Deason et al., 2013, and references therein) are consistent with this interpretation, by showing that the scatter in the properties of the ASH increases in proceeding from massive hosts down to MW-like galaxies.
With an average of only 2.9 AEs at having a VMR (Fakhouri et al., 2010), the properties of the ASH of a MW-like host are therefore dominated by Poisson noise in the galaxy’s HAH, i.e. by whether, when, and how many of these HVMR AEs actually took place. In this Letter, I show that this stochasticity provides us with the opportunity of inverting the connection between HAH and ASH, using both global and local properties of the ASH as a window onto halo assembly (HA). Sect. 2 briefly introduces the models I employ, Sect. 3 illustrates results, Sect. 4 lays out the Conclusions.
2 From halo assembly history to the accreted stellar halo
In Amorisco (2017a) I have shown that, under a set of assumptions that is essentially equivalent to the one adopted by particle-tagging techniques (e.g., Bullock et al., 2001; Cooper et al., 2010, 2013, 2016), the process of stellar deposition by a satellite galaxy can be reduced to a handful of dimensionless free parameters. This provides a strategy (Amorisco, 2016) to efficiently construct large numbers of mock ASHs, using a library of isolated, dark matter only minor merger simulations. In each minor merger, both host and satellite have spherically symmetric NFW density profiles and the satellite’s stars are represented by its most bound particles, so that no additional assumptions have to be made regarding stripping. Given a CDM HAH and a standard SHMR for the satellites, a toy ASH is built up like in a game of Lego, by adding up the (properly timed and rescaled) contributions of each accreted satellite, promptly recovered from the library. I refer to Amorisco (2017b, in prep.) for details on this technique, and for a description of the properties of these mocks. There, I use a library of over 110 minor-merger simulations to construct three sets of ASHs, for hosts with final virial mass of . Each set explores 750 individual CDM HAHs, each of which is used to generate tens of ASHs, so to sample the scatter in the SHMR.
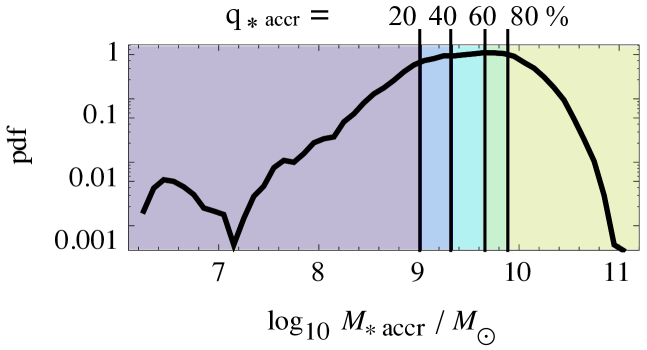
Here, I employ the set of ASHs for the hosts with . The probability density distribution for the total accreted stellar mass in the ASH, , is displayed in Fig. 1. collects debris deposited at all radii, and contributed by any satellite with VMR (defined at infall), at . Satellites can be either fully disrupted by , or partially surviving in a bound remnant, in which case only the stripped stars contribute to . Fig. 1 shows that ranges in the interval , confirming the extremely wide scatter in the global properties of the ASHs of MW-like galaxies. While this is in very good quantitative agreement with the results of Cooper et al. (2013), the vast set of HAHs explored here allows me to first probe the surprising extent of the low-mass tail of the distribution, populated by ASHs that are under-massive by dex with respect to the median (see also Amorisco, 2017b, in prep.).
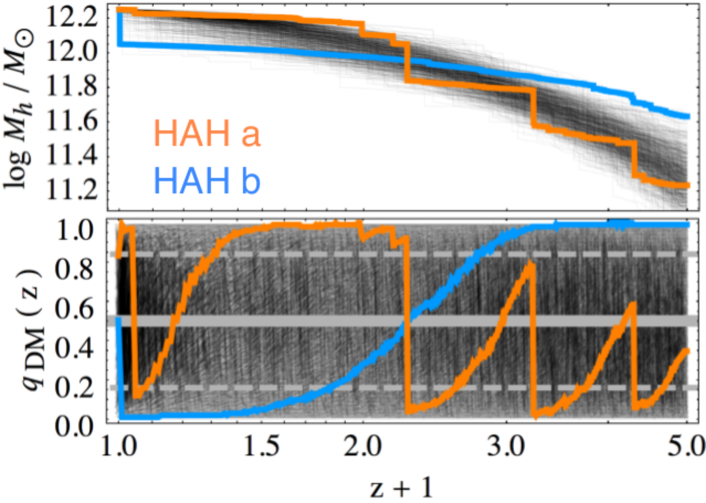
The top panel of Fig. 2 illustrates the full set of 750 HAHs. The scatter increases towards higher redshifts, with haloes following different assembly patterns. Two different cases are highlighted: HAH a grows substantially at , by which time it is significantly more massive than average; HAH b, instead, starts by being uncommonly massive at high redshift, and grows slowly thereafter, with a single HVMR AE, very recently. The bottom panel of Fig. 2 presents an alternative way of comparing HAHs: each individual track quantifies how the mass of each halo compares with the full ensemble, using the redshift dependent quantile . By construction, haloes that are more (less) massive than the median at redshift have (grey solid line, with 16 and 84% quantiles, dashed). readily visualises different modes of growth: HAH a is characterised by 3 HVMR AEs at , standing out as vertical ‘jumps’; HAH b is among the most massive haloes at high redshift, and then follows a monotonically decreasing track in , which stands for a slower-than-average growth sustained by minor mergers alone.

3 The accreted stellar halo shaping halo assembly
3.1 Disentangling HAHs by total accreted stellar mass
I partition the set of mock ASHs in quintiles, , based on the total accreted stellar mass, as shown in Fig. 1. Each quintile collects 150 individual HAHs, resulting in similarly poor/rich ASHs. Values of the accreted stellar mass at the boundary between the different families are . Fig. 3 shows the mean cumulative distribution of AEs experienced by hosts within these 5 families (color-coding as in Fig. 1), in terms of the VMR at the time of infall in panel a and in terms of the satellite virial mass in panel b. There is a clear ordering in the mean number of HVMR AEs, , or alternatively with : hosts with richer ASHs collect the debris of a systematically larger number of massive building blocks. This is reversed at lower VMRs and satellite masses: where more dark matter has been contributed by massive satellites there is systematically less room for low mass AEs.
This is mirrored in the current satellite population of each family of hosts: panel c in Fig. 3 shows the mean cumulative distributions of surviving satellites, in terms of their stellar mass at . Hosts with rich ASHs feature a globally less numerous population of satellites, in line with panels a and b. However, differently from panel a, this trend is not reversed for satellites with high stellar mass: hosts with poor ASHs display systematically more surviving massive satellites (), despite experiencing a smaller number of HVMR AEs. This implies that the richness of the ASH does not just follow from the number of HVMR AEs, but also from the survival of such massive satellites, and therefore from their infall times.
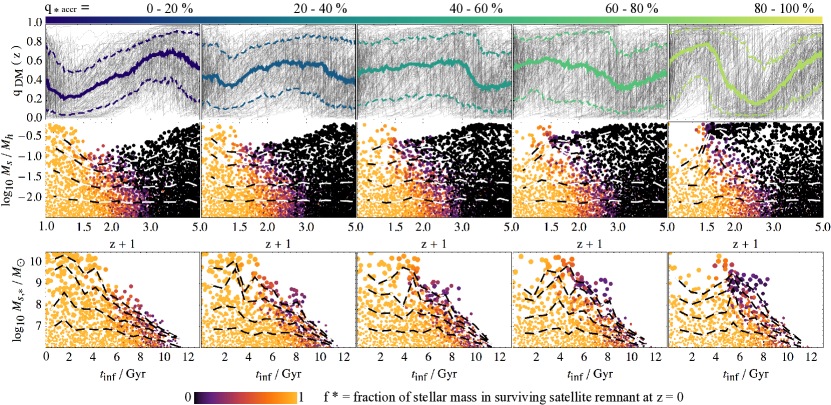
Columns in Fig. 4 correspond to the 5 quantiles , proceeding towards richer ASHs to the right. Panels in the top row collect all 150 HAHs in each family (thin grey lines), together with their median track, 16 and 84% quantiles. A comparison across the different columns shows that ordering by accreted stellar mass introduces bias: hosts with poor/rich ASHs experience different HAHs, despite the significant scatter. Hosts in the first quantile become more massive than average at , to then follow a monotonically decreasing track in until recent times. Hosts in the fifth quantile follow an orthogonal growth pattern, with an initially monotonically decreasing track at , followed by a very active period at intermediate times. The transition between first and fifth quantiles is smooth and the fast-slow-fast growth pattern of hosts with poor ASHs is gradually replaced by the slow-fast-slow pattern of hosts with rich ASHs.
The middle row of Fig. 4 shows the population of AEs that support these modes of growth, as a collection over the 150 HAHs. The timing of AEs with HVMRs () is strikingly different. The first quintile is deficient in HVMRs AEs at intermediate times: these hosts grow very slowly by minor mergers alone at , with a correspondingly declining . At similar times, hosts in the fifth quantile are experiencing most of their HVMR AEs, with growing quickly. Symmetrically, the population of very recent HVMR AEs is more numerous in hosts with poor ASHs: exceedingly recent HVMR AEs provide an efficient way of ‘wasting’ stellar mass, as these satellites are not destroyed by . This is shown by the color-code of each AE, indicating the surviving fraction of stellar mass in remnants.
This analysis illustrates the best possible strategies to minimize/maximize while keeping the virial mass of the host fixed. First, because of the steep SHMR, HVMR AEs are more efficient in contributing stars to the ASH (Fig. 3). Second, the timing of these AEs is equally crucial (Fig. 4): at fixed VMR, more recent AEs contribute more stellar mass, unless they’re recent enough to survive tides. Fig. 4 shows the full spectrum between the two opposite strategies that make best use of these ingredients.
The mean current satellite population is the subject of the bottom row of Fig. 4: is the stellar mass of the remnant and color-coding of each event shows the surviving fraction . Most HVMR AEs of hosts with poor ASHs correspond to a surviving remnant: hosts in the first quantile feature significantly more satellites infalling very recently, , almost uniformly unaffected by tides, and massive (). Around hosts with rich ASHs similarly massive satellites are rare, and have different properties: they were accreted at earlier times and have already lost most of their stellar mass to the ASH.
3.2 Disentangling HAHs by the profile of the ASH
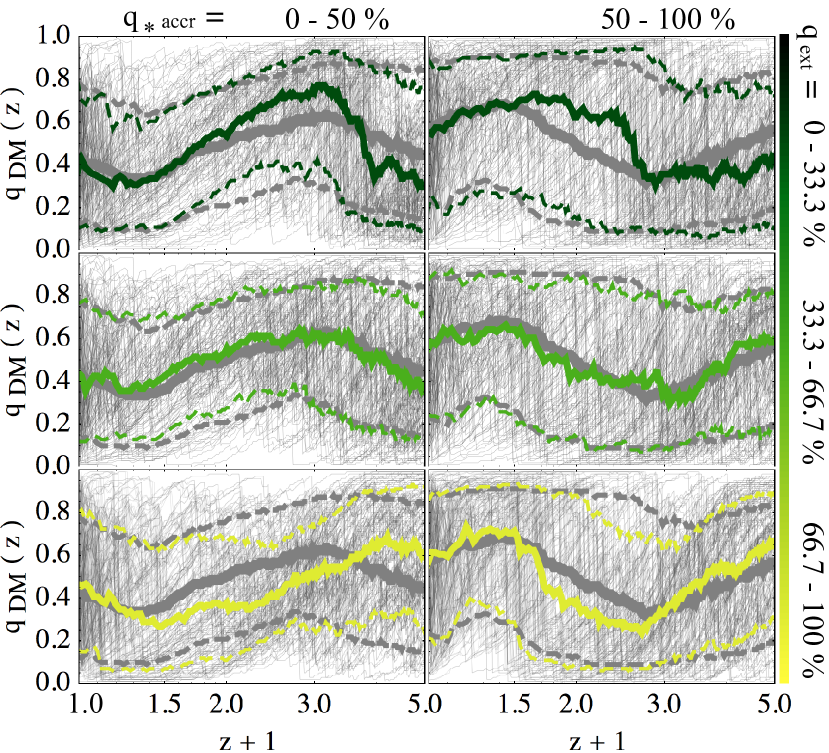
Fig. 5 explores on the opportunity of using the density profile of the ASH to further constrain HAH. Columns refer to an ordering in , and each collect those 375 HAHs that have or . The median HAH of these two families is shown with solid grey lines in all panels of each column, identical across rows. Within these two families I introduce an additional ordering, based on the radial extension of the ASH profile, as quantified by the ratio . Here, is the total accreted stellar mass within , and I have taken kpc ( provide very similar results). Within each column, this ordering defines a set of terciles: hosts with have ASHs that are less (more) extended than the median.
The fundamental mode of growth of all 6 families is preserved: independent of the ‘concentration’ of their ASHs, hosts in the left column concur to median HAHs (colored lines) that follow the pattern fast-slow-fast, while the orthogonal pattern slow-fast-slow emerges in the panels of the right column. Comparison with the solid grey lines shows, however, that ordering by introduces additional bias, with differences in the intensity and timing of the different growth phases.
For , moving away from median-concentration ASHs implies a variation in the length of the intermediate phase of slow growth. This is shorter in hosts with concentrated ASHs, which experience HVMR AEs at . These AEs are capable of depositing stars closer to the center of the host (Amorisco, 2016; Rodriguez-Gomez et al., 2016; Amorisco, 2017a), resulting in a concentrated ASH. At the same time, they are early enough to keep below the median. Hosts with equally poor but extended ASHs see this initial phase of fast growth pushed towards higher redshifts: they are more massive than the median at , and therefore capable of growing through minor mergers since, with stellar material being deposited at comparatively larger radii. Symmetrically, the timing of the intermediate phase of fast growth in hosts with shifts towards more recent times in proceeding from concentrated to extended ASHs. Rich ASHs grow by HVMR AEs: by making them more recent (while still early enough to result in full satellite disruption), stellar material gets deposited at larger distances from the host’s center, as the host gradually grows in both mass and size over cosmic time.
4 Discussion and Conclusions
This Letter shows that both global and local properties of the ASH can be used to constrain HA in MW-like galaxies. Hosts with poor/rich ASHs assemble following well defined modes of growth which minimise/maximise the total accreted stellar mass, while keeping the final virial mass fixed. Fundamental differences in these modes lie in the number and timing of those rare HVMRs AEs, , which dominate the stellar budget of the ASH of galaxies.
On average, hosts with rich ASHs experience more HVMR AEs (Fig. 3). These take place in a phase of faster-than-average growth at intermediate times, , as a best compromise between contributing the highest possible amount of stellar mass and allowing for sufficient time to achieve full tidal disruption by . In turn, at similar times, hosts with poor ASHs experience a slower-than-average growth sustained by minor mergers alone (Fig. 4, middle row). HVMR AEs are concentrated at very recent times, : these satellites are not disrupted by and distinctively characterise the surviving satellite population (, Fig. 4, bottom row). The transition between these two idealised and opposite cases is smooth. Deviations in the properties of each contributing satellite from the mean relations (for instance: SHMR, mass-concentration-redshift relation and orbital parameters at infall, Amorisco, 2017a) is mirrored in substantial scatter around the different growth patterns (Fig. 4, top row).
Being a poor/rich stellar halo is in fact a temporary status: the massive satellites of hosts with poor ASHs will make them rich in the future. Poor/rich ASHs have not always being such at all redshifts, and the fundamental timescale of these periodic shifts is the time needed for full disruption of satellites with HVMRs.
The toy models used here are certainly highly simplified, and their limitations have been analysed in recent works (Bailin et al., 2014; Amorisco, 2016; Cooper et al., 2016). Additionally, at present, these models do not include a connection between the HAH and the properties of the host’s main stellar body: it is possible that some of the hosts in my sample would not look like galaxies, especially when approaching the edges of the ordering by accreted stellar mass. Furthermore, I have compared hosts with exactly the same virial mass and have ignored any in-situ contribution to the stellar halo (e.g., Sheffield et al., 2012; Dorman et al., 2013).
However, with its unprecedentedly large sample of explored HAHs and its purely comparative nature, this study provides a proof of concept, and represents a first step towards the quantitative inversion of the connection between HAH and ASH in galaxies. For example, this framework provides two basic predictions on the connection between ASH and the surviving satellite population.
-
•
Hosts with especially poor ASHs are significantly more likely to feature massive satellites, ; massive satellites surviving around hosts with rich ASHs have likely already experienced substantial stripping (Fig. 4, bottom row).
-
•
The total number of surviving satellites is smaller around hosts with rich ASHs (Fig. 3). When comparing our extreme quintiles in accreted stellar mass, the richness of their satellite populations differs by a factor of .Below . this figure can be expected to be independent of satellite mass, though it does not account explicitly for the accretion of satellites of satellites.
4.1 The MW’s likely poor and concentrated ASH
It is impossible not to note how the MW shows hints of a poor stellar halo (Bland-Hawthorn & Gerhard, 2016, and references therein) and, at the same time, it features the Magellanic Clouds: unusually massive satellites with very recent infall times (e.g., Besla et al., 2010; Peñarrubia et al., 2016). These are the culprits of hosts with poor ASHs for their virial mass. Let me assume the MW indeed belongs to this class. Then, this framework predicts that:
-
•
Its evolution was quiet at intermediate times: undisturbed since , the MW has grown slowly through minor mergers. This is in good agreement with previous studies (e.g., Hammer et al., 2007; Deason et al., 2013). Then, HVMR AEs have characterised its very recent past, with the addition of Sagittarius and Magellanic Clouds, which have not yet been (entirely) disrupted and incorporated into the ASH.
-
•
As for those hosts featuring poor ASHs, the dark halo of the MW is likely to have had an early half-mass formation time. Therefore, it is likely to be more concentrated than average for its virial mass (e.g., Ludlow et al., 2013). This prediction is consistent with the results of recent dynamical analyses, which seem to point in similar directions (Rashkov et al., 2013; Gibbons et al., 2014; Bovy et al., 2016).
Finally, in light of its sharply declining density profile (e.g., Sesar et al., 2011; Deason et al., 2013; Slater et al., 2016) it seems reasonable to assume that the ASH of the MW is concentrated, other than poor. If so, this framework further predicts that HVMR AEs have taken place at early times, . This would very well agree with the known differences between the stellar populations of Classical dwarf Spheroidals and MW halo (e.g., Tolstoy et al., 2009; Frebel & Norris, 2015, and references therein). The signatures of fast chemical enrichment displayed by a sizeable fraction of the MW halo populations would follow from these early contributions by massive satellites with HVMRs, providing a justification to i) the high number ratio of blue stragglers to blue-horizontal-branch stars (Deason et al., 2015), and ii) the distinctive tail of RR Lyrae stars with high amplitudes and short periods, present in the halo, but not in the Classical dwarf Spheroidals (Fiorentino et al., 2015).
A quantification of these statements is deferred to future work, and will be addressed by selecting those mock ASHs that are compatible with the observed properties of the stellar halo and satellite populations of MW and Andromeda, and constrain their virial mass and detailed HAHs. Recent success in the determination of both stellar halo density profiles (e.g., Merritt et al., 2016; Harmsen et al., 2016) and satellite populations (Crnojević et al., 2016; Toloba et al., 2016) of nearby galaxies will soon enable similar studies on a sample of external galaxies.
Acknowledgements
I am indebted with Antonela Monachesi for her useful comments on an early version of this manuscript. It is a pleasure to thank the anonymous referee for a constructive report.
References
- Amorisco (2016) Amorisco, N. C. 2016, arXiv:1608.00121
- Amorisco (2017a) Amorisco, N. C. 2017, MNRAS, 464, 2882
- Amorisco (2017b, in prep.) Amorisco, N. C. 2017, in prep.
- Bailin et al. (2014) Bailin, J., Bell, E. F., Valluri, M., et al. 2014, ApJ, 783, 95
- Behroozi et al. (2013) Behroozi, P. S., Wechsler, R. H., & Conroy, C. 2013, ApJ, 770, 57
- Besla et al. (2010) Besla, G., Kallivayalil, N., Hernquist, L., et al. 2010, ApJL, 721, L97
- Bland-Hawthorn & Gerhard (2016) Bland-Hawthorn, J., & Gerhard, O. 2016, ARAA, 54, 529
- Bovy et al. (2016) Bovy, J., Bahmanyar, A., Fritz, T. K., & Kallivayalil, N. 2016, ApJ, 833, 31
- Bullock et al. (2001) Bullock, J. S., Kravtsov, A. V., & Weinberg, D. H. 2001, ApJ, 548, 33
- Bullock & Johnston (2005) Bullock, J. S., & Johnston, K. V. 2005, ApJ, 635, 931
- Cooper et al. (2010) Cooper, A. P., Cole, S., Frenk, C. S., et al. 2010, MNRAS, 406, 744
- Cooper et al. (2013) Cooper, A. P., D’Souza, R., Kauffmann, G., et al. 2013, MNRAS, 434, 3348
- Cooper et al. (2016) Cooper, A. P., Cole, S., Frenk, C. S., Le Bret, T., & Pontzen, A. 2016, arXiv:1611.03497
- Crnojević et al. (2016) Crnojević, D., Sand, D. J., Spekkens, K., et al. 2016, ApJ, 823, 19
- Deason et al. (2013) Deason, A. J., Belokurov, V., Evans, N. W., & Johnston, K. V. 2013, ApJ, 763, 113
- Deason et al. (2015) Deason, A. J., Belokurov, V., & Weisz, D. R. 2015, MNRAS, 448, L77
- Deason et al. (2016) Deason, A. J., Mao, Y.-Y., & Wechsler, R. H. 2016, ApJ, 821, 5
- Dorman et al. (2013) Dorman, C. E., Widrow, L. M., Guhathakurta, P., et al. 2013, ApJ, 779, 103
- Eggen et al. (1962) Eggen, O. J., Lynden-Bell, D., & Sandage, A. R. 1962, ApJ, 136, 748
- Fakhouri et al. (2010) Fakhouri, O., Ma, C.-P., & Boylan-Kolchin, M. 2010, MNRAS, 406, 2267
- Fiorentino et al. (2015) Fiorentino, G., Bono, G., Monelli, M., et al. 2015, ApJL, 798, L12
- Frebel & Norris (2015) Frebel, A., & Norris, J. E. 2015, ARAA, 53, 631
- Garrison-Kimmel et al. (2014) Garrison-Kimmel, S., Boylan-Kolchin, M., Bullock, J. S., & Lee, K. 2014, MNRAS, 438, 2578
- Gibbons et al. (2014) Gibbons, S. L. J., Belokurov, V., & Evans, N. W. 2014, MNRAS, 445, 3788
- Gilbert et al. (2012) Gilbert, K. M., Guhathakurta, P., Beaton, R. L., et al. 2012, ApJ, 760, 76
- Guo & White (2008) Guo, Q., & White, S. D. M. 2008, MNRAS, 384, 2
- Guo et al. (2010) Guo, Q., White, S., Li, C., & Boylan-Kolchin, M. 2010, MNRAS, 404, 1111
- Hammer et al. (2007) Hammer, F., Puech, M., Chemin, L., Flores, H., & Lehnert, M. D. 2007, ApJ, 662, 322
- Harmsen et al. (2016) Harmsen, B., Monachesi, A., Bell, E. F., et al. 2016, arXiv:1611.05448
- Ibata et al. (2014) Ibata, R. A., Lewis, G. F., McConnachie, A. W., et al. 2014, ApJ, 780, 128
- Johnston et al. (2008) Johnston, K. V., Bullock, J. S., Sharma, S., et al. 2008, ApJ, 689, 936
- Ludlow et al. (2013) Ludlow, A. D., Navarro, J. F., Boylan-Kolchin, M., et al. 2013, MNRAS, 432, 1103
- Merritt et al. (2016) Merritt, A., van Dokkum, P., Abraham, R., & Zhang, J. 2016, ApJ, 830, 62
- Monachesi et al. (2016) Monachesi, A., Bell, E. F., Radburn-Smith, D. J., et al. 2016, MNRAS, 457, 1419
- Moster et al. (2010) Moster, B. P., Somerville, R. S., Maulbetsch, C., et al. 2010, ApJ, 710, 903
- Navarro et al. (1997) Navarro, J. F., Frenk, C. S., & White, S. D. M. 1997, ApJ, 490, 493
- Peñarrubia et al. (2016) Peñarrubia, J., Gómez, F. A., Besla, G., Erkal, D., & Ma, Y.-Z. 2016, MNRAS, 456, L54
- Pillepich et al. (2014) Pillepich, A., Vogelsberger, M., Deason, A., et al. 2014, MNRAS, 444, 237
- Purcell et al. (2007) Purcell, C. W., Bullock, J. S., & Zentner, A. R. 2007, ApJ, 666, 20
- Rashkov et al. (2013) Rashkov, V., Pillepich, A., Deason, A. J., et al. 2013, ApJL, 773, L32
- Rodriguez-Gomez et al. (2016) Rodriguez-Gomez, V., Pillepich, A., Sales, L. V., et al. 2016, MNRAS, 458, 2371
- Searle & Zinn (1978) Searle, L., & Zinn, R. 1978, ApJ, 225, 357
- Sesar et al. (2011) Sesar, B., Jurić, M., & Ivezić, Ž. 2011, ApJ, 731, 4
- Sheffield et al. (2012) Sheffield, A. A., Majewski, S. R., Johnston, K. V., et al. 2012, ApJ, 761, 161
- Slater et al. (2016) Slater, C. T., Nidever, D. L., Munn, J. A., Bell, E. F., & Majewski, S. R. 2016, ApJ, 832, 206
- Syer & White (1998) Syer, D., & White, S. D. M. 1998, MNRAS, 293, 337
- Toloba et al. (2016) Toloba, E., Sand, D., Guhathakurta, P., et al. 2016, ApJL, 830, L21
- Tolstoy et al. (2009) Tolstoy, E., Hill, V., & Tosi, M. 2009, ARAA, 47, 371
- White & Frenk (1991) White, S. D. M., & Frenk, C. S. 1991, ApJ, 379, 52