An ALMA survey of DCN/H13CN and DCO+/H13CO+ in protoplanetary disks
Abstract
The deuterium enrichment of molecules is sensitive to their formation environment. Constraining patterns of deuterium chemistry in protoplanetary disks is therefore useful for probing how material is inherited or reprocessed throughout the stages of star and planet formation. We present ALMA observations at resolution of DCO+, H13CO+, DCN, and H13CN in the full disks around T Tauri stars AS 209 and IM Lup, in the transition disks around T Tauri stars V4046 Sgr and LkCa 15, and in the full disks around Herbig Ae stars MWC 480 and HD 163296. We also present ALMA observations of HCN in the IM Lup disk. DCN, DCO+, and H13CO+ are detected in all disks, and H13CN in all but the IM Lup disk. We find efficient deuterium fractionation for the sample, with estimates of disk-averaged DCO+/HCO+ and DCN/HCN abundance ratios ranging from 0.02–0.06 and 0.005–0.08, respectively, which is comparable to values reported for other interstellar environments. The relative distributions of DCN and DCO+ vary between disks, suggesting that multiple formation pathways may be needed to explain the diverse emission morphologies. In addition, gaps and rings observed in both H13CO+ and DCO+ emission provide new evidence that DCO+ bears a complex relationship with the location of the midplane CO snowline.
1 Introduction
Beyond the Solar System, a rich chemistry has been observed in molecular clouds (e.g. Nummelin et al. 1998; Schilke et al. 2001), around protostars (e.g. Bisschop et al. 2008; Öberg et al. 2014; Jørgensen et al. 2016), and increasingly in protoplanetary disks (Öberg et al. 2015b; Walsh et al. 2016). The chemical connection between these interstellar environments and the Solar System is not yet fully understood. Models indicate that some species, such as water, remain intact from the parent molecular cloud throughout the process of planetary system formation, while other molecules, such as methanol, may initially be destroyed at the protoplanetary disk stage and then re-form (e.g. Visser et al. 2009; Furuya & Aikawa 2014; Cleeves et al. 2014b). These predictions can now be tested more easily through ALMA observations and measurements from space-based missions.
Observations of deuterated and non-deuterated isotopologues of molecules are often used to probe the interstellar medium and the Solar System because the sensitivity of their relative abundances to their physical environment facilitates inferences about whether the molecules underwent chemical reprocessing at a given evolutionary stage (e.g. Meier et al. 1998; Roueff et al. 2007; Qi et al. 2008). In the interstellar medium (ISM) of the Milky Way, the elemental ratio of deuterium to hydrogen (the D/H ratio) varies from – (e.g. Wood et al. 2004; Sonneborn et al. 2000; Prodanović et al. 2010). In contrast, molecular D/H ratios have been observed to be several orders of magnitude greater for a number of species (e.g. Watson 1976; Walmsley et al. 1987; Jacq et al. 1993; van Dishoeck et al. 1995; Ceccarelli et al. 2001; Caselli et al. 2003). This enhancement, known as deuterium fractionation, is favored at low temperatures because of the lower zero-point energies of the deuterated forms of the molecular ions that initiate the formation pathways of many ISM molecules (Dalgarno & Lepp 1984).
Deuterium fractionation starts from a limited number of exchange reactions, such as (Millar et al. 1989):
| (1a) | ||||
| (1b) | ||||
| (1c) | ||||
The zero-point energy of H2D+ is lower than that of H by K. (Ramanlal et al. 2003), while the zero-point energy of CH2D+ is lower than that of CH by to 1200 K (Roueff et al. 2013). (Note that while there is also a zero-point energy difference between HD and H2, the differences for the molecular ions are large enough such that the overall reactions are still exothermic.) H2D+ becomes abundant below 30 K, both because of the increased difficulty of overcoming the energy barrier to re-form H from H2D+ (230 K) and because of the freezeout of molecules that can destroy H2D+ (e.g. Pagani et al. 1992; Roberts & Millar 2000). Because of the relatively high abundance of H, H2D+ is the dominant deuteron donor below 30 K (Roberts & Millar 2000). However, reactions 1b and 1c are more exothermic than reaction 1a, with ranging from 480 to 660 K for 1b (Roueff et al. 2013) and K for 1c (Herbst et al. 1987). Hence, CH2D+ and C2HD+ survive more easily in warmer gas compared to H2D+, but the reverse reactions for 1b and 1c occur readily above 80 K, so CH2D+ and C2HD+ dominate over H2D+ between 30 and 80 K (Roberts & Millar 2000).
Because of their relatively high abundances and accessible rotational transitions, DCO+ and DCN are among the primary tracers of deuterium chemistry in the interstellar medium (e.g. Roueff et al. 2007; Öberg et al. 2012; Gerner et al. 2015). Detailed discussions of their formation pathways are provided in Watson (1976), Millar et al. (1989), Aikawa & Herbst (2001), Willacy (2007), and Ceccarelli et al. (2014). We provide a brief overview of significant reactions below.
DCO+ is thought to form in the gas phase, primarily via
| (2) |
This formation pathway is analogous to the primary one for HCO+ (Dalgarno & Lepp 1984):
| (3) |
Like H2D+, DCO+ would only be expected to be abundant below 30 K (Millar et al. 1989).
Compared to DCO+ and HCO+, DCN and HCN have more complex formation pathways in the interstellar medium. The disk models presented in Furuya & Aikawa (2014), Aikawa et al. (2015), and Öberg et al. (2015a) predict that the major HCN formation mechanisms proceed in the gas phase through small hydrocarbons or their cations:
| (4a) | ||||
| (4b) | ||||
and
| (5a) | ||||
| (5b) | ||||
and
| (6a) | ||||
| (6b) | ||||
The roles of these pathways in interstellar HCN formation were previously described in Mitchell 1984 and Herbst et al. 2000. Based on laboratory experiments, hydrogenation on grains has also been proposed as an HCN formation pathway in the interstellar medium (Borget et al. 2016), but assessing the degree to which such a mechanism would influence HCN abundances in disks would require additional chemical modeling.
| (7a) | ||||
| (7b) | ||||
| (7c) | ||||
and
| (8a) | ||||
| (8b) | ||||
CHD may also react with O to form DCO, which then undergoes substitution with N to form DCN. Because DCN production is largely initiated by CH2D+ rather than H2D+, DCN is expected to peak in abundance at higher gas temperatures than DCO+ (e.g. Millar et al. 1989; Aikawa & Herbst 1999b).
The models discussed so far suggest that in situ disk fractionation chemistry sets the molecular abundance profile, especially for DCO+. Consequently, due to the different temperature dependences of the primary DCN and DCO+ formation pathways, the two molecules are presumed to trace different regions of protoplanetary disks. The vertical structure of a protoplanetary disk consists of a cold midplane in which volatile species freeze out onto dust grains, a warm molecular layer above the midplane, and a surface layer in which high UV radiation leads to photodissociation of molecules (Aikawa & Herbst 1999b; Aikawa et al. 2002). As a result, disk models typically predict that DCO+ exists mostly near the cold midplane of the outer disk, while DCN peaks in abundance in the warmer interior regions (e.g. Aikawa & Herbst 1999a, 2001; Willacy 2007).
This picture of spatially differentiated DCN and DCO+ distributions in disks is qualitatively consistent with observations of DCN and DCO+ in the TW Hya and HD 163296 disks, the only protoplanetary disks in which sufficiently resolved observations have previously been published for both molecules (Qi et al. 2008; Öberg et al. 2012; Yen et al. 2016). Models suggest, though, that such distributions are not necessarily universal in disks. Based on recent upward revisions of the exothermicity for reaction 1b, which indicate that CH2D+ may be abundant up to gas temperatures of 300 K (Roueff et al. 2013), Favre et al. (2015) proposed that the primary formation mechanisms for DCO+ in disks could instead be
| (9) |
and
| (10) |
where CH4D+ is derived from CH2D+. DCO+ would then no longer be limited to the cold outer disk midplane, and could instead be abundant in the inner disk. Another reaction that could produce DCO+ in the warm inner disk is (Adams & Smith 1985):
| (11) |
Furthermore, the following two pathways have been proposed for DCN production in cold gas (Willacy 2007):
| (12a) | ||||
| (12b) | ||||
| (12c) | ||||
and
| (13a) | ||||
| (13b) | ||||
where D formation is initiated by H2D+. If these alternative pathways are active in disks, the distributions of DCN and DCO+ may not always show the differentiation that has been observed in the TW Hya and HD 163296 disks.
Another motivation for examining deuterium fractionation in a range of disk types is that most theoretical studies of protoplanetary disk chemistry have been based on models of full T Tauri disks (e.g. Aikawa & Herbst 1999a; Willacy 2007; Walsh et al. 2010; Furuya & Aikawa 2014). More theoretical attention has recently been paid to the chemistry of transition disks and disks around Herbig Ae stars, but has not yet directly addressed deuterium fractionation (Jonkheid et al. 2007; Cleeves et al. 2011; Bruderer 2013; Walsh et al. 2015). The radiation fields and temperature structures of transition disks and Herbig Ae disks may lead to substantially different chemistry; the presence of a gap in a transition disk increases the exposure of the outer disk midplane to radiation from the central star (e.g. Cleeves et al. 2011), while Herbig Ae stars have higher UV fluxes, lower X-ray fluxes, and warmer disks than T Tauri stars (e.g. Schreyer et al. 2008; Panić & Hogerheijde 2009). Herbig Ae and T Tauri stars may also have differing wind levels, which can affect cosmic-ray ionization and accretion in disks (e.g. Bai & Stone 2013; Cauley & Johns-Krull 2014; Cleeves et al. 2014a). Thus, it is useful to examine the generalizability of existing disk models by seeking observational constraints on how the abundance profiles of deuterated molecules may be linked to spectral type and overall disk morphology.
To explore the distribution patterns of DCN and DCO+ in protoplanetary disks, we used the Atacama Large Millimeter/submillimeter Array to observe the lines of DCO+, DCN, H13CO+, and H13CN at sub-arcsecond spatial resolution in a diverse sample of six disks. We describe the sample selection in Section 2 and the observations and data reduction in Section 3. Results are presented in Section 4. The chemical and physical implications of the observations are discussed in Section 5. A summary is presented in Section 6.
| Source | R.A. | Decl. | Sp. | Age | Dist. | Ref. | ||||
|---|---|---|---|---|---|---|---|---|---|---|
| (J2000) | (J2000) | Type | () | (Myr) | () | ( yr-1) | (K) | (pc) | ||
| AS 209 | 16 49 15.30 | -14 22 08.6 | K5 | 1.5 | 1.6 | 0.9 | 51 | 4250 | 126 | 1–4 |
| IM Lup | 15 56 09.18 | -37 56 06.1 | M0 | 0.93 | 1 | 1.0 | 0.01 | 3850 | 161aaIM Lup values for and age (Galli et al. 2015), (Pinte et al. 2008), and (Günther et al. 2010) were derived using an older distance estimate of 190 pc. | 4–7 |
| V4046 Sgr | 18 14 10.47 | -32 47 34.5 | K5, K7 | 0.49, 0.33 | 24 | 1.75bbStellar mass listed is the sum of the binary masses | 0.5 | 4370 | 72 | 8–12 |
| LkCa 15 | 04 39 17.80 | +22 21 03.5 | K3 | 0.74 | 3–5 | 0.97 | 1.3 | 4730 | 140 | 3, 4, 13, 14 |
| MWC 480 | 04 58 46.27 | +29 50 37.0 | A4 | 11.5 | 7 | 1.65 | 126 | 8250 | 142 | 14–17 |
| HD 163296 | 17 56 21.29 | -21 57 21.9 | A1 | 30 | 4 | 2.25 | 69 | 9250 | 122 | 16–18 |
References. — (1) Herbig & Bell (1988), (2) Andrews et al. (2009), (3) Najita et al. (2015), (4) Gaia Collaboration et al. (2016), (5) Galli et al. (2015), (6) Pinte et al. (2008), (7) Günther et al. (2010), (8) Quast et al. (2000), (9) Rosenfeld et al. (2012), (10) Bell et al. (2015), (11) Donati et al. (2011), (12) Torres et al. (2006), (13) Espaillat et al. (2010), (14) Simon et al. (2000), (15) Kenyon et al. (1994), (16) Donehew & Brittain (2011), (17) Montesinos et al. (2009), (18) van den Ancker et al. (1998)
| Source | Disk Type | Disk Incl.aaDisk geometry derived from modeling millimeter/sub-millimeter CO emission | Disk P.A.aaDisk geometry derived from modeling millimeter/sub-millimeter CO emission | Disk MassbbDisk masses derived from dust continuum observations except for V4046 Sgr, which is derived from 12CO observations. All quoted estimates assume the ISM gas-to-dust ratio of 100:1. | Systemic vel. | Ref. | |
|---|---|---|---|---|---|---|---|
| (deg.) | (deg.) | () | (AU) | (km s-1) | |||
| AS 209 | T Tauri full | 38 | 86 | 0.015 | 340 | 4.6 | 1, 2, 3, 4 |
| IM Lup | T Tauri full | 50 | 144.5 | 0.17 | 970 | 4.4 | 5, 6 |
| V4046 Sgr | T Tauri transition | 33.5 | 76 | 0.028 | 365 | 2.9 | 7 |
| LkCa 15 | T Tauri transition | 52 | 60ccThe tabulated position angle (P.A.) values differ from those given in Piétu et al. 2007, which defines P.A. in terms of the rotation axis. We converted these values using the convention that P.A. is the angle east of north made by the disk semi-major axis. | 0.05–0.1 | 900 | 6.3 | 8, 9 |
| MWC 480 | Herbig Ae full | 37 | 148ccThe tabulated position angle (P.A.) values differ from those given in Piétu et al. 2007, which defines P.A. in terms of the rotation axis. We converted these values using the convention that P.A. is the angle east of north made by the disk semi-major axis. | 0.11 | 460 | 5.1 | 3, 8, 10 |
| HD 163296 | Herbig Ae full | 48.5 | 132 | 0.17 | 540 | 5.8 | 11, 12 |
References. — (1) Andrews et al. (2009), (2) Tazzari et al. (2016), (3) Öberg et al. (2011b), (4) Huang et al. (2016), (5) Cleeves et al. (2016), (6) Panić et al. (2009), (7) Rosenfeld et al. (2012), (8) Piétu et al. (2007), (9) Isella et al. (2012), (10) Chiang et al. (2001), (11) Flaherty et al. (2015), (12) Isella et al. (2007)
2 Sample Selection and Characteristics
The sample, chosen to span a range of spectral types and disk morphologies, consists of two T Tauri stars with full disks (AS 209 and IM Lup), two T Tauri stars with transition disks (V4046 Sgr and LkCa 15), and two Herbig Ae stars with full disks (MWC 480 and HD 163296). To enable comparisons between the distributions of DCN and DCO+, the targets were mainly chosen from disks in which DCO+ had previously been observed in DISCS: The Disk Imaging Survey of Chemistry with the Submillimeter Array (Öberg et al. 2010, 2011b). The typical spatial resolution of the previous observations was on the order of several arcseconds, compared to in this work. The angular resolution of translates to physical scales of – AU for most of the targets, which corresponds to the scales at which previous observations and disk chemistry models indicate that their emission substructures could be resolved (e.g. Aikawa et al. 2002; Willacy 2007; Qi et al. 2008; Öberg et al. 2012; Mathews et al. 2013). DCO+ was not detected in the MWC 480 disk in DISCS, but this disk was selected as a target for the ALMA survey because it is considered a “benchmark” Herbig Ae disk (e.g. Mannings & Sargent 1997; Piétu et al. 2007; Grady et al. 2010). The HD 163296 disk was also included in the survey as the only Herbig Ae disk in which DCO+ had previously been detected (Mathews et al. 2013). Of the sources in the survey, DCN has only previously been detected in the LkCa 15 and HD 163296 disks (Qi 2001; Yen et al. 2016). Öberg et al. (2010) and Öberg et al. (2011b) reported non-detections of DCN for the other targets.
3 Observations and Data Reduction
3.1 Observational Setup
| Transition | Frequency | ||
|---|---|---|---|
| (GHz) | (K) | (D2) | |
| DCO+ | 216.11258 | 20.74 | 45.62 |
| DCN | 217.23853 | 20.85 | 80.50 |
| H13CN | 259.01180 | 24.86 | 80.20 |
| H13CO+ | 260.25534 | 24.98 | 45.62 |
| HCN | 265.88643 | 25.52 | 80.20 |
We observed the lines of DCO+, DCN, H13CO+, and H13CN, which have upper energy levels of to 25 K, comparable to the gas temperatures at which DCN and DCO+ are expected to be abundant. H13CN and H13CO+ were targeted rather than the main isotopologues because the corresponding transitions of the latter are expected to be optically thick in disks (Thi et al. 2004). The properties of the targeted transitions, taken from the Cologne Database for Molecular Spectroscopy (Müller et al. 2001, 2005), are summarized in Table 3.
The six disks were observed during ALMA Cycle 2 (project code https://almascience.nrao.edu/aq/?project_code=2013.1.00226.S (catalog ADS/JAO.ALMA#2013.1.00226.S)) in two Band 6 spectral settings. The array configuration and calibrators for each observation are described in Table 4. The 1.1 mm setting, which targeted H13CN and H13CO+ , was configured with 14 spectral windows (SPWs). The 1.4 mm setting, which targeted DCN and DCO+ , was configured with 13 SPWs. Details of the spectral setups are listed in Tables 8 and 9. Because narrow spectral windows were needed to achieve high spectral resolution for the targeted lines, each observation used the bandwidth-switching mode, in which calibrators were observed in wider spectral windows in order to improve the signal-to-noise ratio. For observations spanning multiple execution blocks, the individual blocks were first imaged separately to check for consistency. 111The DCO+ and DCN lines for the MWC 480 and LkCa 15 disks were also observed for three minutes each on 2015 July 25, but these observations were not combined with the other two 12 minute execution blocks because of the poorer signal-to-noise ratio and coverage. An additional execution block was also originally delivered for the 1.4 mm setting of HD 163296, but the ALMA helpdesk subsequently advised excluding it from analysis due to poor weather.
| Source | Date | Setting | Antennas | Baselines | On source | Bandpass | Phase | Flux |
|---|---|---|---|---|---|---|---|---|
| (m) | int. (min) | Cal. | Cal. | Cal. | ||||
| Cycle 2 Observations | ||||||||
| AS 209 | 2014 July 17 | 1.1 mm | 32 | 20–650 | 21 | J1733-1304 | J1733-1304 | Titan |
| 2014 July 2 | 1.4 mm | 34 | 20–650 | 21 | J1733-1304 | J1733-1304 | Titan | |
| IM Lup | 2014 July 17 | 1.1 mm | 32 | 20–650 | 21 | J1427-4206 | J1534-3526 | Titan |
| 2014 July 6 | 1.4 mm | 31 | 20–650 | 21 | J1427-4206 | J1534-3526 | Titan | |
| V4046 Sgr | 2015 May 13 | 1.1 mm | 36 | 21–558 | 21 | J1924-2914 | J1826-2924 | Titan |
| 2014 June 9 | 1.4 mm | 33 | 20–646 | 21 | J1924-2914 | J1802-3940 | J1924-2914 | |
| LkCa 15/MWC 480aaLkCa 15 and MWC 480 were observed in the same scheduling blocks. | 2014 June 15 | 1.1 mm | 33 | 20–650 | 21 | J0510+1800 | J0510+1800 | J0510+1800 |
| 2014 July 29 | 1.4 mm | 31 | 24–820 | 12 | J0510+1800 | J0510+1800 | J0510+1800 | |
| 2015 June 6 | 1.4 mm | 37 | 21–784 | 12 | J0510+1800 | J0510+1800 | J0510+1800 | |
| HD 163296 | 2014 July 16 | 1.1 mm | 32 | 34–650 | 13 | J1733-1304 | J1733-1304 | J1733-1304 |
| 2015 May 13 | 1.1 mm | 36 | 21–558 | 21 | J1733-1304 | J1733-1304 | Titan | |
| 2014 July 2 | 1.4 mm | 34 | 20–650 | 21 | J1733-1304 | J1733-1304 | J1733-1304 | |
| 2015 May 13 | 1.4 mm | 36 | 21–558 | 13 | J1733-1304 | J1733-1304 | Titan | |
| Cycle 3 Observations | ||||||||
| IM Lup | 2016 May 1 | 1.1 mmbbThese observations were also at 1.1 mm, but the spectral setup differs from the Cycle 2 observations and is described in more detail in Appendix A. | 41 | 15–630 | 12 | J1517-2422 | J1610-3958 | Titan |
Because H13CN was not detected in the IM Lup disk, we also present observations of HCN from ALMA Cycle 3 (project code https://almascience.nrao.edu/aq/?project_code=2015.1.00964.S (catalog ADS/JAO.ALMA#2015.1.00964.S. )). Details of the array configurations and spectral setup are provided in Tables 4 and 10.
Images from an earlier reduction of the IM Lup DCO+ and H13CO+ observations were first published in Öberg et al. (2015a) as part of their analysis of CO ice desorption in the outer disk. Earlier reductions of the H13CN data for MWC 480 were first presented in Öberg et al. (2015b) in an analysis of cyanide abundances. These data are presented again in this work in conjunction with new data for a consistent analysis of deuterium fractionation for the full sample. The H13CN data for all six disks are also discussed further in an analysis of 14N/15N fractionation in Guzmán et al. (2017).
The spectral setups with multiple narrow windows were configured to search for other lines in addition to the four targeted for the deuterium survey. Because those searches are outside the scope of the present survey, they will be discussed in separate publications. In addition to the papers mentioned above, results from the secondary line searches have also been presented in Huang & Öberg (2015), Huang et al. (2016), and Cleeves et al. (2016).
3.2 Data Reduction
Initial flux, phase, and bandpass calibrations of the data were performed by ALMA/NAASC staff. The Butler-JPL-Horizons 2012 model was used for Titan, the flux calibrator for about half the observations. The quasar flux calibration models for the other observations, as well as modifications of the models specified in the scripts provided by ALMA/NAASC, are described in Table 11. In addition, the calibration scripts were modified for the 1.1 and 1.4 mm settings of AS 209, 1.4 mm setting of V4046 Sgr, 1.1 mm setting of IM Lup, and 1.1 and 1.4 mm settings of HD 163296 to scale visibility weights properly222See https://casaguides.nrao.edu/index.php/DataWeightsAndCombination and executed in CASA 4.4.0 to re-calibrate the visibilities.
Subsequent data reduction and imaging were also completed with CASA 4.4.0 for the Cycle 2 data and CASA 4.5.3 for the Cycle 3 data. For each disk, the 258 GHz continuum was phase self-calibrated by obtaining solutions from combining the line-free portions of the spectral windows in the upper sideband of the 1.1 mm setting. The continuum was then imaged by CLEANing with a Briggs robust weighting parameter of 0.5. The self-calibration tables produced from the 258 GHz continuum data were then applied to the SPWs covering the H13CN and H13CO+ lines. Likewise, phase self-calibration of the SPWs covering the DCN and DCO+ lines was performed using solutions obtained from combining the line-free portions of the SPWs in the lower sideband of the 1.4 mm setting and phase self-calibration of the IM Lup HCN data was performed using solutions from combining the line-free portions of the upper sideband SPWs.
| Source | aaUncertainties do not include 15% systematic flux uncertainties | Peak flux densityaaUncertainties do not include 15% systematic flux uncertainties | Beam (PA) | Detected Radius |
|---|---|---|---|---|
| (mJy) | (mJy beam-1) | (AU) | ||
| AS 209 | 350.71.4 | 87.80.2 | 190 | |
| IM Lup | 2762 | 72.70.2 | 310 | |
| V4046 Sgr | 422.61.2 | 64.80.2 | 0 | 110 |
| LkCa 15 | 39.00.2 | 200 | ||
| MWC 480 | 195.50.3 | 200 | ||
| HD 163296 | 203.50.3 | 260 |
As a preliminary step for choosing CLEAN and spectral extraction masks for the lines, the radius of the millimeter dust disk was estimated by using the Python package scikit-image (van der Walt et al. 2014) to fit ellipses to the 3 contours of the 258 GHz continuum images, where is the rms measured from a signal-free portion of the continuum map. Since the radii, listed in Table 5, are based on the detected extent of the millimeter dust emission, they are not necessarily similar to the often-derived characteristic radius values, which describe the radius at which the surface density transitions between a power-law profile in the inner disk and an exponentially declining profile in the outer disk (Hughes et al. 2008).
The 258 GHz continuum flux densities were obtained by integrating interior to the contour. Continuum fluxes and rms values are listed in Table 5. The statistical uncertainty of the continuum flux for each source was estimated by using the elliptical fit to the contour to measure flux densities at 500 random signal-free positions in a continuum image, then taking the standard deviation of these measurements.
After self-calibration, the continuum was subtracted in the -plane from the SPWs containing the targeted lines. Most lines were imaged and CLEANed down to a 3 threshold at a binned resolution of 0.5 km s-1 using a Briggs parameter of 1.0 and CLEAN masks based on the emission in each channel. Signal-free channels from the image cubes were used to calculate values. SPWs without strong, well-resolved line emission (targeting H13CN and DCN in the MWC 480 and HD 163296 disks, and H13CN in the LkCa 15 disks) were CLEANed with a Briggs parameter of 2.0 for better sensitivity. Since their emitting region is more ambiguous, we used elliptical CLEAN masks based on the position angles and inclinations listed in Table 1 and the millimeter dust disk radii estimates listed in Table 5. For the IM Lup disk, we used elliptical masks based on the extent of the HCN emission.
| Source | Line | Int. | Moment | Chan. | Mask | Int. | Beam (PA) |
|---|---|---|---|---|---|---|---|
| range | zero rms | rms | axis | Flux | |||
| AS 209 | H13CO+ | 1.5–7.5 | 8.2 | 4.2 | 4′′ | ||
| DCO+ | 1.5–7.5 | 10. | 5.1 | 4′′ | |||
| H13CN | 1.5–7.5 | 8.7 | 4.0 | 35 | |||
| DCN | 1.5–7.5 | 11. | 5.4 | 35 | 340 | ||
| IM Lup | H13CO+ | 7.0 | 6.7 | 3.6 | 75 | ||
| DCO+ | 2.0–7.0 | 5.5 | 2.8 | 75 | |||
| H13CN | 1.5–7.5 | 7.1 | 3.6 | 75 | <60aaUpper limit quoted as 3flux density uncertainties | ||
| DCN | 1.5–7.5 | 6.1 | 2.9 | 75 | 9013bbFlux estimated based on HCN emitting region | 0 | |
| HCN | 1.5–7.5 | 11. | 4.8 | 75 | 330070 | ||
| V4046 Sgr | H13CO+ | -1.0–7.0 | 9.1 | 3.4 | 8′′ | 0 | |
| DCO+ | -1.0–7.0 | 6.3 | 2.7 | 8′′ | |||
| H13CN | -3.0–9.0 | 11. | 3.3 | 0 | |||
| DCN | -3.0–9.0 | 8.5 | 2.9 | 5′′ | |||
| LkCa 15 | H13CO+ | 3.0–9.0 | 7.8 | 3.7 | 65 | ||
| DCO+ | 3.0–9.0 | 5.9 | 2.7 | 65 | |||
| H13CN | 3.0–9.0 | 7.6 | 3.7 | 55 | 10030 | ||
| DCN | 3.0–9.0 | 5.9 | 3.0 | 55 | |||
| MWC 480 | H13CO+ | 8.7 | 3.6 | 5′′ | 36030 | ||
| DCO+ | 1.0–9.0 | 6.6 | 2.7 | 5′′ | |||
| H13CN | 1.0–9.0 | 8.7 | 3.6 | 3ccSpectral extraction mask based on extent of millimeter dust emission | |||
| DCN | 1.0–9.0 | 6.5 | 2.8 | 3ccSpectral extraction mask based on extent of millimeter dust emission | |||
| HD 163296 | H13CO+ | 1.011.0 | 7.4 | 2.6 | 85 | ||
| DCO+ | 1.0–11.0 | 8.3 | 2.8 | 85 | |||
| H13CN | 1.0–11.0 | 7.2 | 2.8 | 4ccSpectral extraction mask based on extent of millimeter dust emission | |||
| DCN | 1.0–11.0 | 8.2 | 3.0 | 4ccSpectral extraction mask based on extent of millimeter dust emission |
Note. — Column descriptions: (1) Source name. (2) Molecule corresponding to targeted transition. (3) Velocity range (km s-1) integrated across to measure flux and produce integrated intensity maps. (4) Moment zero map rms (mJy beam-1 km s-1). (5) Channel rms for bin sizes of 0.5 km s-1. (6) Major axes of elliptical spectral extraction masks (7) Integrated flux (mJy km s-1). Uncertainties do not include systematic flux uncertainties. (8) Synthesized beam dimensions.
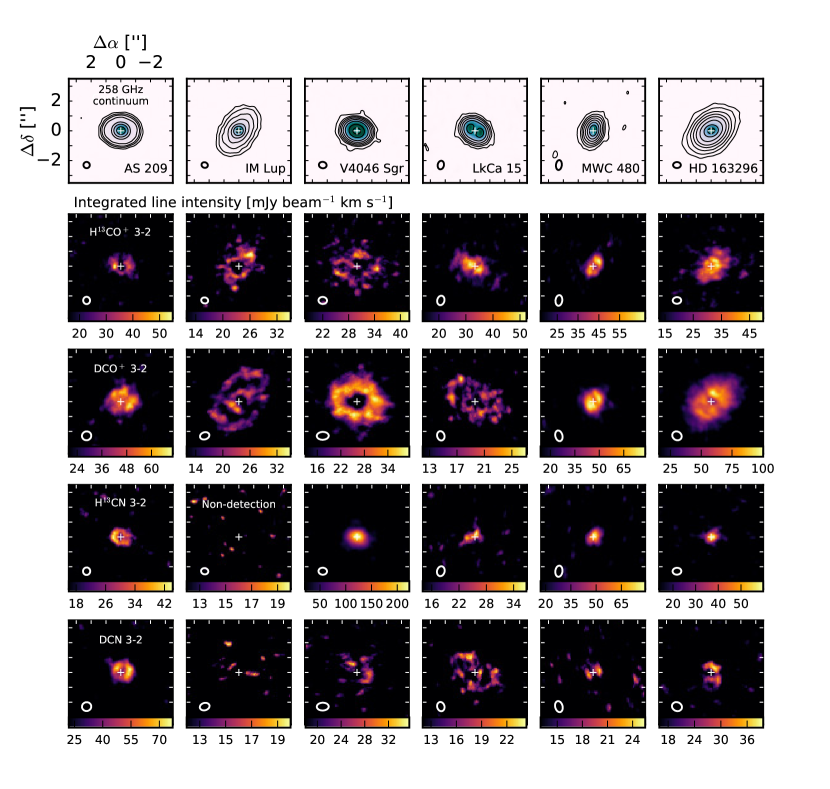
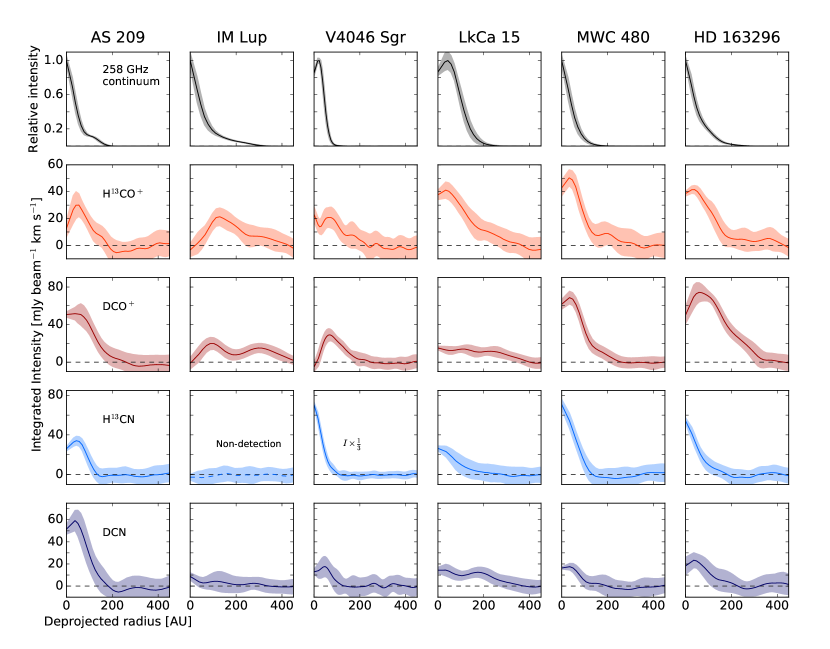
Figure 1 shows integrated intensity maps of H13CO+, DCO+, H13CN, and DCN, with the emission in each channel clipped at the level to better isolate the signal. For most lines, the maps were produced by summing over channels corresponding to where DCO+ emission was detected above the level, since DCO+ was typically the strongest line. These velocity integration ranges are listed in Table 6. The channel maps for the other lines were inspected to check that no emission above the 3 level appeared in the known disk region in channels where DCO+ was not detected. For the V4046 Sgr disk, the integration ranges for H13CN and DCN were based on the H13CN line because the signal-to-noise ratios of the spectra are sufficiently high to confirm that H13CN has a larger linewidth than H13CO+. Figure 2 shows deprojected and azimuthally averaged radial profiles, which were produced from unclipped versions of the integrated intensity maps, assuming the position angles and inclinations listed in Table 1.
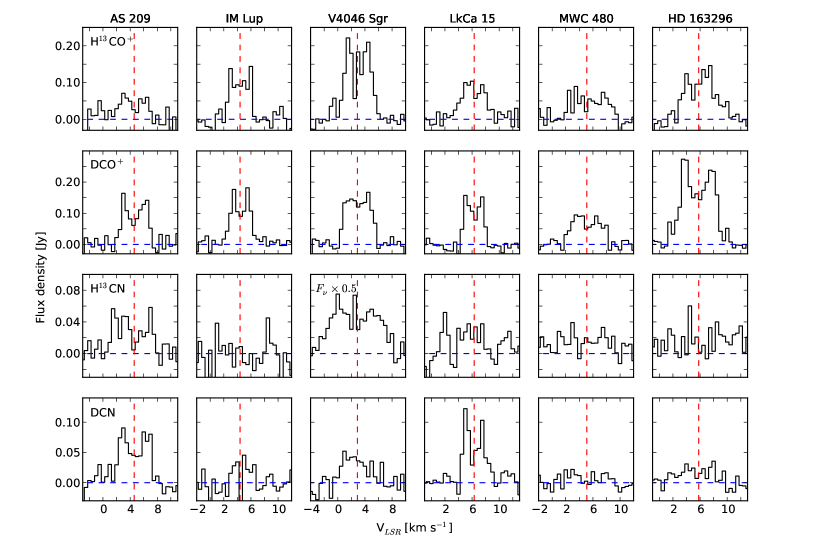
Integrated line fluxes and upper limits were extracted from the image cubes using elliptical regions with centers corresponding to the centroid of the continuum image (measured in scikit-image) and shapes and orientations based on the inclination and position angle reported in the literature for each disk (see Table 1). The major axis of the elliptical region used to measure fluxes for each pair of isotopologue lines in a given disk (see Table 6) is chosen to be sufficient to cover the > line emission appearing in the image cubes. For the pairs of weaker or undetected lines (H13CN and DCN in the MWC 480 and HD 163296 disks) with less well-defined emitting regions, the major axis is instead based on the extent of the millimeter dust disk. Spectra of the four molecules, shown in Figure 3, were extracted from the image cubes with the same elliptical regions used to measure line fluxes. The uncertainties on the integrated line fluxes were estimated in the following manner: first, the elliptical mask used to measure line fluxes in each cube was also used to measure fluxes at random positions in randomly chosen signal-free channels (with replacement) equal in number to the channels spanning the line. The fluxes measured within the mask were summed and then multiplied by the channel width to generate a simulated integrated flux measurement. For each image cube, 500 simulated integrated flux measurements were obtained, and their standard deviation was taken to be the uncertainty in the integrated line flux.
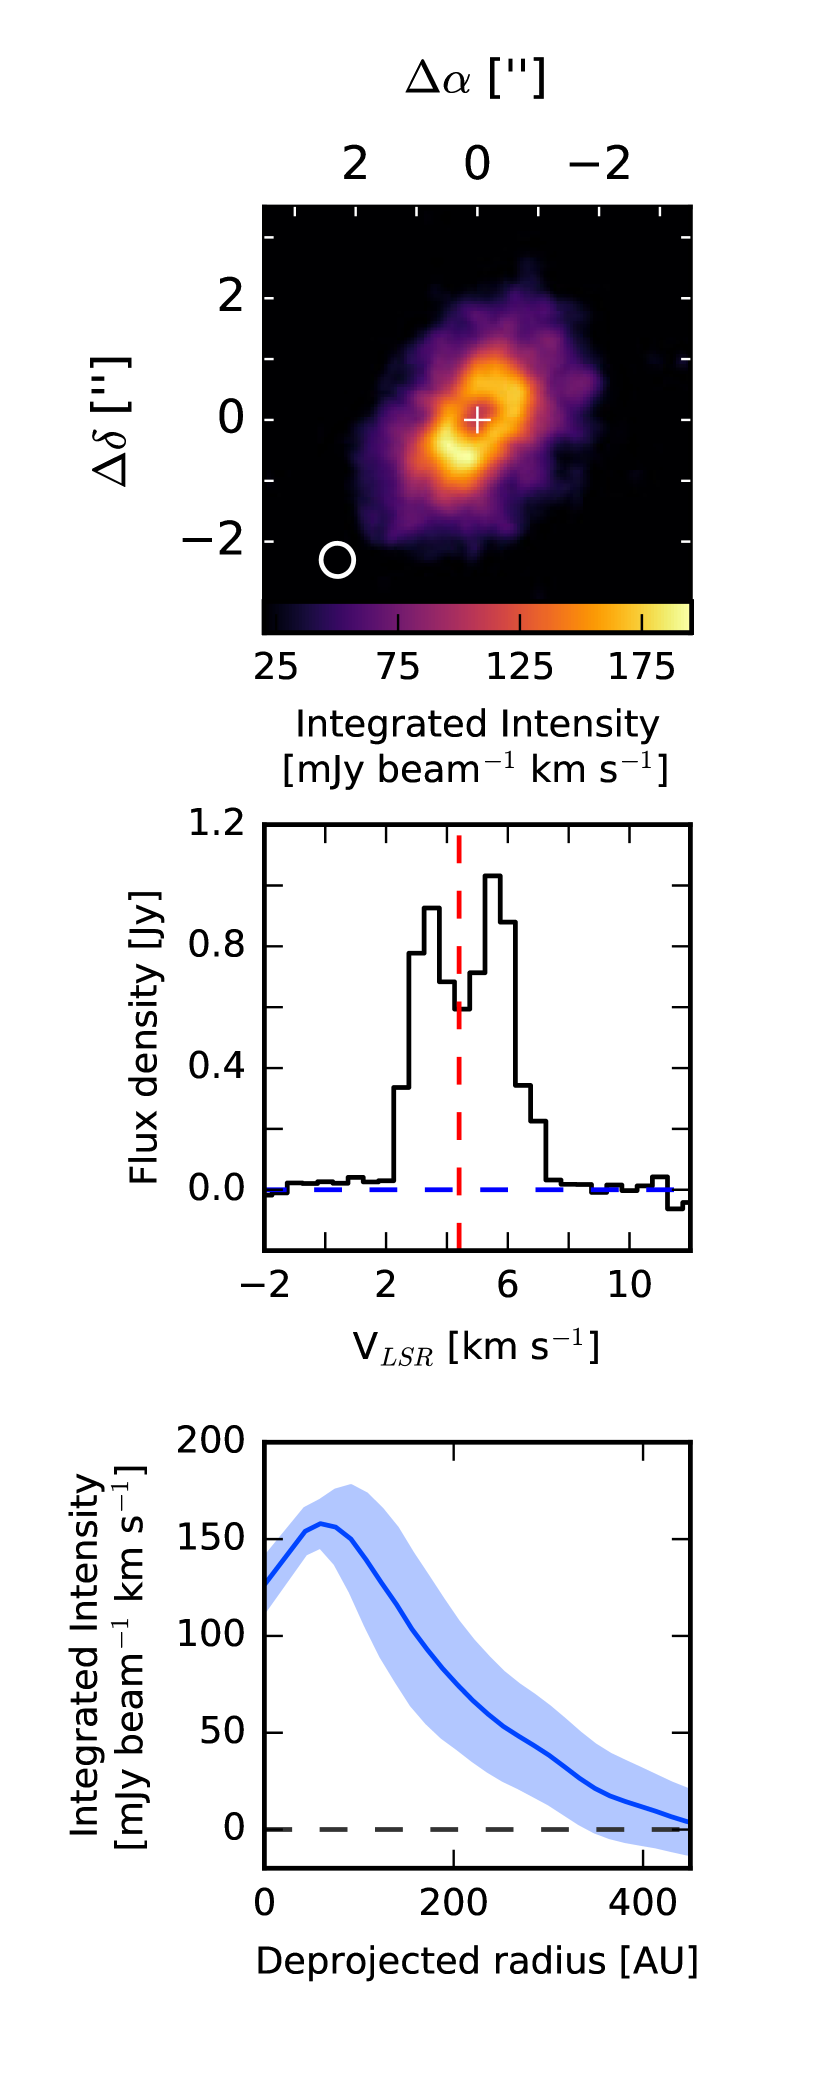
The moment zero map, spectrum, and radial profile of HCN in the IM Lup disk are presented in Figure 4. Because of the high signal-to-noise ratio of these data, we use the >3 emission to set integration ranges and to estimate the emitting region for measuring the fluxes of H13CN and DCN. The uncertainties on the integrated line fluxes using the mask based on the 3 contours of HCN were estimated in a similar manner to that described in the preceding paragraph for the elliptical masks.
4 Results
In this section, we present the line detections, estimate the disk-averaged D/H ratios for each set of isotopologues, and describe the emission morphologies observed.
4.1 Line Detections
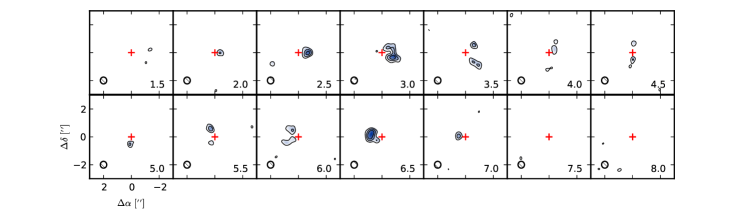
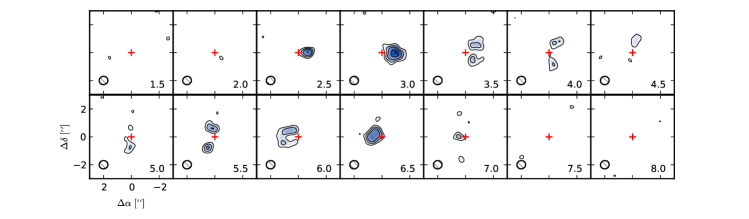
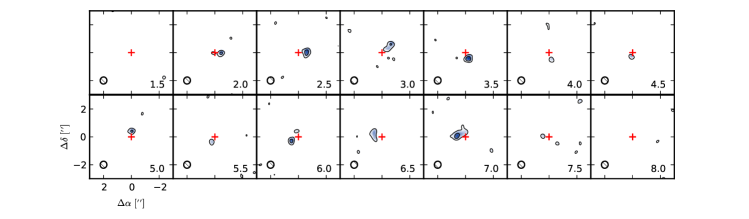
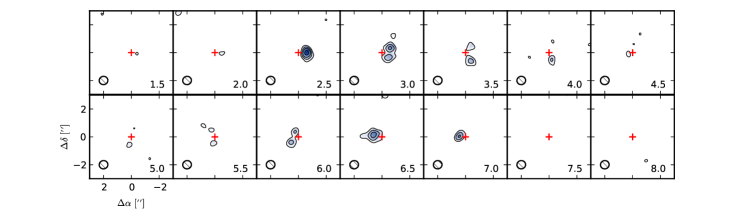
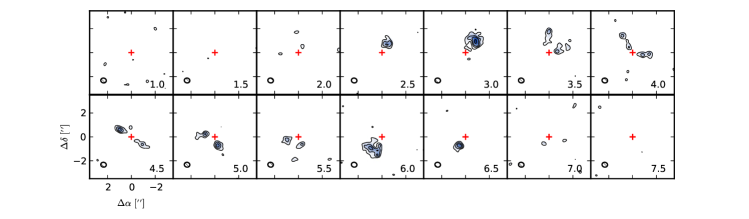
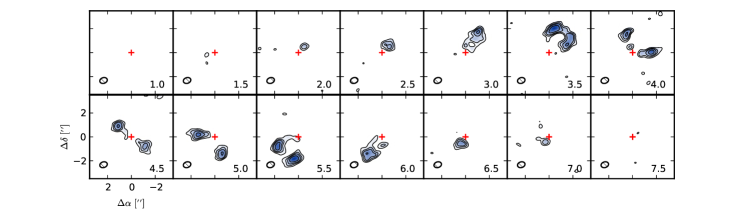
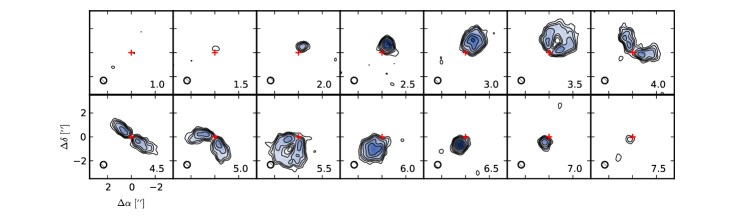
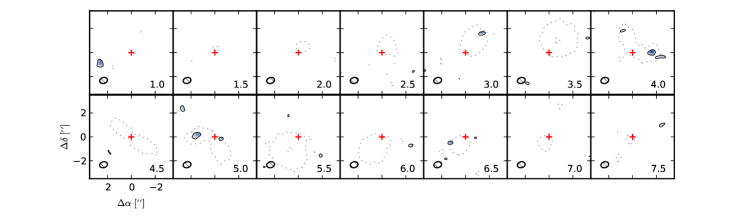
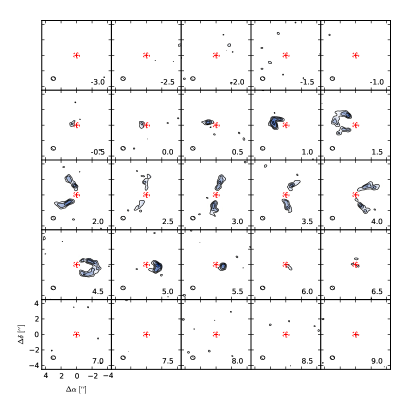
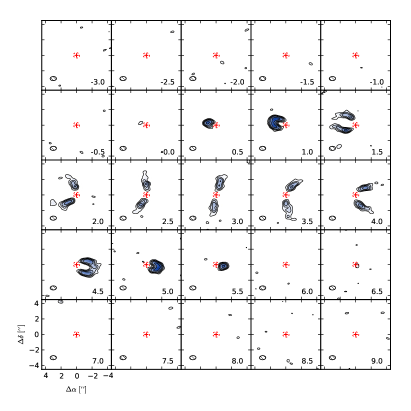
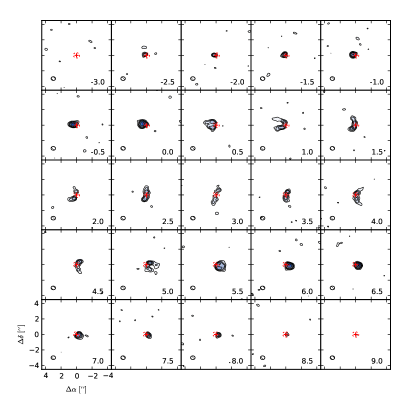
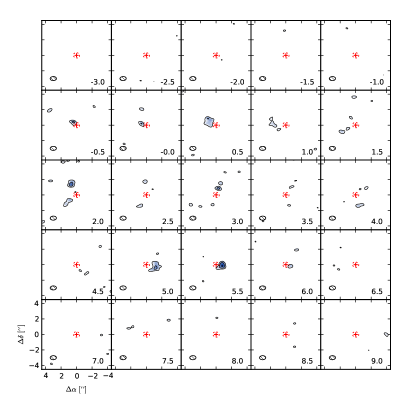
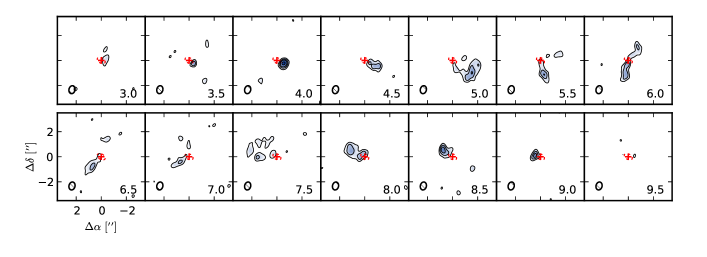
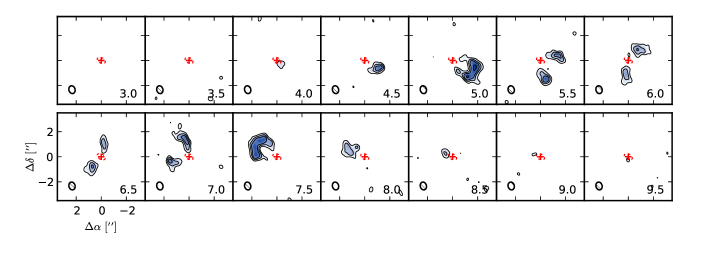
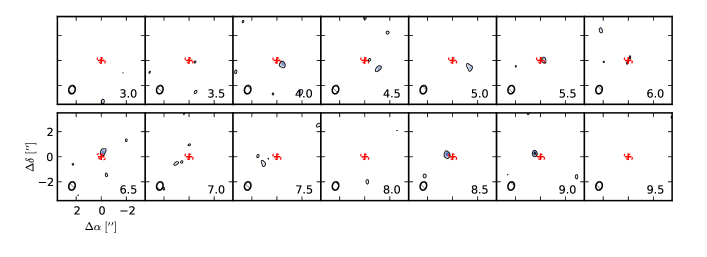
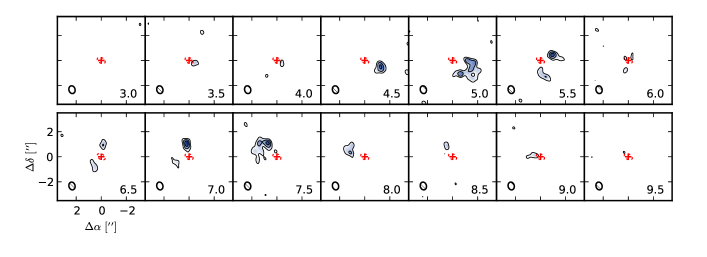
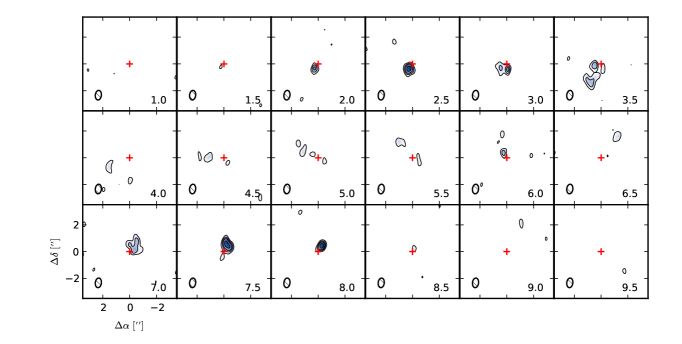
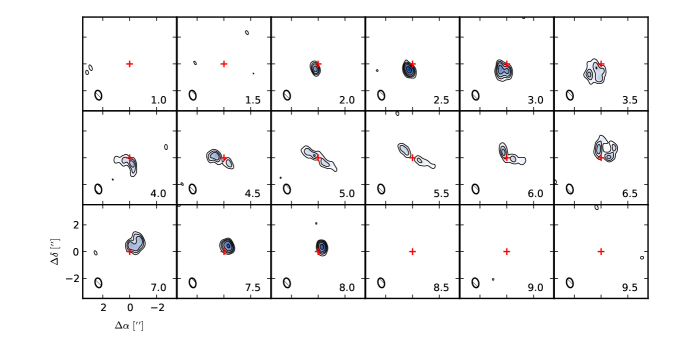
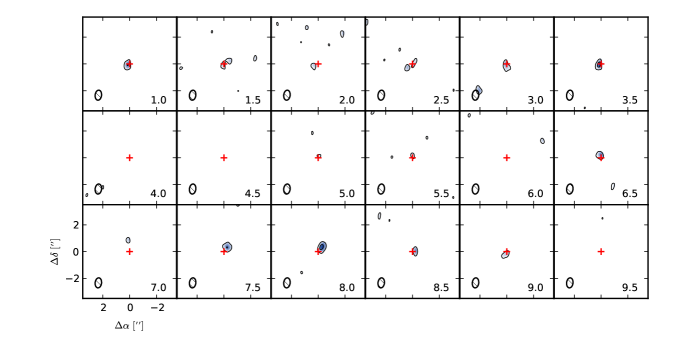
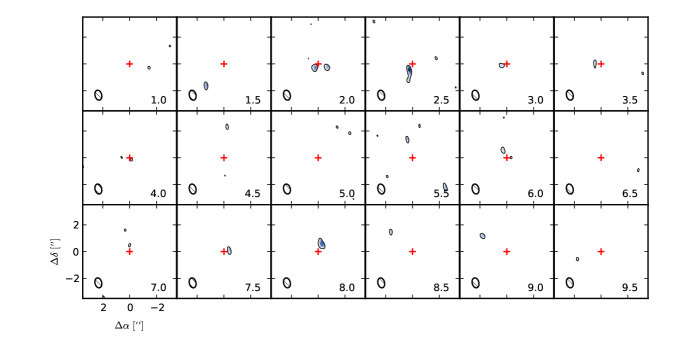
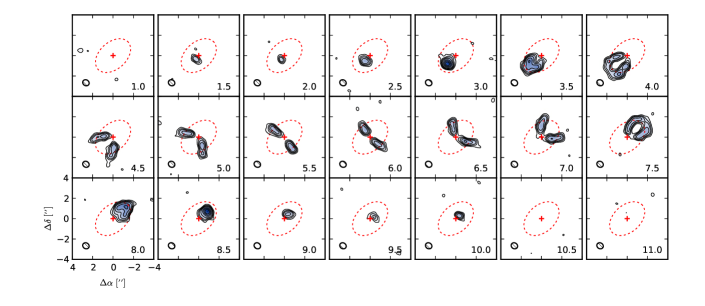
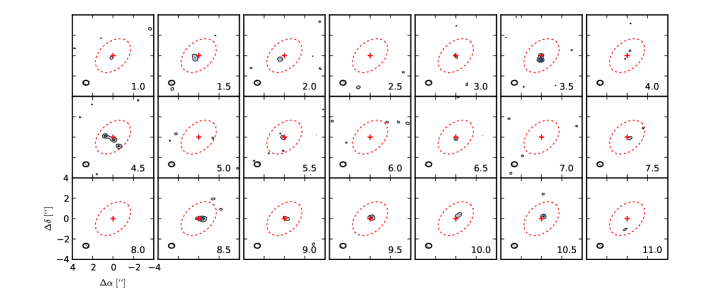
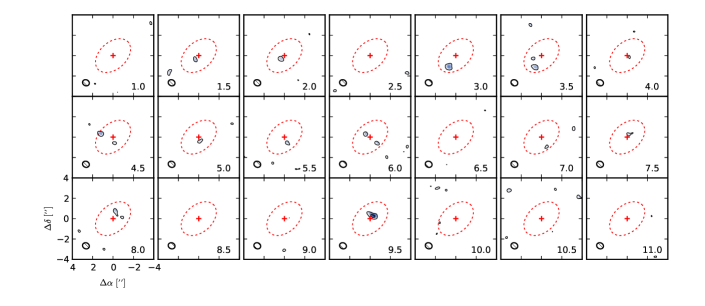
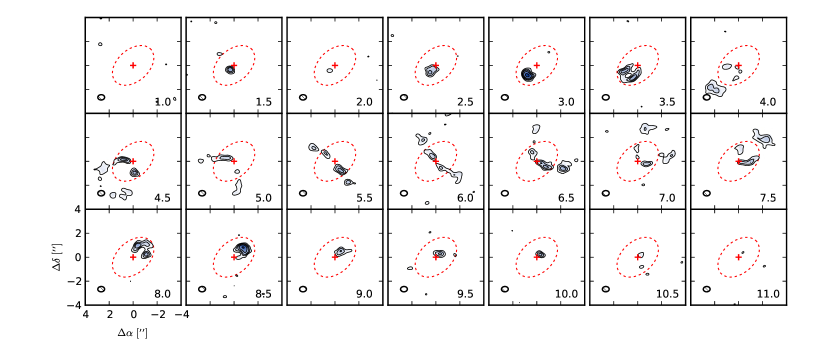
We classify a line as detected if emission exceeding the level is observed in at least three channels at positions consistent with the velocity field established by previous CO observations (e.g. Simon et al. 2000; Isella et al. 2007; Andrews et al. 2009; Panić et al. 2009; Öberg et al. 2011b). Example channel maps for H13CO+ in the HD 163296 disk are shown in Figure 5. The other channel maps are presented in Appendix B.
H13CO+, DCN, and DCO+ are detected in all six disks. H13CN is detected in all but the IM Lup disk, for which we have also presented HCN observations. Most lines show the double-peaked spectra characteristic of rotating, inclined disks. In all cases of detected lines, both redshifted and blueshifted emission are observed. Integrated line fluxes and uncertainties are reported in Table 6. Of the lines that have been observed previously, the fluxes measured with ALMA agree with Submillimeter Array observations of HCN , DCO+ , and DCN reported in Öberg et al. (2010) and Öberg et al. (2011b). Separate ALMA observations of DCN and DCO+ in the HD 163296 disk at comparable spatial resolution and sensitivity have also been presented in Yen et al. (2016) and show similar features.
4.2 Estimates of Disk-averaged Deuterium Fractionation
4.2.1 Line Flux Ratios
If a given pair of molecules with similar upper state energies and critical densities have co-spatial distributions, their flux ratios and column density ratios scale nearly linearly in the optically thin limit of local thermal equilibrium. The critical densities of the lines of H13CO+ and H13CN at 20 K in the optically thin limit are and cm-3, respectively (Shirley 2015). They decrease slightly with temperature, with the critical densities of the lines of H13CO+ and H13CN at 50 K in the optically thin limit being and cm-3, respectively. Collision rates of rarer isotopologues are typically adopted from those of the main isotopologue due to lack of direct experimental constraints, and so we assume that DCO+ and DCN have critical densities similar to those of the non-deuterated isotopologues. Models of disk chemistry suggest that HCO+, DCO+, DCN, and HCN are abundant in regions of the disk where gas number densities range from to cm-3, with HCO+ and DCO+ tending to populate denser and colder regions of the disk than DCN and HCN (Willacy 2007; Walsh et al. 2010). This indicates that LTE should be a good approximation for DCO+ and H13CO+ emission, but may be somewhat less accurate for DCN and H13CN emission (see also the discussion in van Zadelhoff et al. 2001; Pavlyuchenkov et al. 2007). However, Öberg et al. (2015b) tested non-LTE and LTE models for H13CN in the MWC 480 disk and found that the derived column densities agreed within 20%, suggesting that LTE is a reasonable first-order approximation for the targets discussed in this work.
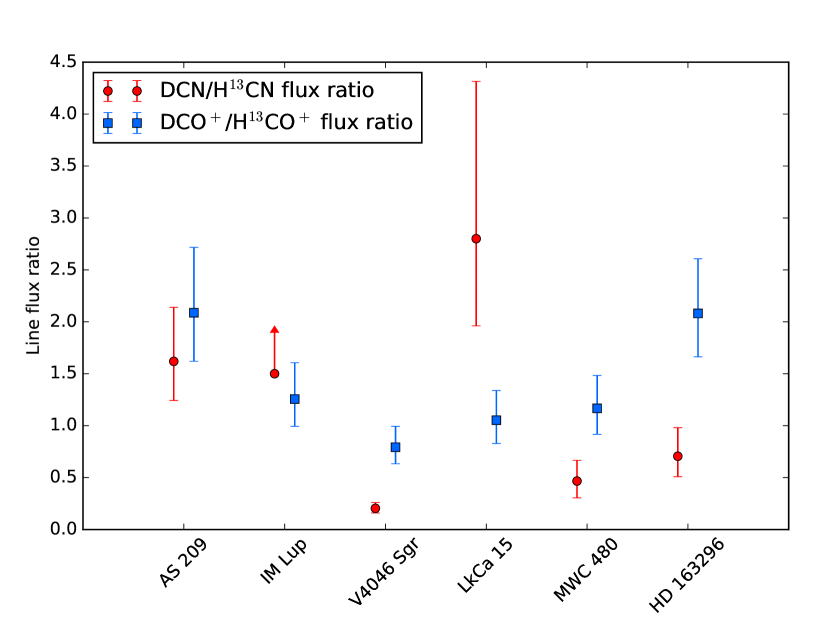
The DCN/H13CN and DCO+/H13CO+ flux ratios for each disk are presented in Figure 6. To account for the effects of ALMA’s systematic flux calibration uncertainty, we drew 100,000 simulated flux measurements for each line from a Gaussian distribution with mean and standard deviation given by the flux measurement and uncertainty provided in Table 6. Each simulated flux measurement was multiplied by a flux rescaling factor drawn from a Gaussian centered at 1 with a standard deviation of 0.15. The plotted error bars correspond to a 68 confidence interval based on the distribution of simulated line flux ratios.
The DCO+/H13CO+ flux ratios are comparable for the whole sample (ranging from 0.8 to 2.1), while there is more scatter in the DCN/H13CN flux ratios (spanning an order of magnitude from 0.2 to 2.8). The two transition disks represent the two extremes, with LkCa 15 having the highest DCN/H13CN flux ratio and V4046 Sgr having the lowest. There are no clear trends with spectral type or stellar accretion rates, but the total number of sources is small.
4.2.2 Disk-averaged Abundance Ratios
Detailed modeling of the radial variations in deuterium fractionation will be the subject of future papers focused on the best-resolved individual sources, but disk-averaged abundance ratios are calculated here for analysis of bulk trends and comparison with other interstellar and solar system measurements. Assuming two molecules XD and XH are co-spatial and have optically thin emission, the LTE approximation for their column density ratio is (e.g. Mangum & Shirley 2015)
| (14) |
where is the column density, is the flux density in Jy, is the rotational partition function as a function of gas kinetic temperature , and are the upper state energy and excitation temperature in K, is the transition frequency, is the line strength, and is the dipole moment. (Note that since we assume LTE).
We also neglect dust opacity when estimating the D/H ratios. Most of the flux originates from the outer disk, where previous models suggest that the millimeter dust continuum is optically thin (e.g. Pérez et al. 2012; Guidi et al. 2016). In addition, because the dust opacities at 1.1 mm and 1.4 mm are generally similar, the attenuation in the fluxes of the deuterated and non-deuterated isotopologues should largely cancel when taking ratios.
The disk-averaged DCN/H13CN and DCO+/H13CO+ ratios were calculated using molecular line parameters obtained from the Cologne Database for Molecular Spectroscopy (Müller et al. 2001, 2005). Assumed excitation temperatures ranged from 15 to 75 degrees, which are typical of the disk regions probed by millimeter line observations (e.g. Piétu et al. 2007; Rosenfeld et al. 2013a). We note that column density ratios are less sensitive than absolute column densities to assumptions about excitation temperature, changing only by in the temperature range evaluated, because of the similar excitation properties of the isotopologues.
The column density ratios were then converted to DCN/HCN and DCO+/HCO+ abundance ratios assuming the local ISM 12C/13C ratio of 69 (e.g. Wilson 1999). Since H13CN was not detected for IM Lup, we instead computed the DCN/HCN column density ratios directly from the DCN/HCN flux density ratio, 0.027. The HCN flux for the IM Lup disk is about a factor of 55 larger than the H13CN upper limit, which suggests that HCN may be optically thin over much of its emitting area. If, however, the HCN is optically thick, the resulting D/H ratios would be overestimated. The results are listed in Table 7. The DCO+/HCO+ ratios range from –0.06, with a median of . The DCN/HCN ratios range from –0.08, with a median of . Using parametric models to fit observations of the line of DCO+ and lines of HCO+ and H13CO+ in the HD 163296 disk, Mathews et al. (2013) derived a disk-averaged DCO+/HCO+ abundance ratio of 0.02, a factor of a few lower than our estimate. While their models confined DCO+ largely within a radius of 160 AU, subsequent observations of other transitions with higher signal-to-noise ratios show emission extending out to 300 AU, which helps to account for our higher value (Yen et al. 2016; Qi et al. 2015, and this work).
4.3 Emission Morphologies
The classification of emission morphologies is dependent on the spatial resolution, since central or annular gaps may emerge at higher resolutions. However, since most of the disks are at similar distances and were observed at similar spatial resolutions, it is still informative to compare their molecular emission morphologies. Based on the integrated intensity maps and radial profiles, the observed emission morphologies mostly fall into four categories:
-
1.
Ring-like
-
(a)
H13CO+ in the AS 209, IM Lup, LkCa 15, and MWC 480 disks
-
(b)
DCO+ in the AS 209, V4046 Sgr, MWC 480, and HD 163296 disks
-
(c)
H13CN in the AS 209 disk and HCN in the IM Lup disk
-
(d)
DCN in the AS 209, V4046 Sgr, and HD 163296 disks
-
(a)
-
2.
Centrally peaked
-
(a)
H13CN in the V4046 Sgr, MWC 480, and HD 163296 disks
-
(a)
-
3.
Profiles with multiple rings
-
(a)
H13CO+ in the HD 163296 disk
-
(b)
DCO+ in the IM Lup disk
-
(a)
-
4.
Diffuse
-
(a)
H13CO+ in the V4046 Sgr disk
-
(b)
DCO+ in the LkCa 15 disk
-
(a)
Like DCO+ in the IM Lup disk and H13CO+ in the HD 163296 disk, the DCN emission in the LkCa 15 disk appears to feature an annular gap (i.e., a ring-like depression in the emission profile), but better spatial resolution would be necessary to confirm the morphology of the central component of the DCN emission. The emission morphologies of H13CN in the LkCa 15 disk and DCN in the IM Lup and MWC 480 disks are not as easily categorized due to lower signal-to-noise ratios, but DCN in the IM Lup disk appears to be extended, while the DCN emission in MWC 480 and H13CN emission in the LkCa 15 disk appear to be more compactly distributed.
No clear pattern emerges for relationships between the emission morphologies of different molecules, except that disks with more extended CO emission (see Table 1) tend to feature more extended DCO+ and H13CO+ emission, which is reasonable given that CO is a parent molecule. No given molecule exhibits the same emission morphology across all disks. Furthermore, for a given disk, the range of possibilities spans from similar morphologies for all molecules (AS 209) to distinct morphologies for each of the four molecules (LkCa 15). In the V4046 Sgr and HD 163296 disks, the H13CN and DCN lines are emitted from a markedly more compact region compared to DCO+ and H13CO+. In the LkCa 15 disk, the H13CN emission originates from a more compact region than the other three molecules. Apart from the IM Lup disk, the detected emission extents for DCO+ and H13CO+ in the channel maps are similar, although the radial profiles for several disks indicate that they peak in different locations.
As a first-order approximation, the disk-averaged D/H analysis in the previous subsection assumed that the deuterated isotopologues are largely co-spatial with their non-deuterated forms. Here, we examine the effects of those assumptions in more detail. The four molecules targeted have similar excitation energies and critical densities. Thus, while the three-dimensional distributions of the molecules can only be inferred through complete structural models accounting for the gas density and temperature gradients of protoplanetary disks, molecules with very different emission patterns are unlikely to be co-spatial. Co-spatial molecules may have substantially different emission patterns if one of them is optically thick, as in the case of CO isotopologues in the cavity of transition disks (e.g. van der Marel et al. 2016), but the molecules targeted in this deuterium survey are orders of magnitude less abundant than CO and expected to be optically thin.
For the IM Lup, LkCa 15, and HD 163296 disks, the radial intensity profiles of DCO+ either show an enhancement beyond 200 AU or decline less steeply compared to the H13CO+ emission profiles. In the V4046 Sgr disk, there is a deep central gap in DCO+ emission, whereas the H13CO+ emission is broad and diffuse. This suggests that the disk-averaged DCO+/HCO+ abundance ratios calculated in the previous section would likely lie between higher local values in the outer disk and lower local values in the inner disk.
| Source | Flux ratio | Abundance ratio assuming T K | Abundance ratio assuming T K | |||
|---|---|---|---|---|---|---|
| AS 209 | ||||||
| IM Lup | >1.5 | **Estimated directly from DCN/HCN flux ratio | **Estimated directly from DCN/HCN flux ratio | |||
| V4046 Sgr | ||||||
| LkCa 15 | ||||||
| MWC 480 | ||||||
| HD 163296 | ||||||
Compared to DCO+ and H13CO+, DCN and H13CN appear to have more similar distributions in this survey, except DCN features a central gap more often than H13CN. Thus, the disk-averaged DCN/HCN ratios calculated in the previous section would likely be intermediate between higher local values in the outer disk and lower local values in the inner disk for V4046 Sgr, LkCa 15, and HD 163296. The LkCa 15 disk features the greatest discrepancy between H13CN and DCN emission: whereas H13CN emission is confined to a compact region at the center of the disk, DCN emission is detected out to hundreds of AU. Thus, the local DCN/HCN enhancement in the LkCa 15 relative to the other disks may be even more extreme than what is indicated by the disk-averaged estimates, for which LkCa 15 already has the largest DCN/HCN ratio.
4.4 Additional Comments on Individual Sources
In this subsection, we discuss the features observed in the integrated intensity maps ( Fig. 1), radial profiles (Fig. 2), and channel maps (Appendix B) in the context of each individual source.
4.4.1 AS 209
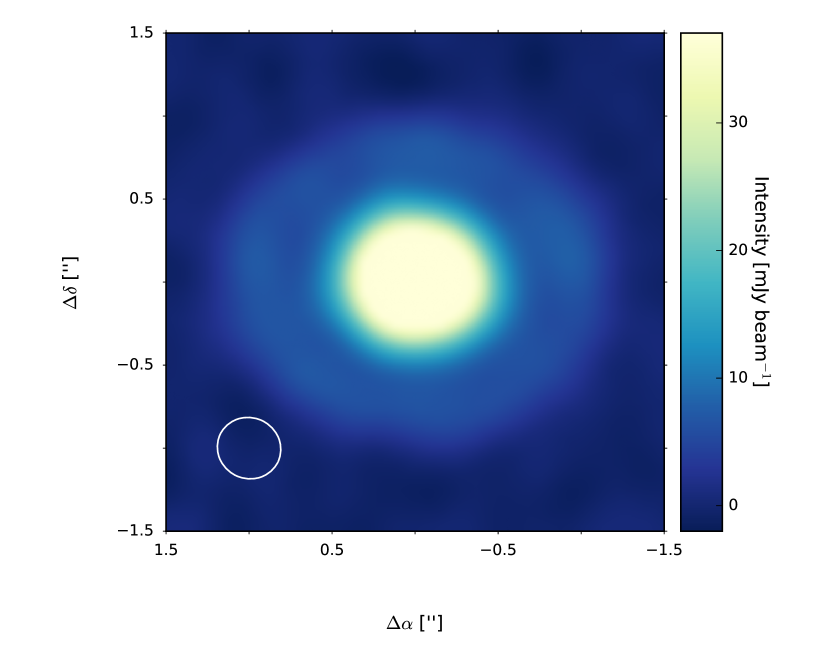
All four molecules have ring-like emission morphologies. The radial emission profiles of DCN, H13CN, and H13CO+ peak at AU. DCO+ has a shallower central depression in the emission profile compared to the other molecules, but its emission profile begins to decline rapidly past AU. The radial intensity profile (see Fig. 2) of the continuum shows a break at ( AU). The 258 GHz continuum emission, re-imaged with multi-scale CLEAN as well as uniform weighting for better spatial resolution (synthesized beam: ), is shown again in Figure 7 and exhibits a dark annulus between the inner disk and outer emission ring.
4.4.2 IM Lup
The DCO+ emission features double rings. The first peak in the radial profile occurs at AU, and the second occurs at AU. H13CO+ has a ring-like morphology with the radial emission profile peaking at 130 AU, which is a wider central gap than the other H13CO+ emission rings observed in the survey, including even the transition disks. (Note that these observations were previously presented in Öberg et al. (2015a) assuming a distance of 155 pc to IM Lup). H13CN is not detected, but HCN has a ring-like profile peaking at AU. DCN is only marginally detected in a few channels (see Appendix B), but the emission is spatially consistent with HCN and indicates that DCN is also extended in the disk.
4.4.3 V4046 Sgr
The central dust cavity reported in Rosenfeld et al. (2013b) is also resolved in the 258 GHz continuum ALMA data. The DCO+ and DCN lines both have ring-like emission morphologies, with the averaged radial emission profiles peaking at 70 and 50 AU, respectively. Rosenfeld et al. (2013b) determined that most of the dust mass in the V4046 Sgr disk is confined to a ring with a peak in surface density at AU and a FWHM of 16 AU. Thus, the DCN emission is largely coincident with the outer regions of the millimeter dust emission. In contrast, the DCO+ emission originates mostly outside the millimeter dust disk. The DCN emission appears to be brighter on the western side of the disk, but more sensitive observations would be required to confirm whether the asymmetry is real. The H13CO+ radial profile is notably flatter than those of the other lines detected in V4046 Sgr, while the H13CN emission profile is centrally peaked. The H13CN integrated flux is also exceptionally large compared to the other disks in the survey. Although V4046 Sgr is much closer than the other disks, its H13CN integrated flux would still be about a factor of two higher than that of the other disks in the survey if they were at the same distance. The channel maps (Appendix B) indicate that emission above the 3 level for DCO+ and H13CO+ is nearly absent inside the cavity.
4.4.4 LkCa 15
The central dust cavity reported in Andrews et al. (2011b) is also resolved in the 258 GHz continuum ALMA data. While the DCN emission observed in the other disks is typically compact (with the possible exception of the IM Lup disk), the DCN emission in the LkCa 15 disk is clearly extended. The radial profile and integrated intensity map indicate that an annular gap in DCN emission separates a compact component near the center and an emission ring peaking at 180 AU near the edge of the millimeter dust emission, but higher-sensitivity observations will be needed to clarify the structure. The H13CO+ radial profile peaks at 40 AU, whereas the DCO+ radial profile is relatively flat and extended.
4.4.5 MWC 480
The H13CO+ and DCO+ radial emission profiles peak at 40 AU. The H13CN profile is centrally peaked. Although the DCN emission is weak and appears in only a few channels (Appendix B), it is consistent with the Keplerian rotation pattern established by the other three lines observed. The DCN emission appears to feature a central dip, but the signal-to-noise ratio is too low to be definitive.
4.4.6 HD 163296
The H13CN profile is centrally peaked, while the DCN radial profile peaks at AU. Our DCN data do not show clear evidence for the offset from center noted by Yen et al. (2016) for separate HD 163296 observations. However, the average DCN radial profiles appear similar for both observations. The DCO+ emission is ring-like, with the radial profile peaking at AU. Like Yen et al. (2016), we find that the DCO+ emission peaks in brightness northwest of the disk center. A similar feature was also reported for the DCO+ line by Mathews et al. (2013). The H13CO+ line features a compact emission ring peaking at 50 AU, but its most striking feature is the emission break near AU, as seen most clearly in the channel maps in Figure 5 and faintly in the integrated intensity map in Figure 1. A similarly positioned break is hinted at in a few channels in the DCO+ channel maps in Appendix B as well as the channel maps presented for the DCO+ line in Qi et al. (2015), but in neither case is the break as unambiguous as for H13CO+.
5 Discussion
5.1 Comparison of D/H ratios
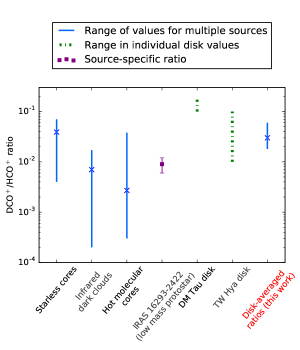
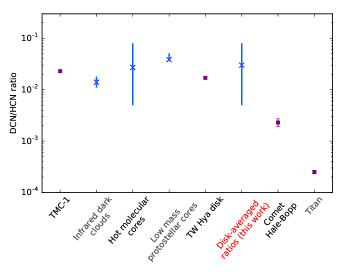
The range of disk-averaged DCN/HCN and DCO+/HCO+ abundance ratios estimated for the survey are plotted in Figure 8, along with measurements reported in the literature for other interstellar environments and solar system objects.
5.1.1 Comparison to Other Sources
As with previous findings for the DM Tau (Teague et al. 2015), TW Hya (van Dishoeck et al. 2003; Qi et al. 2008; Öberg et al. 2012), and HD 163296 (Mathews et al. 2013) disks, our survey indicates that the high deuterium fractionation in earlier star formation stages can also persist during the disk stage for a diverse set of sources. The DCO+/HCO+ estimates for the six disks are comparable to values measured for starless cores (Butner et al. 1995; Caselli et al. 2002; Tafalla et al. 2006), and slightly higher than the ratio derived for low-mass protostar IRAS 16293-2422 (Schöier et al. 2002). They are also a factor of a few higher than typical values measured for infrared dark clouds (Miettinen et al. 2011; Gerner et al. 2015) and hot molecular cores (Gerner et al. 2015), both of which are associated with high-mass star formation rather than the low- and intermediate-mass stars from this work.
Likewise, the disk-averaged DCN/HCN abundance ratios for our survey are comparable to the values obtained for infrared dark clouds (Gerner et al. 2015), hot molecular cores (Gerner et al. 2015), and low-mass protostellar cores (Roberts & Millar 2000). Öberg et al. (2012) derived a disk-averaged value of 0.017 for the TW Hya disk, which lies within the range of values estimated in this work. DCN is a particularly useful tracer of deuterium chemistry because its fractionation has been measured in a range of sources across the stages of star and planetary system formation, including within our own solar system. Most of the disk-averaged abundance ratios are higher than that of comet Hale-Bopp, which has a DCN/HCN ratio of 2.3 (Meier et al. 1998). However, the DCN/HCN ratio of the V4046 Sgr disk is within a factor of a few of that of Hale-Bopp. Since V4046 Sgr is much older than the other disks in the survey, it would be interesting to observe other old disks to investigate whether DCN/HCN fractionation depends on disk age, which would in turn help to constrain the origin of cometary ices. (TW Hya is also advanced in age, but thought to be younger than V4046 Sgr). The disk-averaged DCN/HCN ratios are also typically several orders of magnitude larger than that of Titan (Molter et al. 2016). While Titan features very active photochemistry, its current deuterium fractionation may still partially reflect primordial fractionation (Cordier et al. 2008).
5.1.2 Comparison to Disk Models
For a general T Tauri disk model, Aikawa et al. (2002) predict that both DCN/HCN and DCO+/HCO+ vary between 0.01 to 0.1 from 50 to 400 AU. The T Tauri disk model from Willacy (2007) predicts that DCN/HCN varies between 0.01 to 0.1 from 50 to 400 AU (similar to Aikawa et al.), and DCO+/HCO+ varies from 0.1 to 2. Both the Aikawa and Willacy models evolve from initial abundances mirroring those of dark clouds and produce DCO+ through the H2D+ pathway (Eq. 2). DCN is primarily produced through the CH2D+ pathway (Eq. 7 and 8) in the models from Aikawa & Herbst (1999a), which were extended into two dimensions in Aikawa et al. (2002). The Willacy models, in contrast, produce a substantial portion of DCN through the H2D+ pathway (Eq. 12 and 13). The Willacy models also incorporate grain-surface reactions and multiply-deuterated species in their chemical network.
While we calculate disk-averaged abundance ratios rather than D/H ratios as a function of radius, we find that our estimated disk-averaged ratios are for the most part comparable to the values quoted above for disk models. V4046 Sgr does feature a disk-averaged DCN/HCN ratio that is a factor of a few lower than the values in the Aikawa and Willacy models, but it is a binary star system that is much older than the disk models (typically 1 Myr), so its disk properties may have evolved substantially.
Generally, the abundance ratios derived for the disk survey are compatible with scenarios of in situ deuterium fractionation. A more compelling case for in situ fractionation may be the diverse and highly structured emission patterns observed for the same molecules across different disks, which would suggest that their distributions are strongly responsive to the particular disk environment. Chemical modeling of each disk would be necessary to draw firmer conclusions regarding the extent to which in situ deuteration processes are required to explain the observed chemistry.
5.1.3 Considerations on 12C/13C Fractionation
H13CN and H13CO+ were targeted because line emission from the main isotopologues was assumed to be too optically thick to trace their distributions. Of the disks in the survey with previously reported detections of HCO+ (Öberg et al. 2010, 2011b), the HCO+ to H13CO+ line flux ratios range from 13 to 25. The flux ratios of the HCN to H13CN lines (based on observations of HCN reported in Öberg et al. 2010, 2011b; Graninger et al. 2015) range from 10 to 60, with AS 209 and V4046 Sgr on the low end and LkCa 15 on the high end. Assuming that the 12C/13C ratio is the ISM value of 69 (e.g. Wilson 1999), the flux ratios indicate that HCO+ is optically thick for all the targets, while HCN is likely optically thick for at least part of the sample.
In addition to the adoption of a 12C/13C ratio, inferences about deuterium fractionation based on optically thin isotopologues require the assumption that the 12C and 13C isotopologues are co-spatial. The appropriateness of these two assumptions depends on the extent of 12C/13C fractionation in disks, which has not yet been constrained observationally. Obtaining such constraints will improve interpretations of disk chemistry, but the ALMA systematic flux calibration uncertainty and uncertainties in disk temperature structures currently pose some challenges in measuring 12C/13C fractionation.
Models offer some insight into the potential impact of carbon fractionation on the conclusions. H13CO+ may be somewhat depleted in the outer disk compared to HCO+ due to the less-abundant 13CO being photodissociated more easily than 12CO, but the full T Tauri and Herbig Ae disk models from Miotello et al. (2014) indicate that its effects should be modest interior to a couple hundred AU, the region that our observations trace. In contrast, full T Tauri disk models also indicate that the H13CN/HCN ratios may vary by up to factors of a few in the inner disk (Woods & Willacy 2009). (Similar calculations have not been performed yet for transition disks and for Herbig Ae disks, but it is possible that fractionation could vary from the full T Tauri disk models due to the different radiation fields.) Thus, the use of H13CN to trace the distribution of HCN ought to be treated with more caution than the use of H13CO+ to trace HCO+, particularly if HCN may be optically thin enough in certain disks to trace distributions directly. Fitting models to observations of multiple transitions of 12C and 13C isotopologues could provide better insight into the robustness of assumed isotope ratios. However, even if the 12C/13C ratios are overestimated by a factor of a few, the D/H levels derived for this survey would still be indicative of efficient fractionation.
Greater uncertainty in the H13CN/HCN ratios may partially account for the greater variability of DCN/HCN abundance ratios derived in this work compared to DCO+/HCO+. Nevertheless, we note that the unusually bright H13CN detection in the V4046 Sgr disk relative to the rest of the sample is not likely to be due primarily to carbon fractionation, since HC15N emission is also exceedingly strong in the V4046 Sgr disk compared to the other disks Guzmán et al. (2017).
5.1.4 Potential Effects of Selection Bias
The disks discussed in this work are often considered to be benchmark systems for studies of disk structure and chemistry due to their large size, bright molecular lines, and relative isolation (e.g. Piétu et al. 2007; Willacy 2007; Öberg et al. 2010, 2011b; Rosenfeld et al. 2013a, b). The diversity of molecular emission patterns observed in this survey of six disks demonstrates the value in observing multiple systems with varying physical properties in order to explore the range of chemical outcomes.
On the other hand, the characteristics that have often made these disks favored for chemical studies may also lead to some bias, leaving some facets of deuterium chemistry not fully explored. Because the targets were primarily selected on the basis of previous DCO+ detections, the similar DCO+/H13CO+ flux ratios measured with ALMA may be a result of the selection process favoring disks with higher levels of deuterium enrichment. Furthermore, even though MWC 480 and HD 163296 are chemically rich, observations of other Herbig Ae stars suggest that their disks tend to be more chemically poor than those around T Tauri stars, perhaps because the higher UV luminosities of Herbig Ae stars lead to more photodissociation (e.g. Schreyer et al. 2008; Öberg et al. 2010, 2011b; Guilloteau et al. 2016). In addition, because the survey covers only relatively massive and isolated disks (in part a legacy of which sources were most readily observable on earlier mm/sub-mm instruments), the most extreme effects of the interstellar radiation field are not well constrained. Finally, because the disks in the survey have large radial extents, they have very cold outer regions that would be expected to be most hospitable to deuterium fractionation. Thus, extension of the survey toward lower-mass or more compact disks would provide additional insight into what aspects of deuterium chemistry observed in this work are most common in disks. Recent ALMA continuum and CO surveys of disks in various star-forming regions have now created a rich selection of potential chemistry follow-up targets spanning a range of stellar and disk properties (e.g. Ansdell et al. 2016; Barenfeld et al. 2016; Testi et al. 2016; Pascucci et al. 2016).
5.2 Chemical Implications
Prior to this work, the LkCa 15, TW Hya, and HD 163296 disks were the only disks in which both DCN and DCO+ had been detected (Qi 2001; van Dishoeck et al. 2003; Öberg et al. 2012; Yen et al. 2016). With the additional detections from this survey, the number of sources in which DCN has been observed has now doubled.
5.2.1 Formation of DCN
As noted in the introduction, the DCN distribution was reported to be much more radially compact than that of DCO+ in the TW Hya and HD 163296 disks. The previous LkCa 15 observations were not sufficiently resolved to compare DCN and DCO+. For TW Hya, the spatial differentiation has been attributed to production of DCN through CH2D+ (e.g., Eq. 7 and 8) in the warm inner disk and production of DCO+ through H2D+ (Eq. 2) in the cold outer disk.
In our survey, we observe the following relationships between DCN and DCO+ emission:
-
1.
Substantial spatial differentiation between DCN and DCO+ in the V4046 Sgr and HD 163296 disks. In these sources, DCN is much more compact and peaks in intensity within the central gap of DCO+ emission. This is similar to the TW Hya disk, which suggests that DCN production in these disks is also dominated by the CH2D+ pathway.
-
2.
Similar radial extents for DCN and DCO+ emission in the AS 209 and LkCa 15 disks. This may be indicative of more overlap in the formation pathways for DCN and DCO+ in these disks than in the V4046 Sgr, HD 163296, or TW Hya disks.
-
3.
Ambiguous relationship due to the DCN detections with low signal-to-noise ratios in the IM Lup and MWC 480 disks.
DCN and DCO+ are not necessarily co-spatial in the disks in which they have similar emission profiles, since it is possible that they are confined to different heights. Even so, the results indicate that the inner disk/outer disk tracer dichotomy that was previously suggested for DCN and DCO+ by the TW Hya and HD 163296 data does not apply to all disks.
The DCN emission profile in the LkCa 15 disk is particularly interesting, since it appears to peak once near the central star and again at 180 AU. Fitting a vertically isothermal model to CO isotopologue observations, Piétu et al. (2007) derived a gas temperature of K at 100 AU from the central star. While this method may lead to imprecise temperature values due to real disks having vertical temperature gradients, the effect would likely be to overestimate rather than underestimate the temperature at which DCN resides, since 12CO typically probes the upper regions of the warm molecular layer. Therefore, much of the DCN emission in the LkCa 15 disk originates from disk regions expected to be too cold for CH2D+ to be the dominant deuterated ion, which suggests that an H2D+ formation pathway is a significant contributor in the outer LkCa 15 disk. The marginal detection of DCN in the IM Lup disk appears to be similarly extended into the cold outer disk, but more sensitive observations would be necessary to confirm this.
Unlike LkCa 15, which has a gas disk estimated to extend to 900 AU (Isella et al. 2012), the TW Hya gas disk only extends to 215 AU (Andrews et al. 2012). The TW Hya disk may simply not have enough material in its outer regions for a cold DCN formation pathway to be important. An alternative scenario is that radial drift in the LkCa 15 disk creates a radial thermal inversion allowing for the warm CH2D+ pathway to produce DCN just outside the millimeter dust disk (Cleeves 2016). Then, other disks exhibiting evidence of radial drift, such as TW Hya and AS 209 (Menu et al. 2014; Pérez et al. 2012), might be expected to show similar DCN emission, but they do not at the current sensitivity.
5.2.2 Formation of DCO+
Chemical models generally predict two types of radial profiles for DCO+:
- 1.
-
2.
Radially decreasing (or with a very small central gap), if forming predominantly from CH2D+ and CO, since CH2D+ is abundant in warmer gas compared to H2D+ (Favre et al. 2015).
Ring-like distributions have previously been inferred for DCO+ in the TW Hya, HD 163296, and DM Tau disks (Qi et al. 2008; Mathews et al. 2013; Teague et al. 2015), and ring-like emission patterns are observed for AS 209, V4046 Sgr, MWC 480, and HD 163296 in this work. These results suggest that ring-like DCO+ distributions are common, and support a cold H2D+ formation scenario. The double DCO+ rings observed in the IM Lup disk deviate from this picture somewhat, but Öberg et al. (2015a) found that the presence of multiple rings could be explained with models of DCO+ abundances first decreasing in the outer disk due to CO freezeout, then rising again as CO non-thermally desorbs in regions of the disk with lower surface density where UV radiation penetrates closer to the midplane.
In addition, while the LkCa 15 DCO+ emission is not as distinctly ring-like as that of the other disks, the radially averaged integrated intensity of H13CO+ drops by about a factor of 3 from 50 to 200 AU, whereas the DCO+ radial profile remains relatively flat in the same interval. Likewise, the radially averaged integrated intensity of H13CO+ in the HD 163296 disk drops by about a factor of 5 from 50 to 200 AU, whereas that of DCO+ drops only by about a factor of 2. This behavior suggests that either the column densities or average excitation temperatures of H13CO+ are decreasing more rapidly with radius than those of DCO+. Since disks are expected to have radially decreasing temperature gradients, either scenario would require the DCO+/HCO+ ratio to increase at lower temperatures.
We do not observe radially decreasing emission profiles for DCO+. In addition, given that the dominant formation pathway of DCN is expected to begin with CH2D+ (e.g. Millar et al. 1989; Aikawa & Herbst 1999a), one would expect the DCO+ emission to be bright in the same regions if its formation followed the models of Favre et al. (2015). On the contrary, for at least a few disks (V4046 Sgr and HD 163296 from this work, as well as TW Hya from Qi et al. 2008 and Öberg et al. 2012), the DCO+ emission features prominent central gaps where DCN is brightest. Our observations therefore do not provide evidence that the CH2D+ pathway dominates DCO+ production.
It is interesting to note, though, that the two Herbig Ae sources in the survey, MWC 480 and HD 163296, have disk-averaged DCO+/HCO+ ratios comparable to those of the T Tauri sources. This result may seem counter-intuitive, since the Herbig Ae disks are expected to be warmer and therefore less favorable toward high deuterium fractionation, although no deuterium chemistry models have been published for Herbig Ae disks yet. The observations may hint that CH2D+ is a secondary contributor to fractionation. In addition, based on DCO+ observations in the HD 163296 disk, Qi et al. (2015) concluded that DCO+ remains abundant in regions of the disk warmer than 30 K, which suggests that a warm pathway is partially responsible for DCO+ production. A larger sample of both T Tauri and Herbig Ae disks would be needed to determine whether they indeed typically have similar levels of DCO+/HCO+ fractionation.
5.3 Relationship Between Molecular Distributions and Disk Dust Structures
5.3.1 Transition Disk Cavities
The V4046 Sgr and LkCa 15 disks both feature prominent cavities, but markedly different line emission patterns, implying that the presence of a cavity does not lead to predictable molecular distributions. The DCN and DCO+ in the V4046 Sgr disk are clearly not co-spatial, while they have more similar radial extents in the LkCa 15 disk. The disk gaps in the millimeter dust continuum do not have an obvious relationship to the observed line morphologies. In the V4046 Sgr disk, H13CN line emission appears at the 5 level up to 5.5 km s-1 offset from the systemic velocity. This suggests that H13CN is present at least within 15 AU from the central binary and well within the millimeter dust cavity ( AU), assuming a Keplerian velocity field (i.e. ) and the stellar mass and disk inclination given in Tables 1 and 1. On the other hand, almost all the H13CO+ and DCO+ emission in V4046 Sgr at the > level in the channel maps are detected well outside the cavity.
5.3.2 The Edge of the Millimeter Dust Disk
Recent observations have indicated that molecular emission rings arising at the edge of the millimeter dust disk are a recurring feature (e.g. Guzmán et al. 2015; Öberg et al. 2015a; Bergin et al. 2016). Indeed, in the deuterium survey, this feature is observed for DCN in LkCa 15, H13CO+ in HD 163296, and DCO+ in V4046 Sgr and IM Lup (as first pointed out by Öberg et al. (2015a)), providing further evidence that molecular emission rings encircling millimeter dust disks are common. Models suggest that such rings could be due to dust evolution facilitating either thermal or non-thermal desorption in the outer disk (e.g. Öberg et al. 2015a; Bergin et al. 2016; Cleeves 2016). However, since this feature seems to arise in different molecules for different disks, a consistent connection is not yet established. Given that outer emission rings are sometimes very faint, a systematic study of molecular emission at very high sensitivity in conjunction with imaging of dust at multiple wavelengths would be needed to investigate whether the evolution of grain size distributions leads to predictable locations for molecular emission rings.
5.3.3 The AS 209 disk
The outer ring in the 258 GHz continuum emission in the AS 209 disk (Fig. 7) appears to coincide with a similar outer ring in the C18O emission and with a sharp change in slope of the 1.4 mm continuum emission observed at slightly lower spatial resolution in Huang et al. (2016). (Note that Huang et al. (2016) used an older distance estimate of 120 pc rather than 126 pc in this work). Huang et al. (2016) proposed that the outer C18O emission ring was the result of desorption in the outer disk outside the CO snowline. This would appear to be consistent with predictions that continuum emission rings can arise near volatile snowlines, perhaps due to changes in dust opacity from mechanisms such as pebble growth (Zhang et al. 2015) or sintering (Okuzumi et al. 2016).
The H13CO+, DCO+, H13CN, and DCN emission morphologies of the AS 209 disk are quite similar to one another, unlike those of the other disks in the survey. All four are distributed in emission rings peaking near the dark ring in the 258 GHz dust continuum. Given that H13CN and H13CO+ do not have similar formation pathways, the similar emission patterns in the four molecules observed for AS 209 may instead be related to the interplay between the dust and gas structures near the continuum emission gap.
However, for AS 209, higher-resolution continuum studies at multiple wavelengths to constrain spectral indices and surface density profiles would be needed to distinguish between the numerous mechanisms for producing dust emission rings that have been proposed for protoplanetary disks. Ring-like structures in millimeter dust continuum emission have also been directly imaged in several other protoplanetary disks, but their origins are still debated (ALMA Partnership et al. 2015; Andrews et al. 2016; Cieza et al. 2016; Isella et al. 2016). In addition to the mechanisms discussed in the previous paragraph, other hypotheses for the origins of rings often invoke the presence of a forming planet (e.g. Ruge et al. 2013; Dong et al. 2015; Pinilla et al. 2015; Gonzalez et al. 2015) or magnetorotational instability (e.g. Pinilla et al. 2012; Ruge et al. 2013; Flock et al. 2015).
5.4 Assessing the Viability of DCO+ as a Midplane CO Snowline Tracer
Because temperatures in a protoplanetary disk generally decrease with radius and increase with height above the midplane, CO is present in the gas phase in the inner regions of the disk and in warm layers above the midplane, but it is mostly frozen out onto dust grains in the outer midplane. Measuring the location of the CO midplane snowline, which marks the radius where this freezeout starts to occur, is important for constraining planet formation theories because changes in the abundance of CO gas and ice are thought to influence the composition of planetary atmospheres as well as the movement and growth of dust grains (e.g. Öberg et al. 2011a; Madhusudhan et al. 2014; Ali-Dib et al. 2014; Piso et al. 2015; Okuzumi et al. 2016). Because CO is almost always optically thick in protoplanetary disks, the CO snowline is usually traced instead through interferometric imaging of optically thin molecules that have distributions dependent on gas-phase CO (Mathews et al. 2013; Qi et al. 2013, 2015). Mathews et al. (2013) suggested that DCO+ traces the CO snowline because the formation of DCO+ requires both H2D+ and gas-phase CO, which coexist only in a narrow temperature range. N2H+ is also used as a tracer because it is quickly destroyed by gas-phase CO, so it is expected to become abundant when CO starts freezing out (Qi et al. 2013, 2015; Aikawa et al. 2015).
Although the DCO+ emission morphologies and high fractionation levels observed in this work are broadly consistent with predictions from disk models invoking the standard H2D+ pathway, observations of the other molecular lines in this survey provide evidence that DCO+ is not a robust tracer of the CO snowline. Qi et al. (2015) make a similar argument based on the relationship between the inferred DCO+ and N2H+ distributions, while our line of reasoning is based on the relationship between DCO+ and H13CO+. Whereas Mathews et al. (2013) suggested that the inner radius of the DCO+ distribution is determined by where H2D+ becomes abundant, the AS 209, IM Lup, LkCa 15, and MWC 480 disks feature central dips in their H13CO+ radial emission profiles that are comparable to or even larger than the central dips in the corresponding DCO+ profiles. The H13CO+ dip in the LkCa 15 disk can be plausibly explained by a drop in gas density, which has already been inferred for several transition disks based on CO isotopologue observations (van der Marel et al. 2016), but no models or observations so far have indicated that a similar drop in central gas density is likely for the full disks. Instead, the observations of AS 209, IM Lup, and MWC 480 raise the possibility that the inner radius of the DCO+ ring is not always controlled by the availability of H2D+, but that instead, the inner edges of the DCO+ and H13CO+ rings may be set by common chemical or physical factors, such as the ionizing environment due to cosmic rays or X-rays (e.g. Cleeves et al. 2014a).
Alternatively, high dust opacity at the disk center could create the appearance of a hole in the H13CO+ distribution (e.g. Öberg et al. 2015a; Cleeves et al. 2016), but then optically thin DCO+ emission would likely suffer similar effects, which would also increase the difficulty of using it to trace the CO snowline. Given that optically thin line transitions can now be imaged by ALMA with much greater ease than by previous instruments, the question of how dust opacity affects the interpretation of their emission patterns will warrant more rigorous examination through continuum and line observations in multiple bands (e.g., Band 3 in conjunction with Band 6 or 7) as well as simultaneous modeling of gas and dust structure.
The DCO+ observations in the IM Lup and LkCa 15 disks, as well as the H13CO+ emission in the HD 163296 disk, also indicate that the outer edge of the DCO+ emission profile does not necessarily correspond closely to the location of the classical midplane CO snowline. Öberg et al. (2015a) proposed that the second DCO+ emission ring in the IM Lup disk arises from CO ice desorption outside the CO snowline, whereas the inner DCO+ emission ring was likely located near the CO snowline. At lower spatial resolutions, multiple DCO+ emission rings could appear to be a single ring, for which neither the inner nor outer edge would mark the location of the CO snowline. No estimates of CO snowline locations are available in the literature for the LkCA 15 disk, but estimates for other disks range from 17 to 90 AU (Qi et al. 2013, 2015; Schwarz et al. 2016). Rather than being confined to the single narrow ring predicted by disk chemistry models, the LkCa 15 DCO+ radial profile remains relatively flat out to hundreds of AU, well past likely locations of the midplane CO snowline. Finally, the annular gap in H13CO+ emission in the HD 163296 disk at 200 AU is well beyond the 90 AU CO snowline that Qi et al. (2015) estimated from N2H+ data, which could indicate that gas-phase CO is depleted through some other mechanism besides CO freezeout. Using millimeter observations at , Isella et al. (2016) identified a number of rings in the HD 163296 disk where both the CO and dust are depleted. While the most distant ring identified is at 160 AU, which does not appear to be an obvious match with the H13CO+ gap, our observations are also at coarser resolution, so forward modeling will be necessary to determine more precisely the nature of the relationship between the H13CO+ and CO distributions in this source.
6 Summary
We present sensitive, high-resolution ALMA observations of DCO+, DCN, H13CO+, and H13CN lines, as well as HCN in the IM Lup disk, that indicate that deuterium fractionation of these molecules is efficient in disks and manifests in diverse forms. The main findings are summarized below.
-
1.
DCO+, H13CO+, and DCN are detected in all disks, and H13CN is detected in all but the IM Lup disk.
-
2.
Disk-averaged DCO+/HCO+ and DCN/HCN abundance ratios derived for the survey are on the order of –0.06 and –0.08, respectively. These high values are comparable to previous disk observations and disk chemical models, as well as the D/H ratios measured for earlier stages of star formation.
-
3.
Given the high rate of DCN detections (four of which are new) with relatively short integration times, DCN is especially valuable as a tracer of disk chemistry in the context of chemical evolution because it has also been observed in cold interstellar environments and within the solar system.
-
4.
The diverse emission morphologies observed for DCN suggest that both warm and cold pathways can contribute significantly to its production in disks.
-
5.
The observations point to a cold formation pathway dominating DCO+ production in disks. However, even though DCO+ has been proposed as a CO snowline tracer on the basis of DCO+ formation being most favored in gas near the CO freezeout temperature, observations of similar central and annular gaps in H13CO+ and DCO+ emission suggest that the ring-like emission profiles of DCO+ may not reliably constrain the location of the CO snowline.
References
- Adams & Smith (1985) Adams, N. G., & Smith, D. 1985, ApJ, 294, L63
- Aikawa et al. (2015) Aikawa, Y., Furuya, K., Nomura, H., & Qi, C. 2015, ApJ, 807, 120
- Aikawa & Herbst (1999a) Aikawa, Y., & Herbst, E. 1999a, ApJ, 526, 314
- Aikawa & Herbst (1999b) —. 1999b, A&A, 351, 233
- Aikawa & Herbst (2001) —. 2001, A&A, 371, 1107
- Aikawa et al. (2002) Aikawa, Y., van Zadelhoff, G. J., van Dishoeck, E. F., & Herbst, E. 2002, A&A, 386, 622
- Ali-Dib et al. (2014) Ali-Dib, M., Mousis, O., Petit, J.-M., & Lunine, J. I. 2014, ApJ, 793, 9
- ALMA Partnership et al. (2015) ALMA Partnership, Brogan, C. L., Pérez, L. M., et al. 2015, ApJ, 808, L3
- Andre & Montmerle (1994) Andre, P., & Montmerle, T. 1994, ApJ, 420, 837
- Andrews et al. (2011a) Andrews, S. M., Rosenfeld, K. A., Wilner, D. J., & Bremer, M. 2011a, ApJ, 742, L5
- Andrews et al. (2011b) Andrews, S. M., Wilner, D. J., Espaillat, C., et al. 2011b, ApJ, 732, 42
- Andrews et al. (2009) Andrews, S. M., Wilner, D. J., Hughes, A. M., Qi, C., & Dullemond, C. P. 2009, ApJ, 700, 1502
- Andrews et al. (2012) Andrews, S. M., Wilner, D. J., Hughes, A. M., et al. 2012, ApJ, 744, 162
- Andrews et al. (2016) Andrews, S. M., Wilner, D. J., Zhu, Z., et al. 2016, ApJ, 820, L40
- Ansdell et al. (2016) Ansdell, M., Williams, J. P., van der Marel, N., et al. 2016, ApJ, 828, 46
- Bai & Stone (2013) Bai, X.-N., & Stone, J. M. 2013, ApJ, 769, 76
- Barenfeld et al. (2016) Barenfeld, S. A., Carpenter, J. M., Ricci, L., & Isella, A. 2016, ApJ, 827, 142
- Bell et al. (2015) Bell, C. P. M., Mamajek, E. E., & Naylor, T. 2015, MNRAS, 454, 593
- Bergin et al. (2016) Bergin, E. A., Du, F., Cleeves, L. I., et al. 2016, ApJ, 831, 101
- Bisschop et al. (2008) Bisschop, S. E., Jørgensen, J. K., Bourke, T. L., Bottinelli, S., & van Dishoeck, E. F. 2008, A&A, 488, 959
- Borget et al. (2016) Borget, F., Müller, S., Grote, D., & Theulé. 2016, A&A, In press
- Bruderer (2013) Bruderer, S. 2013, A&A, 559, A46
- Butner et al. (1995) Butner, H. M., Lada, E. A., & Loren, R. B. 1995, ApJ, 448, 207
- Caselli et al. (2003) Caselli, P., van der Tak, F. F. S., Ceccarelli, C., & Bacmann, A. 2003, A&A, 403, L37
- Caselli et al. (2002) Caselli, P., Walmsley, C. M., Zucconi, A., et al. 2002, ApJ, 565, 344
- Cauley & Johns-Krull (2014) Cauley, P. W., & Johns-Krull, C. M. 2014, ApJ, 797, 112
- Ceccarelli et al. (2014) Ceccarelli, C., Caselli, P., Bockelée-Morvan, D., et al. 2014, Protostars and Planets VI, 859
- Ceccarelli et al. (2001) Ceccarelli, C., Loinard, L., Castets, A., et al. 2001, A&A, 372, 998
- Chiang et al. (2001) Chiang, E. I., Joung, M. K., Creech-Eakman, M. J., et al. 2001, ApJ, 547, 1077
- Cieza et al. (2016) Cieza, L. A., Casassus, S., Tobin, J., et al. 2016, Nature, 535, 258
- Cleeves (2016) Cleeves, L. I. 2016, ApJ, 816, L21
- Cleeves et al. (2014a) Cleeves, L. I., Bergin, E. A., & Adams, F. C. 2014a, ApJ, 794, 123
- Cleeves et al. (2014b) Cleeves, L. I., Bergin, E. A., Alexander, C. M. O. ., et al. 2014b, Science, 345, 1590
- Cleeves et al. (2011) Cleeves, L. I., Bergin, E. A., Bethell, T. J., et al. 2011, ApJ, 743, L2
- Cleeves et al. (2016) Cleeves, L. I., Öberg, K. I., Wilner, D. J., et al. 2016, ApJ, 832, 110
- Cordier et al. (2008) Cordier, D., Mousis, O., Lunine, J. I., Moudens, A., & Vuitton, V. 2008, ApJ, 689, L61
- Dalgarno & Lepp (1984) Dalgarno, A., & Lepp, S. 1984, ApJ, 287, L47
- Donati et al. (2011) Donati, J.-F., Gregory, S. G., Montmerle, T., et al. 2011, MNRAS, 417, 1747
- Donehew & Brittain (2011) Donehew, B., & Brittain, S. 2011, AJ, 141, 46
- Dong et al. (2015) Dong, R., Zhu, Z., & Whitney, B. 2015, ApJ, 809, 93
- Espaillat et al. (2010) Espaillat, C., D’Alessio, P., Hernández, J., et al. 2010, ApJ, 717, 441
- Favre et al. (2015) Favre, C., Bergin, E. A., Cleeves, L. I., et al. 2015, ApJ, 802, L23
- Flaherty et al. (2015) Flaherty, K. M., Hughes, A. M., Rosenfeld, K. A., et al. 2015, ApJ, 813, 99
- Flock et al. (2015) Flock, M., Ruge, J. P., Dzyurkevich, N., et al. 2015, A&A, 574, A68
- Furuya & Aikawa (2014) Furuya, K., & Aikawa, Y. 2014, ApJ, 790, 97
- Gaia Collaboration et al. (2016) Gaia Collaboration, Brown, A. G. A., Vallenari, A., et al. 2016, A&A, 595, A2
- Galli et al. (2015) Galli, P. A. B., Bertout, C., Teixeira, R., & Ducourant, C. 2015, A&A, 580, A26
- Gerner et al. (2015) Gerner, T., Shirley, Y. L., Beuther, H., et al. 2015, A&A, 579, A80
- Ghez et al. (1993) Ghez, A. M., Neugebauer, G., & Matthews, K. 1993, AJ, 106, 2005
- Gonzalez et al. (2015) Gonzalez, J.-F., Laibe, G., Maddison, S. T., Pinte, C., & Ménard, F. 2015, MNRAS, 454, L36
- Grady et al. (2010) Grady, C. A., Hamaguchi, K., Schneider, G., et al. 2010, ApJ, 719, 1565
- Graninger et al. (2015) Graninger, D., Öberg, K. I., Qi, C., & Kastner, J. 2015, ApJ, 807, L15
- Guidi et al. (2016) Guidi, G., Tazzari, M., Testi, L., et al. 2016, A&A, 588, A112
- Guilloteau et al. (2016) Guilloteau, S., Reboussin, L., Dutrey, A., et al. 2016, A&A, 592, A124
- Günther et al. (2010) Günther, H. M., Matt, S. P., Schmitt, J. H. M. M., et al. 2010, A&A, 519, A97
- Guzmán et al. (2015) Guzmán, V. V., Öberg, K. I., Loomis, R., & Qi, C. 2015, ApJ, 814, 53
- Guzmán et al. (2017) Guzmán, V. V., Öberg, K. I., Huang, J., Loomis, R., & Qi, C. 2017, ApJ, in press
- Herbig & Bell (1988) Herbig, G. H., & Bell, K. R. 1988, Third Catalog of Emission-Line Stars of the Orion Population : 3 : 1988
- Herbst et al. (1987) Herbst, E., Adams, N. G., Smith, D., & Defrees, D. J. 1987, ApJ, 312, 351
- Herbst et al. (2000) Herbst, E., Terzieva, R., & Talbi, D. 2000, MNRAS, 311, 869
- Huang & Öberg (2015) Huang, J., & Öberg, K. I. 2015, ApJ, 809, L26
- Huang et al. (2016) Huang, J., Öberg, K. I., & Andrews, S. M. 2016, ApJ, 823, L18
- Hughes et al. (2008) Hughes, A. M., Wilner, D. J., Qi, C., & Hogerheijde, M. R. 2008, ApJ, 678, 1119
- Isella et al. (2012) Isella, A., Pérez, L. M., & Carpenter, J. M. 2012, ApJ, 747, 136
- Isella et al. (2007) Isella, A., Testi, L., Natta, A., et al. 2007, A&A, 469, 213
- Isella et al. (2016) Isella, A., Guidi, G., Testi, L., et al. 2016, Phys. Rev. Lett., 117, 251101
- Jacq et al. (1993) Jacq, T., Walmsley, C. M., Mauersberger, R., et al. 1993, A&A, 271, 276
- Jonkheid et al. (2007) Jonkheid, B., Dullemond, C. P., Hogerheijde, M. R., & van Dishoeck, E. F. 2007, A&A, 463, 203
- Jørgensen et al. (2016) Jørgensen, J. K., van der Wiel, M. H. D., Coutens, A., et al. 2016, A&A, 595, A117
- Kenyon et al. (1994) Kenyon, S. J., Dobrzycka, D., & Hartmann, L. 1994, AJ, 108, 1872
- Madhusudhan et al. (2014) Madhusudhan, N., Amin, M. A., & Kennedy, G. M. 2014, ApJ, 794, L12
- Mangum & Shirley (2015) Mangum, J. G., & Shirley, Y. L. 2015, PASP, 127, 266
- Mannings & Sargent (1997) Mannings, V., & Sargent, A. I. 1997, ApJ, 490, 792
- Mathews et al. (2013) Mathews, G. S., Klaassen, P. D., Juhász, A., et al. 2013, A&A, 557, A132
- Meier et al. (1998) Meier, R., Owen, T. C., Jewitt, D. C., et al. 1998, Science, 279, 1707
- Menu et al. (2014) Menu, J., van Boekel, R., Henning, T., et al. 2014, A&A, 564, A93
- Miettinen et al. (2011) Miettinen, O., Hennemann, M., & Linz, H. 2011, A&A, 534, A134
- Millar et al. (1989) Millar, T. J., Bennett, A., & Herbst, E. 1989, ApJ, 340, 906
- Miotello et al. (2014) Miotello, A., Bruderer, S., & van Dishoeck, E. F. 2014, A&A, 572, A96
- Mitchell (1984) Mitchell, G. F. 1984, ApJS, 54, 81
- Molter et al. (2016) Molter, E. M., Nixon, C. A., Cordiner, M. A., et al. 2016, AJ, 152, 42
- Montesinos et al. (2009) Montesinos, B., Eiroa, C., Mora, A., & Merín, B. 2009, A&A, 495, 901
- Müller et al. (2005) Müller, H. S. P., Schlöder, F., Stutzki, J., & Winnewisser, G. 2005, Journal of Molecular Structure, 742, 215
- Müller et al. (2001) Müller, H. S. P., Thorwirth, S., Roth, D. A., & Winnewisser, G. 2001, A&A, 370, L49
- Najita et al. (2015) Najita, J. R., Andrews, S. M., & Muzerolle, J. 2015, MNRAS, 450, 3559
- Nummelin et al. (1998) Nummelin, A., Bergman, P., Hjalmarson, Å., et al. 1998, ApJS, 117, 427
- Öberg et al. (2015a) Öberg, K. I., Furuya, K., Loomis, R., et al. 2015a, ApJ, 810, 112
- Öberg et al. (2015b) Öberg, K. I., Guzmán, V. V., Furuya, K., et al. 2015b, Nature, 520, 198
- Öberg et al. (2014) Öberg, K. I., Lauck, T., & Graninger, D. 2014, ApJ, 788, 68
- Öberg et al. (2011a) Öberg, K. I., Murray-Clay, R., & Bergin, E. A. 2011a, ApJ, 743, L16
- Öberg et al. (2012) Öberg, K. I., Qi, C., Wilner, D. J., & Hogerheijde, M. R. 2012, ApJ, 749, 162
- Öberg et al. (2010) Öberg, K. I., Qi, C., Fogel, J. K. J., et al. 2010, ApJ, 720, 480
- Öberg et al. (2011b) —. 2011b, ApJ, 734, 98
- Okuzumi et al. (2016) Okuzumi, S., Momose, M., Sirono, S.-i., Kobayashi, H., & Tanaka, H. 2016, ApJ, 821, 82
- Ortiz-León et al. (2016) Ortiz-León, G. N., Loinard, L., Kounkel, M. A., et al. 2016, ArXiv e-prints, arXiv:1611.06466
- Pagani et al. (1992) Pagani, L., Salez, M., & Wannier, P. G. 1992, A&A, 258, 479
- Panić & Hogerheijde (2009) Panić, O., & Hogerheijde, M. R. 2009, A&A, 508, 707
- Panić et al. (2009) Panić, O., Hogerheijde, M. R., Wilner, D., & Qi, C. 2009, A&A, 501, 269
- Pascucci et al. (2016) Pascucci, I., Testi, L., Herczeg, G. J., et al. 2016, ApJ, 831, 125
- Pavlyuchenkov et al. (2007) Pavlyuchenkov, Y., Semenov, D., Henning, T., et al. 2007, ApJ, 669, 1262
- Pérez et al. (2012) Pérez, L. M., Carpenter, J. M., Chandler, C. J., et al. 2012, ApJ, 760, L17
- Piétu et al. (2007) Piétu, V., Dutrey, A., & Guilloteau, S. 2007, A&A, 467, 163
- Pinilla et al. (2012) Pinilla, P., Birnstiel, T., Ricci, L., et al. 2012, A&A, 538, A114
- Pinilla et al. (2015) Pinilla, P., de Juan Ovelar, M., Ataiee, S., et al. 2015, A&A, 573, A9
- Pinte et al. (2008) Pinte, C., Padgett, D. L., Ménard, F., et al. 2008, A&A, 489, 633
- Piso et al. (2015) Piso, A.-M. A., Öberg, K. I., Birnstiel, T., & Murray-Clay, R. A. 2015, ApJ, 815, 109
- Prodanović et al. (2010) Prodanović, T., Steigman, G., & Fields, B. D. 2010, MNRAS, 406, 1108
- Qi (2001) Qi, C. 2001, PhD thesis, CALIFORNIA INSTITUTE OF TECHNOLOGY
- Qi et al. (2015) Qi, C., Öberg, K. I., Andrews, S. M., et al. 2015, ApJ, 813, 128
- Qi et al. (2008) Qi, C., Wilner, D. J., Aikawa, Y., Blake, G. A., & Hogerheijde, M. R. 2008, ApJ, 681, 1396
- Qi et al. (2013) Qi, C., Öberg, K. I., Wilner, D. J., et al. 2013, Science, 341, 630
- Quast et al. (2000) Quast, G. R., Torres, C. A. O., de La Reza, R., da Silva, L., & Mayor, M. 2000, in IAU Symposium, Vol. 200, IAU Symposium, 28
- Ramanlal et al. (2003) Ramanlal, J., Polyansky, O. L., & Tennyson, J. 2003, A&A, 406, 383
- Roberts et al. (2002) Roberts, H., Fuller, G. A., Millar, T. J., Hatchell, J., & Buckle, J. V. 2002, A&A, 381, 1026
- Roberts & Millar (2000) Roberts, H., & Millar, T. J. 2000, A&A, 361, 388
- Rosenfeld et al. (2013a) Rosenfeld, K. A., Andrews, S. M., Hughes, A. M., Wilner, D. J., & Qi, C. 2013a, ApJ, 774, 16
- Rosenfeld et al. (2013b) Rosenfeld, K. A., Andrews, S. M., Wilner, D. J., Kastner, J. H., & McClure, M. K. 2013b, ApJ, 775, 136
- Rosenfeld et al. (2012) Rosenfeld, K. A., Andrews, S. M., Wilner, D. J., & Stempels, H. C. 2012, ApJ, 759, 119
- Roueff et al. (2013) Roueff, E., Gerin, M., Lis, D. C., et al. 2013, Journal of Physical Chemistry A, 117, 9959
- Roueff et al. (2007) Roueff, E., Parise, B., & Herbst, E. 2007, A&A, 464, 245
- Ruge et al. (2013) Ruge, J. P., Wolf, S., Uribe, A. L., & Klahr, H. H. 2013, A&A, 549, A97
- Schilke et al. (2001) Schilke, P., Benford, D. J., Hunter, T. R., Lis, D. C., & Phillips, T. G. 2001, ApJS, 132, 281
- Schöier et al. (2002) Schöier, F. L., Jørgensen, J. K., van Dishoeck, E. F., & Blake, G. A. 2002, A&A, 390, 1001
- Schreyer et al. (2008) Schreyer, K., Guilloteau, S., Semenov, D., et al. 2008, A&A, 491, 821
- Schwarz et al. (2016) Schwarz, K. R., Bergin, E. A., Cleeves, L. I., et al. 2016, ApJ, 823, 91
- Shirley (2015) Shirley, Y. L. 2015, PASP, 127, 299
- Simon et al. (2000) Simon, M., Dutrey, A., & Guilloteau, S. 2000, ApJ, 545, 1034
- Sonneborn et al. (2000) Sonneborn, G., Tripp, T. M., Ferlet, R., et al. 2000, ApJ, 545, 277
- Tafalla et al. (2006) Tafalla, M., Santiago-García, J., Myers, P. C., et al. 2006, A&A, 455, 577
- Tazzari et al. (2016) Tazzari, M., Testi, L., Ercolano, B., et al. 2016, A&A, 588, A53
- Teague et al. (2015) Teague, R., Semenov, D., Guilloteau, S., et al. 2015, A&A, 574, A137
- Testi et al. (2016) Testi, L., Natta, A., Scholz, A., et al. 2016, A&A, 593, A111
- Thi et al. (2004) Thi, W.-F., van Zadelhoff, G.-J., & van Dishoeck, E. F. 2004, A&A, 425, 955
- Torres et al. (2006) Torres, C. A. O., Quast, G. R., da Silva, L., et al. 2006, A&A, 460, 695
- Turner (2001) Turner, B. E. 2001, ApJS, 136, 579
- van den Ancker et al. (1998) van den Ancker, M. E., de Winter, D., & Tjin A Djie, H. R. E. 1998, A&A, 330, 145
- van der Marel et al. (2016) van der Marel, N., van Dishoeck, E. F., Bruderer, S., et al. 2016, A&A, 585, A58
- van der Walt et al. (2014) van der Walt, S., Schönberger, J. L., Nunez-Iglesias, J., et al. 2014, PeerJ, 2, e453
- van Dishoeck et al. (1995) van Dishoeck, E. F., Blake, G. A., Jansen, D. J., & Groesbeck, T. D. 1995, ApJ, 447, 760
- van Dishoeck et al. (2003) van Dishoeck, E. F., Thi, W.-F., & van Zadelhoff, G.-J. 2003, A&A, 400, L1
- van Zadelhoff et al. (2001) van Zadelhoff, G.-J., van Dishoeck, E. F., Thi, W.-F., & Blake, G. A. 2001, A&A, 377, 566
- Visser et al. (2009) Visser, R., van Dishoeck, E. F., Doty, S. D., & Dullemond, C. P. 2009, A&A, 495, 881
- Walmsley et al. (1987) Walmsley, C. M., Hermsen, W., Henkel, C., Mauersberger, R., & Wilson, T. L. 1987, A&A, 172, 311
- Walsh et al. (2016) Walsh, C., Loomis, R. A., Öberg, K. I., Kama, M., et al. 2016, ApJ, 823, L10
- Walsh et al. (2010) Walsh, C., Millar, T. J., & Nomura, H. 2010, ApJ, 722, 1607
- Walsh et al. (2015) Walsh, C., Nomura, H., & van Dishoeck, E. 2015, A&A, 582, A88
- Watson (1976) Watson, W. D. 1976, Reviews of Modern Physics, 48, 513
- Willacy (2007) Willacy, K. 2007, ApJ, 660, 441
- Wilson (1999) Wilson, T. L. 1999, Reports on Progress in Physics, 62, 143
- Wood et al. (2004) Wood, B. E., Linsky, J. L., Hébrard, G., et al. 2004, ApJ, 609, 838
- Woods & Willacy (2009) Woods, P. M., & Willacy, K. 2009, ApJ, 693, 1360
- Wootten (1987) Wootten, A. 1987, in IAU Symposium, Vol. 120, Astrochemistry, ed. M. S. Vardya & S. P. Tarafdar, 311–318
- Yen et al. (2016) Yen, H.-W., Koch, P. M., Liu, H. B., et al. 2016, ApJ, 832, 204
- Zhang et al. (2015) Zhang, K., Blake, G. A., & Bergin, E. A. 2015, ApJ, 806, L7
Appendix A Spectral Setups
| Frequency | Bandwidth | Resolution |
|---|---|---|
| (GHz) | (MHz) | (MHz) |
| Lower sideband | ||
| 241.56155 | 58.6 | 0.061 |
| 241.700219 | 58.6 | 0.061 |
| 241.767224 | 58.6 | 0.061 |
| 241.791431 | 58.6 | 0.061 |
| 245.53288 | 117.2 | 0.061 |
| 245.5634219 | 117.2 | 0.061 |
| Upper sideband | ||
| 256.3366289 | 58.6 | 0.061 |
| 257.527444 | 58.6 | 0.061 |
| 258.156996 | 58.6 | 0.061 |
| 258.2558259 | 58.6 | 0.061 |
| 258.9421992 | 58.6 | 0.061 |
| 259.011787 | 58.6 | 0.061 |
| 260.255342 | 58.6 | 0.061 |
| 260.51802 | 58.6 | 0.061 |
| Frequency | Bandwidth | Resolution |
|---|---|---|
| (GHz) | (MHz) | (MHz) |
| Lower Sideband | ||
| 216.37332 | 58.6 | 0.061 |
| 216.11258 | 58.6 | 0.061 |
| 217.10498 | 58.6 | 0.061 |
| 217.23853 | 58.6 | 0.061 |
| 218.475632 | 58.6 | 0.061 |
| 218.760066 | 58.6 | 0.061 |
| 219.560358 | 58.6 | 0.061 |
| 220.3986842 | 58.6 | 0.061 |
| Upper Sideband | ||
| 231.41027 | 58.6 | 0.061 |
| 231.3218283 | 58.6 | 0.061 |
| 231.220686 | 58.6 | 0.061 |
| 230.53800 | 58.6 | 0.061 |
| 234.935663 | 468.8 | 0.122 |
| Frequency | Bandwidth | Resolution |
|---|---|---|
| (GHz) | (MHz) | (MHz) |
| Lower Sideband | ||
| 249.054368 | 468.8 | 0.244 |
| 251.3143364 | 117.2 | 0.122 |
| 251.5273023 | 117.2 | 0.122 |
| Upper Sideband | ||
| 262.00426 | 234.4 | 0.122 |
| 265.886431 | 234.4 | 0.122 |
| Flux Calibrator | Date | Reference Frequency | Flux Density | Spectral Index |
|---|---|---|---|---|
| (GHz) | (Jy) | |||
| J1924-2914 | 2014 June 9 | 223.34197 | 3.90764 | -0.63934 |
| J0150+1800 | 2014 June 15aaFor the 1.1 mm observations of MWC 480/LkCa 15, we found that the original calibrated data delivered by ALMA specified the flux density model for J0510+1800 to be 1.03 Jy for all SPWs, which is about 20% lower than the result from querying the ALMA calibrator catalogue for the date of observation. An inquiry to the ALMA helpdesk indicated that this discrepancy was likely due to an inaccurate retrieval of the flux densities when generating the original reduction script. We therefore used NRAO’s analysisUtils package to update the flux density model to the one listed in this table. | 251.92326 | 1.22655 | -0.35351 |
| 2014 July 29 | 223.35276 | 1.173892 | -0.54114 | |
| 2015 June 6 | 223.33933 | 2.25581 | -0.32657 | |
| J1733-1304 | 2014 July 2bbThe calibration for the original delivered 1.4 mm HD 163296 data included a final flux rescaling step that used a model flux density of 0.99 Jy for J1733-1304 at 1.4 mm, which is about 20 lower than the model used in the initial flux calibration step as well as the value retrieved by querying the ALMA calibrator catalogue. After consultation with the ALMA helpdesk, we edited the reduction scripts to remove this final flux rescaling step. We verified that all other calibration scripts provided by ALMA (and available in the Archive) specify quasar flux models consistent with the ALMA calibrator catalogue. | 223.33105 | 1.28031 | -0.71777 |
| 2014 July 16 | 251.90750 | 1.130841 | -0.70073 |
Appendix B Channel Maps