The link between galaxy and black hole growth in the eagle simulation
Abstract
We investigate the connection between the star formation rate (SFR) of galaxies and their central black hole accretion rate (BHAR) using the eagle cosmological hydrodynamical simulation. We find, in striking concurrence with recent observational studies, that the SFR–BHAR relation for an AGN selected sample produces a relatively flat trend, whilst the BHAR–SFR relation for a SFR selected sample yields an approximately linear trend. These trends remain consistent with their instantaneous equivalents even when both SFR and BHAR are time-averaged over a period of 100 Myr. There is no universal relationship between the two growth rates. Instead, SFR and BHAR evolve through distinct paths that depend strongly on the mass of the host dark matter halo. The galaxies hosted by haloes of mass M⊙ grow steadily, yet black holes (BHs) in these systems hardly grow, yielding a lack of correlation between SFR and BHAR. As haloes grow through the mass range M⊙ BHs undergo a rapid phase of non-linear growth. These systems yield a highly non-linear correlation between the SFR and BHAR, which are non-causally connected via the mass of the host halo. In massive haloes ( M⊙) both SFR and BHAR decline on average with a roughly constant scaling of SFR/BHAR . Given the complexity of the full SFR–BHAR plane built from multiple behaviours, and from the large dynamic range of BHARs, we find the primary driver of the different observed trends in the SFR–BHAR and BHAR–SFR relationships are due to sampling considerably different regions of this plane.
keywords:
galaxies: active – galaxies: evolution1 Introduction
Substantial effort has been dedicated both observationally and theoretically to identifying the link between the growth of galaxies and their central supermassive black holes (BHs). However, the nature of this relationship remains poorly understood. Indirect evidence of a causal connection has been suggested empirically based on the integrated properties of galaxies and their BH counterparts. For example, galaxy bulge mass () and the mass of the central BH () exhibit a tight, approximately linear correlation for bulge masses in excess of M⊙ (e.g, Magorrian et al., 1998; Kormendy & Ho, 2013; McConnell & Ma, 2013; Scott et al., 2013). However, at lower bulge mass, a steeper trend has been advocated (e.g, Scott et al., 2013; Greene et al., 2016). Additionally, the cosmic star formation rate (SFR) and black hole accretion rate (BHAR) densities broadly trace one another through time (e.g, Heckman et al., 2004; Aird et al., 2010; Madau & Dickinson, 2014).
A simple interpretation for these global relationships is that the growth rates that build these properties (i.e. the SFR of the galaxy and accretion rate of the BH) are proportional throughout their evolution, thus growing the two components in concert. More complex evolutionary scenarios have also been proposed. For example, a simple time-averaged relationship built from a common fuel reservoir of cold gas (Alexander & Hickox, 2012; Hickox et al., 2014), a rapid build up of galaxy and BH mass via merger induced starburst/quasar activity (e.g, Sanders et al., 1988; Di Matteo et al., 2005; Hopkins et al., 2008) or a mutual dependence on the mass or potential of the dark matter halo (Booth & Schaye, 2010, 2011; Bower et al., 2017). In these scenarios the SFR and BHAR do not necessarily trace each other directly and the observed correlations may only appear in massive galaxies due to an averaging of very different histories. Furthermore, Peng (2007) and Jahnke & Macciò (2011) go as far as to suggest there is no causal connection of any kind, with correlations only appearing as result of a random walk.
To test these scenarios, numerous observational studies have attempted to identify a direct link between the intrinsic growth rates of galaxies and their central BHs. Studies that investigate the mean SFR (SFR) as a function of BHAR consistently find no evidence for a correlation for moderate-luminosity sources ( erg s-1; e.g, Lutz et al., 2010; Harrison et al., 2012; Page et al., 2012; Mullaney et al., 2012a; Rosario et al., 2012; Stanley et al., 2015; Azadi et al., 2015). For high-luminosity sources ( > erg s) however, there has been significant disagreement as to if this relation becomes positively correlated (e.g. Lutz et al., 2010), negatively correlated (e.g. Page et al., 2012) or continues to remain uncorrelated (e.g, Harrison et al., 2012; Rosario et al., 2012; Stanley et al., 2015; Azadi et al., 2015). These disparities between various works at the high-luminosity end are likely due to small number statistics and sample variance (Harrison et al., 2012), and indeed, recent studies using large sample sizes confirm the extension of a flat trend to higher luminosities (Stanley et al., 2015; Azadi et al., 2015).
A flat trend for the SFR–BHAR relation could potentially be interpreted as revealing an absence of a connection between SFR and BHAR. However, studies that have investigated the mean BHAR (BHAR) as a function of SFR consistently find a positive relationship (e.g, Rafferty et al., 2011; Symeonidis et al., 2011; Mullaney et al., 2012b; Chen et al., 2013; Delvecchio et al., 2015). Within the paradigm of a linear – relation due to a universal co-evolution of BH and galaxy growth, both approaches are expected to produce a consistent, similarly linear result (see appendix A for a derivation of why this is). Hickox et al. (2014) proposes a potential solution, suggesting that SFR and BHAR are connected on average over a period of 100 Myr, with a linear scaling. This relationship disappears when measured instantaneously owing to the rapid variability timescale of AGN, with respect to that of galactic star formation.
From a theoretical perspective, many simulations have focussed on the growth of BHs in galaxy mergers (e.g, Di Matteo et al., 2005; Hopkins et al., 2005). Whilst both star formation and BH accretion are typically enhanced during the merger proper, the extent of the connection between SFR and BHAR pre- and post-merger event remains unclear. Neistein & Netzer (2014) demonstrate through the use of a semi-analytical model that the observed correlations between galaxies and their central BHs can be reproduced when BH growth occurs only during merger induced starbursts. This could explain the lack of a correlation between growth rates in low-luminosity systems whilst allowing for mutual enhancement during the merger events themselves. Thacker et al. (2014) investigate the impact of various feedback models on the SFR–BHAR parameter space in a set of equal mass merger simulations. They find a complex evolution for individual systems, even when averaged over 20 Myrs. Any correlation found is strongly dependant on the feedback model chosen, with the post-merger phase showing the strongest evidence for a positive connection. Using a high-resolution hydrodynamical merger suite, Volonteri et al. (2015a) find BHAR and galaxy-wide SFR to be typically temporally uncorrelated. They suggest in Volonteri et al. (2015b) that the observed discrepancy between the SFR–BHAR and BHAR–SFR relations seen observationally are a result of sampling two different projections of the full bi-variate SFR–BHAR distribution whose build up is constructed from different behaviours between SFR and BHAR before, during and after the merger event.
It is now possible to extend these investigations to within a full cosmological context. Using the semi-analytical code galform, Gutcke et al. (2015) find a negative SFR–AGN luminosity correlation at low AGN luminosities, this then transitions to a strong positive correlation at high AGN luminosities. In the cosmological hydrodynamical simulation illustris, Sijacki et al. (2015) find a single trend in the SFR–BHAR relationship embedded in a large scatter, particularly in BHAR. Cosmological hydrodynamical simulations have the advantage of probing the entire galaxy population within a self consistent variety of environments with a diverse range of accretion and merger histories. Here we investigate to what extent galaxy and BH growth rates are connected within the “Evolution and Assembly of GaLaxies and their Environment” (eagle, Schaye et al., 2015; Crain et al., 2015) 111www.eaglesim.org 222Galaxy and halo catalogues of the simulation suite are publicly available at http://www.eaglesim.org/database.php (McAlpine et al., 2016). simulation. Adopting physical prescriptions for radiative cooling, star formation, stellar mass loss, BH accretion, BH mergers and both stellar and AGN feedback, eagle reproduces many observed properties of galaxies, BHs and the intergalacic medium with unprecedented fidelity (e.g, Schaye et al., 2015; Furlong et al., 2015b, a; Trayford et al., 2015; Schaller et al., 2015b; Lagos et al., 2015; Rahmati et al., 2015; Bahé et al., 2016; Crain et al., 2016; Rosas-Guevara et al., 2016; Segers et al., 2016; Trayford et al., 2016).
The paper is organised as follows. In Section 2 we provide a brief overview of the eagle simulation suite, including the subgrid model prescription and simulation output. The results are presented in Section 3. We examine the eagle predictions of the SFR–BHAR relationship for an AGN selected sample and the BHAR–SFR relationship for a SFR selected sample in Section 3.1, finding good agreement to recent observational findings. To investigate why these trends might be different, we explore the effect of time-averaging each growth rate and examine potential sampling biases in Section 3.2. Section 3.3 examines the influence of the host dark matter halo on both SFR and BHAR, finding that each exhibits a strong connection. Finally in Section 4, we discuss the changing relationship between SFR and BHAR as the halo grows and in Section 5, we present our conclusions.
2 Simulations & Subgrid model
eagle is a suite of cosmological hydrodynamical simulations comprising a range of periodic volumes, numerical resolutions and physical models. The simulations are run using a substantially modified version of the N-body TreePM smoothed particle hydrodynamics code gadget-3 (Springel, 2005), referred to as anarchy (Dalla Vecchia, in prep; see also see also appendix A of Schaye et al., 2015). For this study we focus on the largest run (Ref-L0100N1504), a cubic periodic volume of 100 comoving megaparsecs (cMpc) on each side, containing dark matter particles of mass M⊙ and an equal number of baryonic particles with an initial mass of M⊙. The subgrid parameters are those of the eagle reference (‘Ref-’) model, described fully by Schaye et al. (2015). Cosmological parameters are those inferred by Planck Collaboration et al. (2014), namely: , , , and .
2.1 Subgrid model
Processes operating below the numerical resolution of the simulation are treated as ‘subgrid’, implemented as a series of physical models. A detailed description of the full subgrid prescription is given by Schaye et al. (2015), with consideration to their influence on the reference model given by Crain et al. (2015). Here we give only a brief overview:
- •
- •
-
•
Stellar feedback is injected thermally and stochastically following the method of Dalla Vecchia & Schaye (2012).
-
•
BH seeding follows the prescription first introduced by Springel et al. (2005), whereby BHs are introduced as collisionless sink particles placed in the centres of dark matter haloes more massive than M⊙, which do not already contain one. BHs enter the simulation with a seed mass M⊙ and subsequently grow via accretion of surrounding gas or mergers with other BHs.
-
•
BHs grow via accretion of nearby material at a rate estimated from the modified Bondi-Hoyle formalism introduced in Rosas-Guevara et al. (2015). In short, the model is an extension of the spherically symmetric case of Bondi & Hoyle (1944) accounting now for the circularisation velocity of the surrounding gas, capped at the Eddington limit. Contrary to Rosas-Guevara et al. (2015), we do not use an additional boost factor ().
-
•
AGN feedback is implemented as a single mode, where it is injected thermally and stochastically into the surrounding interstellar medium as per Booth & Schaye (2009). Feedback is performed assuming a single efficiency, independent of halo mass and accretion rate.
As described by Crain et al. (2015), the subgrid model parameters are calibrated to reproduce the observed galaxy stellar mass function, galaxy sizes and normalisation of the – relation at .
2.2 Simulation output
2.2.1 Halo and galaxy identification
Outputs are stored as 29 ‘snapshots’ between redshifts and at which the complete state of every particle is recorded. In addition, 400 data-lite ‘snipshots’ are produced, with a typical temporal separation of 40-60 Myr. Bound structures are identified in post processing. First, dark matter haloes are identified using the ‘Friends of Friends’ (FOF) algorithm with linking length of times the mean interparticle separation (Davis et al., 1985). Then, bound substructures (or ‘subhaloes’) within these haloes are identified with the subfind program (Springel et al., 2001; Dolag et al., 2009) applied to the full particle distribution (dark matter, gas, stars and BHs). We associate the baryonic component of each subhalo with a galaxy, defined to be the central galaxy if it hosts the particle with the minimum gravitational potential and the remainder being classified as satellites.
Halo mass, , is defined as the total mass enclosed within , the radius at which the mean enclosed density is 200 times the critical density of the Universe. Galaxy mass, , is defined at the total stellar content belonging to a subhalo within a 30 pkpc spherical aperture as per Schaye et al. (2015).
2.2.2 Constructing histories of individual galaxies
In order to accurately trace the evolution of individual galaxies and their central BH for the analysis in Section 3.3, we require histories of a higher temporal resolution than is provided by the snipshot output. To do this, we follow galaxies and their central BH through cosmic time. As a galaxy descendant may have multiple progenitors, we trace the progenitor galaxy that is hosted along the ‘main progenitor branch’ of the merger tree as defined by Qu et al. (2017), the branch containing the greatest total mass along its history.
BHARs are recorded at each timestep with a typical spacing of yr, yielding an ‘instantaneous’ rate. These can then be time-averaged over longer durations. Quoted ‘instantaneous’ SFRs are taken from the snapshot output, where they are computed based on the current star forming state of the gas contained within the galaxy. Time-averaged SFR histories are constructed from the stellar particles born within the main progenitor that reside in the galaxy at the present day. As these particles store both their birth time and initial mass, collectively they create a robust history of star formation for that galaxy. However, as these histories are sensitive in their resolution to the number of particles sampled, only galaxies containing more than 200 particles ( M⊙) are considered for this study.
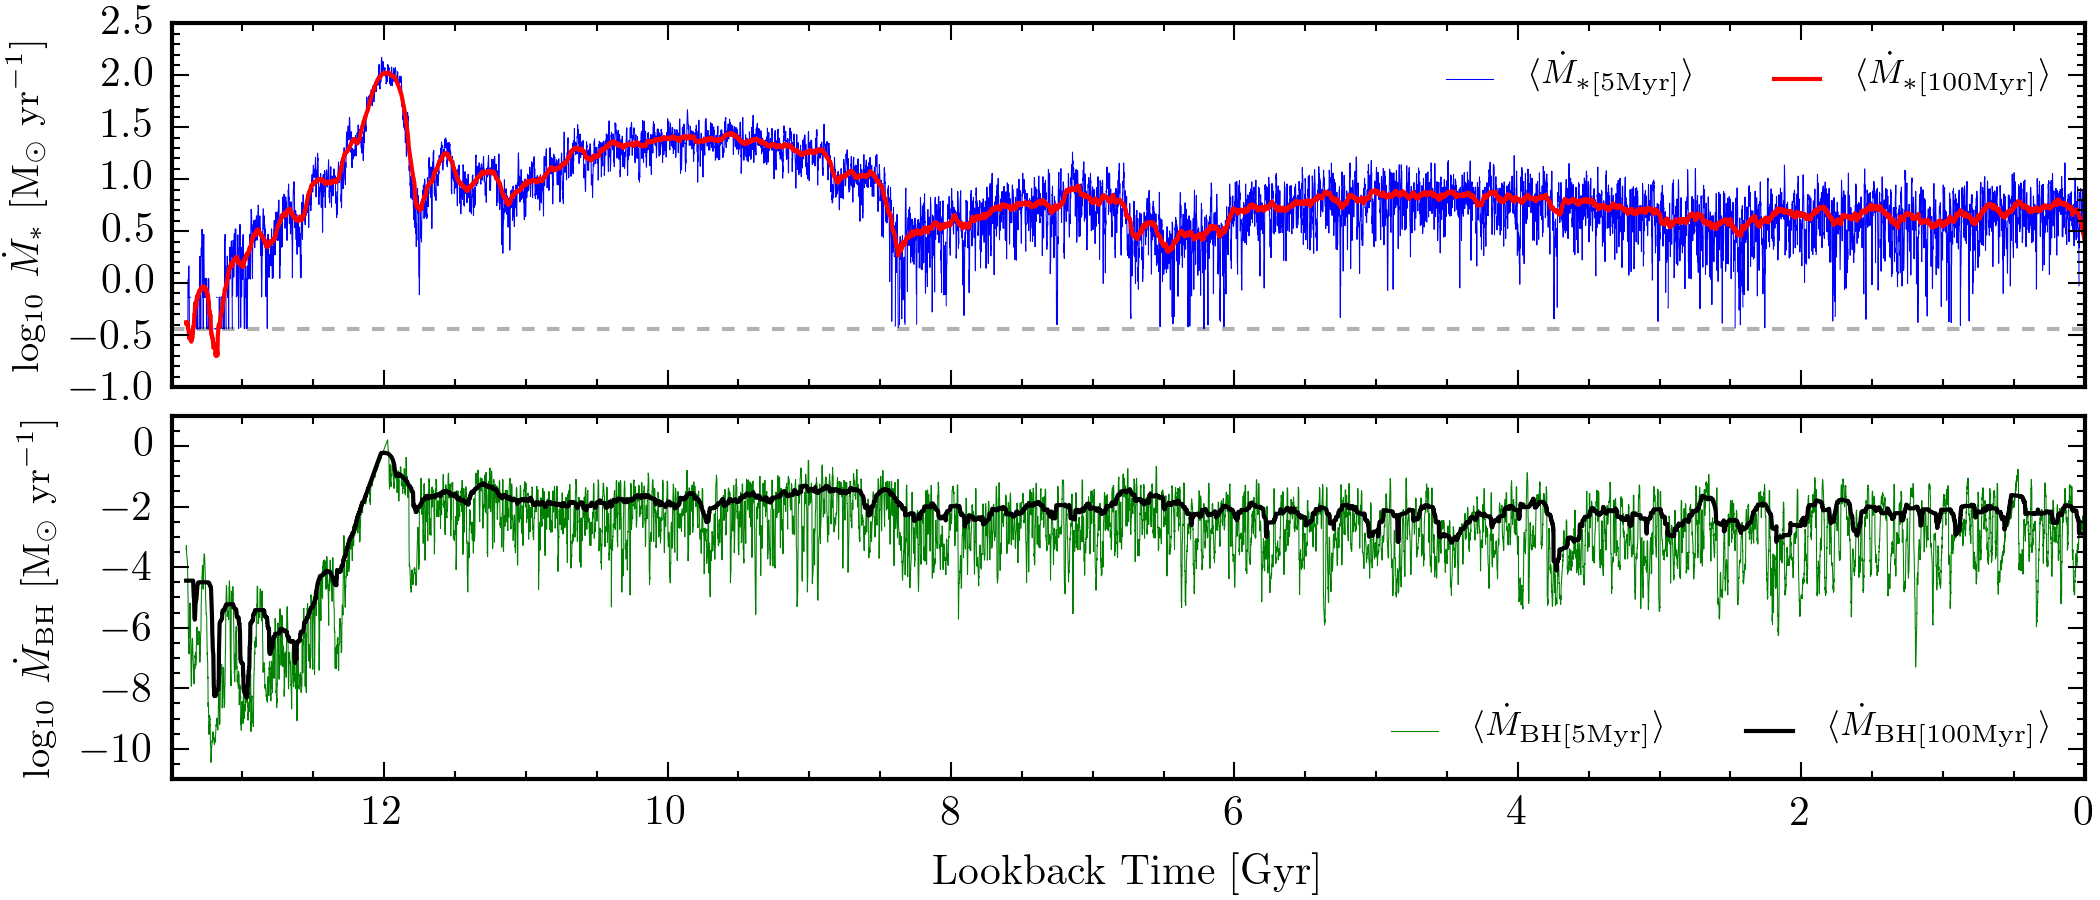
Figure 1 shows an example history of an individual galaxy’s SFR (top panel) and accretion rate of the central BH (bottom panel) through cosmic time taken from the methods described above. We show each growth rate time-averaged over 5 Myr (blue and green lines) and 100 Myr (red and black lines) to highlight the large difference in variability scatter between the two timescales. This is particularly severe for BHAR, where values recorded over short timescales do not return a good approximation of the long term average rate, differing in value by as much as 4 dex. We have adopted 100 Myr as our long averaging duration as it reflects an estimate of the effective timescale for empirical indicators of star formation using the far-infrared (FIR, the tracer of star formation for the observational studies compared to in Section 3.1, see the discussions by Neistein & Netzer, 2014; Volonteri et al., 2015a). Although there are similar features between SFR and BHAR through time for this individual case (for example a common peak at a lookback time of 12 Gyr), globally the two histories are quite different.
2.3 The – relation
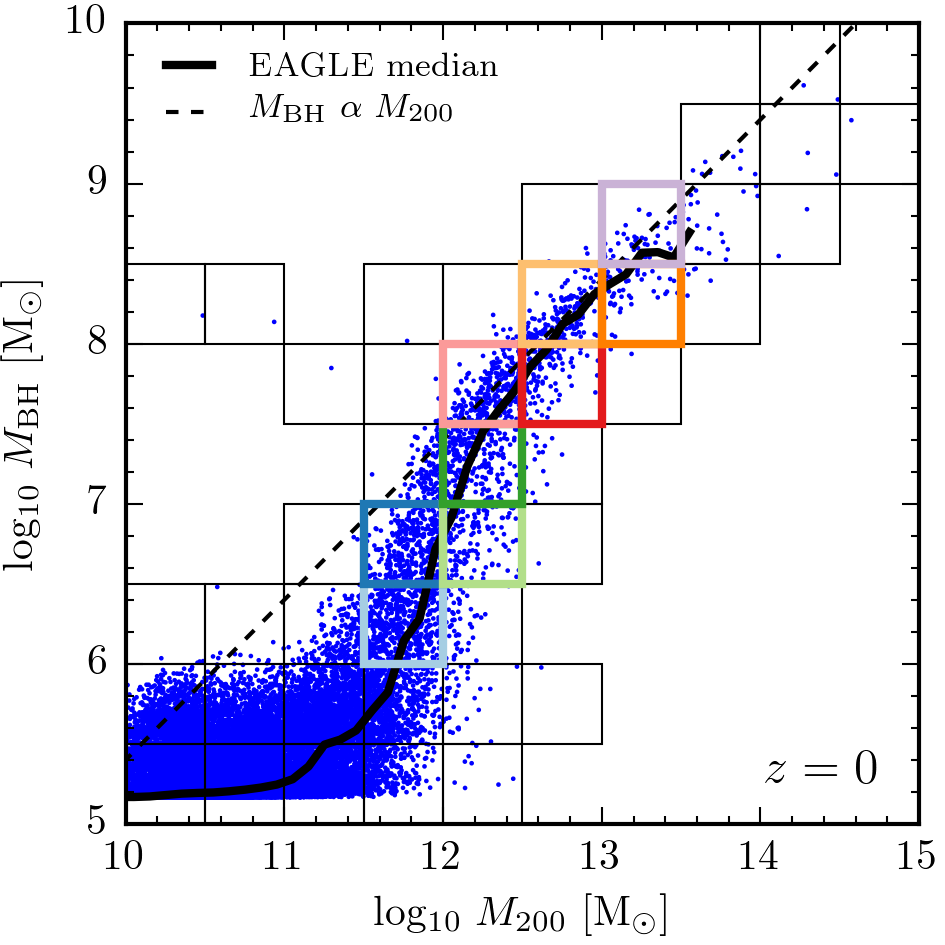
Figure 2 shows the – relation for central galaxies at . We have plotted as a function of halo mass rather than bulge or total stellar mass due to the crucial connection that has with both SFR and BHAR (see Section 3.3 onwards). We note that the – relation also follows the same behaviour (see Figure 1 of Barber et al., 2016) and throughout this description and can be interchanged. The overlaid two dimensional bins are for the continued investigation in Section 3.3, where they are fully described.
The empirical relationship between BH mass and that of the classical bulge is well described by a single power law at high mass (e.g, Magorrian et al., 1998; Kormendy & Ho, 2013; McConnell & Ma, 2013, with gradient values of satisfying eq. 2). Indeed, one of the calibration parameters of the simulation is to match the normalisation of this relationship. However, whereas traditionally this trend has been linearly extrapolated to lower-mass systems, eagle predicts a steepening of the trend. As a consequence, the relation between BH mass and the mass of the host galaxy or halo is not well described by a single power law. Interestingly, a steeper slope at intermediate masses is supported by recent observations of bulge (or pseudobulge) systems (e.g, Scott et al., 2013; Greene et al., 2016). When total stellar mass is considered as the independent variable, Reines & Volonteri (2015) predict Seyfert-like systems yield and alternate – relationship to previously measured early-type systems. However, each trend is consistent with a linear relation, with Seyfert-like systems harbouring a lower normalisation.
For eagle, BHs in massive systems ( M⊙) follow an approximately linear trend with halo mass (compare to the black dashed black line in Figure 2), but those hosted by haloes with mass M⊙ follow a much steeper relation and those in the lowest mass systems ( M⊙) plateau at the seed BH mass.
Bower et al. (2017) argue that multiple physical processes drive the relation between and . In low (high) mass systems stellar (AGN) feedback regulates the baryonic inflow to the galaxy, suppressing BH (continued stellar) growth. There is a critical transition halo mass ( M⊙, hereafter ) separating these two regulatory regimes. Within haloes, neither feedback process is dominant, and as a result BHs grow at a highly non-linear rate. These phases create the flat, supra-linear and linear regimes of BH growth seen in the integrated quantities of Figure 2 and have important consequences for the galaxy and BH growth rates investigated throughout this study.
2.4 Absolute calibration of SFRs
When comparing to the observed cosmic SFR density, Furlong et al. (2015b) found an almost constant -0.2 dex offset for redshifts . There is however continued uncertainty as to the absolute calibration of SFR indicators on which these observations rely. For example, Chang et al. (2015) find upon revisiting this calibration with the addition of WISE photometry to the full SDSS spectroscopic galaxy sample that the SFRs of local galaxies along the main-sequence are systematically lower than previously estimated by dex, yielding good agreement with the eagle prediction (see Figure 5 of Schaller et al., 2015a).
As the observational datasets compared to in Section 3.1 utilise an earlier calibration, we reduce all observed SFRs by 0.2 dex. The magnitude of this recalibration is shown as a red arrow in Figures 3 and 4. This serves to remove the known global systematic offset, making it simpler to focus on the trends with BHAR that are the topic of this paper.
3 Results
3.1 Comparison to observations
| log | log | * | log* | |||
| 0.20 < < 0.50 | ||||||
| 0.50 < < 0.80 | ||||||
| 0.80 < < 1.50 | ||||||
| 1.50 < < 2.50 | ||||||
| - | log | * | -* | |||
| 0.01 < < 0.25 | ||||||
| 0.25 < < 0.50 | ||||||
| 0.50 < < 0.80 | ||||||
| 0.80 < < 1.50 | ||||||
| 1.50 < < 2.50 |
We begin by comparing the predicted relationship between galaxy and BH growth rates to two recent observational studies using different selection criteria. Firstly, we explore the SFR versus BHAR relation for the AGN selected sample presented by Stanley et al. (2015). Secondly, we explore the BHAR versus SFR relation for the SFR selected sample presented by Delvecchio et al. (2015). Together they represent two of the largest sample sizes of their respective selection techniques, spanning multiple epochs. Large sample sizes such as these are key in overcoming the uncertainties inherent to low number statistics and in mitigating the potential redshift evolution biases that could be misinterpreted as an underlying trend.
As mentioned in Section 2.2.2, SFRs obtained via FIR tracers most likely probe the recent star formation history of a galaxy, rather than an instantaneous value. Therefore the comparative SFRs of eagle galaxies used in the analysis of Figures 3 and 4 are the time-averaged rate over the 100 Myr preceding the instantaneous BHAR measurement. However, when performing the equivalent analysis using the instantaneous values of SFR at the time of the BHAR measurement we find no difference in the result, attesting to the stability of star formation as a process.
3.1.1 SFR as a function of BHAR for an AGN selected sample
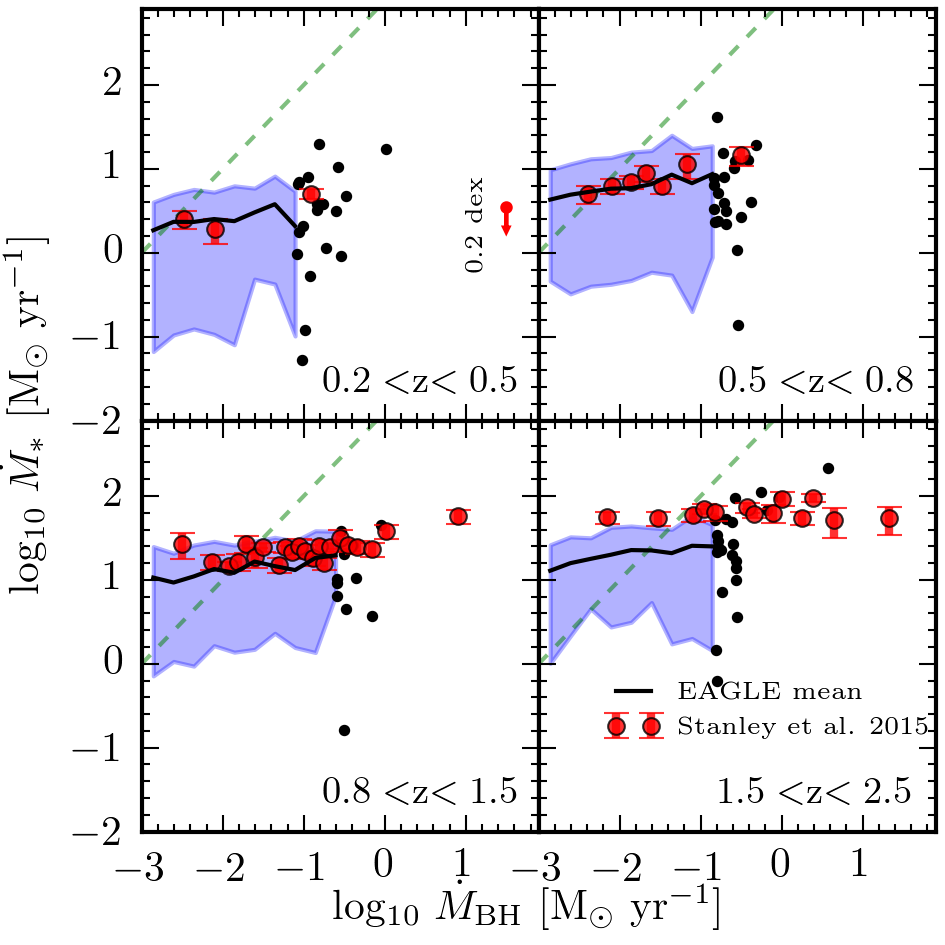
The study of Stanley et al. (2015) consists of X-ray detected AGN spanning over three orders of magnitude in luminosity ( erg s-1) for the redshift range . To compare to the data we convert their quoted bolometric AGN luminosities (derived from X-ray luminosities) to BHARs via
| (1) |
where is the speed of light and is the radiative efficiency of the accretion disk, which is assumed to be 0.1 (Shakura & Sunyaev, 1973). To emulate the sample selection of this study, we choose eagle galaxies based on a redshift independent detection limit of M⊙ yr-1, corresponding to erg s-1 according to eq. 1 and is equivalent to erg s-1 using the conversion methods outlined in Section 3.2 of Stanley et al. (2015).
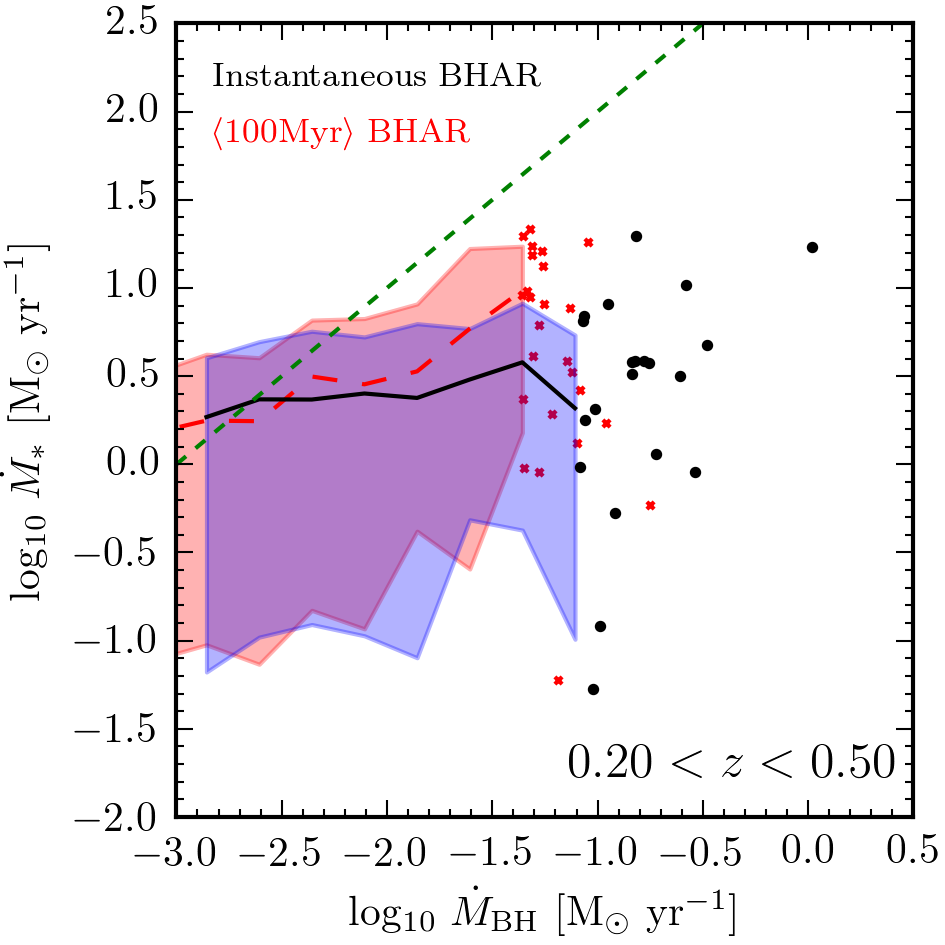
The results are presented in Figure 3, showing the mean SFR as a function of BHAR, represented by a solid black line. We see that for each redshift range the gradient of the relation remains shallow (note the same dynamic range is used for both axes), ranging in values (see Table 1) and is in striking agreement with the “remarkably flat” relation reported by Stanley et al. (2015). This is considerably flatter than one would predict for a linear – relation from a co-evolution of growth, which we represent as a dashed green line333Using eq. 4 with (McConnell & Ma, 2013). (see appendix A). The dynamic range of SFRs is modest, with a scatter of dex for all redshifts. The normalisations of SFR in the three lowest redshift ranges () are in good agreement with the observational estimates (within dex). However, the values in the highest redshift range () are systematically under predicted by dex over and above the recalibration discussed in Section 2.4. We note that this highest bin is potentially subject to the largest systematic over estimate ( dex) due to the large fraction (%) of undetected FIR sources (included as upper limits) in the observations (see Stanley et al., 2015).
3.1.2 BHAR as a function of SFR for a SFR selected sample
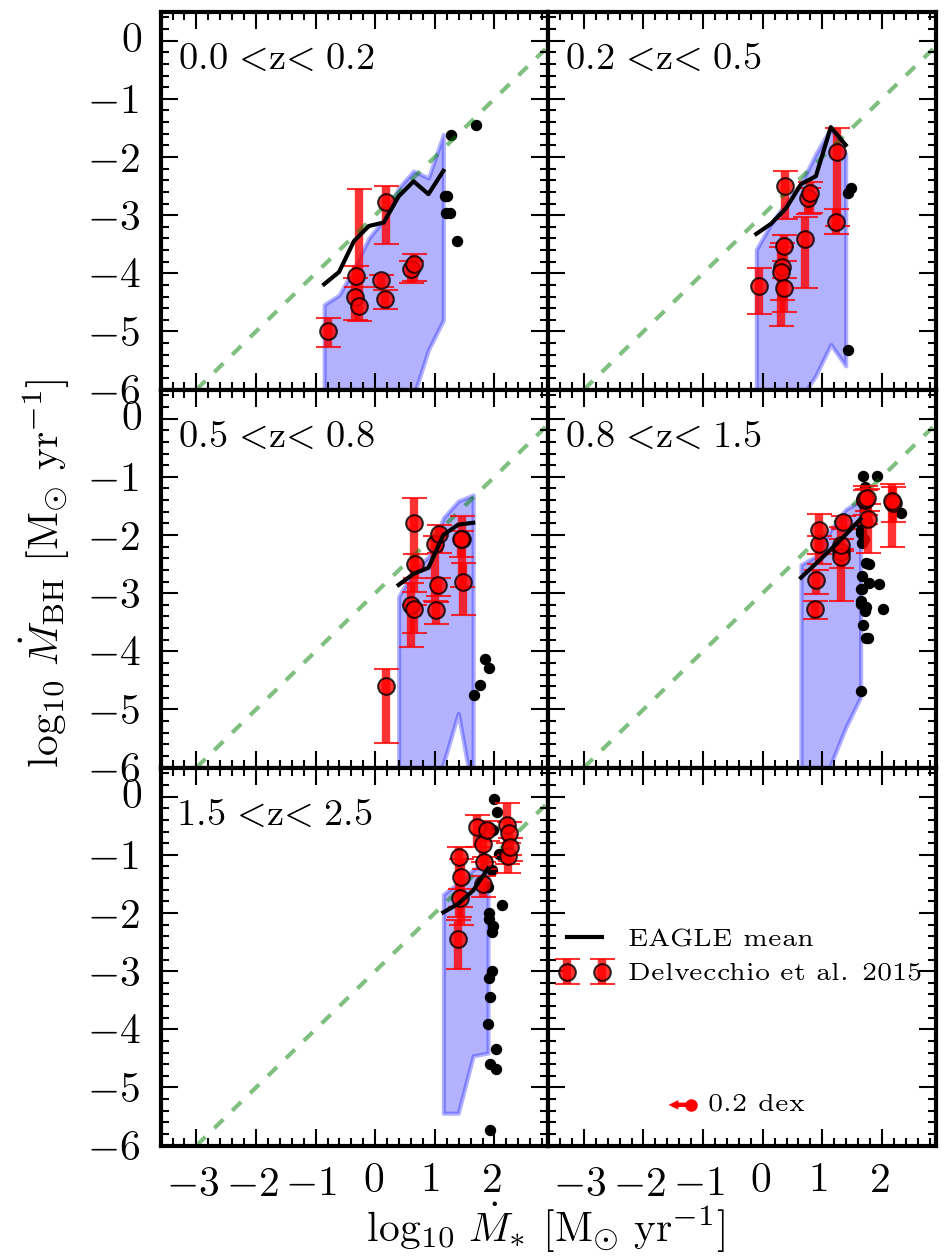
The study of Delvecchio et al. (2015) consists of star-forming galaxies detected out to . The selection limits in SFR are redshift dependent, corresponding to 0.2, 1.0, 3.0, 8.0 and 25.0 M⊙ yr-1 for the five redshift ranges covered by this study from low to high respectively. We note that the data points from Delvecchio et al. (2015) are segregated also in stellar mass, however for simplicity we make no such distinction.
The comparison is shown in Figure 4, showing the mean BHAR as a function of SFR as the solid black line. Again, eagle shows a good consistency with the observational measurements (shown in red), only over predicting BHAR in the lowest redshift range (). However, Delvecchio et al. (2015) mentions that the limited co-moving volume of this study at low redshift could potentially exclude the most luminous sources. The behaviour of the BHAR–SFR relation is quite different from the SFR–BHAR relation seen in Figure 3, adhering much closer to a linear trend. We see, uniformly, gradients close to unity (, see Table 1) in good agreement with the linear – relation expected for a co-evolution of growth, shown as a dashed green line (note again the same dynamic range is used for both axes). An additional difference is the spread of values in the minimisation axis ( for this figure). The distribution of SFRs in Figure 4 span a relatively narrow dynamic range, whereas here, BHARs vary as much as dex in the percentile region. In fact, the dynamic range of BHARs is so large that the small fraction of galaxies whose values dominate the mean are able to pull it outside this percentile range entirely in some places, suggesting the median to be a more suitable statistic to measure this trend.
Overall the agreement between eagle and the observations is excellent, particularly given that no information regarding this relation was considered during the calibration procedure. The difference in behaviour found empirically via alternate selection criteria is well reproduced by the simulation. We find, consistent with the Hickox et al. (2014) model and findings by Volonteri et al. (2015b), that SFR–BHAR for an AGN selected sample exhibits a relatively flat trend (), whilst that of BHAR with respect to SFR for a SFR selected sample is substantially steeper and close to unity (). However, within the paradigm of a linear – relation created through co-evolution of growth these results are both predicted to be linear (i.e, for both, see appendix A). Therefore either the underlying relationship itself is fundamentally non-linear, or a fuller understanding of the two processes is required. In the next section we continue to examine potential reasons as to the cause of this difference.
3.2 Understanding the BHAR-SFR relationship
In this section we explore two potential reasons why the SFR–BHAR and BHAR–SFR trends are not each consistent with a linear relationship. We examine the hypothesis that (1) growth rates have an underlying linear connection only on average, which is masked when the unstable growth rate is observed instantaneously and (2) how selection biases due to the inability to probe the complete SFR–BHAR plane may play a role.
3.2.1 A time-averaged SFR–BHAR connection
Hickox et al. (2014) suggested that an underlying correlation held between a stable (galactic star formation) and unstable (BH accretion) process on average could be washed out if the unstable property is measured instantaneously. That is to say, if one could observe X-ray luminosities of AGN sources over prolonged periods, the underlying relationship between the two properties would begin to emerge. Indeed, with a simple model that assumes SFR and BHAR are connected on average with a linear scaling over a period of 100 Myr, Hickox et al. (2014) reproduce the empirical behaviours of both the SFR–BHAR and BHAR–SFR relationships whilst retaining a scenario consistent with a linear co-evolution between galaxies and their central BHs. While it is not possible to test observationally due to the length of these timescales, we are able to test this hypothesis using the simulation.
Figure 5 is similar to the upper left panel of Figure 3. The region in blue, with the black solid line, shows the original analysis of the SFR–BHAR relation for the redshift range using instantaneous BHARs and SFRs that are time-averaged 100 Myr before the BH event. Overlaid in red, with the mean represented by a dashed line, is the same selection of galaxies (i.e, instantaneous M⊙ yr-1) with each growth rate now time-averaged over 100 Myr. Interestingly, although the high BHARs shift systematically to lower values on average444The shift (0.5 dex) to lower values in BHAR when averaging over 100 Myr arises due to the most luminous ‘detections’ commonly residing in peaks of the accretion rate history., both the dynamic range and slope of the mean remain broadly consistent with their instantaneous equivalents (, see Table 1). This behaviour remains for each redshift range explored by Stanley et al. (2015) (see Table 1). An alternate approach is to select galaxies in excess of M⊙ yr-1 on average (rather than instantaneously as done above) or indeed to prolong the averaging timescale to Myrs. However in each case, and for all redshift intervals, the gradient values remain well below unity (). This leads us to conclude that the average galaxy and BH growth rates for an AGN selected sample do not harbour an underlying global linear relationship.
3.2.2 Sampling different regions of the entire SFR-BHAR plane
As observational surveys are subject to various flux limitations, they can only sample particular regions of the full SFR–BHAR plane. If the global underlying relation is linear, and each property exhibits a moderate scatter, each sub sample should also return a linear result. However, as the findings of previous sections do not to support an underlying linear relation, and because the scatter is large, it is important to investigate the effect of this sampling.
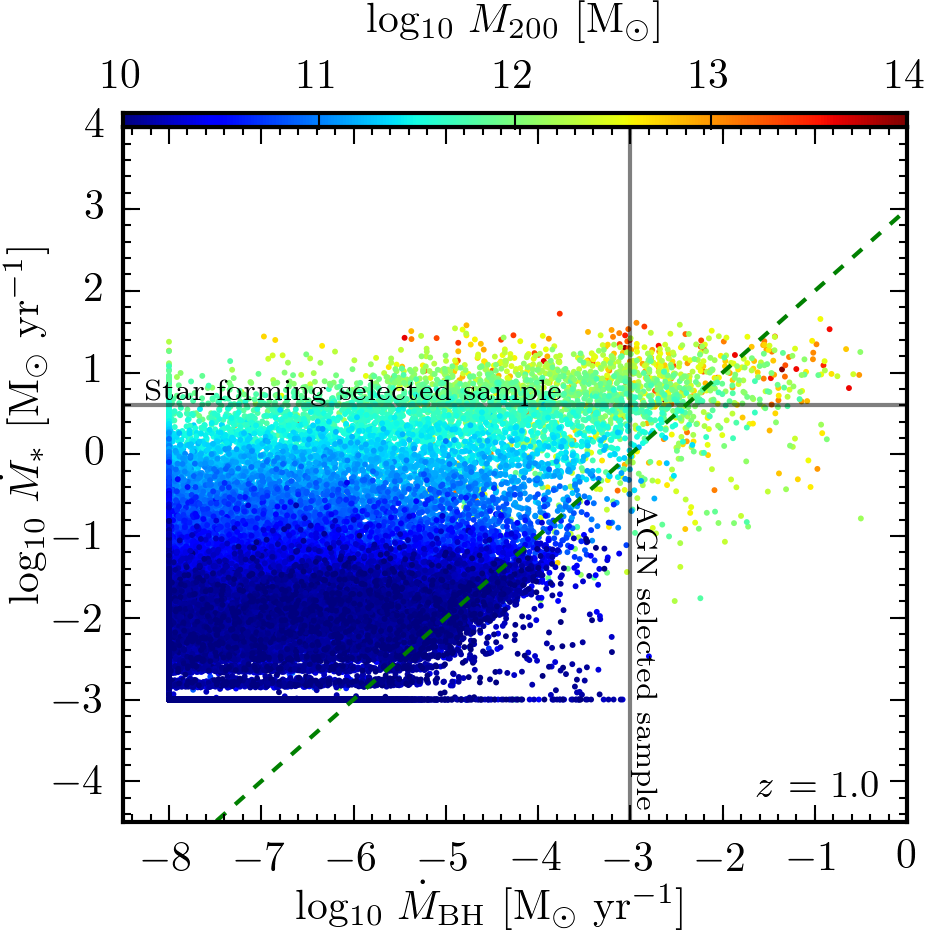
Figure 6 shows the complete SFR–BHAR plane for all central galaxies at . In order to eliminate any potential bias incurred via redshift evolution in either growth rate we consider a discrete redshift rather than the continuous ranges of Section 3.1. Each data point represents the instantaneous state of a single galaxy and its central BH, coloured by the halo mass. Values that are below M⊙ yr-1 for and M⊙ yr-1 for are treated as ‘zero’ and are clipped to these values. The approximate flux limit of the AGN selected sample by Stanley et al. (2015) is shown as a solid vertical line and the approximate flux limit of the SFR selected sample by Delvecchio et al. (2015) is shown as a horizontal solid line.
It is further apparent that the global relationship between SFR and BHAR is not simply linear (reference with the dashed green line). Instead, a complicated relationship arises due to an amalgamation of three distinct behaviours of BH growth dependent on the mass of the host dark matter halo (see next section). It is therefore crucial to consider the particular region sampled before arriving at a particular conclusion. AGN selected samples, such as that of Stanley et al. (2015), currently probe a relatively limited region at the tip of the SFR–BHAR plane. With the exception of a few sources with rates M⊙ yr-1, galaxies satisfying this selection criteria are distributed over a relatively narrow range of SFRs. As such, each bin of BHAR yields a very similar value of SFR, creating an approximately flat trend. SFR selected samples, such as that of Delvecchio et al. (2015), sample a not too dissimilar distribution of SFRs (this time due to the flux limit), however, the distribution of BHARs is much wider. This in turn yields a steeper relation. We note, that whilst the mean SFR provides a good proxy of the median SFR for an AGN selected study (compare columns 3 and 6 of Table 1), the mean BHAR for a SFR selected study is not a good proxy of the median value due to the distribution of BHARs having such a large scatter (compare columns 8 and 10 of Table 1). Although only the results from have been shown here, when investigated we find the results remain true independent of redshift.
We therefore conclude that the different behaviour found for the SFR–BHAR and BHAR–SFR relations recovered by observational studies is due to sampling considerably different regions of the full (not universally linear) SFR–BHAR plane. We now continue to investigate the nature of this relationship in the eagle simulation and its evolution through time.
3.3 The connection to the host dark matter halo
The relationship between SFR and BHAR seen in Figure 6 is complicated, seemingly not adhering to a simple universal trend. However, there is evidence that each property has a link with the mass of the host dark matter halo, highlighted in the change of the data point colours, which transition smoothly from blue to red with increasing SFR, and systematically shift rightward in BHAR (with a large scatter) at high halo mass.
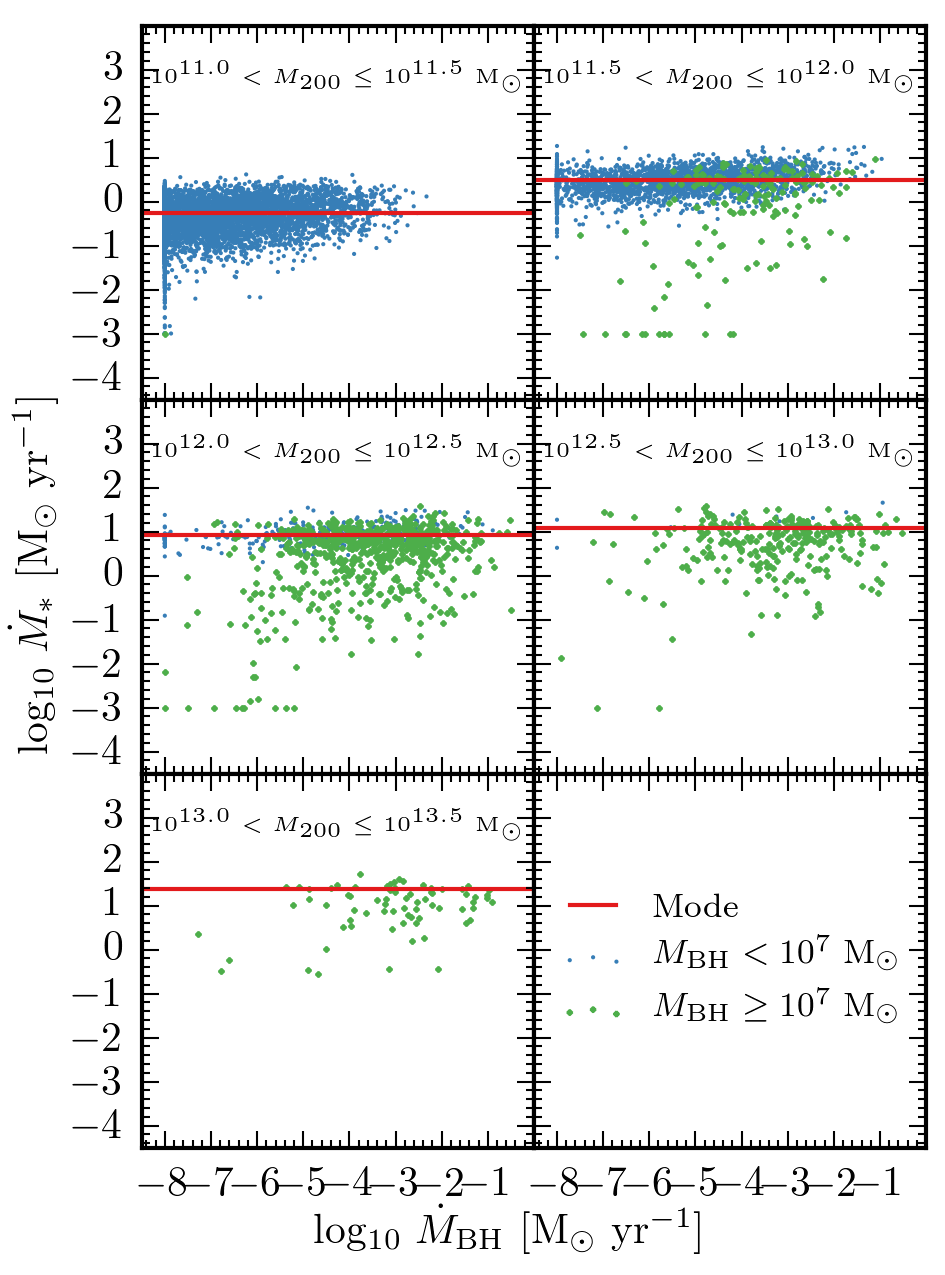
To examine this in more depth we sub categorize the central galaxies into five continuous ranges of halo mass, showing the growth rates in Figure 7. Here we find, in fact, that the global make up of the SFR–BHAR plane in Figure 6 is resolved into a collection of two dimensional strips, wide in their dynamic range of BHAR ( dex) yet generally much more compact in their SFR ( dex). Each strip hosts a characteristic value of SFR (defined as the mode of the distribution, shown as a horizontal solid red line) that continuously increases with increasing halo mass. This is in line with the ‘star forming main sequence’, where galaxies of increased stellar mass are seen to host larger SFRs (e.g, Elbaz et al., 2007). Interestingly, the rate of change with for this characteristic SFR does not remain constant, initially increasing by dex between M⊙ and reducing to almost zero in the regime M⊙. This is potential evidence that SFRs in massive systems are not keeping pace with the increasing baryonic inflow rates for increasing halo mass at fixed redshift (e.g, Correa et al., 2015). BHARs show a less continuous behaviour however, broadly categorized by two rudimentary states: BHs residing in haloes below M⊙ are typically accreting at a ‘low’ rate ( M⊙ yr-1); BHs residing in haloes more massive than M⊙ tend to be accreting at a ‘high’ rate ( M⊙ yr-1). The fraction of galaxies with M⊙ yr-1 for a given halo mass bin is 3%, 21%, 55%, 70% and 78% from M⊙ to M⊙ respectively. Those in haloes between the mass range M⊙ are in an intermediate state.
A fraction of galaxies hosted by haloes with M⊙ harbour extremely low, or even zero SFRs. As all of these galaxies host massive BHs ( M⊙, green dots), we are most likely seeing the effect of recent episodes of violent AGN feedback that have severely reduced the current star-forming capabilities of these systems. The cause, prevalence and impact of these feedback events will be the subject of a future paper.
We now investigate if the growth rate to halo connection evolves. To do this we return to the – relation shown for in Figure 2. The population is sub divided into two-dimensional bins, 0.5 dex on a side and outlined as squares. Here we investigate nine bins that lie along the median track through a continuous range spanning M⊙ in halo mass and M⊙ in BH mass, each outlined with a unique colour to reference their histories in Figures 8, 9 and 10.
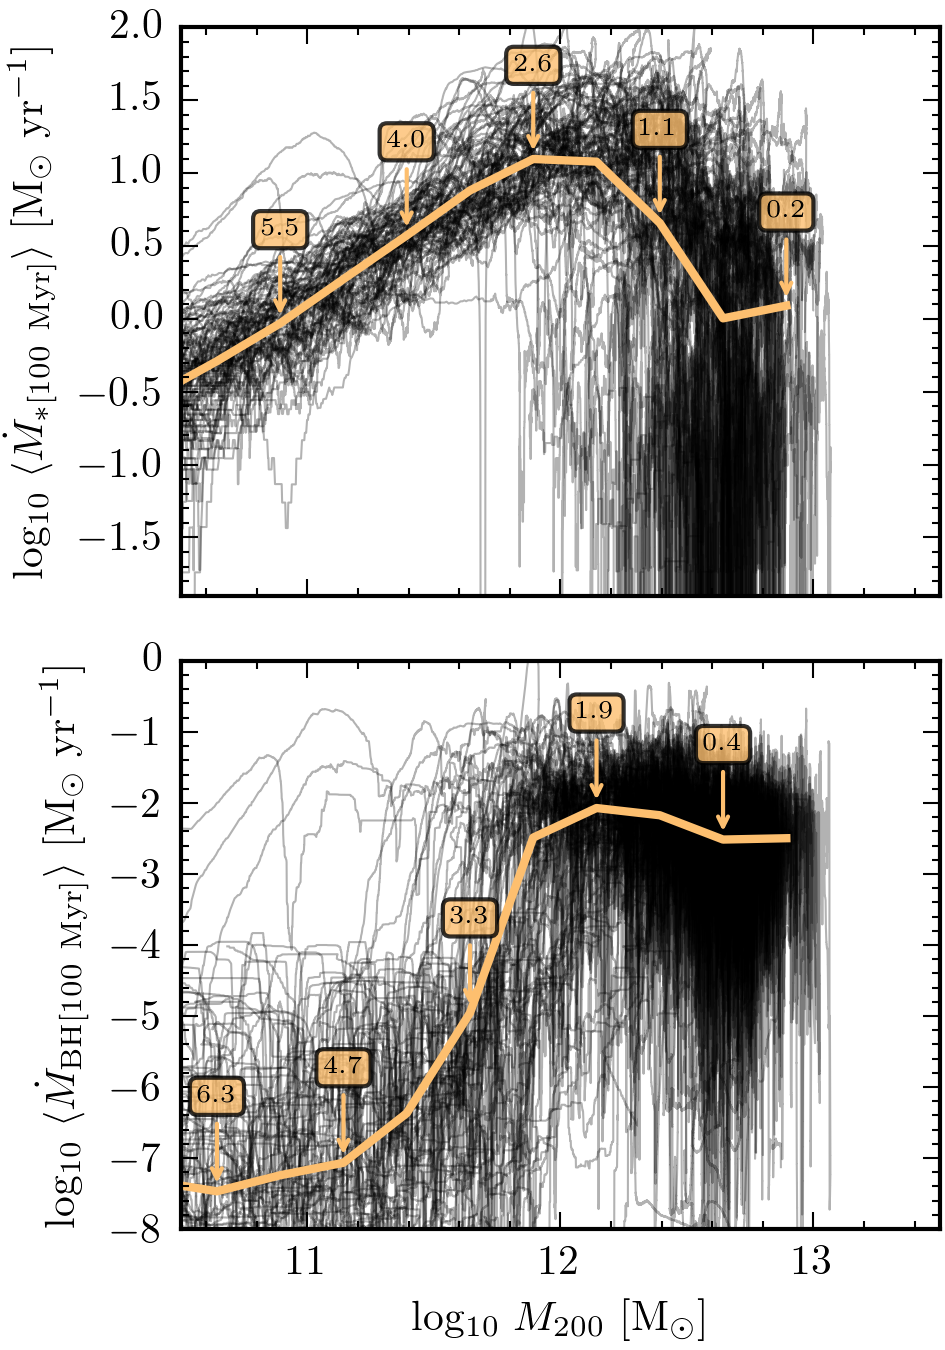
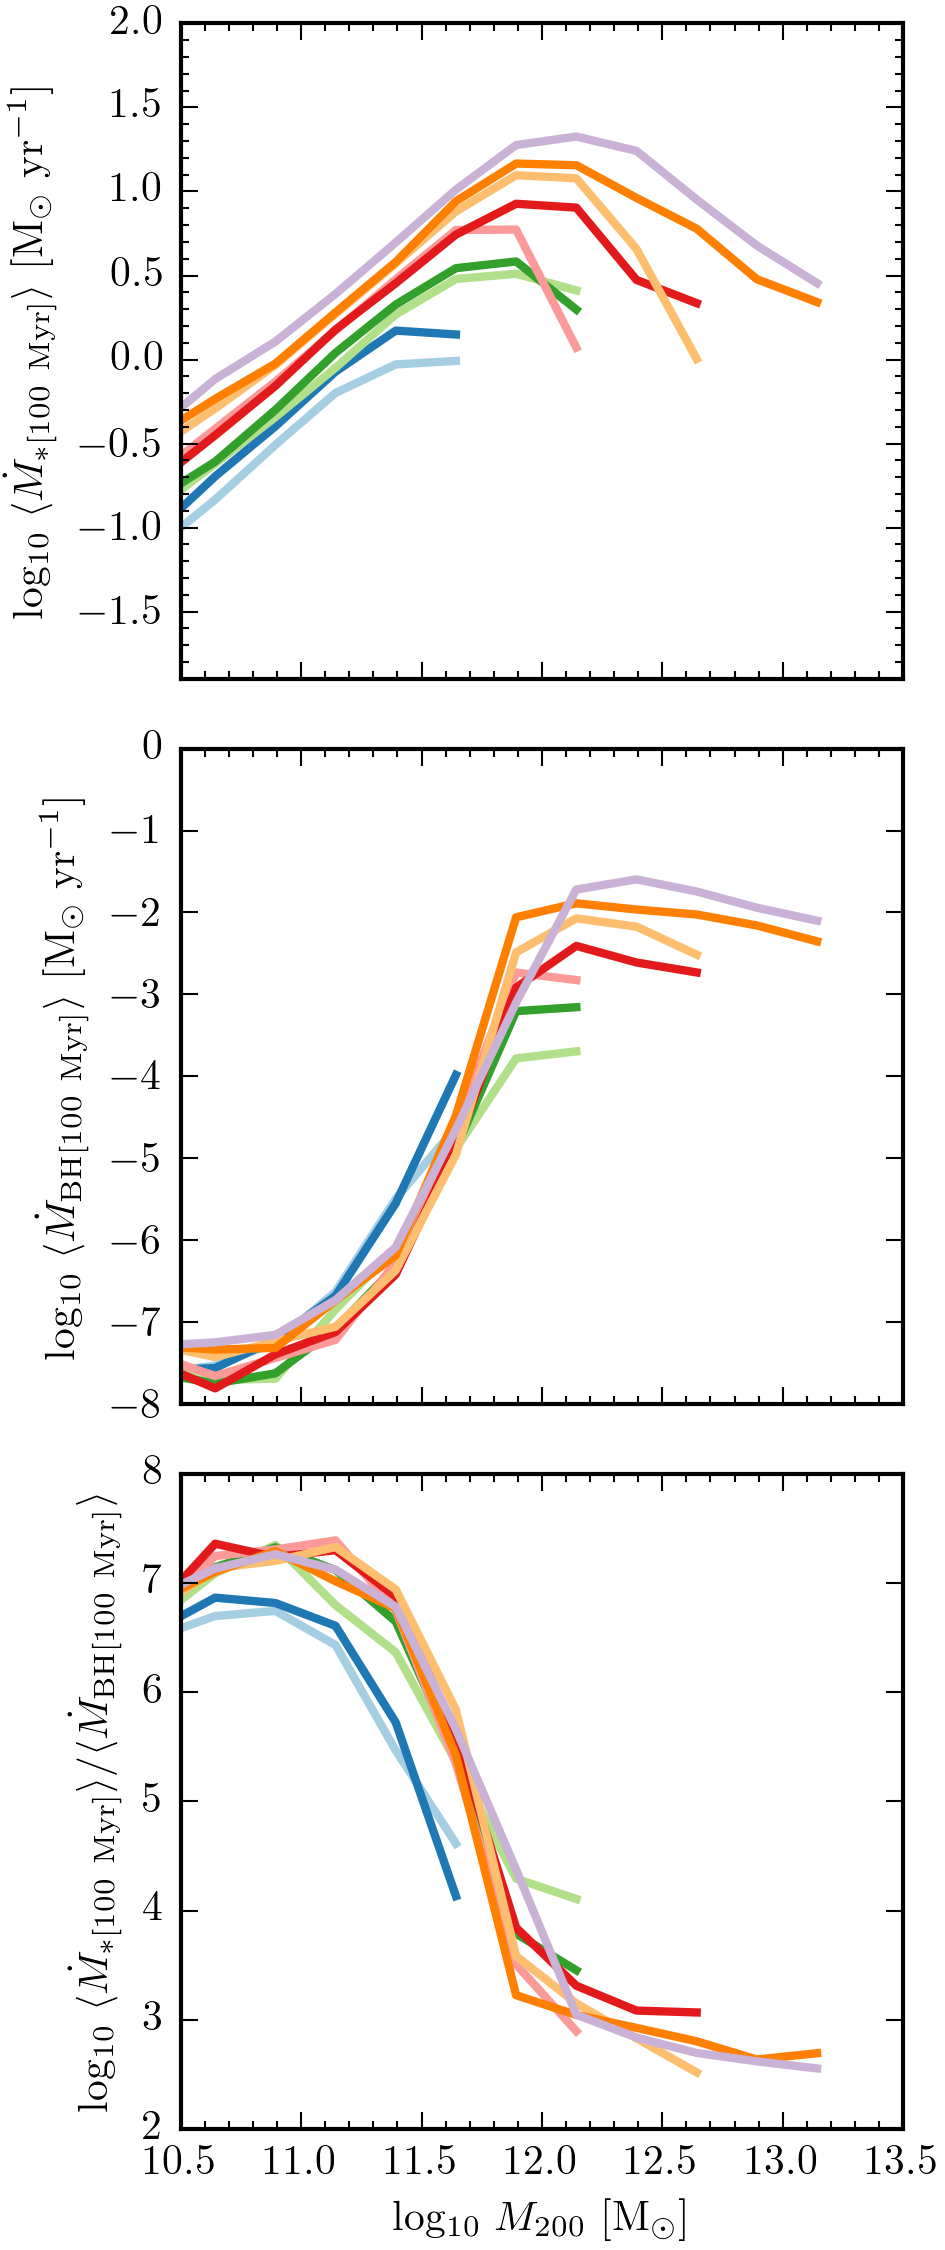
Figure 8 shows the evolution of the time-averaged SFR (top panel) and time-averaged BHAR (bottom panel) as a function of halo mass for all galaxies that come to reside in one of these two-dimensional bins at the present day (each solid black line is an individual history). We time-average both SFR and BHAR over 100 Myr in order to remove the inherent noise when considering instantaneous growth rates, and unveil the average trend. To eliminate galaxies that were previously classified as satellites of a more massive halo, we only consider central galaxies that have evolved monotonically in their halo mass (this excludes only of the centrals population). We see, that although individual histories can be quite different, on average galaxies and their central BHs do follow a well defined path. The median SFR and BHAR of this population subset for a given halo mass are over-plotted in yellow, annotated by the median redshift at which they were hosted by haloes of that particular mass. As expected, an increasing halo mass corresponds to a decreasing redshift.
There is a striking difference in behaviour seen between the two growth rates as the halo grows. Initially the SFR increases steadily with halo mass. As the halo grows more massive than M⊙ the SFRs begin to fluctuate between high and low values, yet overall there is a gradual decline of the median trend after this mass. Similarly, BHARs also change their behaviour around M⊙, rapidly transitioning from a low ( M⊙ yr-1) to high ( M⊙ yr-1) rate. As with SFRs, BHARs decline a similar amount after the halo mass M⊙ (note the many orders of magnitude difference in the scale of the growth rate axis between the two panels). We interpret therefore, given that the decline of SFR coincides with the peak of the rapid increase in BHAR, that AGN feedback is impeding the continued rise of SFRs in the most massive systems (see Figure 1 for an individual example of SFR reduction after the peak AGN activity at lookback time ). We note that the decrease in halo mass accretion rate with declining redshift and the dependence of halo cooling rates on halo mass will play additional roles in shaping these histories. However, given the severity of the SFR reduction seen immediately after the BHAR peak, AGN feedback appears to be a dominant factor in hindering further galaxy growth.
Figure 9 extends this analysis to each of the highlighted two-dimensional bins in Figure 2, now showing only the median lines for clarity. Remarkably, the evolutionary behaviour is similar regardless of the final position in the – plane. The normalisation of each history is set by the evolving baryonic inflow rate at fixed halo mass. As this rate decreases with redshift (e.g, Correa et al., 2015), so does the normalisation of both the SFR and BHAR seen here (as each population reaches a particular halo mass at different times). We include also in the bottom panel of Figure 9 the median ratio between SFR and BHAR shown in the two panels above. This shows that galaxy growth is dominant over BH growth by many orders of magnitude in low mass haloes ( M⊙). As BHARs settle to their ‘high’ rate in haloes of a mass above , the ratio between SFR and BHAR plateaus to an approximately constant value of . Note the trends of both Figures 8 and 9 are not directly observable as they rely on median time-averaged growth rates in both SFR and BHAR of 100 Myr whilst also being binned by halo mass.
4 Discussion
Throughout this investigation we have consistently found no evidence supporting a simple underlying relationship between the rate of a galaxy’s star formation and the accretion rate of its central BH. Instead, a mutual dependence of each property upon the mass of the host halo yields a more complex connection. It is interesting to examine, then, how the relation between the SFR and BHAR evolves for individual objects. In the following discussion, we will provide a physical interpretation based on the Bower et al. (2017) (hereafter B16) model for BH growth (for a similar interpretation on the importance of SN feedback to BH growth see Dubois et al., 2015; Habouzit et al., 2016). However, we stress the simulation results are themselves independent of any physical interpretation.
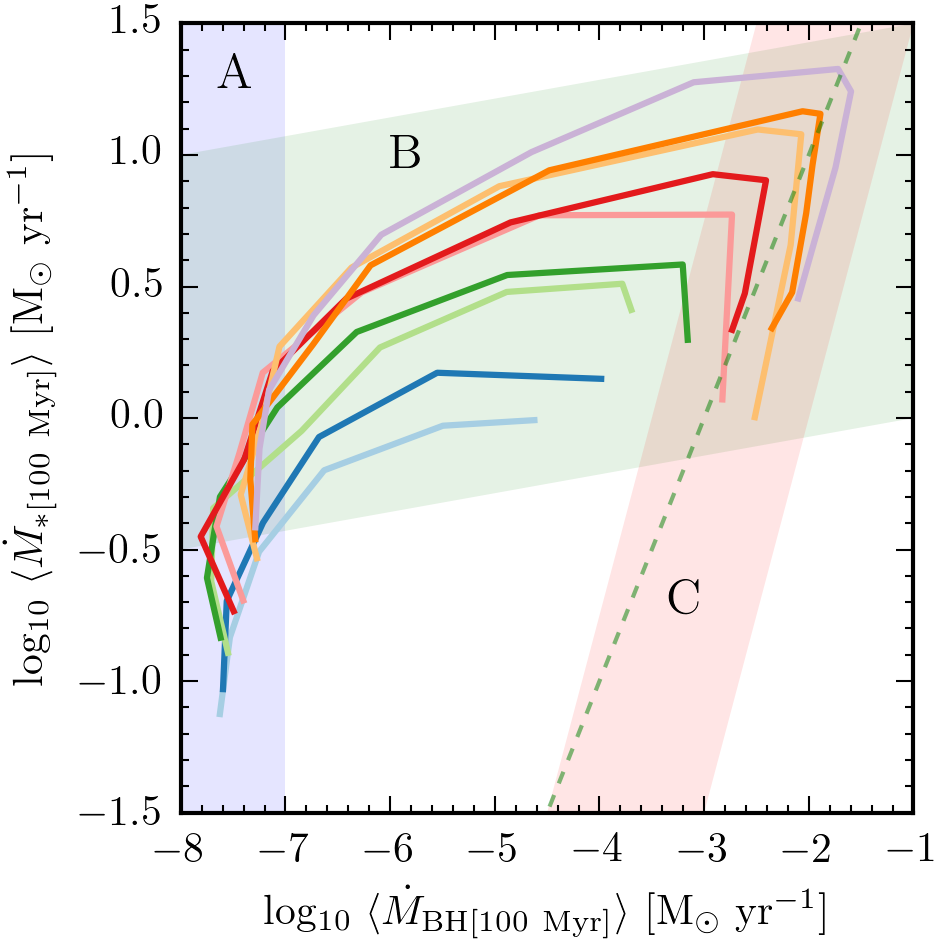
Figure 10 equates the median trends of the SFR and BHAR histories shown in Figure 9. This specifies the 100 Myr average SFR as a function of the 100 Myr average BHAR in equal spacings of halo mass. Three distinct trends between SFR and BHAR emerge as the halo evolves: the stellar feedback regulated phase (shaded blue), the non-linear BH growth phase (shaded green) and the AGN feedback regulated phase (shaded red).
-
•
Region A - The stellar feedback regulated phase: From the time of their seeding until they are hosted by haloes of mass M⊙ the BH accretion rates are negligible ( M⊙ yr-1 on average). By contrast, SFRs increase steadily with halo mass. This behaviour produces the uncorrelated (yet causally connected) vertical trend in region A, creating an imbalance of growth within these systems. As a result, BHs remain close to their seed mass whilst the halo/galaxy continues to grow around them (see the low-mass region of Figure 2).
B16 interpret galaxies in this regime as being in a state of regulatory equilibrium. Energy injected by stars heats the ISM within the stellar vicinity, ejecting it, and causing it to rise buoyantly in the halo. This in turn creates an outflow of material balancing the freshly sourced fuel from the cosmic web, and as such prevents large gas densities from building up within the inner regions of these low-mass galaxies. Such low densities, coupled with the relatively low mass BHs living within these galaxies (BHAR ), ensures that BHs fail to grow substantially.
-
•
Region B - The non-linear BH growth phase: Both galaxies and BHs grow through the halo mass range M⊙. However, whereas the SFRs continue to increase steadily with increasing halo mass, BHs rapidly transition to a non-linear phase of growth. This creates a highly non-linear indirect correlation between SFR and BHAR, connected through the host halo mass.
The physical interpretation posited by B16 is that haloes that grow to the transition mass, , have become sufficiently massive to stall the regulatory outflow. Due to (what is now) the halos’ hot coronae, heated gas ejected by stellar feedback loses the capability to rise buoyantly and therefore returns to the galaxy centre. Densities in the central regions of the galaxy are no longer kept low and a ‘switch’ to non-linear BH growth is triggered.
-
•
Region C - The AGN feedback regulated phase: For haloes with masses above M⊙ SFRs and BHARs both decline on average, correlated with an approximately linear trend (compare to green dashed line, see also bottom panel of Figure 9).
B16 argue that BHs in these haloes have become sufficiently massive (through their rapid non-linear growth) to efficiently regulate the gas inflow onto the galaxy themselves via AGN feedback. This again creates an equilibrium state, for which a fluctuating low level of (specific) BH accretion is maintained, keeping the outer halo hot and evaporating much of the new cold material trying to enter the system from the intergalactic medium.
Galaxies and their central BHs within the eagle simulation transition through multiple stages of growth as their host dark matter halo evolves, creating three distinct behaviours between SFR and BHAR. This is a stark contrast to a simple model where SFR and BHAR correlate globally via a linear relation, on average and for all halo masses. Whilst the underlying trend is only revealed when each growth rate is time-averaged (given the inherent noise of instantaneous growth rates), we only find an approximately linear correlation for the most massive systems ( M⊙).
In this paper we have emphasised the role of the halo and how its interaction with both SFR and BHAR shapes the growth rate relationship. However, additional factors may also contribute to the form this relationship takes. For example, Volonteri et al. (2015b) find using a suite of isolated merger simulations at fixed halo mass, that alternate behaviours between SFR and BHAR before, during and after the merger proper collectively contribute to form a complex two-dimensional plane. Additionally, Pontzen et al. (2017) reveal the particular importance differing merger histories can have on significantly altering the growth rate history of both that of the galaxy and the central BH. However, the global influence of mergers upon galaxy and BH growth rates in a full cosmological context remains open for debate, and will be the subject of a future paper.
5 Conclusions
We have investigated the relationship between the galaxy star formation rate (SFR) and the black hole accretion rate (BHAR) of the central black hole (BH) using the eagle cosmological hydrodynamical simulation. Our main conclusions are as follows:
-
•
We compared eagle predictions to two recent observational studies in Figures 3 and 4. The simulation reproduces both the flat trend of the mean SFR (SFR) as a function of BHAR found in the AGN selected study of Stanley et al. (2015) and the approximately linear trend of the mean BHAR (BHAR) as a function of SFR found in the SFR selected study of Delvecchio et al. (2015).
-
•
There is a moderate difference in the SFR–BHAR relationship when time-averaging each growth rate over a 100 Myr period for an AGN selected study (Figure 5). However, this change was not found to be sufficient as to revert the trend to an underlying linear relationship as has been proposed by previous theoretical studies.
-
•
Examining the complete SFR–BHAR plane in Figure 6, we found no evidence for a simple universal global relationship between the two instantaneous growth rates. The difference between the trends found for the SFR–BHAR and BHAR–SFR relations from AGN and SFR selections respectively, is due to sampling different regions of this complex plane. The complexity of this plane results from both the rate of galactic star formation and the accretion rate of the central BH holding an evolving connection to the host dark matter halo (Figure 7).
-
•
For a discrete redshift, the characteristic SFR of a halo increases smoothly with increasing halo mass (Figure 7). BHs in haloes of mass M⊙ accrete at a ‘low’ rate ( M⊙ yr-1). They then transition through haloes of mass M⊙ to a ‘high’ rate ( M⊙ yr-1) in haloes of mass M⊙. However, the scatter in the BHAR at fixed halo mass is very large (up to dex). Galaxies with SFRs far below the characteristic SFR all contain massive BHs ( M⊙).
-
•
The median evolutionary trend for a galaxy’s SFR and the accretion rate of its central BH, averaged over 100 Myr, are insensitive to the final properties of the system (Figure 9). By equating these trends together we found that the 100 Myr average SFR as a function of the 100 Myr average BHAR can be split into three regimes, separated by the halo mass (Figure 10). BHs hosted by haloes below the characteristic transition mass, (Bower et al., 2017, M⊙), fail to grow effectively, yet the galaxy continues to grow with the halo. Once the halo reaches there is a non-linear ‘switch’ of BH growth that rapidly builds the mass of the BH. In the most massive haloes ( > ) both SFR and BHAR decline on average, with a roughly constant scaling of SFR/BHAR .
Acknowledgements
We thank the referee Marta Volonteri for her useful comments, also to Flora Stanley and Ivan Delvecchio for their data and useful conversations.
This work was supported by the Science and Technology Facilities Council (grant number ST/F001166/1 and ST/L00075X/1); European Research Council (grant numbers GA 267291 “Cosmiway” and GA 278594 “GasAroundGalaxies”) and by the Interuniversity Attraction Poles Programme initiated by the Belgian Science Policy Office (AP P7/08 CHARM). RAC is a Royal Society University Research Fellow.
This work used the DiRAC Data Centric system at Durham University, operated by the Institute for Computational Cosmology on behalf of the STFC DiRAC HPC Facility (http://www.dirac.ac.uk). This equipment was funded by BIS National E-infrastructure capital grant ST/K00042X/1, STFC capital grant ST/H008519/1, and STFC DiRAC Operations grant ST/K003267/1 and Durham University. DiRAC is part of the National E-Infrastructure. We acknowledge PRACE for awarding us access to the Curie machine based in France at TGCC, CEA, Bruyères-le-Châtel.
This work was supported by the Netherlands Organisation for Scientific Research (NWO), through VICI grant 639.043.409, and the European Research Council under the European Union’s Seventh Framework Programme (FP7/2007- 2013) / ERC Grant agreement 278594-GasAroundGalaxies.
References
- Aird et al. (2010) Aird J., et al., 2010, MNRAS, 401, 2531
- Alexander & Hickox (2012) Alexander D. M., Hickox R. C., 2012, New Astron. Rev., 56, 93
- Azadi et al. (2015) Azadi M., et al., 2015, ApJ, 806, 187
- Bahé et al. (2016) Bahé Y. M., et al., 2016, MNRAS, 456, 1115
- Barber et al. (2016) Barber C., Schaye J., Bower R. G., Crain R. A., Schaller M., Theuns T., 2016, MNRAS, 460, 1147
- Bondi & Hoyle (1944) Bondi H., Hoyle F., 1944, MNRAS, 104, 273
- Booth & Schaye (2009) Booth C. M., Schaye J., 2009, MNRAS, 398, 53
- Booth & Schaye (2010) Booth C. M., Schaye J., 2010, MNRAS, 405, L1
- Booth & Schaye (2011) Booth C. M., Schaye J., 2011, MNRAS, 413, 1158
- Bower et al. (2017) Bower R. G., Schaye J., Frenk C. S., Theuns T., Schaller M., Crain R. A., McAlpine S., 2017, MNRAS, 465, 32
- Chang et al. (2015) Chang Y.-Y., van der Wel A., da Cunha E., Rix H.-W., 2015, ApJS, 219, 8
- Chen et al. (2013) Chen C.-T. J., et al., 2013, ApJ, 773, 3
- Correa et al. (2015) Correa C. A., Wyithe J. S. B., Schaye J., Duffy A. R., 2015, MNRAS, 450, 1521
- Crain et al. (2015) Crain R. A., et al., 2015, MNRAS, 450, 1937
- Crain et al. (2016) Crain R. A., et al., 2016, preprint, (arXiv:1604.06803)
- Dalla Vecchia & Schaye (2012) Dalla Vecchia C., Schaye J., 2012, MNRAS, 426, 140
- Davis et al. (1985) Davis M., Efstathiou G., Frenk C. S., White S. D. M., 1985, ApJ, 292, 371
- Delvecchio et al. (2015) Delvecchio I., et al., 2015, MNRAS, 449, 373
- Di Matteo et al. (2005) Di Matteo T., Springel V., Hernquist L., 2005, Nature, 433, 604
- Dolag et al. (2009) Dolag K., Borgani S., Murante G., Springel V., 2009, MNRAS, 399, 497
- Dubois et al. (2015) Dubois Y., Volonteri M., Silk J., Devriendt J., Slyz A., Teyssier R., 2015, MNRAS, 452, 1502
- Elbaz et al. (2007) Elbaz D., et al., 2007, A&A, 468, 33
- Furlong et al. (2015a) Furlong M., et al., 2015a, preprint, (arXiv:1510.05645)
- Furlong et al. (2015b) Furlong M., et al., 2015b, MNRAS, 450, 4486
- Greene et al. (2016) Greene J. E., et al., 2016, ApJ, 826, L32
- Gutcke et al. (2015) Gutcke T. A., Fanidakis N., Macciò A. V., Lacey C., 2015, MNRAS, 451, 3759
- Haardt & Madau (2001) Haardt F., Madau P., 2001, in Neumann D. M., Tran J. T. V., eds, Clusters of Galaxies and the High Redshift Universe Observed in X-rays. (arXiv:astro-ph/0106018)
- Habouzit et al. (2016) Habouzit M., Volonteri M., Dubois Y., 2016, preprint, (arXiv:1605.09394)
- Harrison et al. (2012) Harrison C. M., et al., 2012, ApJ, 760, L15
- Heckman et al. (2004) Heckman T. M., Kauffmann G., Brinchmann J., Charlot S., Tremonti C., White S. D. M., 2004, ApJ, 613, 109
- Hickox et al. (2014) Hickox R. C., Mullaney J. R., Alexander D. M., Chen C.-T. J., Civano F. M., Goulding A. D., Hainline K. N., 2014, ApJ, 782, 9
- Hopkins et al. (2005) Hopkins P. F., Hernquist L., Cox T. J., Di Matteo T., Martini P., Robertson B., Springel V., 2005, ApJ, 630, 705
- Hopkins et al. (2008) Hopkins P. F., Hernquist L., Cox T. J., Kereš D., 2008, ApJS, 175, 356
- Jahnke & Macciò (2011) Jahnke K., Macciò A. V., 2011, ApJ, 734, 92
- Kormendy & Ho (2013) Kormendy J., Ho L. C., 2013, ARA&A, 51, 511
- Lagos et al. (2015) Lagos C. d. P., et al., 2015, MNRAS, 452, 3815
- Lutz et al. (2010) Lutz D., et al., 2010, ApJ, 712, 1287
- Madau & Dickinson (2014) Madau P., Dickinson M., 2014, Annual Review of Astron and Astrophys, 52, 415
- Magorrian et al. (1998) Magorrian J., et al., 1998, AJ, 115, 2285
- McAlpine et al. (2016) McAlpine S., et al., 2016, Astronomy and Computing, 15, 72
- McConnell & Ma (2013) McConnell N. J., Ma C.-P., 2013, ApJ, 764, 184
- Mullaney et al. (2012a) Mullaney J. R., et al., 2012a, MNRAS, 419, 95
- Mullaney et al. (2012b) Mullaney J. R., et al., 2012b, ApJ, 753, L30
- Neistein & Netzer (2014) Neistein E., Netzer H., 2014, MNRAS, 437, 3373
- Page et al. (2012) Page M. J., et al., 2012, Nature, 485, 213
- Peng (2007) Peng C. Y., 2007, ApJ, 671, 1098
- Planck Collaboration et al. (2014) Planck Collaboration et al., 2014, Astronomy and Astrophysics, 571, A1
- Pontzen et al. (2017) Pontzen A., Tremmel M., Roth N., Peiris H. V., Saintonge A., Volonteri M., Quinn T., Governato F., 2017, MNRAS, 465, 547
- Qu et al. (2017) Qu Y., et al., 2017, MNRAS, 464, 1659
- Rafferty et al. (2011) Rafferty D. A., Brandt W. N., Alexander D. M., Xue Y. Q., Bauer F. E., Lehmer B. D., Luo B., Papovich C., 2011, ApJ, 742, 3
- Rahmati et al. (2015) Rahmati A., Schaye J., Bower R. G., Crain R. A., Furlong M., Schaller M., Theuns T., 2015, MNRAS, 452, 2034
- Reines & Volonteri (2015) Reines A. E., Volonteri M., 2015, ApJ, 813, 82
- Rosario et al. (2012) Rosario D. J., et al., 2012, A&A, 545, A45
- Rosas-Guevara et al. (2015) Rosas-Guevara Y. M., et al., 2015, MNRAS, 454, 1038
- Rosas-Guevara et al. (2016) Rosas-Guevara Y., Bower R. G., Schaye J., McAlpine S., Dalla Vecchia C., Frenk C. S., Schaller M., Theuns T., 2016, MNRAS, 462, 190
- Sanders et al. (1988) Sanders D. B., Soifer B. T., Elias J. H., Madore B. F., Matthews K., Neugebauer G., Scoville N. Z., 1988, ApJ, 325, 74
- Schaller et al. (2015a) Schaller M., et al., 2015a, MNRAS, 451, 1247
- Schaller et al. (2015b) Schaller M., Dalla Vecchia C., Schaye J., Bower R. G., Theuns T., Crain R. A., Furlong M., McCarthy I. G., 2015b, MNRAS, 454, 2277
- Schaye & Dalla Vecchia (2008) Schaye J., Dalla Vecchia C., 2008, MNRAS, 383, 1210
- Schaye et al. (2015) Schaye J., et al., 2015, MNRAS, 446, 521
- Scott et al. (2013) Scott N., Graham A. W., Schombert J., 2013, ApJ, 768, 76
- Segers et al. (2016) Segers M. C., Crain R. A., Schaye J., Bower R. G., Furlong M., Schaller M., Theuns T., 2016, MNRAS, 456, 1235
- Shakura & Sunyaev (1973) Shakura N. I., Sunyaev R. A., 1973, A&A, 24, 337
- Sijacki et al. (2015) Sijacki D., Vogelsberger M., Genel S., Springel V., Torrey P., Snyder G. F., Nelson D., Hernquist L., 2015, MNRAS, 452, 575
- Springel (2005) Springel V., 2005, MNRAS, 364, 1105
- Springel et al. (2001) Springel V., White S. D. M., Tormen G., Kauffmann G., 2001, MNRAS, 328, 726
- Springel et al. (2005) Springel V., Di Matteo T., Hernquist L., 2005, MNRAS, 361, 776
- Stanley et al. (2015) Stanley F., Harrison C. M., Alexander D. M., Swinbank A. M., Aird J. A., Del Moro A., Hickox R. C., Mullaney J. R., 2015, MNRAS, 453, 591
- Symeonidis et al. (2011) Symeonidis M., et al., 2011, MNRAS, 417, 2239
- Thacker et al. (2014) Thacker R. J., MacMackin C., Wurster J., Hobbs A., 2014, MNRAS, 443, 1125
- Trayford et al. (2015) Trayford J. W., et al., 2015, MNRAS, 452, 2879
- Trayford et al. (2016) Trayford J. W., Theuns T., Bower R. G., Crain R. A., Lagos C. d. P., Schaller M., Schaye J., 2016, MNRAS, 460, 3925
- Volonteri et al. (2015a) Volonteri M., Capelo P. R., Netzer H., Bellovary J., Dotti M., Governato F., 2015a, MNRAS, 449, 1470
- Volonteri et al. (2015b) Volonteri M., Capelo P. R., Netzer H., Bellovary J., Dotti M., Governato F., 2015b, MNRAS, 452, L6
- Wiersma et al. (2009a) Wiersma R. P. C., Schaye J., Smith B. D., 2009a, MNRAS, 393, 99
- Wiersma et al. (2009b) Wiersma R. P. C., Schaye J., Theuns T., Dalla Vecchia C., Tornatore L., 2009b, MNRAS, 399, 574
Appendix A Predictions from the integrated quantities
The major motivation for linking the growth of galaxies to the growth of their central BH has arisen empirically from the strong correlations seen in their integrated properties (the primary example being the tight – relation). We therefore require an evolutionary model that suitably fits this end point. In the simplest case, where BHs and their host galaxy grow in concert (or co-evolve), the relational form between their growth rates can be easily predicted. Given a functional form of the – relation described via
| (2) |
where is the gradient of the slope and is the intercept, the predicted relation between the growth rates is simply found by differentiating with respect to time, i.e,
| (3) |
In the trivial case where (i.e, a linear relation) this reduces to
| (4) |
Within this scenario, growth rates are directly proportional to one another scaled by the intercept, , of the – relation. Therefore, if the functional form between the growth rates is described via
| (5) |
where again and are the slope and intercept values, we would expect and in the case where .
Throughout this study we will test the hypothesis that there exists a broadly linear co-evolution between galaxies and their central BHs, a plausible scenario fitting the empirical – relation. We refer throughout to as the gradient of the slope between the integrated properties (–) and to as the slope between each growth rate (–), both in log space.