Herschel∗ and Hubble study of a lensed massive dusty starbursting galaxy at
Abstract
We present the results of combined deep Keck/NIRC2, HST/WFC3 near-infrared and Herschel far infrared observations of an extremely star forming dusty lensed galaxy identified from the Herschel Astrophysical Terahertz Large Area Survey (H-ATLAS J133542.9+300401). The galaxy is gravitationally lensed by a massive WISE identified galaxy cluster at . The lensed galaxy is spectroscopically confirmed at from detection of by GBT and from detection of obtained with CARMA. We use the combined spectroscopic and imaging observations to construct a detailed model of the background dusty lensed sub-millemter galaxy (SMG) which allows us to study the source plane properties of the target. The best-fit lens model provide magnification of and for the stellar and dust components respectively. Multi-band data yields a magnification corrected star formation rate of and stellar mass of consistent with a main sequence of star formation at . The CO observations yield a molecular gas mass of , similar to the most massive star-forming galaxies, which together with the high star-formation efficiency are responsible for the intense observed star formation rates. The lensed SMG has a very short gas depletion time scale of Myr. The high stellar mass and small gas fractions observed indicate that the lensed SMG likely has already formed most of its stellar mass and could be a progenitor of the most massive elliptical galaxies found in the local Universe.
Subject headings:
Gravitational lensing: strong – Submillimeter: galaxies1. Introduction
Understanding the formation of galaxies and their subsequent evolution with cosmic time are fundamental goals of observational astronomy. Galaxies are believed to form in gas-rich environments (Dekel et al. 2009) and assemble their mass through constant gas accretion in secular evolutions (Dekel et al. 2009; Kruijssen et al. 2014; Narayanan et al. 2015), mergers (Kauffmann et al. 1993; Hopkins et al. 2008; Tacconi et al. 2008; Engel et al. 2010; Hopkins et al. 2013) or both (Kormendy & Kennicutt 2004; Genzel et al. 2008; Barro et al. 2013). The evolutionary track of galaxies is accompanied by various phases of star formation which could be triggered by events such as mergers and sustained by processes such as gas accretion onto the potential wells of the underlying dark matter halos (Cole et al. 1994; Granato et al. 2004; Bower et al. 2006; Furlong et al. 2015). Studying the physical processes responsible for regulating star-formation is crucial in getting a better understanding of galaxy formation and evolution (Law et al. 2009; Hemmati et al. 2014, 2015).
One of the main sites of star formation in the Universe at high redshifts are sub-millimeter galaxies (for a recent review see: Casey et al. 2014). These system are rich in gas and dust and have measured star formation rates in excess of hundreds to a few thousand solar masses per year (Greve et al. 2005; Capak et al. 2008; Magnelli et al. 2012; Michałowski et al. 2016). These dusty galaxies are readily identified and studied in extra-galactic surveys at long wavelengths (Blain et al. 1999; Elbaz et al. 2011; Leroy et al. 2013; Scoville et al. 2016; Hemmati et al. 2017) at which they are most luminous as the UV light emitted by the hot young stars (produced by intense star-formation activity) is absorbed and re-radiated by dust.
Recent studies indicate a very rapid mass assembly and short duty cycles (starburst phase) for the high redshift SMGs (Greve et al. 2005; Tacconi et al. 2006, 2008; Riechers et al. 2011a; Magnelli et al. 2012; Toft et al. 2014) with time scales as short as . The high star formation rate is responsible for mass build-up in SMGs. In fact, cosmological hydrodynamic simulations show that the SMGs are on average very massive and reside in halos at (Davé et al. 2010). This agrees with multi-band observations of sub-millimeter samples of galaxies at similar redshifts with stellar masses as high as few times and median of Hainline et al. (2011). The rapid mass assembly in SMGs over short time scales followed by gas reservoir depletion due to intense star-formation could possibly explain the origin of the most massive quiescent galaxies. In fact recent studies have shown that the very high redshift SMGs could indeed be the progenitors of the most massive quiescent systems (Nayyeri et al. 2014; Toft et al. 2014). A better understanding of the mass assembly and the underlying star formation responsible for it is achieved with the knowledge of the full spectral energy distribution (SED) of the galaxy. Given the amounts of dust, these systems are intrinsically faint at shorter wavelengths and become bright at longer wavelengths. Even with intrinsic luminosities of identifications of sub-millimeter galaxies at high redshifts are still challenging. Gravitational lensing provides a unique tool to study this obscured population of galaxies at high redshift. The signal boost provided by gravitational lensing and the increase in spatial resolution combined with robust lens modeling allow us to study the star forming regions within these galaxies at sub-kpc scales (Swinbank et al. 2010; Dye et al. 2015; Swinbank et al. 2015; Rybak et al. 2015). In fact this tool has been successfully utilized in several recent works to study the physical properties of gas-rich star forming systems at high redshift (Ivison et al. 1998, 2000; Frayer et al. 1998, 1999; Riechers et al. 2011b; Gavazzi et al. 2011; Swinbank et al. 2011; Bussmann et al. 2012; Fu et al. 2012, 2013; Bussmann et al. 2013; Rawle et al. 2014; Messias et al. 2014; Timmons et al. 2015; Bussmann et al. 2015).
Wide-area far-infrared surveys have been very successful in detecting lensed sub-millimeter galaxies. The steep number counts and the negative -correction at sub-mm wavelengths give rise to a high magnification bias such that the fraction of lensed sources brighter than a given threshold is significantly larger than other wavelengths (Blain 1996). This has been used by several recent studies (Negrello et al. 2010; Wardlow et al. 2013; Nayyeri et al. 2016; Negrello et al. 2016) to identify samples of high redshift lensed SMGs from Herschel observations as well as populations of lensed SMGs from wide-field observations using Planck (Cañameras et al. 2015) and in the mm band from South Pole Telescope (Mocanu et al. 2013; Weiß et al. 2013; Mancuso et al. 2016; Strandet et al. 2016) and Atacama Cosmology Telescope (Su et al. 2017).
In this work we study the physical properties of a Herschel identified sub-millimeter galaxy at that is lensed by a foreground massive cluster at . The signal boost provided by the gravitational lensing in combination with our high resolution deep imaging and spectroscopy in the near and far infrared gives us a unique opportunity to study the star formation activity and physical properties of this lensed system as a very massive SMG candidate identified during peak epoch of star-formation activity (Madau & Dickinson 2014).
This paper is organized as follows. In Section 2 we describe our photometric and spectroscopic observations of NA.v1.489. In Section 3 we discuss our lens modeling of the system using high resolution photometric and spectroscopic data of the foreground cluster system. We study the physical properties of the lensed system in Section 4. The results of the combined lens modeling, SED fitting and spectral line analysis are discussed in Section 5 and in Section 6 we summarize our main findings. Throughout this paper we assume a standard cosmology with , and . All magnitudes are in the AB system where (Oke & Gunn 1983).
2. Data
2.1. Herschel Far-infrared Imaging
H-ATLAS J133542.9+300401 lensed SMG (hereafter referred to as NA.v1.489) was discovered by the Herschel Space Observatory (Pilbratt et al. 2010) as part of the Astrophysical Terahertz Large Area Survey (H-ATLAS; Eales et al. 2010). The observations were performed with the Spectral and Photometric Imaging REceiver (SPIRE; Griffin et al. 2010) instrument at 250 m, 350 m and 500 m. NA.v1.489 was discovered as a SPIRE 500 m bright source (with mJy) within H-ATLAS maps as a potential high- lensed SMG candidate (Negrello et al. 2016) with follow-up CO observations (described below) revealing the high redshift nature of the source with .
The Herschel images are processed with the Herschel Interactive Processing Environment (HIPE; Ott 2010) and are available from the Herschel Science Archive. For the SPIRE photometry we used the point source catalog for the H-ATLAS (Valiante et al. 2016, Maddox et al. in prep.) which includes photometry in all the three SPIRE bands (at 250 m, 350 m and 500 m). The PACS and SPIRE images will be released in future studies (Smith et al. in prep.) along with the source catalogs (Maddox et al. in prep.). The details of the object selection and photometry is described in (Valiante et al. 2016).
2.2. GBT Spectroscopy of
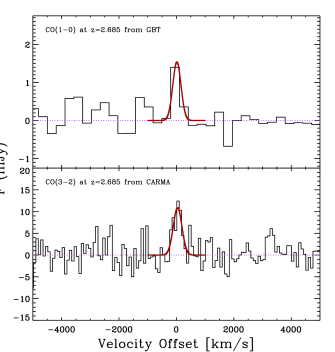
The NRAO111The National Radio Astronomy Observatory is a facility of the National Science Foundation operated under cooperative agreement by Associated Universities, Inc. Green Bank Telescope (GBT) was used to carry out the observations of NA.v1.489 during three observing sessions (2012 November 29 and 30 and 2014 April 05; GBT programs 12A299 and 13A137, PI: D. Frayer). These observations were part of a comprehensive redshift survey of H-ATLAS sources using the Zpectrometer instrument on the GBT (Frayer et al. 2011; Harris et al. 2012). The observations were taken using the sub-reflector beam switching (“SubBeamNod”) mode with a 10 second switching interval. Alternating sets of SubBeamNod observations between the two targets were taken every 4 minutes to remove the residual baseline structure. A total of 2.7 hours of on-source observations were obtained for NA.v1.489. The data were reduced using the standard Zpectrometer data reduction package (Harris et al. 2012). Based on the dispersion of measurements of the nearby pointing source, we estimate a 15% absolute calibration uncertainty for the data. Figure 2 shows the GBT measured velocity at (determined from combined GBT and CARMA observations; See Figure 2 and Section below).
2.3. CARMA Spectroscopy of
Observations of the rotational line ( = 345.8 GHz) towards the background galaxy NA.v1.489 at were carried out using the Combined Array for Research in Millimeter-wave Astronomy222http://www.astro.caltech.edu/research/carma/ (CARMA) at the redshifted frequency of = 93.838 GHz (3.2 mm; Program ID: cf0020, cf0025; P.I. Riechers). Two observing runs were carried out on April 27 and June 9 2013 under excellent 3 mm weather conditions in the C and D array configurations, respectively. The 3 mm receivers were used to cover the redshifted line, employing a correlator setup providing a bandwidth of 3.75 GHz in each sideband and spectral resolution of 5.208 MHz (17 km s-1). The line was placed in the upper sidebands for both tracks with the local oscillator tuned to 90.7 GHz; this resulted in 1.9 hours and 2.6 hours of 15 antenna-equivalent on-source time after discarding unusable visibility data for C and D array observations, respectively.
For both tracks, the nearby radio quasar J1310+323 was observed every 15 minutes for pointing, amplitude, and phase calibration, and MWC349 was observed as the primary absolute flux calibrator. J1337129 and 3C273 were observed as bandpass calibrators for C and D array observations, respectively, yielding 15% calibration accuracy. The miriad package was used to calibrate and analyze the visibility data which are imaged and de-convolved using the clean algorithm with “natural” weighting. This yields a synthesized clean beam size of 26 22 for the upper sideband image cube. The final rms noise is = 0.68 Jy km s-1 beam-1 over a channel width of 208.3 MHz (corresponding to 687 km s-1). The continuum image is created by averaging over all the line-free channels (90.7 GHz). This yields a synthesized clean beam size of 35 30 and an rms noise of 0.24 mJy beam-1. These observations ultimately confirm the redshift of NA.v1.489 to be , and thus, that the line detected with the GBT indeed is . They also provide a precise position for the molecular gas reservoir, which is consistent with that subsequently found for the dust emission based on SMA observations (see Section 2.8)
2.4. Hubble Space Telescope WFC3 Imaging
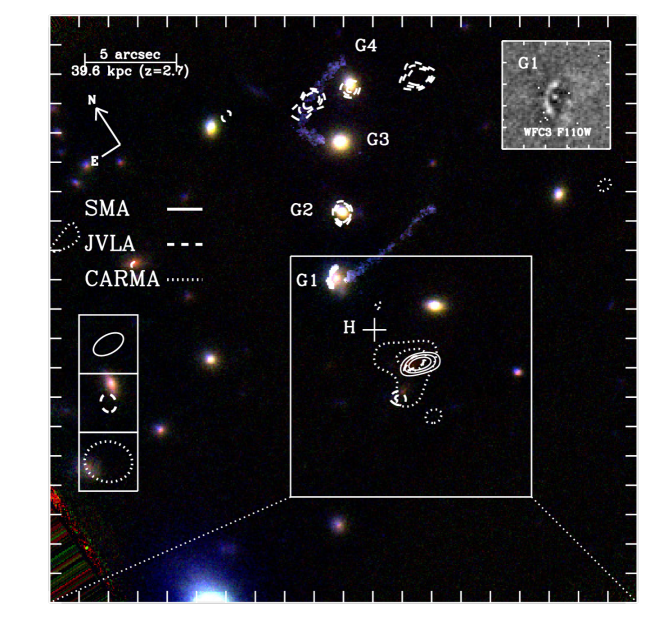
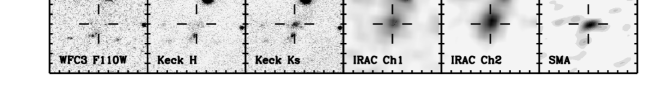
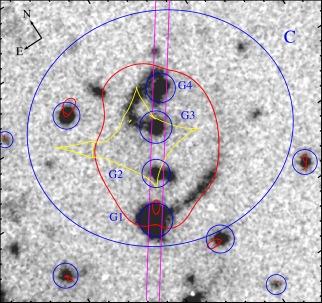
NA.v1.489 was observed with the Hubble Space Telescope Wide Field Camera 3 (HST/WFC3) F110W filter (at 1.1 m) in Cycle 19 as part of the SNAP imaging program of Herschel identified lensed SMGs (PID: 12488; PI: Negrello; Negrello et al. 2014). The data were reduced using the iraf MultiDrizzle package with resampled pixel scale of 0.064′′ using the adopted dithering pattern (Negrello et al. 2014). The acquired image has an exposure time of 252 seconds and reaches a 5 limiting depth of 25.1 AB mag (over a aperture). Figure 1 shows the HST image along with additional observations.
2.5. Keck Adaptive Optics Imaging
We observed NA.v1.489 in February 7 and 8, 2015 with the Keck/NIRC2 Adaptive Optics (AO) imaged (PID: U038N2L; PI: Cooray) in the and band filters at 1.63 m and 2.15 m respectively with average seeing of 0.6-0.7 arcsec. The observations are done with a custom 9 point dithering pattern for sky subtraction with 120 seconds and 80 seconds exposures per frame at 0.04 arcsec/pixel. We also acquired dark images with the hatch closed and dome flats with and without the calibration lamps. The individual frames are then co-added and flat and dark subtracted using custom IDL routines. The combined images have exposure times of 5640 seconds and 5280 seconds in the and bands, respectively. A natural guide star of mag with a distance of 52.3 arcsec was used for the tip-tilt correction. Figure 1 shows the HST + Keck combined image of the lensed system.
2.6. Keck Optical Spectroscopy
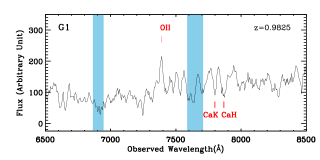
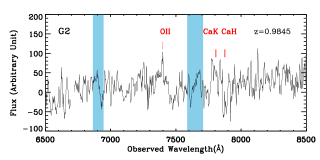
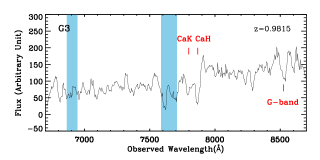
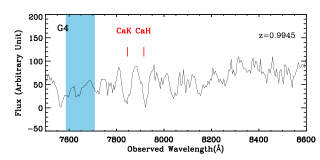
The lensing system was observed with the Keck/DEIMOS optical spectrograph (Faber et al. 2003) in February 26, 2015 (PID:U029D; PI: Cooray). The G1-G4 foreground galaxies (Figure 1) were observed using the DEIMOS Long1.0B which is a single long slit of width 1 arcsec and consists of 12 slitlets each 82 arcsec long. A PA of was chosen to align the galaxies on the slit with a star of mag at an offset of 47′′ and -29′′ (east and north) with respect to the center of the four lens used as guiding. The foreground system was observed for a total of 1100 seconds using the 600 lines/mm grating with resolution of 3.5Å and under clear conditions with 0.6 arcsec seeing. A central wavelength of 6700Å blazed at 7500Å was chosen for the observations giving a wavelength coverage of .
The observed spectra where flat fielded and wavelength calibrated using the deep2 pipeline. The 1D spectra were extracted at the position of the four galaxies with optimal extraction (Horne 1986). Figure 3 shows the extracted 1D spectra for the four co-aligned galaxies. We detect [O II] doublet emission and/or Ca H&K absorption in the extracted 1D spectra putting the foreground system at . This is the redshift that we adopt for our lens modeling.
2.7. JVLA Imaging
The National Radio Astronomy Observatory’s (NRAO) JVLA111This work is based on observations carried out with the JVLA. The NRAO is a facility of the NSF operated under cooperative agreement by Associated Universities, Inc observations used in this paper were carried out on February 15 and 17, 2015, when the array was in it’s B-configuration (PI: R. Ivison, ID: 14B-475). Simultaneous 4 GHz bandwidth in dual polarization covering the GHz range (C band). The calibrator 3C286 was used for bandpass, phase, and flux calibration. The data were calibrated and imaged in casa222https://casa.nrao.edu/ using standard calibration techniques, including automatic RFI flagging. Image has an rms of with a synthesized beam size of at .
2.8. Sub-Millimeter Array Imaging
NA.v1.489 was initially observed using the Sub-Millimeter Array (SMA; Ho et al. 2004) in December 2015. Observations were performed on December 1 (2.6 hours on source, with 7 antennas) and December 7 (1.86 hours on source with 8 antennas) when the array was in its most compact configuration. The array was tuned to a local oscillator (LO) frequency of 228.3 GHz ( mm), and the integrated bandwidth was 6.25 GHz per sideband (12.5 GHz total bandwidth). Both observations were obtained in good weather, and emission was detected at mJy, located roughly 11′′ from the phase center.
Given the strong detection, further observations in the compact ( m max baseline for 2.8 hours on January 22, 2016) and extended ( m max baseline for 5.2 hours on April 14, 2016) SMA configurations were obtained. The LO tuning was again 228.3 GHz, with GHz bandwidth per sideband utilized (14 GHz total bandwidth). Phase and amplitude gain calibration was performed using nearby sources J1310+323 and 3C286, with passband calibration performed using 3C279, and the flux density scale set using Callisto, known to 5% at 1.3 mm. Both observations were obtained under very good weather (225 GHz opacities of 0.07 in January, and 0.04 in April). The observations were calibrated and ported into the NRAO Astronomy Image Processing System (aips). This is the data the we use in this study.
Direct fitting of the visibility data determined the emission was best fit by a Gaussian with a peak of mJy, offset from the phase center by +1.9′′ RA, -11.1′′ Dec, matching the integrated flux and position determined at low resolution, and further suggested a characteristic size of 0.9′′ FWHM. The data were also imaged, confirming again the positional offset and flux density. The synthesized beam of the combined observations was .
2.9. Archival Data
The lensing cluster has been observed by the Gemini-North GMOS in both imaging and spectroscopy modes (MOO J1335+3004; Stanford et al. 2014). The imaging observations are in and -bands (at 6300Å and 9250Å) with total exposure times of 900 and 2160 seconds respectively (Stanford et al. 2014) and spectroscopic observations on candidates identified from the optical catalogs with total on-source exposure time of 6480 seconds. NA.v1.489 is not detected in these Gemini observations. We use this spectroscopic and imaging dataset to identify the foreground lensing galaxies and distorted images associated with the lensing cluster as discussed in the next Section.
The foreground cluster was observed by the Spitzer/IRAC at 3.6 m and 4.5 m in Cycle 12 in warm mission (PI: A. Gonzalez) and separately by the Wide-field Infrared Survey Explorer (WISE; Wright et al. 2010) in all the four W1, W2, W3 and W4 bands. The IRAC observations were done with 30 seconds exposures in both bands. The IRAC mosaics were in MJy/Sr which where converted to Jy/pixel using a pixel scale of 0.6 arcsec. NA.v1.489 is detected in both IRAC bands with at least .
2.10. Multi-band Photometry
We measured photometry of the background SMG using SExtractor (Bertin & Arnouts 1996). The zero points for the Keck observations were computed by comparing the photometry of bright targets in the field to those in the UKIRT Infrared Deep Sky Survey (UKIDSS; Lawrence et al. 2007). We run SExtractor in dual mode with the Keck image as the detection band for the HST and Keck photometry.
For the IRAC observations we use each band as its own detection when running SExtractor. We measure the WISE flux density of NA.v1.489 through aperture photometry with in each band centered on the Spitzer/IRAC 3.6 m centroid. WISE aperture photometry overestimates the fluxes in the W1 and W2 bands compared to the IRAC 3.6 m and 4.5 m observations by due to blending. We corrected the WISE W3 and W4 fluxes with the same factor to account for blending.
Herschel/SPIRE photometry, as discussed above, is from the H-ATLAS catalog of Valiante et al. (2016). For the longer wavelength SMA and JVLA, we first convert the maps from Jy/beam unit to mJy/pixel given the beam size of the observations and the data pixel scale and perform photometry on each image individually. Table 1 summarizes the photometry extracted for the background SMG. We use this multi-band photometry to construct the SED of the lensed galaxy in Section 4.
3. Lensing Model
NA.v1.489 system is gravitationally lensed by a foreground cluster of galaxies at first identified in the WISE survey by Stanford et al. (2014) with follow-up spectroscopic and photometric observations with Gemini as discussed above. The extended arcs associated with lensing (of a galaxy at an unknown redshift) are visible in the high resolution HST image of the cluster (blue arcs in Figure 1). The SMG (marked in Figure 1 with the solid box) was independently identified from Herschel 500 m observations by Negrello et al. (2016) as a potential lensed candidate. We performed lens modeling of this system using the publicly available code of lenstool333http://projets.lam.fr/projects/lenstool/wiki (Kneib et al. 1996; Jullo et al. 2007; Jullo & Kneib 2009). lenstool performs Bayesian optimization given the redshift and location of the identified images of the lensed sources in the image plane. We used the two blue extended arcs identified in the G1-G4 system (Figure 1) along with the arc produced by G1 to constrain the lens model. We used SExtractor on the Gemini r-band to identify the peak positions of the arcs and counter images in the image plane as required by lenstool. We allowed the redshift of the arcs to vary during the optimization. In lens modeling analysis we used a combination of a cluster potential together with galaxy potentials as the foreground deflecting components. We use a NFW profile (Navarro et al. 1996) for the lensing cluster at consistent with the spectroscopic observations of various cluster members. For the galaxy-scale potentials we used the spectroscopic identifications from Gemini (Stanford et al. 2014) and our Keck/DEIMOS observations as the main foreground system combined with a red-sequence identified cluster members from the color-magnitude diagram from the Gemini+HST extracted photometry. Figure 4 shows the foreground potentials used to construct the lensing system. We additionally keep the cluster potential ellipticity and position variable, with the allowed centroid offset of 10 arcsec around the initial value (at the center of the four galaxies).
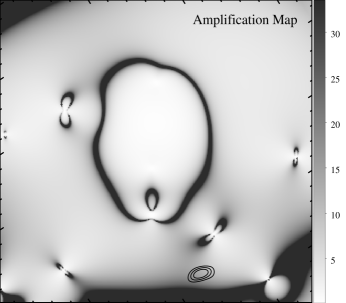
The output of the optimization process provides the best estimate positions and properties of the deflecting potentials and is considered the best-fit model. Figure 4 shows the best-fit model computed by lenstool along with the generated amplification map. We use this map to measure the magnification of the SMG at the SMA peak position. Averaging the amplification map across the corresponding images identified from the SExtractor segmentation maps yield magnifications of and for the stellar and dust components respectively from modes of the computed Bayesian model. We note here that the magnification for both emissions (stellar and dust) are computed from the same amplification map (constructed from the Gemini r-band) for the lensing cluster due to lack of multiple images associated with dust that would allow a separate lens modeling. In the next Section we de-magnify the stellar and dust continuum fluxes by the above-measured values before measuring the physical properties through SED fitting.
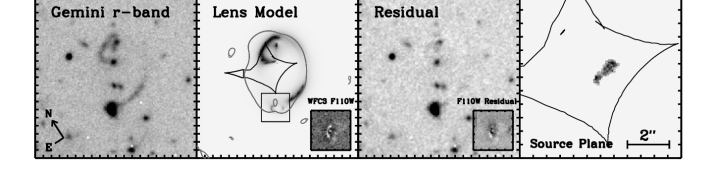
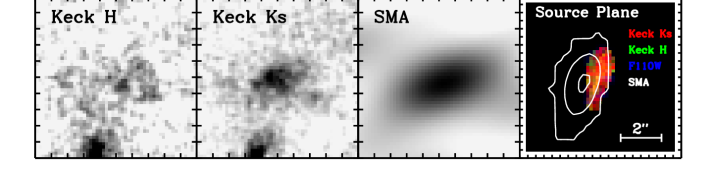
Figure 5 shows the Gemini r-band image used in lens modeling along with the re-constructed lens model in the image plane and the residual map. The reconstructed image is generated by tracing the source plane image through the best-fit lens model. We further show the source plane reconstruction of the blue arcs used in generating the model in this Figure for reference. Figure 6 shows the Keck and SMA images of the lensed SMG NA.v1.489, along with the source plane reconstructed three color image using the lens model computed for the cluster as discussed above. The reconstructed source plane has red colors as expected from the observed SED and consistent with other rest-frame optical studies of SMGs. The rest-frame optical emission, as arising from stellar light, has a co-moving distance kpc from SMA dust emission in the source plane. The stellar and dust emissions have half-light radii of 0.63 kpc and 1.86 kpc respectively measured from a Sérsic profile using galfit (Peng et al. 2002). This shows a more extended dust emission that is also offset from the stellar light as reported previously in the literature for high- SMGs (Hodge et al. 2015; Spilker et al. 2015) and would suggest the presence of differential magnification (yet not significant) as reported above for the stellar and dust components.
4. Physical properties of NA.v1.489
4.1. SED inferred parameters
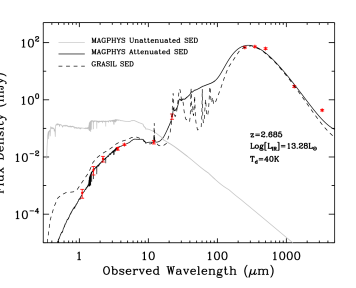
We fit the SED of the background SMG with a library of model templates using the publicly available SED fitting code of magphys (da Cunha et al. 2008). magphys uses the Bruzual & Charlot (2003) synthesis models for the stellar light and the attenuation by Charlot & Fall (2000) to compute the total infrared luminosity absorbed and reradiated by dust using different dust components at different wavelengths based on an energy balance scheme (da Cunha et al. 2008). We used an updated version of the magphys code that is better-suited for sub-millimeter galaxies (da Cunha et al. 2015). Briefly, it does so by extending the SED parameter priors to the high redshift, high optical depth and actively star forming regime that is typical of star forming galaxies at high redshift by adding new star formation histories and dust attenuation recipes (da Cunha et al. 2015).
We use the photometry of NA.v1.489 outlined in Table 1 and correct it for the magnification (reported in the previous section) as an input for SED fitting in magphys. This includes near-infrared data from HST/WFC3 F110W, Keck and , infrared measurements by Spitzer/IRAC in 3.6 m and 4.5 m, WISE observations at 12.0 m and 22.0 m, far-infrared photometry from Herschel/SPIRE in the 250 m, 350 m and 500 m bands and 1.31 mm observations by SMA. For the SED fitting we fixed the redshift of the galaxy to its spectroscopic redshift () measured from CO observations. The best-fit SED and photometry are presented in Figure 7 with the best-fit measured physical parameters reported in Table 2. For star-formation rate, we used a Kennicutt relation (Kennicutt 1998) with Chabrier initial mass function (Chabrier 2003) to convert the total infrared luminosities to SFR (; Riechers et al. 2013). The SED of NA.v1.489 is consistent with the presence of a Balmer break at and would allow for robust stellar mass estimates.
It is important to note that the SED inferred parameters are for stellar light heating the dust and does not include AGN contribution. NA.v1.489 shows excess radio flux with respect to the infrared luminosity compared to the average values expected for high- SMGs which could hint towards the presence of an AGN. Although there are studies such as Wang et al. (2013), which show a low fraction of AGN presence within SMG populations, there are studies that point to the existence of an AGN component within SMGs (Wang et al. 2013).
The lack of an AGN recipe in our SED fitting with magphys should not strongly affect the estimated physical parameters (da Cunha et al. 2015). In a recent study, in fact, using synthetic models of galaxies with H-ATLAS like photometry computed from simulations Hayward & Smith (2015a) showed that magphys estimated physical properties are robust even in the extreme case of AGN contributing as much as 25% to UV to IR luminosity.
Physical properties measured from SED fits have inherent uncertainties associated with choices of the input parameters in building the templates such as the assumed star-formation history and dust attenuation (Conroy 2013). To further examine the robustness of our estimated physical properties, and in particular the stellar mass, we applied the SED fitting method detailed in Michałowski et al. (2008, 2009, 2010b, 2010c, 2012a, 2014) which is based on 35 000 templates from the library of Iglesias-Páramo et al. (2007) plus some templates of Silva et al. (1998) and Michałowski et al. (2008), all of which were developed using grasil444http://adlibitum.oats.inaf.it/silva/grasil/grasil.html (Silva et al. 1998). They are based on numerical calculations of radiative transfer within a galaxy, which is assumed to be a triaxial axisymmetric system with diffuse dust and dense molecular clouds, in which stars are born. The templates cover a broad range of galaxy properties from quiescent to starburst and span an range from to mag. The extinction curve (Figure 3 of Silva et al. 1998) is derived from the modified dust grain size distribution of Draine & Lee (1984). The star formation histories are assumed to be a smooth Schmidt-type law i.e., the SFR is proportional to the gas mass to some power; see (Silva et al. 1998) with a starburst (if any) on top of that, starting 50 Myr before the time at which the SED is computed. There are seven free parameters in the library of Iglesias-Páramo et al. (2007): the normalization of the Schmidt-type law, the timescale of the mass in-fall, the intensity of the starburst, the timescale for molecular cloud destruction, the optical depth of the molecular clouds, the age of the galaxy and the inclination of the disk with respect to the observer. Michałowski et al. (2012b, 2014) found that the choice of star formation history (SFH) assumed in the SED modeling can lead to a systematic shift of stellar mass. However, this shift is at most a factor of for a single-burst SFH (i.e. all stars formed at the same epoch), unrealistic for such massive and actively star-forming galaxy. Moreover, double-component SFH (utilized here) were found to result in the most accurate stellar masses of real (Michałowski et al. 2012b) and simulated SMGs (Michałowski et al. 2014; Hayward & Smith 2015b). We re-fit our observed SED with the new set of templates using grasil as discussed above. Figure 7 shows the grasil best-fit template compared to the magphys. Our newly measured physical properties, and stellar mass, from the new templates are consistent with our original measurements using magphys.
| Instrument | Flux Density |
|---|---|
| HST/WFC3 F110W | Jy |
| Keck | Jy |
| Keck | Jy |
| Spitzer/IRAC 3.6 m | Jy |
| Spitzer/IRAC 4.5 m | Jy |
| WISE W3 | Jy |
| WISE W4 | Jy |
| Herschel/SPIRE 250 m | mJy |
| Herschel/SPIRE 350 m | mJy |
| Herschel/SPIRE 500 m | mJy |
| SMA 1.31 mm | mJy |
| 3.2 mm Cont. | Jy |
| JVLA 1.4 GHzb | Jy |
a: From peak SMA. b: From JVLA 6.89 GHz observations assuming a spectral index of .
| Quantity | Value | Unit |
|---|---|---|
| K | ||
| SFRa | ||
a: Assuming a Chabrier initial mass function and a conversion of (Riechers et al. 2013), b: From GBT observations corrected for magnification assuming conversion factor of .
4.2. Molecular Gas and Dust
We use the velocity integrated CO flux (), measured from GBT observations (Figure 2), to estimate the CO line luminosity given the spectroscopic redshift of the SMG. The best-fit Gaussian to the at 31.28 GHz yields a peak observed flux of 1.54 mJy and velocity FWHM of . The CO line luminosities could be calculated as (Solomon & Vanden Bout 2005; Ivison et al. 2011; Bolatto et al. 2013; Carilli & Walter 2013; Scoville et al. 2016):
| (1) |
This yields a magnification corrected line luminosity of . Assuming conversion factor of , which is commonly adopted for star-bursting galaxies (Downes & Solomon 1998; Solomon & Vanden Bout 2005; Tacconi et al. 2008), we measure a molecular gas mass () of for NA.v1.489.
The observations obtained with CARMA yield a magnification corrected line luminosity of . This yields a line ratio of . This is similar to the line ratios derived from large samples of SMGs at with (Sharon et al. 2016).
The ISM mass can also be estimated from sub-mm continuum emission (Magdis et al. 2012; Scoville et al. 2014, 2016) as the dust emission is optically thin at the long wavelength. Scoville et al. (2016) provide an empirical calibration to measure the ISM from the Rayleigh-Jeans tail emission at 850 m:
| (2) |
where is the correction applied for deviations from the behavior in the RJ tail as defined in Scoville et al. (2014) and Scoville et al. (2016). We used the SMA observations at 1.31 mm and measured a magnification corrected ISM mass of . This is consistent with the molecular gas mass estimates derived independently from GBT. From CO observations, we measure a gas depletion time scale ()) of 43 Myr, indicating a rapid phase of star-formation which is also observed in other high redshift SMGs and starbursts (Tacconi et al. 2008; Messias et al. 2014; Oteo et al. 2016).
5. Discussion
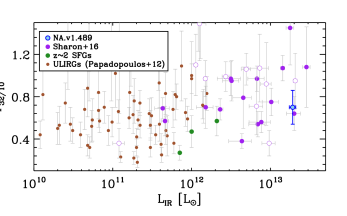
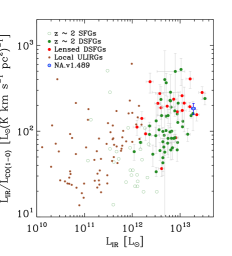
NA.v1.489 has a molecular gas line ratio of as measured from GBT and CARMA. This is higher than the measured ratio for normal star-forming galaxies (Aravena et al. 2014; Daddi et al. 2015), with (Daddi et al. 2015). The larger value is associated with the increased star-formation activity which could raise the higher- CO line fluxes at higher energies (Bolatto et al. 2013). The measured molecular gas line flux ratio of NA.v1.489 further agrees with the mean value reported by Sharon et al. (2016) for SMGs () at . Figure 8 shows the CO molecular line flux ratios as a function of infrared luminosity for NA.v1.489 compared to other SMGs and QSO host galaxies at (Sharon et al. 2016), normal star-forming galaxies (Aravena et al. 2014; Daddi et al. 2015) and local ULIRGs (Papadopoulos et al. 2012). Although the excitation temperature of is not very high and could well be produced by a compact starburst (Sharon et al. 2016), a particularly energetic source, such as an AGN, could further increase the line ratios. NA.v1.489 has measured line ratios consistent with the line excitation produced by a starburst rather than a QSO host galaxy (which has ; Sharon et al. 2016). However, given the uncertainties in both measurements, line excitation due to the presence of an AGN cannot be ruled out.
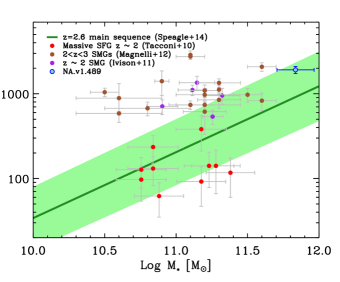
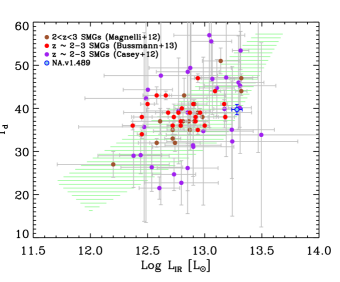
NA.v1.489 has an SED inferred infrared luminosity that puts it among the most IR-luminous extra-galactic sources and which then yields an SED inferred SFR comparable to the most intense star forming systems at (Greve et al. 2005; Harris et al. 2012; Magnelli et al. 2012; Fu et al. 2012, 2013; Ivison et al. 2013). Figure 9 shows the SFR versus stellar mass plot along with the main sequence of star forming galaxies (Kauffmann et al. 2003; Noeske et al. 2007; Elbaz et al. 2011; Shivaei et al. 2015) derived from Speagle et al. (2014). The main sequence relation sits above the corresponding local relation such that at any given fixed stellar mass the high- counter part would be much more star forming compared to the local SFGs. The scatter along this relation, marked as the green shaded area, is associated to the intrinsic properties of galaxies such as the change in star formation histories and metallicities (Brinchmann et al. 2004; Mannucci et al. 2010; Wuyts et al. 2011). As we see from Figure 9, NA.v1.489 sits at the main sequence relation plotted for from Speagle et al. (2014). This is supported by recent studies of high redshift SMGs pointing towards small deviations from the SFG main sequence (Michałowski et al. 2012b; Koprowski et al. 2014, 2016). The intense SFR agrees with the MS position given the large stellar mass of the system and the huge reservoirs of molecular gas available. The large stellar mass is in agreement with simulations of SMGs (Davé et al. 2010) and SMG models of Hayward et al. (2011) requiring large stellar masses for bright flux densities in the sub-mm (with needed to create a 850 m flux density of 3 mJy) also seen in observed stellar mass estimates of SMGs at from multi-wavelength SED measurements (Michałowski et al. 2010a; Hainline et al. 2011). The intense SFR could be explained as being due the higher molecular gas mass available within these systems that provide the material needed for the excess star formation (Riechers et al. 2010; Fu et al. 2013; Riechers et al. 2014). The dust temperature of SMGs derived from far-IR observations is indicative of the ISM in these systems. The local infra-red luminous sub-millimeter galaxies show a clear trend between the dust temperature () and the infrared luminosity (Hwang et al. 2010; Elbaz et al. 2011; Symeonidis et al. 2013) with similar trends observed for high redshift far-infrared or sub-millimeter selected samples of galaxies (Chapman et al. 2005; Magdis et al. 2010; Magnelli et al. 2012; Casey et al. 2012; Magnelli et al. 2014; Béthermin et al. 2015). At high-redshift, these relations are biased towards colder temperatures for sub-mm selected samples at low (Casey et al. 2009; Magnelli et al. 2012) as direct observations in the far-infrared are mostly limited to bright sources at (Magdis et al. 2010) with studies of far-infrared lensed systems extending this to lower (Bussmann et al. 2013; Nayyeri et al. 2016). The relation shows modest evolution with redshift from Herschel-selected samples out to (Hwang et al. 2010) where SMGs at high- are found to be on average colder than the local counterparts (Hwang et al. 2010). Figure 9 shows that NA.v1.489 has dust temperature () and far-IR luminosity () that agrees with the general trend observed for the SMGs (Chapman et al. 2005). The scatter in this relation is associated with selection biases as well as the presence of colder dust temperatures in high- SMGs (compared to the local counterparts) (Magnelli et al. 2012). Figure 9 further shows that NA.v1.489 on average has a colder dust temperature compared to sub-mm and Herschel-selected samples of SMGs at at similar infrared luminosities (Casey et al. 2012; Magnelli et al. 2012). The lower dust temperature measured for NA.v1.489 disfavors a major merger scenario. Furthermore the colder is consistent with a more extended dust distribution (Hwang et al. 2010) as observed from our SMA observations.
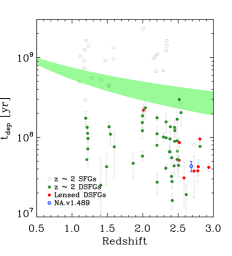
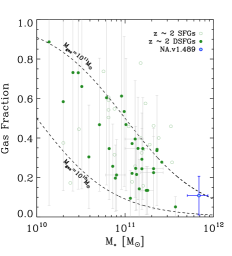
The large molecular gas measured from CO observations is responsible for the intense star-formation observed in NA.v1.489. Similar reservoirs of cold molecular gas are observed in other extreme starbursts at high redshift (Riechers et al. 2011a, 2013; Fu et al. 2013; Spilker et al. 2015). NA.v1.489 has a gas depletion time-scale of () 43 Myr, much shorter than the star-forming galaxies at similar redshifts (Genzel et al. 2010; Decarli et al. 2016a, b) and comparable to gas depletion time-scales in other sub-mm selected dusty galaxies at high redshift (Riechers et al. 2010, 2013). The short time-scale and intense star-formation rates are responsible for the mass build-up in NA.v1.489. Figure 10 shows the gas depletion time-scale of NA.v1.489 compared to normal star-forming and sub-millimeter galaxies at similar and lower redshifts. The star-formation rate efficiency of NA.v1.489 () is much higher than normal star forming galaxies. The intense star-formation in NA.v1.489 is not only because of the huge molecular gas reservoirs, which is comparable in some cases to those of massive star-forming galaxies (Genzel et al. 2010; Tacconi et al. 2013; Genzel et al. 2015), but also to higher SFE that is also observed in other high- SMGs (Fu et al. 2013). Figure 10 shows the SFE of NA.v1.489 as a function of infrared luminosity (; rest-frame ) compared to the normal star-forming and sub-millimeter galaxies. NA.v1.489 in particular has a higher SFE compared to normal star-forming galaxies and local ULIRGs which is also observed in other SMGs at similar redshift (Fu et al. 2012). NA.v1.489, in particular, has a low gas fraction (with ) compared to less massive normal star-forming and sub-millimeter galaxies (Figure 10). Given the high stellar mass and low gas fraction, NA.v1.489 is a SMG that likely has already formed most of the stars.
The molecular gas mass as measured by the CO line luminosity depends on the assumed value for the conversion factor (). One of the main uncertainties in determining the total gas mass in fact lies with the uncertainties associated with the conversion factor (Narayanan et al. 2012; Spilker et al. 2015). In this work, we assumed a conversion factor of to estimate the total molecular gas mass from CO observations. This is lower than the assumed value for the Milky Way ( measured from direct observations of molecular Hydrogen and CO; Strong & Mattox 1996; Leroy et al. 2011; Bolatto et al. 2013) and that of nearby and high redshift normal star-forming galaxies (Sandstrom et al. 2013; Tacconi et al. 2013). The lower conversion factor is more favored for the extreme starburst due to higher gas temperature and velocity dispersions (Narayanan et al. 2011, 2012; Papadopoulos et al. 2012; Bolatto et al. 2013) with the higher values overestimating the molecular gas mass in these systems (Downes et al. 1993; Solomon et al. 1997). This is supported by the dust temperature measured for NA.v1.489 which could be a proxy for gas temperature (Yao et al. 2003). For normal star-forming galaxies analogs of NA.v1.489 (i.e. at similar stellar mass and redshift) could be measured given the metallicity dependent relation provided by Genzel et al. (2015) (see Equations in that paper; see also Dessauges-Zavadsky et al. 2016), where metallicity is estimated at the redshift and stellar mass of NA.v1.489 following the mass-metallicity relation (Erb et al. 2006; Maiolino et al. 2008; Wuyts et al. 2014; Zahid et al. 2014; see Equation 12 in Genzel et al. (2015)). This yields a higher compared to what is assumed for starbursts overestimating the molecular gas. Given the uncertainties one could derive a possible range of molecular gas masses following Ivison et al. (2011) for a range of possible conversion factors. Here we report the gas mass estimate based on which is consistent with what was discussed above.
We investigate the far infrared and radio properties of NA.v1.489 by looking at the FIR/radio ratio () and how it compares with the SMGs at similar and lower redshifts. We measured a for NA.v1.489 which is consistent with the average value derived for samples of far-infrared selected galaxies at lower redshifts (Ivison et al. 2010b) the existence of which reflects the correlation between the processes that produce the underlying emissions; namely star formation activity and synchrotron radiation from supernova processes contributing to FIR and radio emission respectively (Yun et al. 2001; Bell 2003; Chapman et al. 2005; Ivison et al. 2010b; Elbaz et al. 2011; Pannella et al. 2015). The measured is consistent with low redshift (Ivison et al. 2010b; Michałowski et al. 2010a) and high redshift estimates (Pannella et al. 2015) as well as the average value for SMGs (Ivison et al. 2010b; Pannella et al. 2015). In fact Ivison et al. (2010b) showed that the ratio is not evolving with time. The measured radio luminosity of NA.v1.489 () and FIR/radio ratio indicate that NA.v1.489 is not dominated by a radio-loud AGN (with ) or having a radio excess (with ) as defined by Yun et al. (2001). The radio luminosity () as measured by the JVLA, yields a using the calibration in Pannella et al. (2015). This agrees with the SFR measured previously from the infrared luminosity derived from multi-band SED fit with the difference associated with the uncertainties that exist in the calibrations.
6. Summary and Conclusion
We have presented a detailed study of a massive Herschel/SPIRE detected sub-millimeter galaxy at , gravitationally lensed by a Spitzer and WISE detected cluster at . We provide detailed lens modeling of the system through combined Keck and Gemini spectroscopic and imaging observations used to identify foreground cluster members and lensing multiple images. Our best lens model provide a lensing magnification of and for the stellar and dust emissions respectively for NA.v1.489. Multi-band SED fitting, corrected for the lensing magnification, provides physical properties of NA.v1.489 including stellar mass (), total infrared luminosity (; rest-frame m), dust mass () and dust temperature (); see Table 2. We further derived total molecular gas and explored ionization state of the gas from spectroscopic observations of the CO molecular emission lines. The combined physical properties derived from the SED fits and spectroscopic molecular CO line observations reveal that NA.v1.489 is a very massive sub-millimeter galaxy with , putting it as one of the most extreme starbursts during peak epoch of star-formation, without a dominant AGN mode. The low- molecular line luminosities revealed the existence of large reservoir of molecular gas that is being rapidly converted into stars at a much higher pace compared to that of local ULIRGs (see Figure 10). This combined with the measured low gas fraction () and high stellar mass, shows that NA.v1.489 has already assembled most of its mass and is most likely on its way to becoming quiescent, forming a progenitor for the most massive early type galaxies found in the local Universe.
Observations of this galaxy seem to suggest that the location of SMGs on a diagram is consistent with the main sequence of star-formation at the very massive end (Figure 9; Speagle et al. 2014) while still being above the relation which is supported by excessive star-formation rate driving the intense infrared luminosities. This is in contrast to less massive SMGs with much higher observed SFRs compared to normal star-forming galaxies at similar stellar masses at (Figure 9; Tacconi et al. 2010; Magnelli et al. 2012). As discussed above, this indicate that the very massive SMGs are on their way to becoming quiescent systems. We note here that in addition to uncertainties associated with stellar mass (which we addressed in Section 4), uncertainties in the magnifications measured from the lens model could also lead to a high stellar mass. To test the robustness of the derived magnifications in the lens model, we recomputed the magnification using MCMC maximum likelihood which yielded the original magnification factor.
One of the main contributing factors to the transition of galaxies from a star-forming phase to that of quiescence is the feedback associated with AGN activity (Sijacki et al. 2007; Feruglio et al. 2010; Cicone et al. 2014) diluting and heating up the molecular gas ceasing star-formation (Scannapieco et al. 2005). This generally begins with the central black hole gaining mass through constant accretion after which the AGN is ignited (Hopkins et al. 2016). The AGN signature has been observed in SEDs of SMGs in the mid-infrared and X-ray (Alexander et al. 2005; Valiante et al. 2007; Laird et al. 2010). The far-infrared luminosities are however believed to be mainly driven by star-formation activity rather than AGN (Magnelli et al. 2012). High emission line excitation ratios could be evidence for the presence of an AGN, though a lack of such highly excited lines does not necessarily rule out the existence of it. A combined X-ray through radio observations of distant SMGs along with mid-infrared constrained SEDs and emission line ratios is needed to study the presence and role of the AGNs in detail. As discussed above, although we did not see a signature of a dominant AGN mode from CO line ratios in NA.v1.489, the presence of such component could not be ruled out with current observations.
Acknowledgement
We wish to thank the anonymous referee for reading the original manuscript and providing useful suggestions. Financial support for this work was provided by NSF through AST-1313319 for HN and AC. UCI group also acknowledges support from HST-GO-14083.002-A, HST-GO-13718.002-A and NASA NNX16AF38G grants. MN has received funding from the European Unions Horizon 2020 research and innovation program under the Marie Sklodowska-Curie grant agreement No 707601. DR acknowledges support from the National Science Foundation under grant number AST-1614213 to Cornell University. GDZ acknowledges financial support by ASI/INAF agreement n. 2014-024-R.0.. HD acknowledges financial support from the Spanish Ministry of Economy and Competitiveness (MINECO) under the 2014 Ramón y Cajal program MINECO RYC-2014-15686. IO and RJI acknowledge support from the European Research Council in the form of the Advanced Investigator Programme, 321302, cosmicism. JLW is supported by a European Union COFUND/Durham Junior Research Fellowship under EU grant agreement number 267209, and acknowledges additional support from STFC (ST/L00075X/1). Some of the data presented herein were obtained at the W.M. Keck Observatory, which is operated as a scientific partnership among the California Institute of Technology, the University of California and the National Aeronautics and Space Administration. The Observatory was made possible by the generous financial support of the W.M. Keck Foundation. The authors wish to recognize and acknowledge the very significant cultural role and reverence that the summit of Mauna Kea has always had within the indigenous Hawaiian community. We are most fortunate to have the opportunity to conduct observations from this mountain. Data presented herein were obtained using the UCI Remote Observing Facility, made possible by a generous gift from John and Ruth Ann Evans. Support for CARMA construction was derived from the Gordon and Betty Moore Foundation, the Kenneth T. and Eileen L. Norris Foundation, the James S. McDonnell Foundation, the Associates of the California Institute of Technology, the University of Chicago, the states of California, Illinois, and Maryland, and the National Science Foundation. Ongoing CARMA development and operations are supported by NSF grant ATI-0838178 to CARMA, and by the CARMA partner universities. The Submillimeter Array is a joint project between the Smithsonian Astrophysical Observatory and the Academia Sinica Institute of Astronomy and Astrophysics and is funded by the Smithsonian Institution and the Academia Sinica.
References
- Alexander et al. (2005) Alexander, D. M., Bauer, F. E., Chapman, S. C., et al. 2005, ApJ, 632, 736
- Aravena et al. (2014) Aravena, M., Hodge, J. A., Wagg, J., et al. 2014, MNRAS, 442, 558
- Aravena et al. (2016) Aravena, M., Spilker, J. S., Bethermin, M., et al. 2016, MNRAS, 457, 4406
- Barro et al. (2013) Barro, G., Faber, S. M., Pérez-González, P. G., et al. 2013, ApJ, 765, 104
- Becker et al. (1994) Becker, R. H., White, R. L., & Helfand, D. J. 1994, in Astronomical Society of the Pacific Conference Series, Vol. 61, Astronomical Data Analysis Software and Systems III, ed. D. R. Crabtree, R. J. Hanisch, & J. Barnes, 165
- Bell (2003) Bell, E. F. 2003, ApJ, 586, 794
- Bertin & Arnouts (1996) Bertin, E., & Arnouts, S. 1996, A&AS, 117, 393
- Béthermin et al. (2015) Béthermin, M., Daddi, E., Magdis, G., et al. 2015, A&A, 573, A113
- Blain (1996) Blain, A. W. 1996, MNRAS, 283, 1340
- Blain et al. (1999) Blain, A. W., Smail, I., Ivison, R. J., & Kneib, J.-P. 1999, MNRAS, 302, 632
- Bolatto et al. (2013) Bolatto, A. D., Wolfire, M., & Leroy, A. K. 2013, ARA&A, 51, 207
- Bothwell et al. (2013) Bothwell, M. S., Smail, I., Chapman, S. C., et al. 2013, MNRAS, 429, 3047
- Bower et al. (2006) Bower, R. G., Benson, A. J., Malbon, R., et al. 2006, MNRAS, 370, 645
- Brinchmann et al. (2004) Brinchmann, J., Charlot, S., White, S. D. M., et al. 2004, MNRAS, 351, 1151
- Bruzual & Charlot (2003) Bruzual, G., & Charlot, S. 2003, MNRAS, 344, 1000
- Bussmann et al. (2012) Bussmann, R. S., Gurwell, M. A., Fu, H., et al. 2012, ApJ, 756, 134
- Bussmann et al. (2013) Bussmann, R. S., Pérez-Fournon, I., Amber, S., et al. 2013, ApJ, 779, 25
- Bussmann et al. (2015) Bussmann, R. S., Riechers, D., Fialkov, A., et al. 2015, ApJ, 812, 43
- Cañameras et al. (2015) Cañameras, R., Nesvadba, N. P. H., Guery, D., et al. 2015, A&A, 581, A105
- Capak et al. (2008) Capak, P., Carilli, C. L., Lee, N., et al. 2008, ApJ, 681, L53
- Carilli & Walter (2013) Carilli, C. L., & Walter, F. 2013, ARA&A, 51, 105
- Casey et al. (2014) Casey, C. M., Narayanan, D., & Cooray, A. 2014, Phys. Rep., 541, 45
- Casey et al. (2009) Casey, C. M., Chapman, S. C., Beswick, R. J., et al. 2009, MNRAS, 399, 121
- Casey et al. (2012) Casey, C. M., Berta, S., Béthermin, M., et al. 2012, ApJ, 761, 140
- Chabrier (2003) Chabrier, G. 2003, PASP, 115, 763
- Chapman et al. (2005) Chapman, S. C., Blain, A. W., Smail, I., & Ivison, R. J. 2005, ApJ, 622, 772
- Charlot & Fall (2000) Charlot, S., & Fall, S. M. 2000, ApJ, 539, 718
- Cicone et al. (2014) Cicone, C., Maiolino, R., Sturm, E., et al. 2014, A&A, 562, A21
- Cole et al. (1994) Cole, S., Aragon-Salamanca, A., Frenk, C. S., Navarro, J. F., & Zepf, S. E. 1994, MNRAS, 271, 781
- Condon et al. (1998) Condon, J. J., Cotton, W. D., Greisen, E. W., et al. 1998, AJ, 115, 1693
- Conroy (2013) Conroy, C. 2013, ARA&A, 51, 393
- da Cunha et al. (2008) da Cunha, E., Charlot, S., & Elbaz, D. 2008, MNRAS, 388, 1595
- da Cunha et al. (2015) da Cunha, E., Walter, F., Smail, I. R., et al. 2015, ApJ, 806, 110
- Daddi et al. (2015) Daddi, E., Dannerbauer, H., Liu, D., et al. 2015, A&A, 577, A46
- Davé et al. (2012) Davé, R., Finlator, K., & Oppenheimer, B. D. 2012, MNRAS, 421, 98
- Davé et al. (2010) Davé, R., Finlator, K., Oppenheimer, B. D., et al. 2010, MNRAS, 404, 1355
- Decarli et al. (2016a) Decarli, R., Walter, F., Aravena, M., et al. 2016a, ApJ, 833, 69
- Decarli et al. (2016b) —. 2016b, ApJ, 833, 70
- Dekel et al. (2009) Dekel, A., Birnboim, Y., Engel, G., et al. 2009, Nature, 457, 451
- Dessauges-Zavadsky et al. (2015) Dessauges-Zavadsky, M., Zamojski, M., Schaerer, D., et al. 2015, A&A, 577, A50
- Dessauges-Zavadsky et al. (2016) Dessauges-Zavadsky, M., Zamojski, M., Rujopakarn, W., et al. 2016, ArXiv e-prints, arXiv:1610.08065
- Downes & Solomon (1998) Downes, D., & Solomon, P. M. 1998, ApJ, 507, 615
- Downes et al. (1993) Downes, D., Solomon, P. M., & Radford, S. J. E. 1993, ApJ, 414, L13
- Draine & Lee (1984) Draine, B. T., & Lee, H. M. 1984, ApJ, 285, 89
- Dye et al. (2015) Dye, S., Furlanetto, C., Swinbank, A. M., et al. 2015, MNRAS, 452, 2258
- Eales et al. (2010) Eales, S., Dunne, L., Clements, D., et al. 2010, PASP, 122, 499
- Elbaz et al. (2011) Elbaz, D., Dickinson, M., Hwang, H. S., et al. 2011, A&A, 533, A119
- Engel et al. (2010) Engel, H., Tacconi, L. J., Davies, R. I., et al. 2010, ApJ, 724, 233
- Erb et al. (2006) Erb, D. K., Shapley, A. E., Pettini, M., et al. 2006, ApJ, 644, 813
- Faber et al. (2003) Faber, S. M., Phillips, A. C., Kibrick, R. I., et al. 2003, in Proc. SPIE, Vol. 4841, Instrument Design and Performance for Optical/Infrared Ground-based Telescopes, ed. M. Iye & A. F. M. Moorwood, 1657–1669
- Fanaroff & Riley (1974) Fanaroff, B. L., & Riley, J. M. 1974, MNRAS, 167, 31P
- Feruglio et al. (2010) Feruglio, C., Maiolino, R., Piconcelli, E., et al. 2010, A&A, 518, L155
- Frayer et al. (1998) Frayer, D. T., Ivison, R. J., Scoville, N. Z., et al. 1998, ApJ, 506, L7
- Frayer et al. (1999) —. 1999, ApJ, 514, L13
- Frayer et al. (2008) Frayer, D. T., Koda, J., Pope, A., et al. 2008, ApJ, 680, L21
- Frayer et al. (2011) Frayer, D. T., Harris, A. I., Baker, A. J., et al. 2011, ApJ, 726, L22
- Fu et al. (2012) Fu, H., Jullo, E., Cooray, A., et al. 2012, ApJ, 753, 134
- Fu et al. (2013) Fu, H., Cooray, A., Feruglio, C., et al. 2013, Nature, 498, 338
- Furlong et al. (2015) Furlong, M., Bower, R. G., Theuns, T., et al. 2015, MNRAS, 450, 4486
- Gavazzi et al. (2011) Gavazzi, R., Cooray, A., Conley, A., et al. 2011, ApJ, 738, 125
- Genzel et al. (2008) Genzel, R., Burkert, A., Bouché, N., et al. 2008, ApJ, 687, 59
- Genzel et al. (2010) Genzel, R., Tacconi, L. J., Gracia-Carpio, J., et al. 2010, MNRAS, 407, 2091
- Genzel et al. (2015) Genzel, R., Tacconi, L. J., Lutz, D., et al. 2015, ApJ, 800, 20
- Granato et al. (2004) Granato, G. L., De Zotti, G., Silva, L., Bressan, A., & Danese, L. 2004, ApJ, 600, 580
- Greve et al. (2005) Greve, T. R., Bertoldi, F., Smail, I., et al. 2005, MNRAS, 359, 1165
- Griffin et al. (2010) Griffin, M. J., Abergel, A., Abreu, A., et al. 2010, A&A, 518, L3
- Hainline et al. (2011) Hainline, L. J., Blain, A. W., Smail, I., et al. 2011, ApJ, 740, 96
- Harris et al. (2012) Harris, A. I., Baker, A. J., Frayer, D. T., et al. 2012, ApJ, 752, 152
- Hayward et al. (2011) Hayward, C. C., Kereš, D., Jonsson, P., et al. 2011, ApJ, 743, 159
- Hayward & Smith (2015a) Hayward, C. C., & Smith, D. J. B. 2015a, MNRAS, 446, 1512
- Hayward & Smith (2015b) —. 2015b, MNRAS, 446, 1512
- Hemmati et al. (2015) Hemmati, S., Mobasher, B., Darvish, B., et al. 2015, ApJ, 814, 46
- Hemmati et al. (2017) Hemmati, S., Yan, L., Diaz-Santos, T., et al. 2017, ApJ, 834, 36
- Hemmati et al. (2014) Hemmati, S., Miller, S. H., Mobasher, B., et al. 2014, ApJ, 797, 108
- Ho et al. (2004) Ho, P. T. P., Moran, J. M., & Lo, K. Y. 2004, ApJ, 616, L1
- Hodge et al. (2015) Hodge, J. A., Riechers, D., Decarli, R., et al. 2015, ApJ, 798, L18
- Hopkins et al. (2013) Hopkins, P. F., Cox, T. J., Hernquist, L., et al. 2013, MNRAS, 430, 1901
- Hopkins et al. (2008) Hopkins, P. F., Hernquist, L., Cox, T. J., & Kereš, D. 2008, ApJS, 175, 356
- Hopkins et al. (2016) Hopkins, P. F., Torrey, P., Faucher-Giguère, C.-A., Quataert, E., & Murray, N. 2016, MNRAS, 458, 816
- Horne (1986) Horne, K. 1986, PASP, 98, 609
- Hwang et al. (2010) Hwang, H. S., Elbaz, D., Magdis, G., et al. 2010, MNRAS, 409, 75
- Iglesias-Páramo et al. (2007) Iglesias-Páramo, J., Buat, V., Hernández-Fernández, J., et al. 2007, ApJ, 670, 279
- Ivison et al. (2011) Ivison, R. J., Papadopoulos, P. P., Smail, I., et al. 2011, MNRAS, 412, 1913
- Ivison et al. (2000) Ivison, R. J., Smail, I., Barger, A. J., et al. 2000, MNRAS, 315, 209
- Ivison et al. (1998) Ivison, R. J., Smail, I., Le Borgne, J.-F., et al. 1998, MNRAS, 298, 583
- Ivison et al. (2010a) Ivison, R. J., Swinbank, A. M., Swinyard, B., et al. 2010a, A&A, 518, L35
- Ivison et al. (2010b) Ivison, R. J., Magnelli, B., Ibar, E., et al. 2010b, A&A, 518, L31
- Ivison et al. (2013) Ivison, R. J., Swinbank, A. M., Smail, I., et al. 2013, ApJ, 772, 137
- Jullo & Kneib (2009) Jullo, E., & Kneib, J.-P. 2009, MNRAS, 395, 1319
- Jullo et al. (2007) Jullo, E., Kneib, J.-P., Limousin, M., et al. 2007, New Journal of Physics, 9, 447
- Kauffmann et al. (1993) Kauffmann, G., White, S. D. M., & Guiderdoni, B. 1993, MNRAS, 264, 201
- Kauffmann et al. (2003) Kauffmann, G., Heckman, T. M., White, S. D. M., et al. 2003, MNRAS, 341, 33
- Kennicutt (1998) Kennicutt, Jr., R. C. 1998, ARA&A, 36, 189
- Kneib et al. (1996) Kneib, J.-P., Ellis, R. S., Smail, I., Couch, W. J., & Sharples, R. M. 1996, ApJ, 471, 643
- Koprowski et al. (2014) Koprowski, M. P., Dunlop, J. S., Michałowski, M. J., Cirasuolo, M., & Bowler, R. A. A. 2014, MNRAS, 444, 117
- Koprowski et al. (2016) Koprowski, M. P., Dunlop, J. S., Michałowski, M. J., et al. 2016, MNRAS, 458, 4321
- Kormendy & Kennicutt (2004) Kormendy, J., & Kennicutt, Jr., R. C. 2004, ARA&A, 42, 603
- Kruijssen et al. (2014) Kruijssen, J. M. D., Longmore, S. N., Elmegreen, B. G., et al. 2014, MNRAS, 440, 3370
- Laird et al. (2010) Laird, E. S., Nandra, K., Pope, A., & Scott, D. 2010, MNRAS, 401, 2763
- Law et al. (2009) Law, D. R., Steidel, C. C., Erb, D. K., et al. 2009, ApJ, 697, 2057
- Lawrence et al. (2007) Lawrence, A., Warren, S. J., Almaini, O., et al. 2007, MNRAS, 379, 1599
- Leroy et al. (2011) Leroy, A. K., Bolatto, A., Gordon, K., et al. 2011, ApJ, 737, 12
- Leroy et al. (2013) Leroy, A. K., Walter, F., Sandstrom, K., et al. 2013, AJ, 146, 19
- Madau & Dickinson (2014) Madau, P., & Dickinson, M. 2014, ARA&A, 52, 415
- Magdis et al. (2010) Magdis, G. E., Elbaz, D., Hwang, H. S., et al. 2010, MNRAS, 409, 22
- Magdis et al. (2012) Magdis, G. E., Daddi, E., Béthermin, M., et al. 2012, ApJ, 760, 6
- Magnelli et al. (2012) Magnelli, B., Lutz, D., Santini, P., et al. 2012, A&A, 539, A155
- Magnelli et al. (2014) Magnelli, B., Lutz, D., Saintonge, A., et al. 2014, A&A, 561, A86
- Maiolino et al. (2008) Maiolino, R., Nagao, T., Grazian, A., et al. 2008, A&A, 488, 463
- Mancuso et al. (2016) Mancuso, C., Lapi, A., Shi, J., et al. 2016, ApJ, 823, 128
- Mannucci et al. (2010) Mannucci, F., Cresci, G., Maiolino, R., Marconi, A., & Gnerucci, A. 2010, MNRAS, 408, 2115
- Messias et al. (2014) Messias, H., Dye, S., Nagar, N., et al. 2014, A&A, 568, A92
- Michałowski et al. (2010a) Michałowski, M., Hjorth, J., & Watson, D. 2010a, A&A, 514, A67
- Michałowski et al. (2012a) Michałowski, M. J., Dunlop, J. S., Cirasuolo, M., et al. 2012a, A&A, 541, A85
- Michałowski et al. (2012b) —. 2012b, A&A, 541, A85
- Michałowski et al. (2014) Michałowski, M. J., Hayward, C. C., Dunlop, J. S., et al. 2014, A&A, 571, A75
- Michałowski et al. (2008) Michałowski, M. J., Hjorth, J., Castro Cerón, J. M., & Watson, D. 2008, ApJ, 672, 817
- Michałowski et al. (2010b) Michałowski, M. J., Hjorth, J., & Watson, D. 2010b, A&A, 514, A67
- Michałowski et al. (2010c) Michałowski, M. J., Watson, D., & Hjorth, J. 2010c, ApJ, 712, 942
- Michałowski et al. (2009) Michałowski, M. J., Hjorth, J., Malesani, D., et al. 2009, ApJ, 693, 347
- Michałowski et al. (2016) Michałowski, M. J., Dunlop, J. S., Koprowski, M. P., et al. 2016, ArXiv e-prints, arXiv:1610.02409
- Mocanu et al. (2013) Mocanu, L. M., Crawford, T. M., Vieira, J. D., et al. 2013, ApJ, 779, 61
- Narayanan et al. (2011) Narayanan, D., Krumholz, M., Ostriker, E. C., & Hernquist, L. 2011, MNRAS, 418, 664
- Narayanan et al. (2012) Narayanan, D., Krumholz, M. R., Ostriker, E. C., & Hernquist, L. 2012, MNRAS, 421, 3127
- Narayanan et al. (2015) Narayanan, D., Turk, M., Feldmann, R., et al. 2015, Nature, 525, 496
- Navarro et al. (1996) Navarro, J. F., Frenk, C. S., & White, S. D. M. 1996, ApJ, 462, 563
- Nayyeri et al. (2014) Nayyeri, H., Mobasher, B., Hemmati, S., et al. 2014, ApJ, 794, 68
- Nayyeri et al. (2016) Nayyeri, H., Keele, M., Cooray, A., et al. 2016, ApJ, 823, 17
- Negrello et al. (2010) Negrello, M., Hopwood, R., De Zotti, G., et al. 2010, Science, 330, 800
- Negrello et al. (2014) Negrello, M., Hopwood, R., Dye, S., et al. 2014, MNRAS, 440, 1999
- Negrello et al. (2016) Negrello, M., Amber, S., Amvrosiadis, A., et al. 2016, ArXiv e-prints, arXiv:1611.03922
- Noeske et al. (2007) Noeske, K. G., Weiner, B. J., Faber, S. M., et al. 2007, ApJ, 660, L43
- Oke & Gunn (1983) Oke, J. B., & Gunn, J. E. 1983, ApJ, 266, 713
- Oteo et al. (2016) Oteo, I., Ivison, R. J., Dunne, L., et al. 2016, ApJ, 827, 34
- Ott (2010) Ott, S. 2010, in Astronomical Society of the Pacific Conference Series, Vol. 434, Astronomical Data Analysis Software and Systems XIX, ed. Y. Mizumoto, K.-I. Morita, & M. Ohishi, 139
- Pannella et al. (2015) Pannella, M., Elbaz, D., Daddi, E., et al. 2015, ApJ, 807, 141
- Papadopoulos et al. (2012) Papadopoulos, P. P., van der Werf, P. P., Xilouris, E. M., et al. 2012, MNRAS, 426, 2601
- Peng et al. (2002) Peng, C. Y., Ho, L. C., Impey, C. D., & Rix, H.-W. 2002, AJ, 124, 266
- Pilbratt et al. (2010) Pilbratt, G. L., Riedinger, J. R., Passvogel, T., et al. 2010, A&A, 518, L1
- Rawle et al. (2014) Rawle, T. D., Egami, E., Bussmann, R. S., et al. 2014, ApJ, 783, 59
- Riechers et al. (2011a) Riechers, D. A., Hodge, J., Walter, F., Carilli, C. L., & Bertoldi, F. 2011a, ApJ, 739, L31
- Riechers et al. (2010) Riechers, D. A., Capak, P. L., Carilli, C. L., et al. 2010, ApJ, 720, L131
- Riechers et al. (2011b) Riechers, D. A., Cooray, A., Omont, A., et al. 2011b, ApJ, 733, L12
- Riechers et al. (2013) Riechers, D. A., Bradford, C. M., Clements, D. L., et al. 2013, Nature, 496, 329
- Riechers et al. (2014) Riechers, D. A., Carilli, C. L., Capak, P. L., et al. 2014, ApJ, 796, 84
- Rybak et al. (2015) Rybak, M., Vegetti, S., McKean, J. P., Andreani, P., & White, S. D. M. 2015, MNRAS, 453, L26
- Saintonge et al. (2013) Saintonge, A., Lutz, D., Genzel, R., et al. 2013, ApJ, 778, 2
- Sandstrom et al. (2013) Sandstrom, K. M., Leroy, A. K., Walter, F., et al. 2013, ApJ, 777, 5
- Scannapieco et al. (2005) Scannapieco, E., Silk, J., & Bouwens, R. 2005, ApJ, 635, L13
- Scoville et al. (2014) Scoville, N., Aussel, H., Sheth, K., et al. 2014, ApJ, 783, 84
- Scoville et al. (2016) Scoville, N., Sheth, K., Aussel, H., et al. 2016, ApJ, 820, 83
- Sharon et al. (2016) Sharon, C. E., Riechers, D. A., Hodge, J., et al. 2016, ApJ, 827, 18
- Shivaei et al. (2015) Shivaei, I., Reddy, N. A., Shapley, A. E., et al. 2015, ArXiv e-prints, arXiv:1507.03017
- Sijacki et al. (2007) Sijacki, D., Springel, V., Di Matteo, T., & Hernquist, L. 2007, MNRAS, 380, 877
- Silva et al. (1998) Silva, L., Granato, G. L., Bressan, A., & Danese, L. 1998, ApJ, 509, 103
- Solomon et al. (1997) Solomon, P. M., Downes, D., Radford, S. J. E., & Barrett, J. W. 1997, ApJ, 478, 144
- Solomon & Vanden Bout (2005) Solomon, P. M., & Vanden Bout, P. A. 2005, ARA&A, 43, 677
- Speagle et al. (2014) Speagle, J. S., Steinhardt, C. L., Capak, P. L., & Silverman, J. D. 2014, ApJS, 214, 15
- Spilker et al. (2015) Spilker, J. S., Aravena, M., Marrone, D. P., et al. 2015, ApJ, 811, 124
- Stanford et al. (2014) Stanford, S. A., Gonzalez, A. H., Brodwin, M., et al. 2014, ApJS, 213, 25
- Strandet et al. (2016) Strandet, M. L., Weiss, A., Vieira, J. D., et al. 2016, ApJ, 822, 80
- Strong & Mattox (1996) Strong, A. W., & Mattox, J. R. 1996, A&A, 308, L21
- Su et al. (2017) Su, T., Marriage, T. A., Asboth, V., et al. 2017, MNRAS, 464, 968
- Swinbank et al. (2010) Swinbank, A. M., Smail, I., Chapman, S. C., et al. 2010, MNRAS, 405, 234
- Swinbank et al. (2011) Swinbank, A. M., Papadopoulos, P. P., Cox, P., et al. 2011, ApJ, 742, 11
- Swinbank et al. (2015) Swinbank, A. M., Dye, S., Nightingale, J. W., et al. 2015, ApJ, 806, L17
- Symeonidis et al. (2013) Symeonidis, M., Vaccari, M., Berta, S., et al. 2013, MNRAS, 431, 2317
- Tacconi et al. (2006) Tacconi, L. J., Neri, R., Chapman, S. C., et al. 2006, ApJ, 640, 228
- Tacconi et al. (2008) Tacconi, L. J., Genzel, R., Smail, I., et al. 2008, ApJ, 680, 246
- Tacconi et al. (2010) Tacconi, L. J., Genzel, R., Neri, R., et al. 2010, Nature, 463, 781
- Tacconi et al. (2013) Tacconi, L. J., Neri, R., Genzel, R., et al. 2013, ApJ, 768, 74
- Thomson et al. (2012) Thomson, A. P., Ivison, R. J., Smail, I., et al. 2012, MNRAS, 425, 2203
- Timmons et al. (2015) Timmons, N., Cooray, A., Nayyeri, H., et al. 2015, ApJ, 805, 140
- Toft et al. (2014) Toft, S., Smolčić, V., Magnelli, B., et al. 2014, ApJ, 782, 68
- Valiante et al. (2007) Valiante, E., Lutz, D., Sturm, E., et al. 2007, ApJ, 660, 1060
- Valiante et al. (2016) Valiante, E., Smith, M. W. L., Eales, S., et al. 2016, ArXiv e-prints, arXiv:1606.09615
- Wang et al. (2013) Wang, S. X., Brandt, W. N., Luo, B., et al. 2013, ApJ, 778, 179
- Wardlow et al. (2011) Wardlow, J. L., Smail, I., Coppin, K. E. K., et al. 2011, MNRAS, 415, 1479
- Wardlow et al. (2013) Wardlow, J. L., Cooray, A., De Bernardis, F., et al. 2013, ApJ, 762, 59
- Weiß et al. (2013) Weiß, A., De Breuck, C., Marrone, D. P., et al. 2013, ApJ, 767, 88
- Wright et al. (2010) Wright, E. L., Eisenhardt, P. R. M., Mainzer, A. K., et al. 2010, AJ, 140, 1868
- Wuyts et al. (2014) Wuyts, E., Kurk, J., Förster Schreiber, N. M., et al. 2014, ApJ, 789, L40
- Wuyts et al. (2011) Wuyts, S., Förster Schreiber, N. M., van der Wel, A., et al. 2011, ApJ, 742, 96
- Yao et al. (2003) Yao, L., Seaquist, E. R., Kuno, N., & Dunne, L. 2003, ApJ, 588, 771
- Yun et al. (2001) Yun, M. S., Reddy, N. A., & Condon, J. J. 2001, ApJ, 554, 803
- Zahid et al. (2014) Zahid, H. J., Dima, G. I., Kudritzki, R.-P., et al. 2014, ApJ, 791, 130