Hierarchical tissue organization as a general mechanism to limit the accumulation of somatic mutations
Abstract
Abstract
How can tissues generate large numbers of cells, yet keep the divisional load (the number of divisions along cell lineages) low in order to curtail the accumulation of somatic mutations and reduce the risk of cancer? To answer the question we consider a general model of hierarchically organized self-renewing tissues and show that the lifetime divisional load of such a tissue is independent of the details of the cell differentiation processes, and depends only on two structural and two dynamical parameters. Our results demonstrate that a strict analytical relationship exists between two seemingly disparate characteristics of self-renewing tissues: divisional load and tissue organization. Most remarkably, we find that a sufficient number of progressively slower dividing cell types can be almost as efficient in minimizing the divisional load, as non-renewing tissues. We argue that one of the main functions of tissue-specific stem cells and differentiation hierarchies is the prevention of cancer.
Introduction
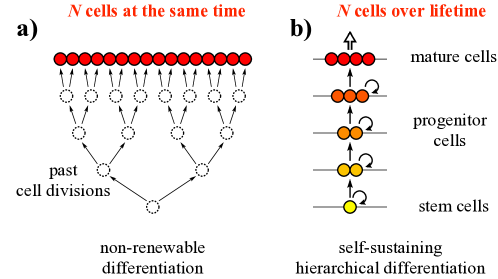
In each multicellular organism a single cell proliferates to produce and maintain tissues comprised of large populations of differentiated cell types. The number of cell divisions in the lineage leading to a given somatic cell governs the pace at which mutations accumulate Gao:2016 . The resulting somatic mutational load determines the rate at which unwanted evolutionary processes, such as cancer development, proceed Nowell:1976 ; Merlo:2006 ; Beerenwinkel:2016 . In order to produce differentiated cells from a single precursor cell the theoretical minimum number of cell divisions required along the longest lineage is . To achieve this theoretical minimum, cells must divide strictly along a perfect binary tree of height (Fig. 1a). In multicellular organisms such differentiation typically takes place early in development. It is responsible for producing the cells of non-renewing tissues (e.g., primary oocytes in the female germ line Crow:2000 ; Gao:2016 ) and the initial population of stem cells in self-renewing tissues (e.g., hematopoietic stem cells Busch:2015 ; Werner:2015 ; Werner:2015_eLife or the spermatogonia of the male germ line Crow:2000 ; Gao:2016 ).
In self-renewing tissues, which require a continuous supply of cells, divisions along a perfect binary tree are unfeasible. Strictly following a perfect binary tree throughout the lifetime of the organism would require extraordinarily elaborate scheduling of individual cell divisions to ensure tissue homeostasis Morris:2014 , and would be singularly prone to errors (e.g., the loss of any single cell would lead to the loss of an entire branch of the binary tree). Instead, to compensate for the continuous loss of cells, mechanisms have evolved to replenish the cell pool throughout the organism’s lifetime Pardee:1989 . In most multicellular organisms hierarchically organized tissue structures are utilized. At the root of the hierarchy are a few tissue-specific stem cells defined by two properties: self-replication and the potential for differentiation Till:1961 ; McCulloch:2005 . During cell proliferation cells can differentiate and become increasingly specialized toward performing specific functions within the hierarchy, while at the same time losing their stem cell-like properties (Fig. 1b). A classic example is the hematopoietic system Michor:2005 ; Dingli:2007 , but other tissues such as skin Tumbar:2004 or colon Barker:2007 ; Potten:2009 are also known to be hierarchically organized. Identifying each level of the hierarchy, however, can be difficult, especially if the cells at different levels are only distinguished by their environment, such as their position in the tissue (e.g., the location of the transit-amplifying cells along intestinal crypts). As a result, information on the details of differentiation hierarchies is incomplete Rossi:2008 ; Vermeulen:2013 ; Sutherland:2015 .
Nonetheless, in a recent paper, Tomasetti and Vogelstein Tomasetti:2015 gathered available information from the literature and investigated the determinants of cancer risk among tumors of different tissues. Examining cancers of 31 different tissues they found that the lifetime risk of cancers of different types is strongly correlated with the total number of divisions of the normal self-replicating cells. Their conclusion that the majority of cancer risk is attributable to bad luck Tomasetti:2015 arguably results from a misinterpretation of the correlation between the logarithms of two quantities Wild:2015 ; Wu:2016 . However, regardless of the interpretation of the correlation, the data display a striking tendency: the dependence of cancer incidence on the number of stem cell divisions is sub-linear, i.e., a 100 fold increase in the number of divisions only results in a 10 fold increase in incidence. This indicates that tissues with a larger number of stem cell divisions (typically larger ones with rapid turnover, e.g., the colon) are relatively less prone to develop cancer. This is analogous to the roughly constant cancer incidence across animals with vastly different sizes and life-spans (Peto’s paradox), which implies that large animals (e.g., elephants) possess mechanisms to mitigate their risk relative to smaller ones (e.g., mice) Peto:1975 ; Caulin:2011 ; Peto:2015 .
What are the tissue-specific mechanisms that explain the differential propensity to develop cancer? It is clear that stem cells that sustain hierarchies of progressively differentiated cells are well positioned to provide a safe harbor for genomic information. Qualitative arguments suggesting that hierarchically organized tissues may be optimal in reducing the accumulation of somatic mutations go back several decades Hindersin:2016 . As mutations provide the fuel for somatic evolution (including not only the development of cancer, but also tissue degeneration, aging, germ line deterioration, etc.) it is becoming widely accepted that tissues have evolved to minimize the accumulation of somatic mutations during the lifetime of an individual Hindersin:2016 . The potential of hierarchical tissues to limit somatic mutational load simply by reducing the number of cell divisions along cell lineages, however, has not been explored in a mathematically rigorous way. Here, we discuss this most fundamental mechanism by which hierarchical tissue organization can curtail the accumulation of somatic mutations. We derive simple and general analytical properties of the divisional load of a tissue, which is defined as the number of divisions its constituent cells have undergone along the longest cell lineages, and is expected to be proportional to the mutational load of the tissue.
Models conceptually similar to ours have a long history Loeffler:1980 ; Nowak:2003 ; Takizawa:2011sf ; Pepper:2007 ; Werner:2011 ; Werner:2013 ; Werner:2015 , going back to Loeffler and Wichman’s work on modeling hematopoietic stem cell proliferation Loeffler:1980 , and several qualitative arguments have been made suggesting why hierarchically organized tissues may be optimal in minimizing somatic evolution. In a seminal contribution Nowak et al. Nowak:2003 showed that tissue architecture can contribute to the protection against the accumulation of somatic mutations. They demonstrated that the rate of somatic evolution will be reduced in any tissue where geometric arrangement or cellular differentiation induce structural asymmetries such that mutations that do not occur in stem cells tend to be washed out of the cell population, slowing down the rate of fixation of mutations. Here, we begin where Nowak et al. Nowak:2003 left off: aside of structural asymmetry, we consider a second and equally important aspect of differentiation, the dynamical asymmetry of tissues, i.e., the uneven distribution of divisional rates across the differentiation hierarchy.
More recently a series of studies have investigated the dynamics of mutations in hierarchical tissues with dynamical asymmetry Pepper:2007 ; Werner:2011 ; Werner:2013 and found that hierarchical tissue organization can (i) suppress single Werner:2011 as well as multiple mutations Werner:2013 that arise in progenitor cells, and (ii) slow down the rate of somatic evolution towards cancer Pepper:2007 if selection on mutations with non-neutral phenotypic effects is also taken into account. The epistatic interactions between individual driver mutations are, however, often unclear and show large variation among cancer types. The fact that the majority of cancers arise without a histologically discernible premalignant phase indicates strong cooperation between driver mutations, suggesting that major histological changes may not take place until the full repertoire of mutations is acquired Martincorena:2015rev . For this reason, here we do not consider selection between cells, but rather, focus only on the pace of the accumulation of somatic mutations in tissues, which provide the fuel for somatic evolution.
The uneven distribution of divisional rates considered by Werner et al. Werner:2011 ; Werner:2013 followed a power law, however, this distribution was taken for granted without prior justification. Their focus was instead on “reproductive capacity”, an attribute of a single cell corresponding to the number of its descendants, which is conceptually unrelated to our newly introduced “divisional load”, which characterizes the number of cell divisions along the longest cell lineages of the tissue. Here we show mathematically, to the best of our knowledge for the first time, that the minimization of the divisional load in hierarchical differentiation indeed leads to power law distributed differentiation rates.
More generally, evolutionary thinking is becoming an indispensable tool to understand cancer, and even to propose directions in the search for treatment strategies Komarova:2015 . Models that integrate information on tissue organization have not only provided novel insight into cancer as an evolutionary process Rejniak:2011 ; Altrock:2015 ; Hindersin:2016 , but have also produced direct predictions for improved treatment Michor:2015 ; Tang:2016 ; Werner:2016 . The simple and intuitive relations that we derive below have the potential to further this field of research by providing quantitative grounds for the deep connection between organization principles of tissues and disease prevention and treatment.
According to our results, the lifetime divisional load of a hierarchically organized tissue is independent of the details of the cell differentiation processes. We show that in self-renewing tissues hierarchical organization provides a robust and nearly ideal mechanism to limit the divisional load of tissues and, as a result, minimize the accumulation of somatic mutations that fuel somatic evolution and can lead to cancer. We argue that hierarchies are how the tissues of multicellular organisms keep the accumulation of mutations in check, and that populations of cells currently believed to correspond to tissue-specific stem cells may in general constitute a diverse set of slower dividing cell types Li:2010 ; Busch:2015 . Most importantly, we find that the theoretical minimum number of cell divisions can be very closely approached: as long as a sufficient number of progressively slower dividing cell types towards the root of the hierarchy are present, optimal self-sustaining differentiation hierarchies can produce terminally differentiated cells during the course of an organism’s lifetime from a single precursor with no more than cell divisions along any lineage.
Results
Divisional load of cell differentiation hierarchies
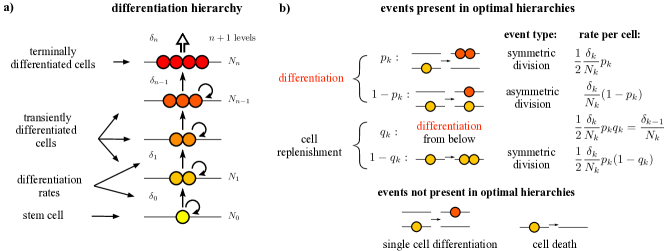
To quantify how many times the cells of self-renewing tissues undergo cell divisions during tissue development and maintenance, we consider a minimal generic model of hierarchically organized, self-sustaining tissue. According to the model, cells are organized into hierarchical levels based on their differentiation state. The bottom level (level ) corresponds to tissue-specific stem cells, higher levels represent progressively differentiated progenitor cells, and the top level (level ) is comprised of terminally differentiated cells (Fig. 2a). The number of cells at level in fully developed tissue under normal homeostatic conditions is denoted by . During homeostasis cells at levels can differentiate (i.e., produce cells for level ) at a rate , and have the potential for self-replication. At the topmost level of the hierarchy terminally differentiated cells can no longer divide and are expended at the same rate that they are produced from the level below. The differentiation rates are defined as the total number of differentiated cells produced by the cells of level per unit time. The differentiation rate of a single cell is, thus .
In principle five microscopic events can occur with a cell: (i) symmetric cell division with differentiation, (ii) asymmetric cell division, (iii) symmetric cell division without differentiation, (iv) single cell differentiation, and (v) cell death (Fig. 2b). Our goal is to determine the optimal tissue organization and dynamics that minimize the number of cell divisions that the cells undergo until they become terminally differentiated. For this reason cell death, except for the continuous expenditure of terminally differentiated cells, is disallowed as it can only increase the number of divisions. We note, however, that cell death with a rate proportional to that of cell divisions would simply result in a proportionally increased divisional load and, thus, would have no effect on the optimum.
Similarly, we also disregard single cell differentiation, because if it is rare enough (i.e., its rate is smaller than the asymmetric cell division rate plus twice the rate of symmetric cell division without differentiation) then it can be absorbed in cell divisions with differentiation; otherwise it would merely delegate the replication burden down the hierarchy towards the less differentiated and supposedly less frequently dividing cells, and would be sub-optimal.
Two of the remaining three microscopic events involve differentiation. If we denote the fraction of differentiation events that occur via symmetric cell division at level by , then the rate of symmetric cell division at level can be written as (the division by accounts for the two daughter cells produced by a single division), while the rate of asymmetric cell division is . Symmetric cell division with differentiation leaves an empty site at level , which will be replenished either (i) by differentiation from the level below or (ii) by division on the same level. Assuming the first case and denoting the fraction of replenishment events that occur by differentiation from the level below by , the combined rate of the contributing processes (asymmetric cell division and symmetric cell division with differentiation from the level below) can be written as . By definition this is equal to , the differentiation rate from level , leading to the recursion relation
| (1) |
Alternatively, if replenishment occurs by cell division on the same level , i.e., as a result of symmetric cell division without differentiation, the corresponding rate is .
To keep track of how cell divisions accumulate along cell lineages during tissue renewal, we introduce the divisional load for each level separately defined as the average number of divisions that cells at level have undergone by time since the stem cell level was created at time zero.
Using the rates of the microscopic events (also shown in Fig. 2b), considering that each division increases the accumulated number of divisions of both daughter cells by one, and taking into account the divisional loads that the departure of cells take and the arrival of cells bring, the following mean-field differential equation system can be formulated for the time evolution of the total divisional load () of levels of a fully developed tissue:
| (2) |
Because stem cells cannot be replenished from below we have . The terminal level can be included in the system of equations by specifying and formally defining .
The above equations are valid when each level contains the prescribed number of cells of a fully developed, homeostatic tissue and, therefore, do not directly describe the initial development of the tissue from the original stem cells. This shortcoming can, however, be remedied by introducing virtual cells that at the initial moment () fill up all levels. As the virtual cells gradually differentiate to higher levels of the hierarchy, they are replaced by the descendants of the stem cells. Tissue development is completed when the non-virtual descendants of the initial stem cell population fill the terminally differentiated level for the first time, expelling all virtual cells. Using this approach the initial development of the tissue is assumed to follow the same dynamics as the self-renewal of the fully developed tissue. Even though cell divisions in a developing tissue might occur at an elevated pace, such differences in the overall pace of cell divisions (along with any temporal variation in the tissue dynamics) are irrelevant, as long as only the relation between the number of cell divisions and the number of cells generated are concerned.
Using the recursion relation the above differential equation system simplifies to
| (3) |
revealing that the average number of cell divisions is independent of both the fraction of symmetric division in differentiation, and the fraction of differentiation in replenishment.
From any initial condition converges to the asymptotic solution
| (4) |
which shows that the divisional load of the entire tissue grows linearly according to the differentiation rate of the stem cells (), and the progenitor cells at higher levels of the hierarchy have an additional load () representing the number of divisions having led to their differentiation. By definition, the additional load of the stem cells () is zero. The convergence involves a sum of exponentially decaying terms, among which the slowest one is characterized by the time scale
| (5) |
which can be interpreted as the transient time needed for the cells at level to reach their asymptotic behavior. can also be considered as the transient time required for the initial development of the tissue up to level . The rationale behind this is that during development the levels of the hierarchy become populated by the descendants of the stem cells roughly sequentially, and the initial population of level takes about time after level has become almost fully populated.
Plugging the asymptotic form of into the system of differential equations and prescribing , the constants can be determined, and expressed as
| (6) |
where we have introduced the ratios
| (7) |
between any two subsequent differentiation rates. The asymptotic solution then becomes
| (8) |
This simple formula, which describes the accumulation of the divisional load along the levels of a hierarchically organized tissue, is one of our main results.
Differentiation hierarchies that minimize divisional load
The number of mutations that a tissue allows for its constituent cells to accumulate can be best characterized by the expected number of mutations accumulated along the longest cell lineages. On average, the longest lineage corresponds to the last terminally differentiated cell that is produced by the tissue at the end of the lifetime of the organism. Therefore, as the single most important characteristics of a hierarchically organized tissue, we define its lifetime divisional load, , as the divisional load of its last terminally differentiated cell. If the total number of terminally differentiated cells produced by the tissue during the natural lifetime of the organism per stem cell is denoted by , then the lifetime of the organism can be expressed as , where the first term is the development time of the tissue up to level , and the second term is the time necessary to generate all the terminally differentiated cells by level at a rate of . Because the last terminally differentiated cell is the result of a cell division at level , its expected divisional load, , is the average divisional load of level increased by :
| (9) |
Note that the complicated term drops out of the formula. A remarkable property of is that it depends only on two structural and two dynamical parameters of the tissue. The two structural parameters are the total number of the terminally differentiated cells produced by the tissue per stem cell, , and the number of the hierarchical levels, . The two dynamical parameters are the product and sum of the ratios of the differentiation rates, . The lifetime divisional load neither depends on most of the microscopic parameters of the cellular processes, nor on the number of cells at the differentiation levels.
For fixed and the ratios of the differentiation rates that minimize the lifetime divisional load can be easily determined by setting the derivatives of with respect to the ratios to zero, resulting in
| (10) |
This expression shows that is identical for all intermediate levels () and, therefore, can be denoted by without a subscript. This uniform ratio can then be expressed as
| (11) |
as long as the condition holds, i.e., when . For , however, the ratio has to take the value of
| (12) |
Plugging into Eq. (9) results in
| (13) |
for and
| (14) |
for . Eq. (13) is a monotonically decreasing function of , while Eq. (14) has a minimum at
| (15) |
levels. This together with the ratio
| (16) |
represent the optimal tissue-structure in the sense that it minimizes the lifetime divisional load of a self-renewing tissue, yielding
| (17) |
Note that under this optimal condition the divisional rate of the stem cell level is very low: in a mature tissue (i.e., after the tissue has developed) the expected number of divisions of a stem cell, which is equivalent to the expected number of differentiation to level per stem cell is only .
Implications of the analytical results
Remarkably, corresponds to less than two cell divisions in addition to the theoretical minimum of , achievable by a series of divisions along a perfect binary tree characteristic of non-renewing tissues. In other words, in terms of minimizing the number of necessary cell divisions along cell lineages, a self-renewing hierarchical tissue can be almost as effective as a non-renewing one. Consequently, hierarchical tissue organization with a sufficient number of hierarchical levels provides a highly adaptable and practically ideal mechanism not only for ensuring self-renewability but also keeping the number of cell divisions near the theoretical absolute minimum.
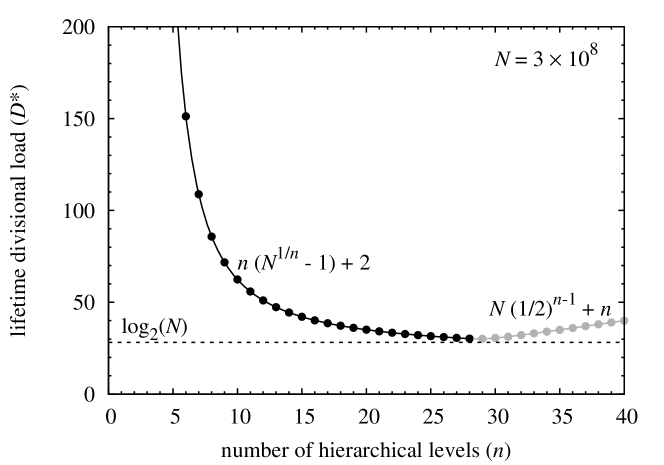
An important result of our mathematical analysis is that it provides a simple and mathematically rigorous formula (Eqs. 13 and 14, and Fig. 3) for the lower limit of the lifetime divisional load of a tissue for a given number of hierarchical levels and a given number of terminally differentiated cells descending from a single stem cell. This lower limit can be reached only with a power law distribution of the differentiation rates (i.e., with a uniform ratio between the differentiation rates of any two successive differentiation levels), justifying the assumptions of the models by Werner et al. Werner:2011 ; Werner:2013 .
In the optimal scenario, where , the recursion relation imposes , thereby, all cell divisions must be symmetric and involve differentiation. This is a shared feature with non-renewable differentiation, which is the underlying reason, why the number of cell divisions of the optimal self-renewing mechanism can closely approach the theoretical minimum.
As a salient example of self-renewing tissues, let us consider the human skin. Clonal patches of skin are of the order of square millimeters in size Martincorena:2015 , the top layer of skin, which is renewed daily, is composed of approximately a thousand cells per square millimeter Hoath:2003 . If we assume that a mm2 patch is maintained by a single stem cell for years, this corresponds to about cells. As Fig. 3 demonstrates, the vs. curve becomes very flat for large values of , indicating that in a real tissue the number of hierarchical levels can be reduced by at least a factor of from the optimal value, without significantly compromising the number of necessary cell divisions along the cell lineages.
It is a question how the total number of terminally differentiated cells () produced by the tissue during the natural lifetime of the organism can be best partitioned into the number of tissue-specific stem cells () and the number of terminally differentiated cells per stem cell (). The initial generation of the stem cells along a binary tree requires divisions. The production of the terminally differentiated cells in a near-optimal hierarchy requires about divisions. Their sum, which is about , depends only on the total number of terminally differentiated cells, irrespective of the number of stem cells. This means, that the minimization of the divisional load poses no constraint on the number of stem cells. However, since both maintaining a larger number of differentiation levels and keeping the differentiation hierarchy closer to optimum involve more complicated regulation, we suspect that a relatively large stem cell pool is beneficial, especially as a larger stem cell population can also be expected to be more robust against stochastic extinction, population oscillation, and injury.
Discussion
In general, how closely the hierarchical organization of different tissues in different organisms approaches the optimum described above depends on (i) the strength of natural selection against unwanted somatic evolution, which is expected to be much stronger in larger and longer lived animals; and (ii) intrinsic physiological constraints on the complexity of tissue organization and potential lower limits on stem cell division rate. Neither the strength of selection nor the physiological constraints on tissue organization are known at present. However, in the case of the germ line mutation rate, which is proportional to the number of cell divisions in lineages leading to the gametes, current evidence indicates that physiological constraints are not limiting Lynch:2012 . Across species, differences in effective population size, which is in general negatively correlated with body size and longevity Nabholz:2013 , indicate the effectiveness of selection relative to drift. As a result, differences in effective population size between species determine the effectiveness of selection in spreading of favorable mutations and eliminating deleterious ones and, as such, can be used as indicator of the efficiency of selection Kimura:1983 ; Charlesworth:2009 . This implies that, in contrast to somatic tissues, we expect germ line differentiation hierarchies to be more optimal for smaller animals with shorter life spans as a result of their increased effective population sizes. For species for which information is available, the number of levels across species indeed follows an increasing trend as a function of the effective population size, ranging from in humans with relatively small effective population size of approximately and correspondingly less efficient selection, in macaque with intermediate effective population size of the order of , and in mice with the largest effective population size of approximately Lynch:2010 ; Ramm:2014 .
A qualitative examination of Fig. 3 suggests that a similar number of levels, of the order of may be present in most somatic tissues, because the vs. curve becomes progressively flatter after it reaches around twice the optimal value of at , and the reduction in the divisional load becomes smaller and smaller as additional levels are added to the hierarchy and other factors are expected to limit further increase in . Alternatively, if we consider for example the human hematopoietic system, where approximately hematopoietic stem cells (HSCs) produce a daily supply of blood cells, we can calculate that over years each stem cell produces a total of terminally differentiated cells. For this larger value of the vs. curve reaches twice the optimal value of at after which, similarly to Fig. 3, it becomes progressively flatter and the reduction in divisional load diminishes as additional levels are added. This rough estimate of levels is consistent with explicit mathematical models of human hematopoiesis that predict between and levels Dingli:2007 . Active or short term HSCs (ST-HSCs) are estimated to differentiate about once a year, whereas a quiescent population of HSCs that provides cells to the active population is expected to be characterized by an even lower rate of differentiation. This is in good agreement with our prediction about the existence of a heterogeneous stem cell pool, a fraction of which consists of quiescent cells that only undergo a very limited number of cell cycles during the lifetime of the organism. Indeed, recently Busch et al. found that adult hematopoiesis in mice is largely sustained by previously designated ST-HSCs that nearly fully self-renew, and receive rare but polyclonal HSC input Busch:2015 . Mouse HSCs were found to differentiate into ST-HSCs only about three times per year.
For most somatic tissues the differentiation hierarchies that underpin the development of most cellular compartments remain inadequately resolved, the identity of stem and progenitor cells remains uncertain, and quantitative information on their proliferation rates is limited Sutherland:2015 . However, synthesis of available information on tissue organization by Tomasetti and Vogelstein Tomasetti:2015 , as detailed above, suggests that larger tissues with rapid turnover (e.g., colon and blood) are relatively less prone to develop cancer. This phenomenon, as noted in the introduction, can be interpreted as Peto’s paradox across tissues with the implication that larger tissues with rapid turnover rates have hierarchies with more levels and stem cells that divide at a slower pace. Accumulating evidence from lineage-tracing experiments Blanpain:2013 is also consistent with a relatively large number of hierarchical levels. Populations of stem cells in blood, skin, and the colon have begun to be resolved as combinations of cells that are long-lived yet constantly cycling, and emerging evidence indicates that both quiescent and active cell subpopulations may coexist in several tissues, in separate yet adjoining locations Li:2010 . Lineage-tracing techniques Blanpain:2013 are rapidly developing, and may be used for directly testing the predictions of our mathematical model about the highly inhomogeneous distributions of the differentiation rates in the near future. In the context of estimates of the number of stem cells in different tissues that underlie Tomasetti and Vogelstein’s results, the potential existence of such unresolved hierarchical levels suggests the possibility that the number of levels of the hierarchy are systematically underestimated and, correspondingly, that the number of stem cells at the base of these hierarchies are systematically overestimated.
Independent of the details of the hierarchy the dynamics of how divisional load accumulates in time is described by two phases: (i) a transient development phase during which each level of the hierarchy is filled up and (ii) a stationary phase during which homeostasis is maintained in mature tissue. The dynamic details and the divisional load incurred during the initial development phase depend on the details of the hierarchy (cf. Eqs. (8) and (5)). In contrast, in the stationary phase, further accumulation of the mutational load is determined solely by the rate at which tissue-specific stem cells differentiate at the bottommost level of the hierarchy. Such biphasic behavior has been observed in the accumulation of mutations both in somatic Rozhok:2015 and germ line cells Kong:2012 ; Gao:2016 ; Rahbari:2016 . In both cases a substantial number of mutations were found to occur relatively rapidly during development followed by a slower linear accumulation of mutation thereafter. General theoretical arguments imply that the contribution of the mutational load incurred during development to cancer risk is substantial Frank:2003 , but this has been suggested to be in conflict with the fact that the majority of cancers develop late in life Rozhok:2015 ; Rozhok:2016 . Resolving this question and more generally understanding the development of cancer in self-renewing tissues will require modeling the evolutionary dynamics of how the hierarchical organization of healthy tissues breaks down.
Spontaneously occurring mutations accumulate in somatic cells throughout a person’s lifetime, but the majority of these mutations do not have a noticeable effect. A small minority, however, can alter key cellular functions and a fraction of these confer a selective advantage to the cell, leading to preferential growth or survival of a clone Martincorena:2015rev . Hierarchical tissue organization can limit somatic evolution at both these levels: (i) at the level of mutations, as we demonstrated above, it can dramatically reduce the number of cell divisions required and correspondingly the mutational load incurred during tissue homeostasis; and (ii) at the level of selection acting on mutations with non-neutral phenotypic effects, as demonstrated by Nowak et al. Nowak:2003 and later by Pepper et al. Pepper:2007 , tissues organized into serial differentiation experience lower rates of such detrimental cell-level phenotypic evolution. Extending the seminal results of Nowak et al. and Pepper et al., we propose that in addition to limiting somatic evolution at the phenotypic level, hierarchies are also how the tissues of multicellular organisms keep the accumulation of mutations in check, and that tissue-specific stem cells may in general correspond to a diverse set of slower dividing cell types.
In summary, we have considered a generic model of hierarchically organized self-renewing tissue, in the context of which we have derived universal properties of the divisional load during tissue homeostasis. In particular, our results provide a lower bound for the lifetime divisional load of a tissue as a function of the number of its hierarchical levels. Our simple analytical description provides a quantitative understanding of how hierarchical tissue organization can limit unwanted somatic evolution, including cancer development. Surprisingly, we find that the theoretical minimum number of cell divisions can be closely approached (cf. Fig. 3, where the theoretical minimum corresponds to the dashed horizontal line), demonstrating that hierarchical tissue organization provides a robust and nearly ideal mechanism to limit the divisional load of tissues and, as a result, minimize somatic evolution.
Acknowledgements.
This work was supported by the Hungarian Science Foundation (grant K101436). The authors would like to acknowledge the comments of anonymous reviewers on a previous version of the manuscript, as well as discussion with and comments from Bastien Boussau, Márton Demeter, Máte Kiss, and Dániel Grajzel.Data availability
No data was generated as part of this study.
Conflict of Interest
The authors declare no conflict of interest.
Author contributions
I.D. and Sz.G. designed the study, carried out research, and wrote the paper.
References
- [1] Ziyue Gao, Minyoung J Wyman, Guy Sella, and Molly Przeworski. Interpreting the dependence of mutation rates on age and time. PLoS Biol, 14(1):e1002355, Jan 2016.
- [2] P C Nowell. The clonal evolution of tumor cell populations. Science, 194(4260):23–8, Oct 1976.
- [3] Lauren M F Merlo, John W Pepper, Brian J Reid, and Carlo C Maley. Cancer as an evolutionary and ecological process. Nat Rev Cancer, 6(12):924–35, Dec 2006.
- [4] Niko Beerenwinkel, Chris D Greenman, and Jens Lagergren. Computational cancer biology: An evolutionary perspective. PLoS Comput Biol, 12(2):e1004717, Feb 2016.
- [5] J F Crow. The origins, patterns and implications of human spontaneous mutation. Nat Rev Genet, 1(1):40–7, Oct 2000.
- [6] Katrin Busch, Kay Klapproth, Melania Barile, Michael Flossdorf, Tim Holland-Letz, Susan M Schlenner, Michael Reth, Thomas Höfer, and Hans-Reimer Rodewald. Fundamental properties of unperturbed haematopoiesis from stem cells in vivo. Nature, 518(7540):542–6, Feb 2015.
- [7] Benjamin Werner, Arne Traulsen, and David Dingli. Ontogenic growth as the root of fundamental differences between childhood and adult cancer. Stem Cells, advance access:doi:10.1002/stem.2251, Dec 2016.
- [8] Benjamin Werner, Fabian Beier, Sebastian Hummel, Stefan Balabanov, Lisa Lassay, Thorsten Orlikowsky, David Dingli, Tim H Brümmendorf, and Arne Traulsen. Reconstructing the in vivo dynamics of hematopoietic stem cells from telomere length distributions. Elife, 4:e08687, 2015.
- [9] James A Morris. The hierarchical model of stem cell genesis explains the man mouse paradox, peto’s paradox, the red cell paradox and wright’s enigma. Med Hypotheses, 83(6):713–7, Dec 2014.
- [10] A B Pardee. G1 events and regulation of cell proliferation. Science, 246(4930):603–8, Nov 1989.
- [11] James E Till and Ernest A McCulloch. A direct measurement of the radiation sensitivity of normal mouse bone marrow cells. Radiat Res, 14:213–22, Feb 1961.
- [12] Ernest A McCulloch and James E Till. Perspectives on the properties of stem cells. Nat Med, 11(10):1026–8, Oct 2005.
- [13] Franziska Michor, Timothy P Hughes, Yoh Iwasa, Susan Branford, Neil P Shah, Charles L Sawyers, and Martin A Nowak. Dynamics of chronic myeloid leukaemia. Nature, 435(7046):1267–70, Jun 2005.
- [14] David Dingli, Arne Traulsen, and Jorge M Pacheco. Compartmental architecture and dynamics of hematopoiesis. PLoS One, 2(4):e345, 2007.
- [15] Tudorita Tumbar, Geraldine Guasch, Valentina Greco, Cedric Blanpain, William E Lowry, Michael Rendl, and Elaine Fuchs. Defining the epithelial stem cell niche in skin. Science, 303(5656):359–63, Jan 2004.
- [16] Nick Barker, Johan H van Es, Jeroen Kuipers, Pekka Kujala, Maaike van den Born, Miranda Cozijnsen, Andrea Haegebarth, Jeroen Korving, Harry Begthel, Peter J Peters, and Hans Clevers. Identification of stem cells in small intestine and colon by marker gene lgr5. Nature, 449(7165):1003–7, Oct 2007.
- [17] C S Potten, R Gandara, Y R Mahida, M Loeffler, and N A Wright. The stem cells of small intestinal crypts: where are they? Cell Prolif, 42(6):731–50, Dec 2009.
- [18] Derrick J Rossi, Catriona H M Jamieson, and Irving L Weissman. Stems cells and the pathways to aging and cancer. Cell, 132(4):681–96, Feb 2008.
- [19] Louis Vermeulen, Edward Morrissey, Maartje van der Heijden, Anna M Nicholson, Andrea Sottoriva, Simon Buczacki, Richard Kemp, Simon Tavaré, and Douglas J Winton. Defining stem cell dynamics in models of intestinal tumor initiation. Science, 342(6161):995–8, Nov 2013.
- [20] Kate D. Sutherland and Jane E. Visvader. Cellular mechanisms underlying intertumoral heterogeneity. Trends in Cancer, 1(1):15 – 23, 2015.
- [21] Cristian Tomasetti and Bert Vogelstein. Cancer etiology. variation in cancer risk among tissues can be explained by the number of stem cell divisions. Science, 347(6217):78–81, Jan 2015.
- [22] Christopher Wild, Paul Brennan, Martyn Plummer, Freddie Bray, Kurt Straif, and Jiri Zavadil. Cancer risk: Role of chance overstated. Science, 347(6223):728–728, 2015.
- [23] Song Wu, Scott Powers, Wei Zhu, and Yusuf A Hannun. Substantial contribution of extrinsic risk factors to cancer development. Nature, 529(7584):43–7, Jan 2016.
- [24] R Peto, F J Roe, P N Lee, L Levy, and J Clack. Cancer and ageing in mice and men. Br J Cancer, 32(4):411–26, Oct 1975.
- [25] Aleah F Caulin and Carlo C Maley. Peto’s paradox: evolution’s prescription for cancer prevention. Trends Ecol Evol, 26(4):175–82, Apr 2011.
- [26] Richard Peto. Quantitative implications of the approximate irrelevance of mammalian body size and lifespan to lifelong cancer risk. Philosophical Transactions of the Royal Society of London B: Biological Sciences, 370(1673), 2015.
- [27] Laura Hindersin, Benjamin Werner, David Dingli, and Arne Traulsen. Should tissue structure suppress or amplify selection to minimize cancer risk? Biol Direct, 11:41, 2016.
- [28] M Loeffler and H E Wichmann. A comprehensive mathematical model of stem cell proliferation which reproduces most of the published experimental results. Cell Tissue Kinet, 13(5):543–61, Sep 1980.
- [29] Martin A Nowak, Franziska Michor, and Yoh Iwasa. The linear process of somatic evolution. Proc Natl Acad Sci U S A, 100(25):14966–9, Dec 2003.
- [30] Hitoshi Takizawa, Roland R Regoes, Chandra S Boddupalli, Sebastian Bonhoeffer, and Markus G Manz. Dynamic variation in cycling of hematopoietic stem cells in steady state and inflammation. J Exp Med, 208(2):273–84, Feb 2011.
- [31] John W Pepper, Kathleen Sprouffske, and Carlo C Maley. Animal cell differentiation patterns suppress somatic evolution. PLoS Comput Biol, 3(12):e250, Dec 2007.
- [32] Benjamin Werner, David Dingli, Tom Lenaerts, Jorge M Pacheco, and Arne Traulsen. Dynamics of mutant cells in hierarchical organized tissues. PLoS Comput Biol, 7(12):e1002290, Dec 2011.
- [33] Benjamin Werner, David Dingli, and Arne Traulsen. A deterministic model for the occurrence and dynamics of multiple mutations in hierarchically organized tissues. J R Soc Interface, 10(85):20130349, Aug 2013.
- [34] Iñigo Martincorena and Peter J Campbell. Somatic mutation in cancer and normal cells. Science, 349(6255):1483–9, Sep 2015.
- [35] Natalia L Komarova. Cancer: A moving target. Nature, 525(7568):198–9, Sep 2015.
- [36] Katarzyna A Rejniak and Alexander R A Anderson. Hybrid models of tumor growth. Wiley Interdiscip Rev Syst Biol Med, 3(1):115–25, 2011.
- [37] Philipp M Altrock, Lin L Liu, and Franziska Michor. The mathematics of cancer: integrating quantitative models. Nat Rev Cancer, 15(12):730–45, Dec 2015.
- [38] Franziska Michor and Kathryn Beal. Improving cancer treatment via mathematical modeling: Surmounting the challenges is worth the effort. Cell, 163(5):1059–63, Nov 2015.
- [39] Min Tang, Rui Zhao, Helgi van de Velde, Jennifer G Tross, Constantine Mitsiades, Suzanne Viselli, Rachel Neuwirth, Dixie-Lee Esseltine, Kenneth Anderson, Irene M Ghobrial, Jesús F San Miguel, Paul G Richardson, Michael H Tomasson, and Franziska Michor. Myeloma cell dynamics in response to treatment supports a model of hierarchical differentiation and clonal evolution. Clin Cancer Res, 22(16):4206–14, Aug 2016.
- [40] Benjamin Werner, Jacob G Scott, Andrea Sottoriva, Alexander R A Anderson, Arne Traulsen, and Philipp M Altrock. The cancer stem cell fraction in hierarchically organized tumors can be estimated using mathematical modeling and patient-specific treatment trajectories. Cancer Res, 76(7):1705–13, Apr 2016.
- [41] Linheng Li and Hans Clevers. Coexistence of quiescent and active adult stem cells in mammals. Science, 327(5965):542–5, Jan 2010.
- [42] Iñigo Martincorena, Amit Roshan, Moritz Gerstung, Peter Ellis, Peter Van Loo, Stuart McLaren, David C Wedge, Anthony Fullam, Ludmil B Alexandrov, Jose M Tubio, Lucy Stebbings, Andrew Menzies, Sara Widaa, Michael R Stratton, Philip H Jones, and Peter J Campbell. Tumor evolution. high burden and pervasive positive selection of somatic mutations in normal human skin. Science, 348(6237):880–6, May 2015.
- [43] Steven B Hoath and D G Leahy. The organization of human epidermis: functional epidermal units and phi proportionality. J Invest Dermatol, 121(6):1440–6, Dec 2003.
- [44] Way Sung, Matthew S Ackerman, Samuel F Miller, Thomas G Doak, and Michael Lynch. Drift-barrier hypothesis and mutation-rate evolution. Proc Natl Acad Sci U S A, 109(45):18488–92, Nov 2012.
- [45] Benoit Nabholz, Nicole Uwimana, and Nicolas Lartillot. Reconstructing the phylogenetic history of long-term effective population size and life-history traits using patterns of amino acid replacement in mitochondrial genomes of mammals and birds. Genome Biol Evol, 5(7):1273–90, 2013.
- [46] Motoo Kimura. The neutral theory of molecular evolution. Cambridge University Press, Cambridge, 1983.
- [47] Brian Charlesworth. Fundamental concepts in genetics: effective population size and patterns of molecular evolution and variation. Nat Rev Genet, 10(3):195–205, Mar 2009.
- [48] Michael Lynch. Evolution of the mutation rate. Trends Genet, 26(8):345–52, Aug 2010.
- [49] Steven A Ramm, Lukas Schärer, Jens Ehmcke, and Joachim Wistuba. Sperm competition and the evolution of spermatogenesis. Mol Hum Reprod, 20(12):1169–79, Dec 2014.
- [50] Cédric Blanpain and Benjamin D Simons. Unravelling stem cell dynamics by lineage tracing. Nat Rev Mol Cell Biol, 14(8):489–502, Aug 2013.
- [51] Andrii I Rozhok and James DeGregori. Toward an evolutionary model of cancer: Considering the mechanisms that govern the fate of somatic mutations. Proc Natl Acad Sci U S A, 112(29):8914–21, Jul 2015.
- [52] Augustine Kong, Michael L Frigge, Gisli Masson, Soren Besenbacher, Patrick Sulem, Gisli Magnusson, Sigurjon A Gudjonsson, Asgeir Sigurdsson, Aslaug Jonasdottir, Adalbjorg Jonasdottir, Wendy S W Wong, Gunnar Sigurdsson, G Bragi Walters, Stacy Steinberg, Hannes Helgason, Gudmar Thorleifsson, Daniel F Gudbjartsson, Agnar Helgason, Olafur Th Magnusson, Unnur Thorsteinsdottir, and Kari Stefansson. Rate of de novo mutations and the importance of father’s age to disease risk. Nature, 488(7412):471–5, Aug 2012.
- [53] Raheleh Rahbari, Arthur Wuster, Sarah J Lindsay, Robert J Hardwick, Ludmil B Alexandrov, Saeed Al Turki, Anna Dominiczak, Andrew Morris, David Porteous, Blair Smith, Michael R Stratton, UK10K Consortium, and Matthew E Hurles. Timing, rates and spectra of human germline mutation. Nat Genet, 48(2):126–33, Feb 2016.
- [54] Steven A Frank and Martin A Nowak. Cell biology: Developmental predisposition to cancer. Nature, 422(6931):494, Apr 2003.
- [55] Andrii I Rozhok, Jennifer L Salstrom, and James DeGregori. Stochastic modeling reveals an evolutionary mechanism underlying elevated rates of childhood leukemia. Proc Natl Acad Sci U S A, 113(4):1050–5, Jan 2016.