22institutetext: Shanghai Astronomical Observatory, Chinese Academy of Sciences, 80 Nandan Road, Shanghai 200030, China
33institutetext: School of Astronomy and Space Sciences, Nanjing University, Nanjing 210093, China
44institutetext: Key Laboratory of Modern Astronomy and Astrophysics (Nanjing University), Ministry of Education, Nanjing 210093, China
55institutetext: Collaborative Innovation Center of Modern Astronomy and Space Exploration, Nanjing 210093, China
HC3N Observations of Nearby Galaxies ∗ ††thanks: Based on observations with the 100-m telescope of the MPIfR (Max-Planck-Institut für Radioastronomie) at Effelsberg, and the Submillimeter Telescope (SMT). The SMT is operated by the Arizona Radio Observatory (ARO), Steward Observatory, University of Arizona.
Abstract
Aims. We aim to systematically study the properties of the different transitions of the dense molecular gas tracer HC3N in galaxies.
Methods. We have conducted single-dish observations of HC3N emission lines towards a sample of nearby gas-rich galaxies. HC3N(=2-1) was observed in 20 galaxies with Effelsberg 100-m telescope. HC3N(=24-23) was observed in nine galaxies with the 10-m Submillimeter Telescope (SMT).
Results. HC3N 2-1 is detected in three galaxies: IC 342, M 66 and NGC 660 (). HC3N 24-23 is detected in three galaxies: IC 342, NGC 1068 and IC 694. This is the first measurements of HC3N 2-1 in a relatively large sample of external galaxies, although the detection rate is low. For the HC3N 2-1 non-detections, upper limits (2 ) are derived for each galaxy, and stacking the non-detections is attempted to recover the weak signal of HC3N. But the stacked spectrum does not show any significant signs of HC3N 2-1 emission. The results are also compared with other transitions of HC3N observed in galaxies.
Conclusions. The low detection rate of both transitions suggests low abundance of HC3N in galaxies, which is consistent with other observational studies. The comparison between HC3N and HCN or HCO+shows a large diversity in the ratios between HC3N and HCN or HCO+. More observations are needed to interpret the behavior of HC3N in different types of galaxies.
Key Words.:
galaxies: active – galaxies: ISM – galaxies: evolution – ISM: molecules1 Introduction
Molecular lines play an essential role in our understanding of star formation activity and galaxy evolution. With molecular lines of different species and their different transitions, not only the chemical composition of the interstellar medium can be investigated, but other important physical parameters, such as temperature, pressure, density, and non-collisional pumping mechanism can be derived as well (e.g., Henkel et al. 1991; Evans 1999; Fukui & Kawamura 2010; Meier & Turner 2012; Meier et al. 2014). New facilities providing wide band and highly sensitive instruments are making weak line surveys and multi-species analysis feasible, and the detections and measurements of a variety of species, are helping us to reveal the gas components of galaxies, and how their abundances, densities, ratios reflect the radiative properties of galaxies. Multi-species, multi-transition molecular lines can be combined to diagnose the evolution stage of galaxies (Baan et al. 2014), because different species are sensitive to different physical environments, such as photo dissociation regions (PDRs) dominated by young massive stars, X-rays dominated regions (XDRs) induced by active galactic nucleus (AGNs), and shock waves by cloud-cloud collisions (Aladro et al. 2011; Greve et al. 2009; Aladro et al. 2011; Costagliola et al. 2011; Viti et al. 2014).
One of the interstellar species that benefits from the upgraded facilities is cyanoacetylene (HC3N). HC3N was firstly detected in 1971 at 9.0977 GHz (=2-1) in the Galactic star forming region Sgr B2 (Turner 1971). The critical density of HC3N is comparable to the widely-used dense gas tracer HCN and can also trace dense molecular gas around star forming sites. HC3N has been detected in many star formation regions in the Milky Way with several transitions from centimeter to sub-millimeter (e.g., Suzuki et al. 1992). Due to the small rotational constant ( 1/13 of CO), there are many closely spaced rotational transitions of HC3N (separated by only 9.1 GHz) at centimeter and millimeter wavelengths, and its levels are very sensitive to the changes in excitation (Meier & Turner 2012). This makes it easier to conduct multi-transition observations of HC3N lines than other dense molecular gas tracers, and can help better understand the excitation conditions of star forming regions. In contrast, the high- lines of other dense molecular gas tracers such as HCN and HCO+ are at very high frequencies, thus it is difficult to observe them with ground-based telescopes. Another advantage of using HC3N lines is that HC3N is very likely optical thin even in low- transitions, due to the relatively low abundance (Irvine et al. 1987; Lindberg et al. 2011). And low opacity is important for accurate estimate of dense molecular gas mass for the study of relationship between dense molecular gas and star formation (Gao & Solomon 2004a, b; Wang et al. 2011; Zhang et al. 2014).
There have been efforts to detect HC3N in nearby galaxies, mainly in millimeter band. Observations suggest that HC3N is related to the warm, dense star forming gas, and is easily dissociated by UV radiation (Henkel et al. 1988; Costagliola et al. 2011; Costagliola et al. 2011; Lindberg et al. 2011; Aladro et al. 2011, Aladro et al. 2015). HC3N was found to be unusually luminous in NGC 4418, and it is attributed to its high abundance (10-7) as well as the intense radiation field in the dense and warm gas at the center of NGC 4418 (Aalto et al. 2007; Costagliola & Aalto 2010). Meier & Turner (2005, 2012); Meier et al. (2011, 2014) presented high resolution observations of HC3N (=5-4, 10-9, 12-11 and 16-15) of a few very nearby galaxies, and gave detailed analysis of the galactic structures and morphology that traced by HC3N and other dense gas tracers (HNC, HCN, CS, etc.). However, these results are still limited by their sample size, and the chemical process of HC3N is still unclear. Larger samples are still necessary for analyzing the properties of HC3N and how it relate to other galactic parameters. In this paper we present the first systematic survey of HC3N () and HC3N () in a relatively large sample of nearby galaxies. And the results are compared with the observations of HC3N in other transitions. The critical densities of HC3N and HC3N are about and , respectively. And the upper state energies () of the two transitions are 1.3 K and 131 K, respectively (Costagliola & Aalto 2010).
| Galaxy | RA (J2000) Dec | Distance | log | Telescope | |||
|---|---|---|---|---|---|---|---|
| h m s | ° ′ ″ | (km s-1) | (Mpc) | () | (km s-1) | ||
| (1) | (2) | (3) | (4) | (5) | (6) | (7) | (8) |
| NGC 520 | 01 24 34.9 | 03 47 30.0 | 2281 | 30.22 | 10.91 | 270 | Effelsberg |
| NGC 660 | 01 43 02.4 | 13 38 42.0 | 850 | 12.33 | 10.49 | 280 | Effelsberg |
| NGC 891 | 02 22 33.4 | 42 20 57.0 | 528 | 8.57 | 10.27 | 110 | Effelsberg |
| NGC 972 | 02 34 13.4 | 29 18 41.0 | 1543 | 20.65 | 10.67 | 220 | Effelsberg |
| NGC 1068 | 02 42 41.4 | 00 00 45.0 | 1137 | 13.7 | 11.27 | 280 | Effelsberg & SMT |
| IC 342 | 03 46 48.5 | 68 05 46.0 | 31 | 4.60 | 10.17 | 72.8a | Effelsberg & SMT |
| UGC 2855 | 03 48 20.7 | 70 07 58.0 | 1200 | 19.46 | 10.75 | … | Effelsberg |
| UGC 2866 | 03 50 14.9 | 70 05 40.9 | 1232 | 20.06 | 10.68 | … | Effelsberg |
| NGC 1569 | 04 30 49.0 | 64 50 53.0 | 104 | 4.60 | 9.49 | 90 | Effelsberg |
| NGC 2146 | 06 18 39.8 | 78 21 25.0 | 882 | 16.47 | 11.07 | 320 | Effelsberg & SMT |
| NGC 2403 | 07 36 51.3 | 65 36 29.9 | 161 | 3.22 | 9.19 | 90 | Effelsberg |
| M 82 | 09 55 53.1 | 69 40 41.0 | 187 | 3.63 | 10.77 | 150 | Effelsberg & SMT |
| NGC 3079 | 10 01 57.8 | 55 40 47.0 | 1116 | 18.19 | 10.73 | 380 | Effelsberg |
| NGC 3310 | 10 38 45.9 | 53 30 12.0 | 993 | 19.81 | 10.61 | 140 | Effelsberg |
| M 66 | 11 20 15.0 | 12 59 30.0 | 727 | 10.04 | 10.38 | 180 | Effelsberg |
| IC 694 | 11 28 33.8 | 58 33 45.0 | 3120 | 47.74 | 11.63 | 250 | Effelsbergb & SMT |
| NGC 3690 | 11 28 30.8 | 58 33 43.0 | 3120 | 47.74 | 11.32 | 260 | Effelsbergb & SMT |
| Mrk 231 | 12 56 14.2 | 56 52 25.0 | 12600 | 171.84 | 12.51 | 167 | Effelsberg |
| Arp 220 | 15 34 57.1 | 23 30 10.0 | 5352 | 79.90 | 12.21 | 360 | Effelsberg & SMT |
| NGC 6240 | 16 52 58.9 | 02 24 03.0 | 7160 | 103.86 | 11.85 | 420 | SMT |
| NGC 6946 | 20 34 52.6 | 60 09 12.0 | 53 | 5.32 | 10.16 | 130 | Effelsberg & SMT |
2 Observations & Data reduction
We select nearby infrared bright galaxies (Sanders et al. 2003) with IRAS 60 m flux greater than 30 Jy and declination greater than to do this survey. It is not a complete but representative sample of infrared bright galaxies. The sample consists of 21 galaxies. Note that due to the different beam size of the two telescopes we used, the merger Arp 299 (IC 694 and NGC 3690) were observed as a single pointing by Effelsberg 100-m, while the two galaxies were observed separately by the SMT 10-m.
2.1 HC3N 2-1 observations with the Effelsberg 100-m
HC3N () ( 18.196 GHz) of 20 galaxies was observed with Effelsberg 100-m telescope in 2010. The Half Power Beam Width (HPBW) is 46.5′′ at 18 GHz for the 100-m telescope. We used the 1.9 cm band receiver, 500 MHz bandwidth with 16384 channels correlator setup, which provided 8300 km s-1 velocity coverage and 0.5 km s-1 velocity resolution during the observations. Position-switching mode with beam-throws of about was used. Pointing and focus were checked about every two hours. The typical system temperature of the Effelsberg observations was about 46 K. The on-source time for each galaxy is about 14–47 minutes. The weather during the observations is not ideal, and the baselines of many sources are affected and induced artificial features which are hard to remove.
2.2 HC3N 24-23 observations with the SMT 10-m
HC3N () ( 218.324 GHz) of nine galaxies was observed in 2009 with the SMT 10-m telescope. The HPBW is about 33′′ at 218 GHz for SMT, and a single pointing was used for each galaxy toward their central positions. We used the ALMA Sideband Separating Receiver and the Acousto-Optical-Spectrometers (AOS), which have dual polarization, 970 MHz ( 1300 km s-1) bandwidth and 934kHz channel spacing. Observations were carried out with the beam-switching mode with a chop throw of in azimuth (AZ) and a chopping frequency of 2.2 Hz. Pointing and focus were checked about every two hours by measuring nearby QSOs with strong millimeter continuum emission. The typical system temperature at 218 GHz was less than 300 K, and the on-source time for each galaxy was 60–168 minutes.
2.3 Data Reduction
The basic parameters of our sample galaxies are listed in Table1. The data were reduced with the CLASS program of the GILDAS222http://iram.fr/IRAMFR/GILDAS/ package. First, we checked each spectrum and discarded the spectra with unstable baseline. Most of the Effelsberg spectra do not have flat baselines, but over several hundred km s-1 near the line the baselines can still be fixed. In the SMT spectra the image signal of strong CO 2-1 in the upper sideband affect the baseline of the lower sideband and for M 82 and Arp 220 the HC3N 24-23 is contaminated. But for other galaxies the image CO line does not affect the HC3N line. Then we combined spectra with both polarizations of the same source into one spectrum. Depending on the quality of the spectral baselines, a first-order or second-order fitting was used to subtract baselines from all averaged spectra. The identifications of the transition frequencies of HC3N have made use of the NIST database Recommended Rest Frequencies for Observed Interstellar Molecular Microwave Transitions333http://www.nist.gov/pml/data/micro/index.cfm.
To reduce the noise level, the spectra are smoothed to velocity resolutions km s-1. The velocity-integrated intensities of the HC3N line are derived from the Gaussian fit of the spectra, or integrated over a defined window if the line profiles significantly deviate from a Gaussian. The intensities are calculated using , where is the main beam brightness temperature. Molecular line intensity in antenna temperature () is converted to main beam temperature via , with the main beam efficiency MBE = 53% at 18 GHz for Effelsberg telescope, and 70% at 218 GHz for SMT during the observations. The flux density is then derived from , using = 0.59 Jy/K for the Effelsberg telescope, and 24.6 Jy/K for the SMT.
3 Results & Discussion
The spectral measurements and estimated intensities of the HC3N lines, including RMS noise and on-source time, are listed in Table2 (HC3N 2-1) and Table3 (HC3N 24-23).
3.1 HC3N 2-1
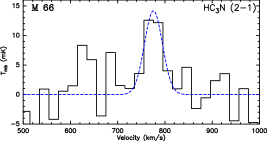
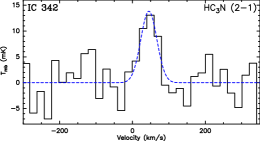
Among the 20 galaxies observed by Effelsberg 100-m telescope, HC3N 2-1 is detected in three galaxies: IC 342, NGC 660 and M 66 (See Figure1). This is the first report of HC3N 2-1 detections in external galaxies, although limited by the SNR (Signal to Noise Ratio) the detection rate is low.
IC 342:
IC 342 has the strongest peak intensity ( 14 mK) of HC3N 2-1 in the sample, which is about twice the strength as the HC3N(9-8) line of IC 342 detected by IRAM 30-m telescope (Aladro et al. 2011), while the line width (FWHM 60 km s-1) is similar to their result.
NGC 660:
The detected HC3N 2-1 in NGC 660 has a similar linewidth (FWHM 294.7 km s-1) to CO 1-0 ( 280 km s-1). While the HC3N survey by Lindberg et al. (2011) did not observe NGC 660, its 10-9 and 12-11 transitions were not detected by Costagliola et al. (2011). This difference in the detection of HC3N lines may imply that there is little warm and dense gas content in NGC 660, thus the high- HC3N lines can not be excited.
M 66:
non-detections:
Due to the poor quality (and probably insufficient integration time) of the HC3N 2-1 data, 16 out of 19 galaxies were not detected. Assuming their linewidth is approximate to CO 1-0 linewidth (FWHM, from Young et al. 1995), we derive upper limits of the integrated intensity for each galaxy (2 , where RMS ) and show them in Table2. Note that the linewidth of HC3N is likely narrower than that of CO, and such assumption might overeistimate the upper limits of integrated intensity, thus is only a rough estimate. The upper limits are in the range of 0.3 – 1.2 K km s-1. For those non-detection galaxies, We also stack their spectra together, weighted by the RMS level of each galaxy, to exam if a cumulated signal can be obtained (see Figurer 1). Although the RMS of the the stacking HC3N 2-1 spectrum is reduced down to 0.66 mK, we do not see any signs of emission (at a resolution of 30 km s-1). Since these galaxies have similar linewidth (100–400 km s-1), we can estimate the stacked upper limit assuming a linewidth of 200 km s-1, based on the RMS (0.66 mK) of the stacked spectrum. Thus the 2 upper limit of these galaxies is about 0.26 K km s-1. To eliminate the possible effect induced by different linewidths of galaxies, we also tried to group the non-detection galaxies based on their CO linewidth. Galaxies with CO FWHM (Table 1) wider than 200 km s-1 are stacked as one group, and other galaxies are stacked as another group. Neither group shows any signs of emission.
3.2 HC3N 24-23
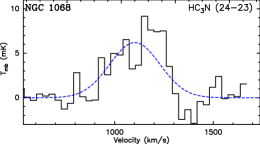
Among the nine galaxies observed by SMT, HC3N(=24-23) is detected in three galaxies: IC 342, NGC 1068 and IC 694 (Figure2).
IC 342:
HC3N 24-23 of IC 342 was previously detected and measured by Aladro et al. (2011), and our observation obtains consistent result, although comparing to their observation we do not detect H2CO simultaneously. In our observations, IC 342 is the only galaxy detected in both 2-1 and 24-23 transitions. The line center and width of the two transitions are similar, considering observational uncertainties. This might imply that the two transitions have similar emitting area. And the ratio between the integrated intensities of HC3N 24-23/HC3N 2-1 is about 0.6.
NGC 1068:
In NGC 1068, the integrated intensity of HC3N 24-23 is about 2.0 K km s-1 (in ), which is stronger than that of HC3N 10-9 (1.1 K km s-1) reported by Costagliola et al. (2011). It may imply that there is sufficient warm and dense gas, which is able to excite the high transition HC3N 24-23 line. Besides, it could also be affected by the strong AGN signature of this galaxy (Wang et al. 2014; Tsai et al. 2012).
IC 694:
Previous observation only obtained upper limits of HC3N 12-11 For IC 694 (Lindberg et al. 2011). In our observations, a tentative detection in IC 694 () is obtained. The line profile of IC 694 obviously deviates from a Gaussian, so we derive the HC3N intensity by integrating the line within a window of 400 km s-1 width (Table 3).
We note that, in NGC 1068 and IC 694, HC3N 24-23 is possibly blended with H2CO 3(0,3) – 2(0,2) emission (218.22219 GHz). The upper state energy of this is para-H2CO line is about 10.5 K, which is likely to be excited in these cases. The H2CO line is shifted by 141.1 km s-1or -102 MHz from the HC3N 24-23 line, and it is unclear that how much intensity of HC3N 24-23 in NGC 1068 and IC 694 is contributed by H2CO (see Figure2). We still lack enough data to disentangle this issue, and can only compare with other observations. For example, in the observation of M 82 by Ginard et al. (2015), they showed that near the frequency of 145 GHz, H2CO 2(0,1) – 1(0,1) is as strong as HC3N 16-15. H2CO is not detected in M 82 in 3mm band (Aladro et al. 2015). In the observations toward NGC 4418 by Aalto et al. (2007), they showed that HC3N 16-15 is blended with H2CO ,and H2CO may contribute 20% of the total integrated line intensity.
non-detections:
The spectra of M 82 and Arp 220 are seriously contaminated by the image signal of CO 2-1 from the upper side-band ( = 230 GHz), which is strong and wide hence difficult to remove. As a consequence we could not extract the spectrum of HC3N properly. We treat the HC3N 24-23 in M 82 and Arp 220 as non-detections, and their 2 upper limits are also only indicative. Although not contaminated by adjacent CO image signal, HC3N 24-23 was not detected in NGC 2146, NGC 6946, NGC 3690 and NGC 6240. For these non-detection we present 2 upper limit of the integrated intensity of HC3N 24-23 in Table3. Only four galaxies are not contaminated by CO image signal, thus no stacking is implemented for their HC3N 24-23 spectra.


| Source | On-time | RMS | ||||||
|---|---|---|---|---|---|---|---|---|
| (min) | (mK) | (km s-1) | (km s-1) | (km s-1) | (K km s-1) | (Jy km s-1) | ||
| (1) | (2) | (3) | (4) | (5) | (6) | (7) | (8) | (9) |
| NGC 660 | 28 | 4.2 | 32.2 | 260.7 (90.6) | 825 (36) | 1.47 (0.40) | 0.86 (0.24) | 0.034a |
| IC 342 | 20 | 6.5 | 20.1 | 52.0 (12.9) | 45 (6) | 0.77 (0.18) | 0.45 (0.11) | 0.005b |
| M 66 | 18 | 7.0 | 20.1 | 44.8 (17.7) | 775 (7) | 0.68 (0.21) | 0.4 (0.12) | 0.114c |
| NGC 520 | 14 | 5.7 | … | … | … | 1.02 | 0.6 | 0.087d |
| NGC 891 | 30 | 2.3 | … | … | … | 0.26 | 0.15 | 0.033e |
| NGC 972 | 33 | 3.8 | … | … | … | 0.61 | 0.36 | … |
| NGC 1068 | 25 | 4.0 | … | … | … | 0.73 | 0.43 | 0.013f |
| UGC 2855 | 23 | 4.9 | … | … | … | 0.76∗ | 0.45 | … |
| UGC 2866 | 22 | 3.6 | … | … | … | 0.56∗ | 0.33 | … |
| NGC 1569 | 33 | 3.0 | … | … | … | 0.31 | 0.18 | … |
| NGC 2146 | 24 | 3.4 | … | … | … | 0.67 | 0.39 | 0.021e |
| NGC 2403 | 30 | 3.2 | … | … | … | 0.33 | 0.19 | … |
| M 82 | 26 | 5.5 | … | … | … | 0.73 | 0.43 | 0.011e |
| NGC 3079 | 19 | 5.5 | … | … | … | 1.17 | 0.69 | 0.225e |
| NGC 3310 | 36 | 2.3 | … | … | … | 0.29 | 0.17 | … |
| IC 694+NGC3690 | 47 | 4.2 | … | … | … | 0.72 | 0.42 | 0.158g |
| Mrk 231 | 44 | 6.4 | … | … | … | 0.91 | 0.54 | 0.191g |
| Arp 220 | 26 | 4.5 | … | … | … | 0.94 | 0.55 | 0.069h |
| NGC 6946 | 28 | 5.1 | … | … | … | 0.64 | 0.38 | 0.018e |
HCN 1-0 data from: $a$$a$footnotetext: Baan et al. (2008); $b$$b$footnotetext: Nguyen et al. (1992); $c$$c$footnotetext: Krips et al. (2008); $d$$d$footnotetext: Solomon et al. (1992); $e$$e$footnotetext: Gao & Solomon (2004a); $f$$f$footnotetext: Aladro et al. (2015); $g$$g$footnotetext: Jiang et al. (2011); $h$$h$footnotetext: Wang et al. (2016).
| Source | On-time | RMS | ||||||
|---|---|---|---|---|---|---|---|---|
| (min) | (mK) | (km s-1) | (km s-1) | (km s-1) | (K km s-1) | (Jy km s-1) | ||
| (1) | (2) | (3) | (4) | (5) | (6) | (7) | (8) | (9) |
| NGC 1068 | 121 | 1.2 | 39.1 | 257.3 (24.0)a | 1102 (13) | 2.03 (0.18) | 49.9 (4.4) | 0.59 |
| IC 342 | 132 | 2.7 | 20.9 | 100b | 43 | 0.47 (0.12) | 11.6 (3.0) | 0.12 |
| IC 694 | 127 | 0.87 | 41.7 | 400b | 3095 | 0.90 (0.11) | 22.1 (2.7) | 2.76 |
| NGC 2146 | 115 | 1.01 | 20.9 | 320c | … | 0.17 | 4.2 | 0.26 |
| M 82 | 60 | 3.0 | 20.9 | 150c | … | 0.34 | 8.4 | 0.26 |
| NGC 3690 | 139 | 0.73 | 42.0 | 260c | … | 0.15 | 3.7 | 1.27 |
| ARP 220 | 162 | 0.75 | 39.1 | 420c | … | 0.19 | 4.7 | 0.48 |
| NGC 6240 | 97 | 0.92 | 20.1 | 420c | … | 0.17 | 4.2 | 1.15 |
| NGC 6946 | 168 | 1.76 | 21.0 | 130c | … | 0.18 | 4.4 | 0.26 |
3.3 Discussion: HC3N in galaxies
The HPBW of SMT and Effelsberg observations are 33′′ and 46′′, respectively, which should be able to cover the bulk of the sample galaxies, especially the galaxy center. Thus our observations should be able to cover the region where the majority of dense gas resides. However, with single-dish observations we can not constrain the emission size of either HC3N 2-1 or HC3N 24-23, and can not easily estimate the filling factors. Along with the large uncertainty of the emission intensities measurements, it is difficult to estimate the brightness temperature of the sample.
To better understand the excitation environment of HC3N, the effect of free-free and synchrotron emission near 18 GHz should be also taken into account, as they are more prominent than that in millimeter band that is dominated by dust thermal emission. We detect HC3N 2-1 lines in emission and not in absorption, and this may be due to the fact that the beam filling factor of the HC3N gas is higher than the radio continuum. In the high resolution radio observations towards a few nearby galaxies (Tsai et al. 2006), it is found that compact radio sources contribute 20% – 30% of the total 2 cm (15 GHz) emission from the central kiloparsec of these galaxies. In contrast, the distribution of gas with moderate critical density such as HC3N 2-1 is likely more diffuse.
Comparing to other dense molecular gas tracers such as the popular HCN and HCO+, HC3N is generally optically thin in galaxies owing to its relatively low abundance, which makes it an ideal dense gas tracer for calculating the column density and/or mass of molecular hydrogen content of galaxies. In the observations by Lindberg et al. (2011) and Costagliola et al. (2011) a low detection rate of HC3N was reported and was explained as the intrinsically faint emission of HC3N , and our stacked result also implies that the HC3N is quite weak in the non-detected galaxies (2 upper limit=0.14 K km s-1), which is also in favor of this explanation. The non-detection in M 82 is consistent with the low abundance of HC3N in M 82 suggested by Aladro et al. (2011), that HC3N traces a nascent starburst of galaxy, and it can be easily destroyed by the UV radiation in PDRs, which is ubiquitous in active galaxies.
In very recent line surveys of a few local active galaxies (AGN and/or Starbursts, Aladro et al. 2015; Costagliola et al. 2015), several HC3N transitions in 3mm band (HC3N =10-9, =11-10 and =12-11) were detected. The ALMA observations by Costagliola et al. (2015) even reported the HC3N =32-31 rotational transition, and some of the vibrationally excited HC3N lines. The latest high resolution line surveys in a few very nearby galaxies (Meier & Turner 2005, 2012) and Meier et al. (2014, 2015) show that, the derived HC3N abundances (on 100 pc, roughly GMC scales) are about several 10-10 (relative to H2), which is about an order of magnitude lower than the abundance of HCN and some other molecules.
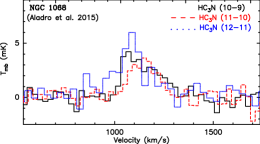
The results in Aladro et al. (2015) show that, the HC3N fractional abundance is generally several times lower than that of HCN, HCO+ and CS. And comparing to other AGN or starburst galaxies in their sample, HC3N abundance is significantly higher in the two ULIRGs Arp 220 and Mrk 231, implying it is suited for studying the activity of ULIRGs. Besides, there was no obvious evidence of the affection by AGN on the intensity of HC3N. Four galaxies in our sample (NGC 1068, M 82, Mrk 231 and Arp 220) were also studied in Aladro et al. (2015). We compare our data with their results, and the HC3N spectra of Mrk 231 and NGC 1068 from Aladro et al. (2015) are shown in Figure 1 and 2, to be compared with the non-detection of HC3N 2-1 in Mrk 231, and the detection of HC3N 24-23 in NGC 1068, respectively. Their results show that, in 3mm band, the intensities between the three transitions of HC3N (10-9, 11-10 and 12-11) differ not too much, and the peak temperature () of HC3N are 4 mK for NGC 1068, 11 mK for M 82, and 1.1 – 1.7 mK for Mrk 231, and 10 mK for Arp 220. In our results, the detection of HC3N 24-23 in NGC 1068 shows a peak 7 mK, while the non-detection of HC3N 2-1 in Mrk 231 and Arp 220 show that, the RMS we have ( 4–6 mK) might not be low enough to detection the HC3N lines. Here we conclude that, besides the low abundance of HC3N, insufficient integration time and not ideal observing conditions are the main cause for the low detection rate of HC3N.
It would be interesting to compare the intensity ratios between HC3N and other dense gas tracers, such as HCN and HCO+. We list the ratio between the flux density of HC3N and HCN 1-0 in Table 2 and 3, respectively. Because the data quaity of this work is not good enough for us to present an accurate estimate on the HC3N flux density, the ratios are only tentative. We see a large variation in the ratios, which could be an evidence of the essentially large variation of HC3N luminosities among galaxies. In the HC3N survey by Lindberg et al. (2011), ratios like HC3N/HCN were used to compare HC3N between galaxies. Based on that ratio, IC 342 and M 82 were classified as HC3N-luminous galaxies. In our observation we detect both HC3N 2-1 and HC3N 24-23 in IC 342, but neither HC3N transition is detected in M 82. On the other hand, we obtained HC3N 24-23 detections in NGC 1068 which were classified as a HC3N-poor galaxy in Lindberg et al. (2011). In the sample of some nearby galaxies observed by Aladro et al. (2015), the ratio between the peak temperature () of HC3N/HCN or HC3N/HCO+also show large variance. In NGC 253 and M 82, HC3N 10-9 is only 1/20 as strong as HCO+1-0, while in Arp 220 HC3N 10-9 is nearly as strong as HCO+1-0. In our results such line ratios also show large diversity. It is not yet clear how to interpret the ratio between HC3N and other molecular lines, and more data of HC3N in different transitions would be helpful to disentangle its properties in different types of galaxies.
Our observations and other works have presented detection of HC3N emission lines from near 18 GHz up to 292 GHz. The newly commissioned Tianma 65 m telescope in Shanghai, China, is able to observe low transition HC3N emission, and has great potential for further HC3N 2-1 surveys for large sample of galaxies.
4 Summary
We carry out single-dish observations towards a sample of nearby gas-rich galaxies with the Effelsberg telescope and the Submillimeter Telescope. This is the first measurements of HC3N 2-1 in a relatively large sample of external galaxies. Our results include:
-
1.
HC3N(=2-1) ( = 18.196 GHz) was observed with the 100-m telescope in 20 galaxies and only three galaxies are detected (): IC 342, M 66 and NGC 660. This is the first measurements of HC3N 2-1 reported in external galaxies, and the first HC3N detection in M 66. We stack the spectra of those non-detections yet there is still no sign of HC3N emission. The upper limit of HC3N intensity from the stacked spectrum is about 0.12 K km s-1.
-
2.
HC3N(=24-23) ( = 218.324 GHz) was observed in nine galaxies with the SMT, and it is detected in three galaxies: IC 342, IC 694 and NGC 1068.
-
3.
IC 342 is the only galaxies detected in both HC3N 2-1 and HC3N 24-23 transitions in our observations, and the two transitions have similar line center and width, suggesting a similar emitting area. The ratio of integrated intensity of HC3N 24-23/HC3N 2-1 is about 0.82. Due to the contamination of CO 2-1 image signal in the upper sideband, M 82 and Arp 220 are treated as non-detection of HC3N 24-23.
-
4.
The ratios between HC3N and HCN, HCO+ show a large variance among the galaxies with HC3N detections, implying different behavior of the molecular lines in galaxies. More sample are needed to better understand the relationship between HC3N and other molecules.
Acknowledgements.
We thank the staff of the Effelsberg telescope and the SMT for their kind help and support during our observations. This project is funded by China Postdoctoral Science Foundation (grant 2015M580438), National Natural Science Foundation of China (grant 11420101002, 11311130491, 11590783 and 11603075), and the CAS Key Research Program of Frontier Sciences. This research has made use of NASA’s Astrophysics Data System, and the NASA/IPAC Extragalactic Database (NED), which is operated by the Jet Propulsion Laboratory, California Institute of Technology, under contract with the National Aeronautics and Space Administration.References
- Aalto et al. (2007) Aalto, S., Monje, R., & Martín, S. 2007, A&A, 475, 479
- Aladro et al. (2015) Aladro, R., Martín, S., Riquelme, D., et al. 2015, A&A, 579, A101
- Aladro et al. (2011) Aladro, R., Martín-Pintado, J., Martín, S., Mauersberger, R., & Bayet, E. 2011, A&A, 525, A89
- Baan et al. (2008) Baan, W. A., Henkel, C., Loenen, A. F., Baudry, A., & Wiklind, T. 2008, A&A, 477, 747
- Baan et al. (2014) Baan, W. A., Loenen, A. F., & Spaans, M. 2014, MNRAS, 445, 3331
- Costagliola & Aalto (2010) Costagliola, F. & Aalto, S. 2010, A&A, 515, A71
- Costagliola et al. (2011) Costagliola, F., Aalto, S., Rodriguez, M. I., et al. 2011, A&A, 528, A30
- Costagliola et al. (2015) Costagliola, F., Sakamoto, K., Muller, S., et al. 2015, Astronomy and Astrophysics, 582, A91
- Evans (1999) Evans, II, N. J. 1999, ARA&A, 37, 311
- Fukui & Kawamura (2010) Fukui, Y. & Kawamura, A. 2010, ARA&A, 48, 547
- Gao & Solomon (2004a) Gao, Y. & Solomon, P. M. 2004a, ApJS, 152, 63
- Gao & Solomon (2004b) Gao, Y. & Solomon, P. M. 2004b, ApJ, 606, 271
- Ginard et al. (2015) Ginard, D., Fuente, A., García-Burillo, S., et al. 2015, A&A, 578, A49
- Greve et al. (2009) Greve, T. R., Papadopoulos, P. P., Gao, Y., & Radford, S. J. E. 2009, ApJ, 692, 1432
- Henkel et al. (1991) Henkel, C., Baan, W. A., & Mauersberger, R. 1991, Astron. Astrophys. Rev., 3, 47
- Henkel et al. (1988) Henkel, C., Schilke, P., & Mauersberger, R. 1988, A&A, 201, L23
- Irvine et al. (1987) Irvine, W. M., Goldsmith, P. F., & Hjalmarson, A. 1987, in Astrophysics and Space Science Library, Vol. 134, Interstellar Processes, ed. D. J. Hollenbach & H. A. Thronson, Jr., 561–609
- Jiang et al. (2011) Jiang, X., Wang, J., & Gu, Q. 2011, MNRAS, 418, 1753
- Krips et al. (2008) Krips, M., Neri, R., García-Burillo, S., et al. 2008, ApJ, 677, 262
- Lindberg et al. (2011) Lindberg, J. E., Aalto, S., Costagliola, F., et al. 2011, A&A, 527, 17
- Meier & Turner (2005) Meier, D. S. & Turner, J. L. 2005, ApJ, 618, 259
- Meier & Turner (2012) Meier, D. S. & Turner, J. L. 2012, ApJ, 755, 104
- Meier et al. (2014) Meier, D. S., Turner, J. L., & Beck, S. C. 2014, ApJ, 795, 107
- Meier et al. (2011) Meier, D. S., Turner, J. L., & Schinnerer, E. 2011, AJ, 142, 32
- Meier et al. (2015) Meier, D. S., Walter, F., Bolatto, A. D., et al. 2015, ApJ, 801, 63
- Nguyen et al. (1992) Nguyen, Q.-R., Jackson, J. M., Henkel, C., Truong, B., & Mauersberger, R. 1992, ApJ, 399, 521
- Sanders et al. (2003) Sanders, D. B., Mazzarella, J. M., Kim, D.-C., Surace, J. A., & Soifer, B. T. 2003, AJ, 126, 1607
- Solomon et al. (1992) Solomon, P. M., Downes, D., & Radford, S. J. E. 1992, ApJ, 387, L55
- Suzuki et al. (1992) Suzuki, H., Yamamoto, S., Ohishi, M., et al. 1992, ApJ, 392, 551
- Tsai et al. (2006) Tsai, C.-W., Turner, J. L., Beck, S. C., et al. 2006, AJ, 132, 2383
- Tsai et al. (2012) Tsai, M., Hwang, C.-Y., Matsushita, S., Baker, A. J., & Espada, D. 2012, ApJ, 746, 129
- Turner (1971) Turner, B. E. 1971, ApJ, 163, L35
- Viti et al. (2014) Viti, S., García-Burillo, S., Fuente, A., et al. 2014, A&A, 570, A28
- Wang et al. (2011) Wang, J., Zhang, Z., & Shi, Y. 2011, MNRAS, 416, L21
- Wang et al. (2014) Wang, J., Zhang, Z.-Y., Qiu, J., et al. 2014, ApJ, 796, 57
- Wang et al. (2016) Wang, J., Zhang, Z.-Y., Zhang, J., Shi, Y., & Fang, M. 2016, MNRAS, 455, 3986
- Young et al. (1995) Young, J. S., Xie, S., Tacconi, L., et al. 1995, ApJS, 98, 219
- Zhang et al. (2014) Zhang, Z.-Y., Gao, Y., Henkel, C., et al. 2014, ApJ, 784, L31