Hubble Space Telescope detection of the millisecond pulsar J21243358 and its far-ultraviolet bow shock nebula
Abstract
We observed a nearby millisecond pulsar J2124–3358 with the Hubble Space Telescope in broad far-UV (FUV) and optical filters. The pulsar is detected in both bands with fluxes - erg s-1 cm-2 and erg s-1 cm-2, which correspond to luminosities of and erg s-1, for pc and . The optical-FUV spectrum can be described by a power-law model, , with slope –0.48 for a conservative range of color excess, –0.08. Since a spectral flux rising with frequency is unusual for pulsar magnetospheric emission in this frequency range, it is possible that the spectrum is predominantly magnetospheric (power law with ) in the optical while it is dominated by thermal emission from the neutron star surface in the FUV. For a neutron star radius of 12 km, the surface temperature would be between and K, for ranging from to 0, –0.08, and –500 pc. In addition to the pulsar, the FUV images reveal extended emission spatially coincident with the known H bow shock, making PSR J2124–3358 the second pulsar (after PSR J04374715) with a bow shock detected in FUV.
Subject headings:
pulsars: individual (PSR J21243358) — shock waves — ISM: jets and outflows — ultraviolet: ISM, stars — X-rays: individual (PSR J21243358)1. Introduction
Although many rotation-powered pulsars have been detected in the radio, X-rays and -rays, only about a dozen of them have been detected in the UV-optical-IR (UVOIR) range (see Mignani 2011 for a review). Their optical spectra can be described by a power-law (PL) model, , with slopes . The PL components of their X-ray spectra show a faster decrease with frequency, implying spectral break(s) between the optical and X-rays. This non-thermal emission is thought to be produced by relativistic electrons/positrons in the pulsar magnetosphere. In addition to the PL optical emission, several middle-aged (a few hundred kyr old) pulsars (e.g., PSR B0656+14 and Geminga) exhibit thermal (Rayleigh-Jeans) spectra, , in the far-UV (FUV), originating from the surface of cooling neutron stars (NSs), with brightness temperatures of – K, usually somewhat lower than those inferred from thermal X-ray components (Kargaltsev & Pavlov, 2007).
As the temperature of a passively cooling NS sharply decreases at ages beyond about 1 Myr (Yakovlev & Pethick, 2004), surfaces of old pulsars were expected to be very cold. However, our Hubble Space Telescope (HST) observations of the 7 Gyr old millisecond (recycled) pulsar J0437–4715 (J0437 hereafter), the only millisecond pulsar firmly detected in the UVOIR range111Far-UV emission from the double pulsar J0737–3039, detected by Durant et al. (2014), likely comes from the millisecond pulsar J0737–3039A, but additional observations are needed to prove it., have shown a thermal FUV spectrum emitted from the bulk NS surface with a temperature of about K (Kargaltsev et al., 2004; Durant et al., 2012). This result suggests that some heating mechanism(s) operate throughout the life of NSs. To understand the nature of such mechanisms, we initiated an HST program to observe old pulsars in the FUV and optical bands. In this paper we report first results from this program, obtained from observations of PSR J2124–3358 (J2124 hereafter).
J2124 is a solitary ms pulsar with a spin-down energy loss rate erg s-1 and a characteristic age of 3.8 Gyr (Reardon et al., 2016). It was discovered during the Parkes 436 MHz survey of the southern sky (Bailes et al., 1997). J2124 has a parallax distance pc and an accurately measured proper motion, mas yr-1, mas yr-1(Reardon et al., 2016), corresponding to the transverse velocity 0.8 km s-1 (at pc).
X-ray pulsations from J2124 were found by Becker & Trümper (1999) in ROSAT observations. XMM-Newton observations of J2124 have shown that a two-component model is required to fit its X-ray spectrum (Zavlin, 2006). For example, a PL + H-atmosphere (polar cap) model with , K, and km provides a reasonable description of the observed spectrum. Alternatively, a two-temperature H-atmosphere model (a hot polar cap “core” surrounded by a colder “rim”), with K, km, K, km, describes the spectrum equally well (see also Bogdanov et al. 2008).
J2124 was also detected by Fermi (see the 2PC LAT catalog; Abdo et al. 2013). Its -ray spectrum can be characterized by a cut-off PL model with and cut-off energy GeV. The corresponding 0.1–100 GeV energy flux is erg s-1 cm-2. The best-fit is rather small for a pulsar (only 14% of pulsars in the 2PC LAT catalog have similar or smaller values).
In the optical, J2124 was observed by the ESO Very Large Telescope (VLT) in 2001 using the FOcal Reducer and Spectrograph 1 (FORS1) camera. The pulsar was not detected, with limits of , , and (Mignani & Becker, 2004).
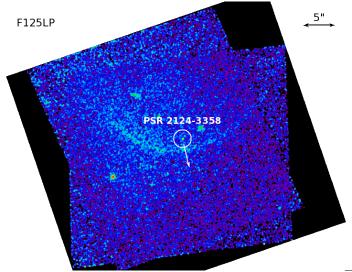
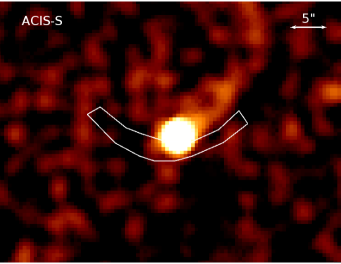
J2124 is among the 9 pulsars (including J0437) around which H bow-shock nebulae have been detected (Brownsberger & Romani 2014; Gaensler et al. 2002; see the H image in the bottom-right panel of Figure 1). H bow shocks are created by pulsars moving through the interstellar medium (ISM) at a speed exceeding the ISM sound speed, if there are enough neutral H atoms ahead of the pulsar. They are expected to be accompanied by cometary X-ray pulsar wind nebulae, which are produced by synchrotron radiation of the shocked pulsar wind confined by the ram pressure of oncoming medium (Kargaltsev & Pavlov, 2008). A Chandra ACIS observation of J2124 revealed a puzzling faint X-ray nebula which looks like a one-sided, elongated structure projected within the interior of the H bow shock (Chatterjee et al., 2005; Hui & Becker, 2006). This X-ray emission extends northwest of the pulsar by (see the X-ray image in Figure 2), and its spectrum fits an absorbed PL with photon index and luminosity erg s-1.
In this paper we present an analysis of our HST observations of J2124 in optical and FUV bands (Section 2), resulting in detection of the pulsar in both bands (Section 2.2.1), and discovery of FUV emission from the bow shock (Section 2.2.2). We discuss the implications of our findings in Section 3.
2. Observations and Results
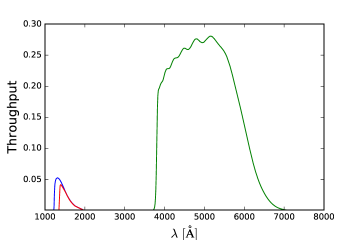
The HST observations of J2124 (program 13783, PI Pavlov; see Table 1) were carried out in three visits that occurred between 2014 November 15 and 2015 August 12. The data were taken with the Solar Blind Channel (SBC) detector of the Advanced Camera for Surveys (ACS; field of view, pixel scale) using long-pass filters F125LP and F140LP, and with the Wide Field Camera 3 (WFC3) Ultraviolet-Visible channel (UVIS; field of view, 004 pixel scale) in the very broad F475X (wide ) filter. The F125LP, F140LP and F475X filter pivot wavelengths are 1438, 1528, and 4939 Å, respectively. The throughputs of these filters are shown in Figure 3. The pulsar was placed close to the center of the SBC field-of-view for ACS observations and near the corner ( away from the edges) of the UVIS2 chip in WFC3 observation. The chosen UVIS placement ensures that the pulsar is close to the readout, which minimizes the charge transfer efficiency (CTE) losses222See Section 6.9 of the WFC3 Instrument Handbook; http://www.stsci.edu/hst/wfc3/documents/handbooks/currentIHB/c06_uvis10.html.. The FUV data were acquired during four orbits. The F125LP images were taken in the Earth shadow, where the geocoronal FUV background is greatly reduced. The F140LP filter, which cuts off geocoronal emission shortward of 1400 Å, was used outside the shadow parts of the orbits. The UVIS/F475X exposure was taken during a single orbit. The data were downloaded from the Mikulski Archive for Space Telescopes (MAST333See http://archive.stsci.edu/.). Each MAST image is flat-field corrected using the PyRAF Multidrizzle task, which produces co-aligned images, corrected for geometrical distortion. We perform aperture photometry using the PHOT and POLYPHOT tasks in IRAF444IRAF is distributed by the National Optical Astronomy Observatories, which are operated by the Association of Universities for Research in Astronomy, Inc., under cooperative agreement with the National Science Foundation..
| Date | Instrument | Filter | Exposure (s) |
|---|---|---|---|
| 2014-11-15 | WFC3/UVIS | F475X | 2532 |
| 2015-07-14 | ACS/SBC | F125LP | 3688 |
| 2015-07-14 | ACS/SBC | F140LP | 1218 |
| 2015-08-12 | ACS/SBC | F125LP | 3688 |
| 2015-08-12 | ACS/SBC | F140LP | 1218 |
2.1. Astrometry
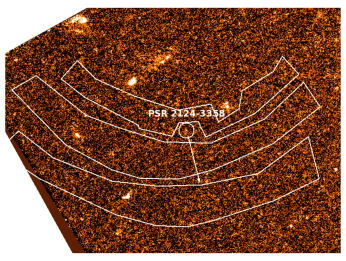
To identify the pulsar in the HST images (see Figure 1), we had to check the astrometry of our data. We used stars from the Guide Star Catalog (GSC v.2.3) within the field of view of the WFC3/UVIS to improve the astrometry of the F475X image. Other catalogs with more precise coordinate measurements (e.g., 2MASS, UCAC4) had too few objects in the UVIS field of view. Moreover, most of these objects are bright stars, saturated in the UVIS image, which prevents accurate centroiding and renders them unsuitable for the astrometric correction. Prior to the correction, we found a systematic offset between the GSC v.2.3 and the UVIS stars to be (consistent with the typical HST pointing error555See http://www.stsci.edu/institute/org/telescopes/Reports/Lallo_TIPS_19June08.pdf). We then selected 20 stars from the GSC with obvious UVIS counterparts suitable for accurate centroid determination. As these stars did not have proper motion measurements, we could not adjust their coordinates for the epoch of the HST observations. This can explain four outliers (i.e., UVIS stars having 3 times the mean offset from the catalog position), which we interpret as a proper motion effect. These stars were removed from our final sample of reference stars. We then used the IRAF task DAOFIND to find the detector coordinates of the centroids for the remaining 16 reference stars and supplied them to the IRAF task CCMAP666See http://stsdas.stsci.edu/cgi-bin/gethelp.cgi?ccmap. to calculate new astrometric solution by matching these stars with their GSC counterparts. The refined astrometric solution has standard deviations and for the sample of 16 stars (at 68% confidence).
In the SBC image only five sources are seen. Since none of them have counterparts in catalogs, we had to align the F125LP and F140LP images with the UVIS image. Three of the sources, seen in both the UVIS and SBC images, were used in the alignment process. However, all three sources appear to be extended in both images (likely, they are background galaxies). This hinders accurate centroid determination leading to an uncertainty777Note that CCMAP calculates a “perfect” (no error) astrometric solution from three points (stars). The quoted uncertainty, , was obtained by selecting different centroiding methods (brightness peak, weighted brightness center, brightest pixel), and selecting the mean and standard deviation as the true center and astrometric solution uncertainty, respectively. of in aligning the SBC images with the UVIS image.
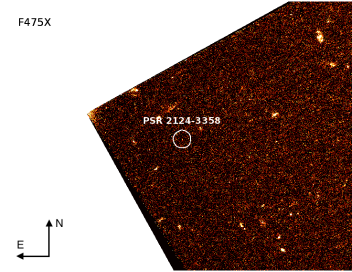
In the astrometry-corrected UVIS image we found a faint source located at :24:43.841(16) and 33:58:45.01(18). These coordinates are offset by and from the pulsar’s radio coordinates (:24:43.841662(24) and 33:58:45.1897(5)) expected at the epoch of the UVIS observation (MJD 56976). Since the offset is within the alignment uncertainty, we conclude that this is a very viable candidate for the pulsar counterpart888We attempted to improve the astrometry by matching GSC v.2.3 stars with UCAC4 stars within one degree from the pulsar. Using 370 matches for stars with magnitudes , we found offsets and along R.A. and Decl., respectively. Since these offsets are statistically insignificant, the GSC–UCAC4 matching does not improve the astrometry and does not change our conclusion..
| Filter | |||||
|---|---|---|---|---|---|
| arcsec2 | arcsec2 | cts s-1 | cts s-1 | cts s-1 | |
| Pulsar | |||||
| F125LP | 0.080 | 6.75 | |||
| F140LP | 0.053 | 6.75 | |||
| F475X | 0.045 | 0.42 | |||
| Bow shock | |||||
| F125LP | 52.1 | 80.5 | |||
| F140LP | 52.1 | 80.5 | |||
2.2. Pulsar Photometry
To find the optimal aperture for the photometry in SBC/F125LP image, we calculated the signal-to-noise () ratio for a set of varying circular apertures centered on the source. The background was estimated from an annular region with and pixels (064 and 16, respectively) centered on the source. We found that the pixels (016) aperture provides a maximum . This aperture corresponds to about 64% of the encircled energy, according to ACS Instrument Handbook999See http://www.stsci.edu/hst/acs/documents/handbooks/current/c05_imaging7.html#368448.. Repeating the process for the F140LP image, we found an optimal aperture () of pixels () corresponding to the encircled energy fraction of 58%. The pulsar detection is less significant due to a factor of 6 smaller exposure time of the F140LP observations and a reduced throughput compared to F125LP. Note that the pulsar photometry was done on individual images to avoid additional broadening of the source caused by the imperfect alignment.
We repeated this procedure for the UVIS/F475X image, where the background was taken from an annulus with and pixels (032 and 048, respectively). We found the optimal extraction aperture of pixels (), which corresponds to the encircled energy fraction of and provides .
The net source count rate was calculated as , where is the total count rate in the source region of area , and is the background count rate in the region of area . Correspondingly, the source count rate uncertainty was calculated as , where is the exposure time. The net count rates for the optimal apertures are given in Table 2.
We then corrected the rates for the finite aperture sizes and followed standard photometry procedures to convert count rates to flux densities101010See http://www.stsci.edu/hst/wfc3/phot_zp_lbn. The observed mean flux densities for F125LP, F140LP, and F475X are nJy, nJy, and nJy, respectively. For a plausible reddening (see Section 2.3) these values correspond to dereddened flux densities of nJy, nJy, and nJy, for F125LP, F140LP, and F475X, respectively.
2.3. Extinction
To interpret the photometry results, we need to know the interstellar extinction toward J2124. The extinction coefficient is proportional to the color excess , which, on average, is proportional to the hydrogen column density . Zavlin (2006) reported – cm-2 toward J2124 based on fits to the X-ray data. The dispersion measure, pc cm-3, leads to a similar cm-2 (for an assumed 10% degree of ISM ionization). The relation cm-2 (Gorenstein, 1975; Güver & Özel, 2009), with the commonly assumed , corresponds to –. In our analysis below, we explore an even broader range of color excess, –0.08, to account for the additional uncertainty introduced by the -to- conversion. The upper bound on color excess, , in the direction to J2124 (, ) is based on the Galactic extinction maps by Schlegel et al. (1998). To perform de-reddening, we use the extinction curves adopted from Clayton et al. (2003).
2.4. Pulsar Spectral Fits
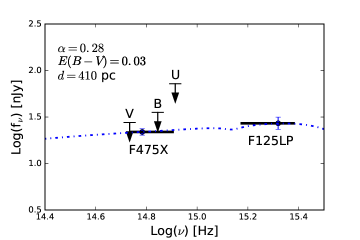
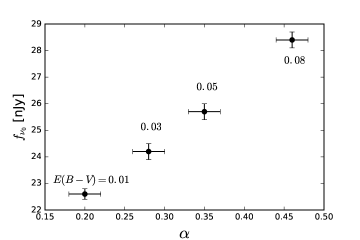
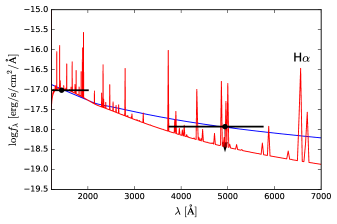
The photometric data in only 3 spectral bands (of which one, F140LP, is within the other, F125LP) can be fitted with many spectral models. We first fit the data with an absorbed PL model, , which is often used to describe magnetospheric emission (Pavlov et al., 1997). We fit the PL slope and normalization at Hz (corresponding to the pivot wavelength of the F475X filter) for 4 fixed values of color excess: . An example of such a fit is shown in Figure 4, and the PL parameters for the four values are given in Figure 5. The slope and normalization values on the grid are and nJy (at Hz), respectively. Their dependences on color excess can be approximated by linear functions in this range: and nJy. The corresponding de-reddened fluxes in the FUV and optical bands are – and – erg s-1 cm-2.
We then considered a single thermal (BB) model with a fixed radius km, a typical radius of a NS as seen by a distant observer. We fit both the BB temperature and color excess for distances –500 pc. Because the FUV band falls in the Rayleigh-Jeans regime for the obtained temperatures, we can express the final results as K and . Since this color excess is much larger than the Galactic value along the line-of-sight and the temperature is implausibly high for the entire NS surface (contradicts to the X-ray data), this model can be ruled out.
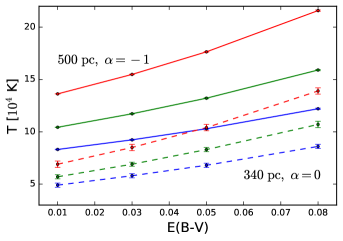
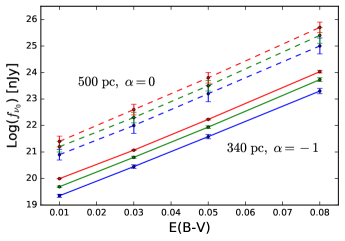
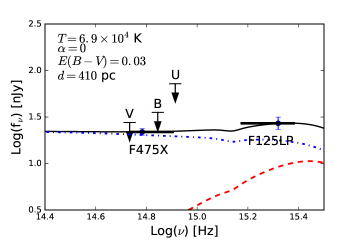
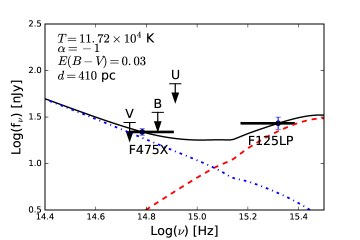
Lastly, we fit a two-component BB+PL model. Given the small number of data points, we fit the BB temperature and PL normalization on a three-dimensional grid , pc, and . The resulting BB temperatures and PL normalizations are plotted in Figure 6. Examples of best-fit model spectra at most plausible pc, are shown in Figure 7 for two values of PL slope, and .
2.5. Bow shock
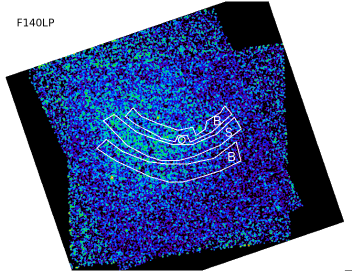
A bow-shaped structure spatially coincident with the known H bow shock (see Gaensler et al. 2002; Brownsberger & Romani 2014) is clearly visible in the F125LP image shown in Figure 1 (top left). The FUV bow shock appears to be asymmetric, being thicker and brighter east of the pulsar. We measure the apex distance (from the pulsar to the leading edge of the bow shock) to be , consistent with the Brownsberger & Romani (2014); Gaensler et al. (2002) measurements in H.
To extract the bow shock flux, we define the source and two background regions, “inside” and “outside” of the bow shock, shown in Figure 1 (top right). The background regions were selected based on the F125LP image, in which the bow shock was most clearly detected. The regions are close to the bow shock extraction region to mitigate effects from the inhomogeneous detector background while excluding the pulsar. Due to the larger apparent thickness of the east side of the bow shock, more space was left between the bow shock extraction region and the background regions. We take into account the background variations by selecting background regions on both sides of the bow shock: one ?inside? and one ?outside? the bow shock. These regions were used for both F125LP and F140LP flux measurements. A combined background from the two regions was extracted. The net source count rate was calculated similarly to the pulsar, with the area being the combined area of the “outside” and “inside” background regions. The F125LP and F140LP count rates and their uncertainties are given in Table 2. From the measured count rates we calculated the absorbed fluxes in the F125LP and F140LP wavelength ranges: erg s-1 cm-2 and erg s-1 cm-2, for a flat spectrum. The unabsorbed luminosity can be estimated as erg s-1, for , and pc.
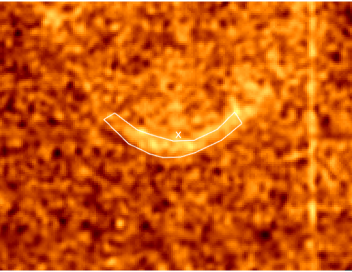
The bow shock is not detected in the F475X images (see Figure 8). Because of the apparent non-uniformities in the background, which significantly exceed the statistical fluctuations, we chose to measure the upper limits by sampling the background counts from ten different regions in the vicinity of the bow shock and calculating the standard deviation from the mean value. The areas of the background regions were equal to that of the bow shock region used for FUV flux measurements. The standard deviation can be considered as a conservative upper limit. The corresponding upper limit on the bow shock flux in the area of 52 arcsec2 is erg s-1 cm-2, for a flat spectrum and .
Similar to our analysis of the FUV bow shock around J0437 (Rangelov et al., 2016), we measured the ratio of the count rates in F125LP and F140LP filters for the J2124 bow shock. We obtained a ratio of . It is smaller than for the J0437 bow shock, but the associated uncertainty is large.
3. Discussion
3.1. Spectrum of PSR J21243358
The obtained photometric measurements can be used to constrain the optical-FUV spectral energy distribution (SED) for J2124 and to look for thermal emission, similar to that of J0437.
The slope inferred from the nonthermal (single PL) fit is outside the typical range of found for the optical-UV magnetospheric emission seen in other pulsars (Kargaltsev & Pavlov, 2007; Mignani, 2011). However, we cannot rule out the possibility that the FUV-optical emission of J2124 is entirely magnetospheric, with , because virtually nothing is known about optical spectra of non-accreting recycled pulsars111111Optical emission from the J0437 pulsar is buried under the much brighter emission of the white dwarf companion (Durant et al., 2012).. The PL fit implies the V-band luminosity erg s-1, which corresponds to an optical efficiency121212The observed spin-down energy loss rate, , needs to be corrected for the Shklovskii effect (Shklovskii, 1970). With the corrected period derivative, s s-1, we obtain the intrinsic spin-down power erg s-1 (for the the moment of inertia of g cm2) and the characteristic pulsar age of Gyr, for pc. , similar to the efficiencies of middle-aged pulsars (see Figure 4 in Danilenko et al. 2012).
A thermal interpretation for combined FUV and optical emission (single BB fit) can be ruled out because it requires a color excess much larger than the Galactic value along this line-of-sight, as well as an implausibly high temperature, K, of the entire NS surface, which would result in an X-ray luminosity much larger than observed.
Finally, there remains a good possibility that the optical emission is predominantly nonthermal while the FUV emission is largely thermal, similar to what is observed for nearby middle-aged pulsars (Kargaltsev & Pavlov, 2007). The optical efficiency in the PL+BB fit is similar to (slightly lower than) that of the single PL fit, because the thermal component contribution is very small in the optical (see Figure 7). It follows from Figure 6 that the NS surface temperature of J2124 is likely in the range – K for the considered (conservative) range color excess values, –0.08, and distances –500 pc. Thus, this interpetation of the J2124 spectrum yields the NS surface temperature similar to that of J0437 (Durant et al., 2012).
Zavlin (2006) has shown that two components are required to fit the X-ray spectrum of J2124. However, various combinations of thermal and nonthermal components were found to be statistically acceptable (e.g., two-component H-atmosphere model, H-atmosphere + PL, BB+PL; see Section 1). Extrapolation of the thermal components, originating from small, hot areas on the NS surface (presumably polar caps), underpredicts the observed FUV fluxes by several orders of magnitude. Therefore, the X-ray-emitting heated regions cannot be responsible for the observed FUV emission from the J2124. The extrapolated best-fit X-ray PL components of the BB+PL and H-atmosphere + PL models overpredict the FUV-optical fluxes by a large margin, but this is not unusual for middle-aged pulsars, which often show a spectral break between the X-ray and optical bands. The extrapolated -ray spectrum is a few orders of magnitude below the optical-FUV fluxes, which means that the optical-FUV and -ray emission are produced by different mechanisms.
If the two-component (thermal plus magnetospheric) nature of the optical-FUV spectrum of J2124 is confirmed in future observations, J2124 would be the second recycled pulsar, after J0437, with such a high temperature, K of the NS surface. It would firmly prove that a heating mechanism operates at least in millisecond pulsars and could distinguish between heating models.
Heating mechanisms that may operate in the interiors of ancient NSs include the dissipation of rotational energy due to interactions between superfluid and normal components of the NS (vortex creep; Alpar et al. 1984; Shibazaki & Lamb 1989), release of strain energy stored by the solid crust due to spin-down deformation (Cheng et al., 1992), rotochemical heating (Reisenegger, 1995; Fernández & Reisenegger, 2005; Petrovich & Reisenegger, 2010), rotation-induced deep crustal heating (a variant of rotochemical heating that operates in the crusts of pulsars; Gusakov et al. 2015), and decay or annihilation of dark matter particles, trapped in the NS interiors (de Lavallaz & Fairbairn, 2010; Kouvaris & Tinyakov, 2010). Among the internal heating mechanisms, the vortex creep, rotochemical heating, and deep crustal heating, all of which are driven by the spin-down of pulsars, are able to account for the high surface temperatures, K, of millisecond pulsars (Gonzalez & Reisenegger, 2010; Gusakov et al., 2015). Both J2124 and J0437 are much older than the standard NS cooling time, so they are expected to be in a quasi-stationary state in which any internal heating and photon cooling balance each other (e.g., Reisenegger 1995; Fernández & Reisenegger 2005). Thus the effective temperature should be a function of the spin-down parameters, for vortex creep, for rotochemical heating (assuming modified Urca reactions and neglecting superfluid corrections), and for rotation-induced deep crustal heating, where is the NS rotation rate and is its time derivative. The spin-down parameters (corrected for the Shklovskii effect) of J2124 are quite similar to those of J0437, so the ratio of their effective temperatures is expected to be , respectively, for the three heating mechanisms. Since, for a radius of 12 km (as assumed here), K (inferred from the results of Durant et al. 2012), the temperature expected for J2124 is only slightly lower, K, which is consistent with temperatures estimated in the PL+BB scenario. To confirm this scenario and estimate the temperature more accurately, the J2124 pulsar must be observed with several filters in the UVOIR range, and the distance to the pulsar should be measured more precisely.
3.2. FUV bow shock
J2124 is the second pulsar with a bow shock detected in FUV. The first FUV bow shock was discovered by Rangelov et al. (2016) around J0437. These authors tested two spectral models for FUV emission. A PL continuum model, with in the FUV range ( if the PL spectrum extends to the optical range), could correspond to synchrotron radiation of relativistic electrons leaked from the X-ray PWN region and trapped at the forward bow shock. The other model, favored by Rangelov et al. (2016), was the spectrum emitted by the ISM matter heated and compressed in a collisionless shock (SHELLS model in Bykov et al. 2013); it was consistent with the measured bow shock fluxes at reasonable values of the shock (pulsar) velocity and upstream ISM density.
The bow shock of J2124 is dimmer and has a lower , which prevents us from performing a similarly detailed analysis. Nevertheless, we can compare general properties of the J2124 shock with those of the J0437 shock. The FUV bow shocks of both pulsars are spatially coincident with the H bow shocks (see Figure 1). In contrast to J0437, the J2124 bow shock shows a significant asymmetry of its shape with respect to the proper motion direction, which has been attributed to a local ISM density gradient perpendicular to the pulsar’s direction of motion (Gaensler et al., 2002). Interestingly, there is also an asymmetry in shock brightness, opposite in the the H and FUV images (compare the top-left and bottom-right panels in Figure 1); the reason of this asymmetry remains unclear. In addition to the asymmetry, the head (apex region) of the FUV-H J2124 bow shock is “flatter” than the head of the J0437 bow shock. This could be caused by anisotropy of the pulsar wind, such that the wind is concentrated in the pulsar’s equatorial plane that is nearly perpendicular to the pulsar’s velocity (Gaensler et al., 2002; Brownsberger & Romani, 2014).
The FUV luminosity, – erg s-1, extracted from the arcsec2 area of the J2124 bow shock is a factor of higher than the FUV luminosity from the arcsec2 area of the J0437 shock. However, the (distance-independent) mean specific intensity, erg cm-2 s-1 arcsec-2 for the J2124 bow shock, is a factor of 2.8 lower than that of the J0437 shock. Such a difference could be partly due to the fact that the width of the extraction region of the J2124 shock was somewhat broader than the actual width of the bright shock area. In addition, the more distant J2124 shock was imaged at larger physical separations in units of length from the apex, where the shock becomes intrinsically dimmer. Therefore, it is likely that the specific intensities of the J2124 and J0437 shocks are close to each other at the same (physical) separations from the apices. Since in the ISM shock interpretation the emitted shock flux per unit emitting area is crudely proportional to the upstream density and only weakly depends on the pulsar velocity in the relevant range of parameters (see Figure 6 of Rangelov et al. 2016), it means that the ISM densities ahead of the J0437 and J2124 shocks are close to each other.
For pulsar J0437, Rangelov et al. (2016) used the ratio of the F125LP and F140LP count rates, , to estimate the slope of the J0437 spectrum in the FUV range, (see Figure 4 in Rangelov et al. 2016). Similarly, for J2124, we have , from which we infer , i.e., a very steeply decreasing spectrum. This result, however, suffers from the large uncertainty of the F140LP count rate. Such a steep spectrum cannot be extrapolated to the optical (F475X) band because the extrapolated spectral flux would greatly exceed the upper limit in that filter, which requires a FUV-optical slope (see Figure 9), corresponding to . Unless the count rate uncertainties are greatly underestimated due to unaccounted systematic errors, this discrepancy can be considered as an argument for a shock SED more complex than a simple PL.
In the shocked ISM emission model the ratio of FUV and H fluxes depends on the model parameters. Brownsberger & Romani (2014) report the H photon flux photons s-1 cm-2, or energy flux erg s-1 cm-2. This corresponds to the ratio of F125LP to H energy fluxes of , although this value can be larger (by a factor of up to 2) because we do not know the exact apex areas used by Brownsberger & Romani (2014). For comparison, the flux ratio in the same filters for J0437 is (Figure 6 in Rangelov et al. 2016), i.e., generally consistent with J2124. The non-detection of the J2124 bow shock in the F475X image provides additional constraints on the spectral shape and, possibly, on the emission mechanism. Figure 9 shows a single PL model and a shocked ISM model (normalized to FUV flux measurement) compatible with the F475X upper limit. The shocked ISM model appears to be able to describe the measurements; however, given the complexity of the model and the scarcity of the data, we do not attempt to fit it.
The detection of the FUV bow shock around two pulsars allows one to assume that such shocks can be detected from many other pulsars, including those from which no H shock is seen because of a lack of neutral hydrogen atoms upstream of the shock. Such observations, currently possible only with the HST, would be very useful for studying the ISM properties and the physics of relativistic shocks.
References
- Abdo et al. (2013) Abdo, A. A., Ajello, M., Allafort, A., et al. 2013, ApJS, 208, 17
- Alpar et al. (1984) Alpar, M. A., Pines, D., Anderson, P. W., & Shaham, J. 1984, ApJ, 276, 325
- Bailes et al. (1997) Bailes, M., Johnston, S., Bell, J. F., et al. 1997, ApJ, 481, 386
- Becker & Trümper (1999) Becker, W., & Trümper, J. 1999, A&A, 341, 803
- Bogdanov et al. (2008) Bogdanov, S., Grindlay, J. E., & Rybicki, G. B. 2008, ApJ, 689, 407-415
- Brownsberger & Romani (2014) Brownsberger, S., & Romani, R. W. 2014, ApJ, 784, 154
- Bykov et al. (2013) Bykov, A. M., Malkov, M. A., Raymond, J. C., Krassilchtchikov, A. M., & Vladimirov, A. E. 2013, Space Sci. Rev., 178, 599
- Chatterjee et al. (2005) Chatterjee, S., Gaensler, B. M., Vigelius, M., et al. 2005, Bulletin of the American Astronomical Society, 37, 183.13
- Cheng et al. (1992) Cheng, K. S., Chau, W. Y., Zhang, J. L., & Chau, H. F. 1992, ApJ, 396, 135
- Clayton et al. (2003) Clayton, G. C., Wolff, M. J., Sofia, U. J., Gordon, K. D., & Misselt, K. A. 2003, ApJ, 588, 871
- Danilenko et al. (2012) Danilenko, A., Kirichenko, A., Mennickent, R. E., et al. 2012, A&A, 540, A28
- de Lavallaz & Fairbairn (2010) de Lavallaz, A., & Fairbairn, M. 2010, Phys. Rev. D, 81, 123521
- Durant et al. (2012) Durant, M., Kargaltsev, O., Pavlov, G. G., et al. 2012, ApJ, 746, 6
- Durant et al. (2014) Durant, M., Kargaltsev, O., & Pavlov, G. G. 2014, ApJ, 783, L22
- Fernández & Reisenegger (2005) Fernández, R., & Reisenegger, A. 2005, ApJ, 625, 291
- Gaensler et al. (2002) Gaensler, B. M., Jones, D. H., & Stappers, B. W. 2002, ApJ, 580, L137
- Gonzalez & Reisenegger (2010) Gonzalez, D., & Reisenegger, A. 2010, A&A, 522, A16
- Gusakov et al. (2015) Gusakov, M. E., Kantor, E. M., & Reisenegger, A. 2015, MNRAS, 453, L36
- Gorenstein (1975) Gorenstein, P. 1975, ApJ, 198, 95
- Güver & Özel (2009) Güver, T., & Özel, F. 2009, MNRAS, 400, 2050
- Hui & Becker (2006) Hui, C. Y., & Becker, W. 2006, A&A, 448, L13
- Kargaltsev et al. (2004) Kargaltsev, O., Pavlov, G. G., & Romani, R. W. 2004, ApJ, 602, 327
- Kargaltsev & Pavlov (2007) Kargaltsev, O., & Pavlov, G. G. 2007, Ap&SS, 308, 287
- Kargaltsev & Pavlov (2008) Kargaltsev, O., & Pavlov, G. G. 2008, in AIP Conf. Proc. 983, 171
- Kouvaris & Tinyakov (2010) Kouvaris, C., & Tinyakov, P. 2010, Phys. Rev. D, 82, 063531
- Mignani & Becker (2004) Mignani, R. P., & Becker, W. 2004, Advances in Space Research, 33, 616
- Mignani (2011) Mignani, R. P. 2011, Advances in Space Research, 47, 1281
- Pavlov et al. (1997) Pavlov, G. G., Welty, A. D., & Córdova, F. A. 1997, ApJ, 489, L75
- Petrovich & Reisenegger (2010) Petrovich, C., & Reisenegger, A. 2010, A&A, 521, A77
- Rangelov et al. (2016) Rangelov, B., Pavlov, G. G., Kargaltsev, O., et al. 2016, ApJ, 831, 129
- Reardon et al. (2016) Reardon, D. J., Hobbs, G., Coles, W., et al. 2016, MNRAS, 455, 1751
- Reisenegger (1995) Reisenegger, A. 1995, ApJ, 442, 749
- Shibazaki & Lamb (1989) Shibazaki, N., & Lamb, F. K. 1989, ApJ, 346, 808
- Shklovskii (1970) Shklovskii, I. S. 1970, Soviet Ast., 13, 562
- Schlegel et al. (1998) Schlegel, D. J., Finkbeiner, D. P., & Davis, M. 1998, ApJ, 500, 525
- Yakovlev & Pethick (2004) Yakovlev, D. G., & Pethick, C. J. 2004, ARA&A, 42, 169
- Zavlin (2006) Zavlin, V. E. 2006, ApJ, 638, 951