The X-ray Decay of the ultraluminous supernova SN 1978K in NGC 1313
Abstract
The Type IIn supernova (SN) 1978K in the nearby galaxy NGC 1313 has remained bright in multiwavelengths for more than yr. The archival data of SN 1978K collected with ROSAT, ASCA, XMM–Newton and Chandra from 1990 to 2006 show no significant variation of the soft X-ray emission but a hint of flux decrease in hard X-rays. In this work, we perform a detailed analysis using more than 15 yr of XMM–Newton observations. Both the 0.5–2 keV and 2–10 keV light-curves decline as from 2000 to 2015. The transition of light curve profiles can be explained in a way that the reverse shock was radiative at an early phase and then became adiabatic at late times. Such a scenario is also supported by the spectral analysis results. We also found a decrease in the absorption column density, which indicates the presence of a cool shell during the radiative phase.
keywords:
circumstellar matter — supernovae: individual: SN 1978K — X-rays: stars1 Introduction
Progenitors of supernovae (SNe), massive stars lose mass via stellar winds, forming a circumstellar medium (CSM). After the explosion, the SN shock waves expand into the surrounding CSM (see reviews by Smith, 2014). The subsequent interaction creates a fast-forward and a reverse shock (e.g. Chevalier & Fransson, 1994; Chatzopoulos et al., 2012). Such interaction can be investigated with radio, infrared, ultraviolet, and X-ray observational data (e.g. Chugai et al., 2007; Tanaka et al., 2012; Milisavljevic et al., 2013; Ng et al., 2013; Gezari et al., 2015; Ryder et al., 2016). If the SNe propagate in the steady stellar winds, we would expect that the X-ray luminosity resulting from shocks declines in a power-law way. Recently, Dwarkadas & Gruszko (2012) collected the X-ray data of 42 SNe and found diverse light-curve profiles. There is increasing evidence that the density structure of the ambient medium may not follow as expected according to the steady wind theory (Chevalier & Fransson, 2003; Chandra et al., 2009). It can even be inhomogeneous or clumpy.
SN 1978K was first discovered as a strong H source in 1990 during a spectrophotometric survey of the H ii region in nearby galaxies, and it was originally classified as a nova (Dopita & Ryder, 1990). Investigating the multiwavelength archival data, Ryder et al. (1993) suggested that it was actually a Type II SN that exploded around 1978 May 22 (Montes et al., 1997). Based on the X-ray and radio data, Schlegel et al. (1999) suggested that the behaviour of SN 1978K is typical of the ‘IIn’ subclass of Type II SNe, which was first designated by Schlegel (1990). The powerful non-thermal radio emission was first revealed with the Molonglo Observatory Synthesis Telescope data taken in 1982 (Ryder et al., 1993). It reached a peak luminosity around the late 1980s, and then declined monotonically up to now (Smith et al., 2007). On 1980 January 2, the Einstein X-ray satellite observed the region of SN 1978K, and obtained an upper limit of unabsorbed flux in 0.2–2.4 keV of erg cm-2 s-1. X-ray emission of SN 1978K was uncovered with the ROSAT Position Sensitive Proportional Counter in 1990 (Ryder et al., 1993; Lenz & Schlegel, 2007). The derived unabsorbed flux was of erg cm-2 s-1 in the 0.2–2.4 keV range, that is erg s-1 at a distance of 4.61 Mpc (Gao et al., 2015), identifying SN 1978K as an ultraluminous X-ray source (ULX). Follow-up X-ray observations made with ASCA, XMM–Newton and Chandra indicated that the X-ray luminosity of SN 1978K remains bright even at yr after the explosion (e.g. Lenz & Schlegel, 2007; Smith et al., 2007).
Since SN 1978K is luminous in multiwavelengths, the long-term broad-band monitoring data provide a good opportunity for the study of the interaction between the outgoing shock and the CSM. The X-ray data of SN 1978K prior to 2006 have been analysed; however, whether its flux has remained constant since the first detection by ROSAT or started to decline was still under debate (e.g. Lenz & Schlegel, 2007; Smith et al., 2007). It is worth noting that there are another two ULXs (X-1 and X-2) in NGC 1313. Thus, this region has been frequently visited by X-ray missions in order to explore the spectral evolution of these sources (e.g. Feng & Kaaret, 2006; Bachetti, 2013; Weng et al., 2014). In the past decade, some additional long observations were carried out with XMM–Newton (Table 1), which is a focusing X-ray telescope having a large effective area in the soft X-ray band. In this paper, we study the XMM–Newton observations covering the period from 2000 to 2015 (spanning 5277 d), aiming to explore the evolution in X-ray emission of SN 1978K at very late times. The XMM–Newton data reduction is described in the next section, and the results are presented in Sections 3. Discussion and conclusion follow in Section 4.
2 Data Reduction
The detailed study presented here was on data from the main camera onboard XMM–Newton, the European Photon Imaging Camera (EPIC), which consists of two MOS arrays and one PN CCD array (Strüder et al., 2001; Turner et al., 2001). We analyse all of the available XMM–Newton observations of SN 1978K made from 2000 October to 2015 March; however, we discard those data that were affected by the strong background flares or when the source falls in the CCD gaps. The observational details of the data used in this paper are listed in Table 1. The XMM–Newton observations of SN 1978K are quite clean except two short observations in 2003 December (ObsIDs = 0150280401, 0150280501), and only less than 12% of data on average are excluded. The data are reduced with the Science Analysis System software (sas) version 14.0.0. We create the light curve above 10 keV, and exclude background flares with a count-rate cut-off criterion. The data from good time intervals are filtered by setting FLAG = 0 and PATTERN 4 for the PN data, and PATTERN 12 for the MOS data to ensure the best quality spectrum (Snowden et al., 2016). The source photons are extracted from a circle aperture with a radius of 30 arcsec, while the background is taken from the same CCD chips as the source and at a similar distance from the readout node. Since the source is relatively faint ( erg cm-2 s-1), the pile-up effect can be neglected. We produce the response files with the sas tasks rmfgen and arfgen to facilitate subsequent spectral analysis. The task specgroup is carried out to rebin all spectra to have at least 20 counts per bin and not to oversample the instrument energy resolution by more than a factor of 3.
We fit the spectra in the 0.5–10 keV range using xspec with a 2% systematic error added (Smith et al., 2016). When available, the PN and MOS spectra for each observation are fitted together. To account for the cross-normalization issues, we include a multiplicative constant in the model and fix it to unity for the PN data, but allow it to vary for the MOS data. Due to the short exposure time, it is difficult to constrain the parameters for the individual observations carried out before 2006. Since there is no significant spectral evolution within less than one year, we merge some successive observations, which are referred to as Groups 1–8 (Tables 1 and 2), to better constrain the model parameters.
The X-ray emission from SN 1978K can be described by an absorbed two-temperature optically thin thermal plasma model, in which the soft and hard components are attributed to the reverse and forward shocks, respectively. Smith et al. (2007) suggested that the X-ray spectra of SN 1978K can be fitted with a double vmekal model (see also Schlegel et al., 2004) with very large helium abundance. Here, we first apply a two-temperature non-equilibrium ionization model (vnei in xspec), and confirm that helium abundance in both components needs to be large. The ionization time-scale for the soft component is larger s cm-3, indicating that the reverse shock collides with very dense clouds and has already reached ionization equilibrium. Meanwhile, the ionization time-scale for the hard component is - s cm-3, indicating a non-equilibrium condition. Therefore, we adopt the tbabs*(vmekal+vnei) model in the following spectra analysis, since vnei reduces to vmekal in ionization equilibrium and the latter is much faster to compute.
The best-fitting spectral parameters with uncertainties at 90% confidence level are listed in Table 2. Both the absorbed and unabsorbed fluxes are calculated with the convolution model cflux. The evolution of the X-ray luminosity and the equivalent hydrogen column density are not sensitive to the spectral models, while the parameters of two shocks, including plasma temperatures and large He abundances, generally agree with those by Smith et al. (2007), who also gave an all-round analysis of the XMM-Newton data prior to 2006. However, there is no evidence for the large He abundances detected in the Chandra data (Schlegel et al., in preparation). The divergence might be due to the calibration differences between Chandra and XMM–Newton (e.g. Nevalainen et al., 2010; Schellenberger et al., 2015). Note that our absorption column density [ cm-2] is slightly higher than the values reported in Smith et al. (2007) and Lenz & Schlegel (2007), due to the choice of the updated solar abundances by Wilm et al. (2000). This value is also much larger than the absorption in the direction of NGC 1313, cm-2 (Schlegel et al., 1998).
| Group | ObsID | Obs date | Instruments | Net exposure (ks) |
|---|---|---|---|---|
| Group1 | 0106860101 | 2000-10-17 | PN/MOS1/MOS2 | 24.1/28.7/28.7 |
| Group2 | 0150280301 | 2003-12-21 | PN/MOS1/MOS2 | 7.7/10.5/10.5 |
| Group2 | 0150280401 | 2003-12-23 | PN/MOS1/MOS2 | 3.3/8.1/8.5 |
| Group2 | 0150280501 | 2003-12-25 | PN/MOS1/MOS2 | 6.4/9.3/9.4 |
| Group2 | 0150280601 | 2004-01-08 | PN/MOS1/MOS2 | 8.4/12.8/13.0 |
| Group2 | 0150281101 | 2004-01-16 | MOS1/MOS2 | 8.5/8.5 |
| Group2 | 0205230201 | 2004-05-01 | MOS1/MOS2 | 8.7/9.3 |
| Group3 | 0205230301 | 2004-06-05 | PN/MOS1/MOS2 | 8.9/11.6/11.5 |
| Group3 | 0205230401 | 2004-08-23 | PN/MOS1/MOS2 | 9.0/14.9/15.2 |
| Group3 | 0205230501 | 2004-11-23 | MOS1/MOS2 | 15.5/15.5 |
| Group3 | 0205230601 | 2005-02-07 | PN/MOS1/MOS2 | 9.8/12.6/12.9 |
| Group4 | 0301860101 | 2006-03-06 | PN/MOS1/MOS2 | 17.5/21.3/21.3 |
| Group4 | 0405090101 | 2006-10-15 | PN/MOS1/MOS2 | 86.0/119.0/119.6 |
| Group5 | 0693850501 | 2012-12-16 | PN/MOS1/MOS2 | 97.9/117.7/120.2 |
| Group5 | 0693851201 | 2012-12-22 | PN/MOS1/MOS2 | 101.4/121.1/123.7 |
| Group6 | 0722650101 | 2013-06-08 | PN/MOS1/MOS2 | 20.0/30.1/30.1 |
| Group7 | 0742590301 | 2014-07-05 | PN/MOS1/MOS2 | 53.6/61.0/61.1 |
| Group8 | 0742490101 | 2015-03-30 | PN/MOS1/MOS2 | 84.8/98.0/100.1 |
3 Results
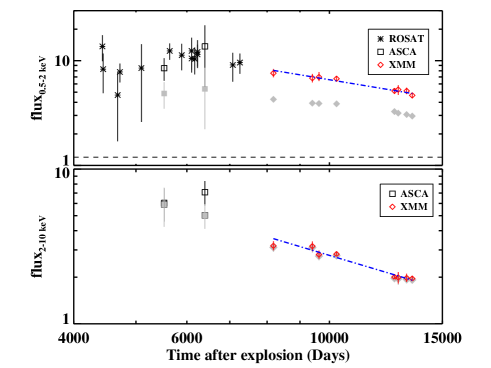
Since the first XMM–Newton observation carried out on 2000 October 17, the X-ray flux of SN 1978K had dropped by 40% in the last 15 yr. Assuming a distance of 4.61 Mpc (Gao et al., 2015), the unabsorbed luminosities in the 0.5–10 keV band are 2.96 and 1.76 erg s-1 on 2000 October 17 and 2015 March 30. The detailed flux evolution is plotted in Fig.1. It is quite obvious that the unabsorbed X-ray fluxes of SN 1978K display a power-law decay. Using the idl routine linfit, we fit the light curves with the following function:
| (1) |
where is the observational date in days, is taken to be MJD 43650 (1978 May 22; Montes et al., 1997) when the SN was at peak luminosity and and are the fitting parameters. The derived values of are for 0.5–2 keV, and for 2–10 keV. In Fig. 1, we also plot the X-ray fluxes measured by Einstein, ROSAT and ASCA (Schlegel et al., 2004, and references therein). These archival data indicate that the X-ray flux in the 0.5–2 keV band had a shallower decay or remained constant at an earlier stage. On the other hand, the 2–10 keV flux estimated from the ASCA data could be consistent with the extrapolated value of our power-law fitting (bottom panel of Fig. 1).
As seen in Table 2, the absorption column density () decreases with time. It is worth noting that the parameters in Groups 1–4 (and 5–8) vary by less than 20%. Therefore, in order to increase the signal-to-noise ratio, we divide all spectra into two parts, those collected before 2006 October 16 and those collected between 2012 and 2015. The same spectral model is then applied to these two sets of spectra (Table 3), respectively. We found that the value of has decreased by more than 5 [in the range (2.53–2.12) cm-2] over the last 10 yr. However, we can not estimate the evolution of the parameters of the hot plasma components because of their large uncertainties.
| ObsID | Hesoft | Hehard | /dof | ||||||
|---|---|---|---|---|---|---|---|---|---|
| ( cm-2) | (keV) | (keV) | (s cm-3) | ( erg cm-2 s-1) | ( erg cm-2 s-1) | ||||
| Group1 | 129.5/165 | ||||||||
| Group2 | 467.4/431 | ||||||||
| Group3 | 413.9/401 | ||||||||
| Group4 | 450.6/413 | ||||||||
| Group5 | 507.6/481 | ||||||||
| Group6 | 169.1/143 | ||||||||
| Group7 | 208.1/177 | ||||||||
| Group8 | 214.3/236 |
aBoth absorbed (former) and unabsorbed (latter) fluxes are calculated in 0.5–2 keV and 2–10 keV, respectively. All errors are in the 90% confidence level.
| Date | Hesoft | normsoft | Hehard | normhard | /dof | |||||
|---|---|---|---|---|---|---|---|---|---|---|
| ( cm-2) | (keV) | () | (keV) | (s cm-3) | () | |||||
| 2000-2006 | 1643.5/1437 | |||||||||
| 2012-2015 | 1257.7/1064 |
4 Discussion and conclusion
Multiband observations of Type II SNe bear the imprint of interaction between the SNe and CSM ejected by their progenitors. For the non-radiative case, we would expect that the X-ray emission decreases inversely with time as if SNe expand into a steady wind medium (see e.g. Immler & Lewin, 2003). Dwarkadas & Gruszko (2012) investigated the light curves of 42 SNe, but found that none of them declines as . Before our work, Lenz & Schlegel (2007) claimed that the soft X-ray flux of SN 1978K remained at a constant level, whereas the hard X-ray emission dropped slightly. In the meantime, the radio light curves had faded steadily since 1991 (Smith et al., 2007) 111https://www.ast.cam.ac.uk/ioa/wikis/SEES/images/f/f1/Ryder.pdf. Here, we analyse all archival XMM–Newton data for both light-curve and spectral evolution. It is remarkable that both the soft and hard X-ray light curves turn into a decline around the year 2000 ( d after explosion). This result implies that the shock wave is now propagating through the medium with a density gradient (Chevalier & Fransson, 2003; Chandra et al., 2009; Dwarkadas & Gruszko, 2012), and the free–free radiation dominates the X-ray emission. Alternatively, the transition of the reverse shock from radiative to adiabatic phases could account for the change of the light curve decay rate. As we discuss below, such a scenario is supported by both the temporal and spectral evolutions, and it was proposed to explain the behaviour of SN 1993J (Chandra et al., 2009).
SN 1993J is another bright SN and is well studied in broad-band wavelengths (e.g. Bjornsson, 2015; Jerkstrand et al., 2015, and references therein). During the first yr, the soft and hard X-ray fluxes had shallow decays at different rates, and then both underwent a decline at later times (Chandra et al., 2009), analogous to what SN 1978K exhibits (Fig.1). With the self-similar assumption of a steady progenitor wind, the free–free emission from the adiabatic shock is suggested to follow the time evolution of (e.g. Chevalier & Fransson, 2003). The forward shock, corresponding to the harder component, has been in the adiabatic phase since the very beginning. On the other hand, the reverse shock (the softer component) could be radiative at an early stage, having a flatter profile of soft X-ray light curves, and then it becomes adiabatic after a cooling time of the gas behind the reverse shock (Chandra et al., 2009).
The caution is that SN 1993J is categorized as a Type IIb SN (Woosley et al., 1994), while SN 1978K is of Type IIn. SN 1978K is still barely resolved in the new very long baseline interferometry image at 8.4GHz on 2015 March 29; therefore, Ryder et al. (2016) suggested that its average expansion velocity in the last 37 yr had been less than 1500 km s-1. Compared to the case in SN 1993J, the much slower shock velocity of 500–600 km s-1 in SN 1978K shown by the optical emission lines indicates that the SN blast wave has been decelerated by the very dense CSM (Chugai et al., 1995; Kuncarayakti et al., 2016). Since the cooling time of the gas behind the reverse shock is anti-correlated with the shock velocity (; Chevalier & Fransson, 1994; Chandra et al., 2009), the lower shock speed in SN 1978K results in a longer transition time ( 6000–8000 d; Fig. 1) for radiative cooling. In addition, the large He abundances observed in SN 1978K (Table 3) would extend the cooling time further (see table 3 in Chandra et al., 2009).
In the radiative regime, the existence of a cooled shell between the reverse and forward shocks gives rise to additional X-ray absorption, and the column density of the cool gas reduces with time as the SN expands (Chevalier & Fransson, 1994; Fransson et al., 1996; Chandra et al., 2009). With the high-quality spectra collected by XMM-Newton, our result provides, for the first time, strong evidence for the decrease of absorption over the last decade (Table 3), which agrees well with the model discussed above. We further speculate that the non-detection of SN 1978K on 1980 January 2 could be due to the large absorption by the cool shell.
Acknowledgements
We thank the referee, Prof. Eric M. Schlegel, for the helpful comments. We thank Drs Ming-Yu Ge and Qi-Rong Yuan for many valuable suggestions. This work is supported by the National Natural Science Foundation of China under grants 11303022, 11133002, 11573023, 11173016, 11673013 and 11433005, and by the Special Research Fund for the Doctoral Program of Higher Education (grant No. 20133207110006).
References
- Bachetti (2013) Bachetti, M. et al., 2013, ApJ, 778, 163
- Bjornsson (2015) Bjornsson C. I., 2015, ApJ, 813, 43
- Chandra et al. (2009) Chandra, P., Dwarkadas, V. V., Ray, A., Immler, S., & Pooley, D. 2009 , ApJ, 699, 388
- Chatzopoulos et al. (2012) Chatzopoulos, E., Wheeler, J. C., & Vinko, J. 2012, ApJ , 746, 121
- Chevalier & Fransson (1994) Chevalier R. A., & Fransson C., 1994, ApJ, 420, 268
- Chevalier & Fransson (2003) Chevalier,R., & Fransson, C. 2003, in Weiler K., ed., Supernovae and Gamma-Ray Bursters, Springer-Verlag, Berlin, p. 171
- Chugai et al. (2007) Chugai, N. N., Chevalier, R. A., & Utrobin, V. P. 2007, ApJ, 662, 1136
- Chugai et al. (1995) Chugai, N. N., Danziger, I. J., & della Valle, M. 1995, MNRAS, 276, 530
- Dopita & Ryder (1990) Dopita, M. A., & Ryder, S. D. 1990, IAU Circ., 4950, 3
- Dwarkadas & Gruszko (2012) Dwarkadas, V. V., & Gruszko, J. 2012, MNRAS, 419, 1515
- Feng & Kaaret (2006) Feng, H., & Kaaret, P. 2006, ApJ, 650, L75
- Fransson et al. (1996) Fransson, C., Lundqvist, P., & Chevalier, R. A. 1996, ApJ, 461, 993
- Gao et al. (2015) Gao, Q., Wang, W., Liu, J.-F., & Yoachim, P. 2015, ApJ, 799, 19
- Gezari et al. (2015) Gezari, S. et al., 2015, ApJ, 804, 28
- Immler & Lewin (2003) Immler S., & Lewin W. H. G., 2003, in Weiler K., ed., Supernovae and Gamma-Ray Bursters. Springer-Verlag, Berlin, p. 91
- Jerkstrand et al. (2015) Jerkstrand, A. et al., 2015, A&A , 573, A12
- Kuncarayakti et al. (2016) Kuncarayakti, H. et al., 2016, MNRAS, 458, 2063
- Lenz & Schlegel (2007) Lenz, E., & Schlegel, E. M. 2007, AJ, 134, 1821
- Milisavljevic et al. (2013) Milisavljevic, D. et al., 2013, ApJ, 767, 71
- Montes et al. (1997) Montes, M. J., Weiler, K. W., & Panagia, N. 1997, ApJ, 488, 792
- Nevalainen et al. (2010) Nevalainen, J., David, L., & Guainazzi, M. 2010, A&A, 523, A22
- Ng et al. (2013) Ng, C.-Y. et al., 2013, ApJ , 777, 131
- Ryder et al. (2016) Ryder, S. D., Kotak, R., Smith, I. A., et al., 2016, A&A, 595, L9
- Ryder et al. (1993) Ryder, S. D. et al., 1993, ApJ, 416, 167
- Schellenberger et al. (2015) Schellenberger, G. et al., 2015, A&A, 575, 30
- Schlegel (1990) Schlegel, E. M., 1990, MNRAS, 244, 269
- Schlegel et al. (1998) Schlegel, D. J., Finkbeiner, D., & Davis, M. 1998, ApJ, 500, 525
- Schlegel et al. (2004) Schlegel, E. M., Kong, A., Kaaret, P., DiStefano, R., Murray, S., 2004, ApJ, 603, 644
- Schlegel et al. (1999) Schlegel, E. M. et al., 1999, AJ, 118, 2689
- Smith et al. (2007) Smith, I. A. et al., 2007, ApJ, 669, 1130
- Smith et al. (2016) Smith, M. et al., 2016, XMM-SOC-CAL-TN-0018, available at http://xmm2.esac.esa.int/docs/documents/CAL-TN-0018.pdf
- Smith (2014) Smith, N. 2014, ARA&A , 52, 487
- Snowden et al. (2016) Snowden, S. et al., 2016, The XMM-Newton ABC Guide: An Introduction To XMM- Newton Data Analysis, v. 4.6, available at http://heasarc.gsfc.nasa.gov/docs/xmm/abc/
- Strüder et al. (2001) Strüder L. et al., 2001, A&A, 365, L18
- Tanaka et al. (2012) Tanaka, M. et al., 2012, ApJ, 749, 173
- Turner et al. (2001) Turner M. J. L. et al., 2001, A&A, 365, L27
- Weng et al. (2014) Weng, S.-S., Zhang, S.-N., & Zhao, H.-H. 2014, ApJ, 780, 147
- Wilm et al. (2000) Wilms, J., Allen, A., & McCray, R. 2000, ApJ, 542, 914
- Woosley et al. (1994) Woosley, S. E., Eastman, R. G., Weaver, T. A., & Pinto, P. A. 1994, ApJ, 429, 300