Robustness of synthetic oscillators in growing and dividing cells
Abstract
Synthetic biology sets out to implement new functions in cells, and to develop a deeper understanding of biological design principles. In 2000, Elowitz and Leibler showed that by rational design of the reaction network, and using existing biological components, they could create a network that exhibits periodic gene expression, dubbed the repressilator (Elowitz and Leibler, Nature, 2000). More recently, Stricker et al. presented another synthetic oscillator, called the dual-feedback oscillator (Stricker et al., 2008), which is more stable. How the stability of these oscillators is affected by the intrinsic noise of the interactions between the components and the stochastic expression of their genes, has been studied in considerable detail. However, as all biological oscillators reside in growing and dividing cells, an important question is how these oscillators are perturbed by the cell cycle. In previous work we showed that the periodic doubling of the gene copy numbers due to DNA replication can couple not only natural, circadian oscillators to the cell cycle (Paijmans et al., PNAS, 113, 4063, (2016)), but also these synthetic oscillators. Here we expand this study. We find that the strength of the locking between oscillators depends not only on the positions of the genes on the chromosome, but also on the noise in the timing of gene replication: noise tends to weaken the coupling. Yet, even in the limit of high levels of noise in the replication times of the genes, both synthetic oscillators show clear signatures of locking to the cell cycle. This work enhances our understanding of the design of robust biological oscillators inside growing and diving cells.
I Introduction
Synthetic biology strives to implement new functions in living cells, and to develop a deeper understanding of biological design principles, using a modular rational design of biochemical reaction networks Elowitz2000 ; Collins2000 ; Becskei2000 . As synthetic biology becomes more mature, the goal is to design robust, stable and tunable networks Andrianantoandro2006 ; Tigges2009 ; Nandagopal2011 ; Sowa2015 , which are resilient to the effects of intrinsic noise and stochastic gene expression Elowitz2002a ; Elowitz2002 ; Rosenfeld2005 ; Cai2006 ; Chabot2007 . In oscillators, enhanced robustness has been achieved via the design of the reaction network at the single cell level Stricker2008 ; Tsai2008 ; Novak2008 ; Mather2009 ; Woods2016 ; Potvin-Trottier2016 , and by connecting multiple cells through quorum sensing Garcia-Ojalvo2004 ; Mondragon-Palomino2011 ; Prindle2014 . These analyses, however, have generally ignored a potentially major source of perturbation to synthetic oscillators: The periodic gene replication and cell division that occur in any growing cell Feillet2014 ; Bieler2014 . Cell division introduces noise due to the binomial partitioning of the proteins Kang2008 ; Gonze2013 . Moreover, we recently showed that circadian oscillators can lock to the cell cycle via the periodic discrete gene duplication events arising from DNA replication during the cell cycle Paijmans2016 . Here we study in detail how two synthetic oscillators are affected by the cell cycle, and especially by these discrete replication events.
The mechanism by which cellular oscillators can couple to the cell cycle is generic and pertains to any biochemical oscillator in growing and dividing cells. Since the genes need to be replicated during the cell cycle, and because the transcription rate is often proportional to the gene copy number in a cell Rosenfeld2005 ; Walker2016 , the cell cycle can cause a periodic doubling in the transcription rate of the clock related genes. While the mechanism of coupling is generic, it is best understood in the context of an oscillator consisting of one clock protein, which is a transcription factor that negatively autoregulates the expression of its own gene Paijmans2016 . The periodic doubling of the gene copy number due to DNA replication leads to a periodic doubling of the gene density. This means that the synthesis rate of the clock protein depends on the phase of the clock with respect to that of the cell cycle: if the gene is expressed when its gene density is maximal, then the amplitude of the protein concentration will be maximal too. This increases the amplitude of the oscillation, and since the subsequent decay of the protein concentration does not depend on the gene density, the rise in amplitude will increase the period of the oscillation. The period of the oscillation thus depends on the phase of the oscillator with respect to that of the cell cycle, and this allows, as for any nonlinear oscillator, the cell cycle to strongly influence the synthetic oscillator Pikovsky2003 .
The two synthetic oscillators that we study are the repressilator, developed by Elowitz and Leibler Elowitz2000 , and the dual-feedback oscillator, developed by Stricker and coworkers Stricker2008 . Both oscillators have been reconstructed in E. coli. In our previous work, we showed by mathematical modeling that both oscillators can lock to the cell cycle Paijmans2016 . Also the authors of Dies2015 found, independently, by combining modeling with experiments, that the dual-feedback oscillator can be entrained by the cell cycle. Here we study how the coupling strength depends on the noise in gene replication, and, following earlier work Paijmans2016 , on the positions of the genes on the DNA. We modify the original computational models of the repressilator and dual-feedback oscillator, to include the periodic doubling of the mRNA production rate with the cell cycle. We consider the scenario that the synthetic oscillators are incorporated into the chromosome, although we will also discuss the fact that in the experiments the oscillators are implemented on plasmids present at high copy number Elowitz2000 ; Stricker2008 . Under typical slow growth conditions, E. coli has one chromosome at the beginning of the cell cycle, in which case the gene copy number goes from 1 to 2 over the course of the cell cycle. At high growth rates, corresponding to cell division times shorter than the replication time of the DNA (on the order of 40 minutes), the chromosome can have multiple replication forks, which means that the gene copy number can be larger. Here, we only consider the regime that the cell division time is on the order of the DNA replication time or longer, such that the gene copy number rises from at the beginning of the cell cycle to at the end. To quantify the sensitivity of the network to the cell cycle, we investigate the effect on the peak-to-peak time in the protein concentrations related to the oscillator, for different periods of the cell cycle.
Unlike the Kai circadian clock, these two genetic oscillators comprise more than one operon that shows significant time variation in its expression. This introduces new important timescales to the problem: If the genes pertaining to the oscillator are placed at a distance on the chromosome, there is a time delay between when they are replicated. The synthetic oscillators studied here have an intrinsic period that is on the order of hours Elowitz2000 ; Stricker2008 , which is similar to the timescale of DNA replication, which takes at least 40 minutes. Consequently, the time delay can, depending on the reaction network, have a strong effect on the period of the oscillations.
Both synthetic oscillators can lock to the cell cycle for a wide range of cell division times, but, as we reported in our earlier work Paijmans2016 , the effect critically depends on the positioning of the genes on the chromosome: Where the repressilator almost shows no locking when the genes are placed adjacently, the dual-feedback oscillator, to the contrary, experiences the strongest effect in this case, and locking decreases as the genes are placed further apart.
The pronounced effect of varying the delay between replication of different genes suggests that synthetic oscillators should also be sensitive to stochastic variation in replication times. Our major goal here is thus to understand how such variation contributes to noise in the period of cellular oscillators. The noise in the replication time is the result of two stochastic processes: The timing of initiation of DNA replication and the progression of DNA replication. Stochasticity in the initiation of replication has the same effect on all the genes on the chromosome; a fluctuation in the initiation time propagates to the replication times of all the genes, leaving the interval between the gene replication times unchanged. In contrast, stochasticity in replication progression introduces temporal fluctuations in the time between the replication of different genes.
Our simulation results show that, for physiological levels for the noise in the gene replication times, the effect of gene replications on the period of the oscillations are strongly attenuated. However, clear signatures of the cell cycle are observable, especially around the 1:1 locking region. We then address the question which noise source has the strongest effect on attenuating the effects of the cell cycle: Initiation or progression of DNA replication. To find out, we study the effects of the cell cycle in two different scenarios: Either there is noise in the initiation of replication, such that the timing between replicating different genes is fixed, or the noise is limited to the progression of replication such that the initiation time is fixed and the timing between genes is stochastic. Our results reveal that noise in the initiation of DNA replication reduces the effect of locking much more than noise in DNA replication progression. This is because at biologically relevant noise levels, the standard deviation in the initiation of DNA replication is much larger than that in the progression of replication. Nevertheless, even with high levels of noise in the initiation of DNA replication, the effects of locking are still clearly present for cell division times around the oscillator’s period. Our results thus predict that synthetic oscillators will be perturbed by the cell cycle in growing and dividing cells, when the oscillators are implemented on the chromosome.
Below, we first give an overview of the models for the repressilator, the dual-feedback oscillator and the models for the cell cycle. First we give a description of a completely deterministic cell cycle, and then introduce stochasticity in the model by making the time DNA replication is initiated and the time it takes to replicate the DNA stochastic variables. To determine how strong the oscillators are coupled to the cell cycle, we study how the period of the oscillators scales with the cell division time.
II Theory
To study the effect of the cell cycle on synthetic oscillators, we will use the ODE models of the repressilator Elowitz2000 and dual-feedback oscillator Stricker2008 , as described in these papers. As we argue in more detail in Paijmans2016 , the key quantity connecting the cell cycle and the oscillator is the gene density, , i.e. the gene copy number per unit cell volume. Because the protein production rate is proportional to the gene copy number, discrete gene replication events cause sudden doubling of the production rate (at least in prokaryotes Walker2016 ; Barziv2016 ). We include the effects of the discrete gene replication events by making the mRNA productions rate due to transcription of each gene proportional to the gene density Paijmans2016 . Here is the gene copy number of gene which switches from 1 to 2 during the cell cycle, and is the cell volume which exponentially doubles in size during a cell division time .
II.1 Repressilator
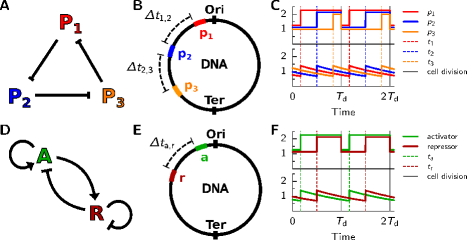
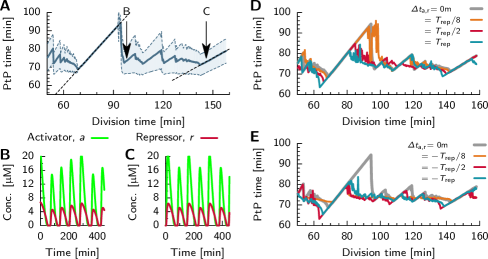
The repressilator consists of three genes, which sequentially repress each other’s expression. As schematically shown in Fig. 1A, the first gene represses the expression of the second, which represses the third gene, which in turn represses the expression of the first again Elowitz2000 . To take into account gene replication, the expression of mRNA is proportional to the gene density
| (1) | |||||
Here, and are the concentrations of mRNA and proteins (), respectively, both rescaled with the constant of half-maximum repression . The transcription rate is assumed to be proportional to the instantaneous gene density ; importantly, the gene density can differ between the three genes when they are positioned differently on the chromosome, see Fig. 1, panels B and C. is the time-averaged gene density, which depends on the phase of the cell cycle at which the gene is duplicated. The mRNA expression has a basal rate and an enhanced rate , which is repressed by protein , where is mod 3, with a Hill coefficient ; here, following the original paper Elowitz2000 , time is rescaled in units of the mRNA lifetime and protein concentrations are in units of the concentration necessary for half-maximal repression. In the second equation, is the protein decay rate over the mRNA decay rate and is the translation efficiency, i.e. the average number of proteins produced per mRNA molecule. We used the parameters given in Table 1.
| Parameter | Value | Definition and motivation |
|---|---|---|
| 0.2 | Fraction of when replication starts Wallden2016 . | |
| 40 min | Mean DNA replication time in E. coli. | |
| / | 0,,, | Time between gene replications (repressilator) |
| / | 0,,,1 | Time between gene replications (dual-feedback) |
| 0.35 | SD in DNA replication progression Adiciptaningrum2015 . | |
| 0.20 | SD in initiation of DNA replication Adiciptaningrum2015 . | |
| arab | 0.70% | Arabinose level in dual-feedback oscillator. |
| IPTG | 2nM | IPTG concentration in dual-feedback oscillator. |
II.2 Dual-feedback oscillator
The dual-feedback oscillator, schematically shown in Fig. 1D, consists of two genes, one coding for an activator and one for a repressor Stricker2008 . The activator enhances the expression of both genes, while the repressor represses the expression of both genes. Since the genes have identical promoters, the temporal expression of the two proteins is similar. The model we employ is presented in the SI of Stricker2008 , but to take into account the periodic variations in the gene density, we have modified the equations describing the transcription of mRNA of the activator and repressor
| (2) | |||
Here denotes the promoter of the (a)ctivator/(r)epressor gene, with activator protein and repressor protein bound to it, respectively. The mRNA of the activator () and repressor () is transcribed with a rate , which depends on the state of the promoter and on the gene density . Parameters are given in Table 1. Genes can be placed at a distance from each other on the chromosome, as shown in Fig. 1E and F, which introduces a delay between when they are replicated. The intrinsic period of this oscillator without the driving by the gene density is minutes and we want to study the behavior of the oscillator in a wide window of cell division times around this period. Because in our model of the cell cycle always needs to be longer than the DNA replication time of 40 minutes, it is convenient to study the dual-feedback oscillator with an intrinsic period that is longer than the current 40 minutes. To obtain a longer clock period, we use the experimental observation in Stricker2008 that the clock period scales with temperature via the Arrhenius law. To this end, we scale all rate constants, , in the model, using
| (3) |
where is the rate constant at the reference temperature of 310K and K is a constant. We will evaluate the model at a temperature of 303K where the clock has an intrinsic period of about 73 minutes.
II.3 Cell cycle model
The time at which a gene is replicated depends on the timing of two major events, which divide the cell cycle into three distinct intervals: The time between the start of the cell cycle and initiation of DNA replication, the replication time of the chromosome and, after this has finished, the time until cell division. As we argued in Paijmans2016 , cell division has a smaller effect on the oscillator as compared to gene replication, as both the cell volume and the gene copy number divide by two at cell division, leaving the important gene density unchanged. Therefore, in our model we assume there is no stochasticity in the division time , which we keep fixed. Furthermore, we assume that the E. coli cells grow slowly, such that the division time is always longer than the DNA replication time. In this case, there are at most two origins of replication per cell, and we do not have to take into account the effects of multiple replication forks Cooper1968 .
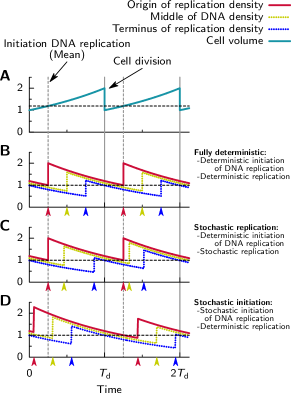
Because it is still poorly understood how the cell coordinates the replication and division cycles, in this work we employ a simple model for the cell cycle. Evidence emerges that initiation of chromosome replication is triggered at a fixed density of the origin of replication (Ori), , independent of cell’s division time Donachie1968 ; Wallden2016 . Given that the density of the Ori depends on the cell volume , , the time and precision of initiation of DNA replication is set by the evolution of the cell volume and the precision of the sensor for . Because we consider the slow growth regime where at the beginning of the cell cycle there is only one origin of replication, and because we assume that the initial volume is independent of the growth rate, it follows that the average time at which DNA replication is initiated is at a fixed fraction of the division time , , with a standard deviation . We choose, based on data presented in Wallden2016 , . The time it takes to replicate the chromosome depends on the speed of the DNA polymerase, which in turn can depend on the cell’s physiological state Adiciptaningrum2015 . For simplicity, we assume that the mean time to replicate the whole chromosome is minutes with a standard deviation given by , both independent of the cell’s division time. In this work we consider two models for the timing of gene replications: One where both the initiation and the progression of DNA replication are deterministic, such that gene replications occur at the same phase each cell cycle and one where we introduce noise in these two processes. The effects of noise in the initiation and progression of DNA replication on the gene replication times is illustrated in Fig. 2.
II.3.1 Deterministic model
The first model is completely deterministic. Indeed, when we assume the evolution of the cell volume, , to be deterministic and that DNA replication initiates exactly when , then the evolution of becomes fully deterministic. Clearly, since both the initiation and the progression of DNA replication are deterministic, the respective genes are copied at the same times each cell cycle (See Fig. 2A and B). Furthermore, in our model the first gene of the oscillator is next to the origin of replication, such that the time this gene is replicated, . Note that it is not important when exactly during the cell cycle the gene is replicated, as it only changes the gene density by a prefactor, which we compensate for by normalizing by its mean . However, as we will see, the time between the replication of the different genes is important. Genes can be placed apart on the DNA which introduces a time delay, , between when the genes and are copied, respectively. The times during the cell cycle when the genes and are replicated, for the repressilator, and the activator and repressor genes for the dual-feedback oscillator, are
| (4) | ||||||
II.3.2 Stochastic model: Noise in the initiation and progression of DNA replication
For the second model, we again assume that the evolution of the cell volume is deterministic, but turn replication progression and replication initiation into stochastic processes. Due to stochasticity in the progression of DNA replication, the time interval between the gene replication events becomes stochastic, as illustrated in Fig. 2C. We assume the time it takes to replicate the full chromosome follows a Gaussian distribution with a mean =40 min, and standard deviation that is proportional to replication time . When the standard deviation in the DNA replication time is the result of many independent stochastic steps, the time between replicating genes and , , which on average takes a time , will therefore also be Gaussian distributed with a standard deviation of .
Stochasticity in the initiation of replication affects the replication times of all genes equally; indeed, the time between copying two different genes, , is constant, as is shown in Fig. 2D. This stochasticity in the timing of the initiation can come from the sensing limit of measuring , or because of stochasticity in the evolution of the cell volume (which, however, we assume to progress deterministically in this scenario). In our model, the time of initiation of DNA replication, , is a stochastic variable drawn from a Gaussian probability distribution with a mean with a standard deviation . Assuming the standard deviation in measuring , , is small, the standard deviation in the initiation time is
| (5) |
DNA replication is initiated when , where is the cell volume after cell division. Solving this equation for the initiation time gives . Then, from Eq. 5 it follows that the standard deviation in the initiation time is . Therefore, in our model, the standard deviation in the initiation time is proportional to .
Assuming that the two stochastic processes are independent, the replication times of the genes for the repressilator and dual-feedback oscillator become, respectively
| (6) | ||||||
Because in our model, the division time is fixed each cell cycle, we have to constrain the values of the replication times to lie within the finite interval . First we choose , and constrain it to lie within . Then we draw a value for and constrain it to lie within the interval that is symmetric around its mean value , . Similarly, we draw a value for constrained to the interval . For the dual-feedback oscillator, the times are constrained to the interval . We map values that lie outside these intervals back on it by mirroring these values across the nearest boundary of the domain.
Recent single cell experiments revealed the coefficient of variation (CV) in the time of initiation of DNA replication, , and in the time of replicating the DNA, , in slow growing E. coli cells Adiciptaningrum2015 . Given our models for stochasticity in replication times (including the fact that the initiation times are constrained to lie in the windows discussed above), we find that standard deviations of and give similar coefficients of variation. All parameters are listed in Table 1.
III Results
Here we study how the peak-to-peak times of the oscillations of the repressilator and the dual-feedback oscillator depend on the cell division time. Furthermore, we illuminate the effects of the position of the genes on the DNA and the role of stochasticity in the replication times. Preliminary work on the effect of gene positioning was reported in the Supporting Information of Paijmans2016 .
III.1 Repressilator
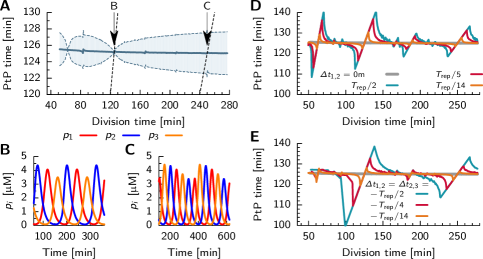
We first consider the scenario in which the three genes are close together on the chromosome, such that, to a good approximation, they are replicated at the same time, and the timing of DNA replication is fixed. In Fig. 3, panel A, we show the mean peak-to-peak time, , in the concentration of , for different cell division times, . Clearly, locking is not very strong: The locking regions—the range of cell division times where the mean peak-to-peak time of the repressilator is equal to a multiple of —are very small. The only effect of locking is that in these very small windows the variance in the peak-to-peak time is strongly reduced. The reason why locking is weak is that while the genes are replicated at the same time, they are expressed at different times. This means that gene replication has a different effect on the expression level of each of the three genes. Hence, even when the cell cycle period is approximately equal to the the oscillator’s intrinsic period , , the oscillation of each protein concentration has a different amplitude, as shown in Fig. 3B. This makes it harder for all three protein oscillations to get the same period as that of the cell cycle, and become locked to it. Interestingly, Fig. 3C shows that when the cell-cycle time is twice the intrinsic clock period, the pattern of alternating smaller and larger oscillation amplitudes can still be observed for each of the respective protein concentration profiles. This observation can be used to detect the effect of periodic gene replication experimentally.
We now consider a scenario in which the different genes are replicated at different times during the cell cycle, which corresponds to a situation where the genes are located at different positions on the chromosome. We assume that the gene for protein is close to the origin of replication, such that it is copied at the moment DNA replication is initiated. We consider two scenarios for the order of the genes on the DNA. In the first scenario, panel D, genes are placed on the DNA in order of their interaction in the biochemical reaction network, (see Fig. 1A): The gene for is copied a time after , and a time after . In the second scenario, panel E, genes are in order of maximal expression: (see Fig. 3,B and C), which corresponds to negative values of and . Throughout this work, we will use the condition . Interestingly, while the locking regions are very small when the genes are replicated at the same time (, panel A, gray lines in panels D and E), replicating them at different times introduces marked locking: both for (panel D) and (panel E) strong locking is observed. Even more strikingly, the 1:1 locking region is largest when genes are replicated in order of maximal expression, and when the distance between them is the largest (panel E). This can be understood by noting that when genes are replicated in the order of maximal expression, shifting the phase of the clock with respect to that of the cell cycle has then the strongest effect on the amplitude and hence the period of the clock oscillations, which underlies the phenomenon of locking, as explained in Paijmans2016 .
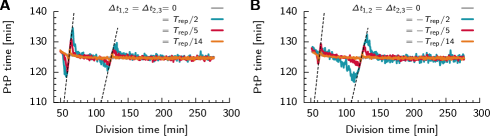
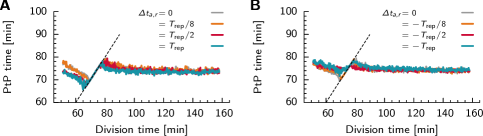
To see if locking persists in the presence of physiologically levels of noise in gene replication times, we change the gene replication times and into stochastic variables via Eq. 6. Our results reveal that both when (Fig. 4, panel A) and when (panel B), the coupling of the repressilator to the cell cycle is strongly attenuated. However, the effects of the cell cycle are still clearly observable around the 1:1 locking region and when . For division times longer than the oscillators intrinsic period, all signatures of locking have disappeared.
III.2 Dual-feedback oscillator
Fig. 5A shows strong locking of the dual-feedback oscillator to the cell cycle. We assume here that the genes are located next to each other on the chromosome, so that their time-varying gene-densities are the same. Clearly, the widths of the locking regions are very large; they are even larger than those observed for our simple negative feedback oscillator studied in Paijmans2016 . In Fig. 5B we show a time trace of the irregular oscillations around a cell-division time of minutes. Fig. 5C shows that the amplitude of the oscillations alternates between a high and a low value when the cell-division time is about twice the intrinsic clock period of minutes, due to periodic gene replication every other clock period. We thus conclude that also the dual-feedback oscillator can strongly lock to the cell cycle and that this effect should be observable experimentally.
Fig. 5D,E shows the result of varying the moment of gene replication for the two genes. Again, in this model, the first gene of the oscillator is placed next to the origin of replication such that it is replicated at initiation of DNA replication, and the second gene is replicated with a mean delay later. For positive , the activator is replicated before the repressor, and negative , vice versa. We vary the time delay between the replication of the two genes, as and (panel D) and minus these values (panel E), where is the mean replication time of the DNA. It is seen that in both scenarios the strength of locking decreases with increasing the distance between the genes on the DNA: The strongest entrainment is observed when the genes are replicated at the same time during the cell cycle (gray lines), in stark contrast to the behavior of the repressilator. While in the repressilator the locking increases with the distance between the genes, the dual-feedback oscillator shows the opposite behavior. Interestingly, though, in the dual-feedback oscillator locking still persists when the genes are placed at maximum distance from each other.
To see if locking persists in the presence of noise in the timing of gene replications, we changed the time of replication of both genes, and , into stochastic variables via Eq. 6. The noise strongly attenuates the effects of the cell cycle, both for positive (Fig. 6 panel A) and negative (panel B) , as compared against deterministic result of Fig. 5. However, the peak-to-peak times of the dual-feedback oscillator are still perturbed around the 1:1 locking region, especially in the case .
III.3 What attenuates the effects of the cell cycle more: Stochasticity in the initiation or progression of DNA replication?
Comparing Fig. 3 with Fig. 4 for the repressilator and Fig. 5 with Fig. 6 for the dual-feedback oscillator, it is clear that noise in gene replication times has a significant effect on the coupling between the cell cycle and these synthetic oscillators. In our model, noise in the replication times is the result of noise in the initiation and in the progression of DNA replication. We want to know which of these two sources of stochasticity is key for reducing the coupling between the cell cycle and the oscillator.
To find out whether the initiation or the progression of DNA replication is more important for attenuating the effects of gene replications, we studied two models for the noise in the replication times. Either there is only noise in the progression of replication, such that the time intervals between replicating different genes, and , are stochastic variables but the time of initiation of DNA replication is deterministic, (See Fig. 2C). Or, the initiation of DNA replication, , is stochastic but the progression of replication is deterministic such that and are fixed each cell cycle (See Fig. 2D). We will use the same values for the standard deviations and of the two noise sources as before.
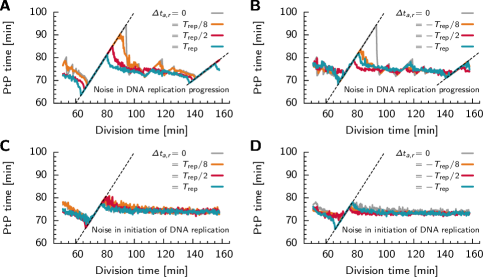
In Fig. 7 we show the effects of the cell cycle on the period of the repressilator when there is only noise in the progression of replication, panels A and B, or when there is only noise in the initiation of DNA replication, panels C and D. Clearly, when there is only noise from replication progression, both for positive (panel A) and negative (panel B) , the width of the locking regions are almost the same as compared to the deterministic case (See Fig. 3, panels D and E). The effects of the cell cycle are not significantly attenuated by the noise in DNA replication progression. However, when the noise is due to the initiation of replication (panels C and D for positive and negative , respectively), all signatures of coupling disappear for , and the width of the 1:1 locking region is strongly reduced compared to the case of a deterministic cell cycle. We conclude that the decrease in locking to the cell cycle is predominantly due to the stochasticity in the initiation time of DNA replication.
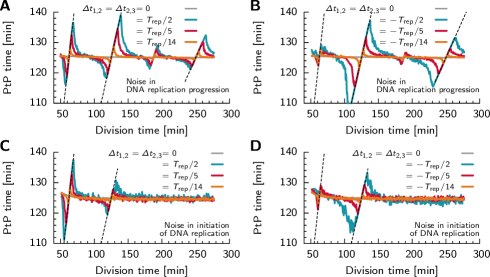
For the dual-feedback oscillator we obtain similar results. In Fig. 8 we show the effects of the cell cycle on the period of the dual-feedback oscillator when there is only noise in the progression of replication, panels A and B, or when there is only noise in the initiation of DNA replication, panels C and D. When there is only noise due to the progression of DNA replication, both for positive (panel A) and negative (panel B) , strong signatures of locking persists, especially around and . Again, stochasticity in DNA replication progression does not attenuate the coupling to the cell cycle much. When the source of noise is due to stochasticity in the initiation of DNA replication, almost all effects of the cell cycle on the peak-to-peak time of the dual-feedback oscillator have disappeared; only when locking can still be observed. Clearly, also for the dual-feedback oscillator the initiation of DNA replication has the biggest effect on the coupling between the cell cycle and the oscillator.
We observe that, both for the repressilator and the dual-feedback oscillator, the initiation of DNA replication is dominant in attenuating the effects of the cell cycle. Why is this the case? An oscillator couples to the cell cycle by maintaining a specific phase relation between the phase of the oscillator and that of the gene density, as explained in Paijmans2016 . When the standard deviation in the replication times is of the same order as the intrinsic period of the oscillator, it becomes impossible to maintain this phase relation, and the oscillator can not couple to the cell cycle. Because in our model, the standard deviation in the initiation of replication is proportional to , while the standard deviation in replication progression is constant, initiation of DNA replication will be the dominant source of noise when . Indeed, for , the stochasticity in the initiation of DNA replication will be so large, that the clock no longer couples to the cell cycle (See Fig. 4 and Fig. 6). For , the stochasticity in the initiation of DNA replication is much smaller. Moreover, the noise in DNA replication progression is so small that the coupling of the clock to the cell cycle is not much weakened by it (See Fig. 7A,B and Fig. 8A,B). This explains why for , noise in DNA replication does not appreciably attenuate the locking of the clock to the cell cycle.
IV Discussion
Discrete gene replication events, present in all cells, can have marked effects on the period of circadian clocks Paijmans2016 . We wanted to know how gene replications affect the robustness of two renowned synthetic oscillators build in E. coli: The repressilator by Elowitz et. al. Elowitz2000 and the dual feedback oscillator by Stricker et. al Stricker2008 . Using computational modeling, we show how the peak-to-peak time of the oscillators depend on the cell division time, the position of the genes on the DNA and the noise in the gene replication times.
We find that both synthetic oscillators can strongly lock to the cell cycle, where the oscillator’s peak-to-peak time is equal to a multiple of the cell division time, over a wide range of division times. Remarkably, the effect strongly depends on how the genes of the oscillator are located on the chromosome. The distance between the genes introduces a temporal delay between the moments at which the different genes of the oscillators are replicated, which affects the period of the oscillations. Increasing the distance between genes has an opposite effect on the two oscillators: Whereas the repressilator exhibits almost no locking when the genes are positioned close together yet strong coupling over a wide range of when the temporal delay is increased, the dual-feedback oscillator shows the strongest coupling to the cell cycle at negligible temporal delay between gene replications. For both models, the signature of the gene replication events should be clearly visible in the amplitude of the time traces of the protein concentrations.
It is well known that the timing of key events during the cell cycle, such as the start of DNA replication, the duration of chromosome replication and cell division, exhibit high levels of stochasticity Koppes1980 ; Michelsen2003 , which will propagate to the replication times of the oscillator’s genes. To investigate how strong noise in the timing of gene replication affects the oscillator’s coupling to the cell cycle, we introduced two noise sources in our model of the cell cycle: one in the time of when DNA replication is initiated and one in the time it takes to replicate the chromosome. Using physiologically relevant values for the standard deviations in the timing, we found that noise in gene replication times strongly attenuates the effects of the cell cycle. However, observable signatures of locking remain for division times equal and shorter than the oscillator’s intrinsic period. For these cells, the standard deviation in gene replication times becomes smaller than the oscillator’s intrinsic period, making it possible for the clock to lock to a certain phase of the gene density, which sets the peak-to-peak time. We then asked which of these two sources is more important in attenuating the coupling between the cell cycle and the oscillator. To this end, we made two models for stochasticity in the replication times: One with only noise in replication progression and the other with only noise in the time of replication initiation. We found that noise in the initiation of DNA replication has a stronger effect than that in the progression of DNA replication. The reason is that, at physiologically motivated values, the standard deviation in the time of replication initiation is much larger than the standard deviation in the time of replicating the chromosome. We thus conclude that the initiation of DNA replication is mainly responsible for attenuating the effects of the gene replications on the repressilator and dual-feedback oscillator.
Throughout this work, we assume the genes reside on the bacterial chromosome. Importantly, however, the synthetic oscillators were originally constructed on plasmids, which are often present in large copy numbers ranging from 10-100. Moreover, experiments indicate that these plasmids are copied at random times during the major part of the cell cycle Bogan2001 . Based on our observation that multiple chromosome copies that are replicated asynchronously strongly reduce the strength of locking Paijmans2016 , we expect that, at these high plasmid copy numbers, the synthetic oscillators exhibit no clear signatures of locking. Indeed, the original study on the dual-feedback oscillator does not report any effects from the cell cycle, even when the growth rate is comparable to the oscillator’s intrinsic period where locking is expected to occur Stricker2008 . Remarkably, however, signatures of locking were observed for the dual-feedback oscillator in the experiments of Dies2015 , even though also in these experiments the genes reside on plasmids Dies2015 . It is hard to explain what underlies the effect of the cell cycle in these experiments Dies2015 . In any case, our analysis predicts that the effects will be much stronger when the genes are put on the chromosome. Conversely, in order to prevent locking, it seems beneficial to construct the oscillator on high copy number plasmids.
The genes of biological oscillators such as circadian clocks do reside on the chromosome, and the periods of these oscillators are often unaffected by the cell cycle Mori2001 . One approach to understand how these natural clocks are so resilient to perturbations from the cell cycle is to construct synthetic oscillators in growing and dividing cells. The dual-feedback oscillator studied in this work, based on a coupled positive and negative feedback architecture regulating gene expression, has been predicted to produce robust oscillations Tsai2008 ; Woods2016 : The amplitude and period do not critically depend on specific parameter values, and oscillations persist in a wide range of temperatures and growth media Stricker2008 ; Prindle2014 . However, these models do not take the effect of gene replications into account, and in the experiments the genes reside on high copy-number plasmids, potentially abolishing any effect of the cell cycle. Our results suggest that the relatively simple design of the dual-feedback oscillator implemented on the chromosome might not be very robust in growing and dividing cells, since its period scales with that of the cell cycle. Clearly, to test the predictions of our analysis, it would be of interest to implement this oscillator on the chromosome, which is now increasingly being done in synthetic biology Sowa2015 . Comparing the unstable synthetic oscillators with their evolved stable counterparts found in, e.g. S. elongatus and N. crassa, could elucidate why the latter feature a remarkably more complex reaction network, including, for example, post-translational modification of the proteins Paijmans2016 ; Hurley2016 .
V Methods
Both the models of the repressilator and dual-feedback oscillator are described with ordinary differential equations, and propagated using Mathematica 8 (Wolfram Research). For each value of , we generate a single time trace of about 200 oscillations for the repressilator and 100 oscillations for the dual-feedback oscillator. In order to allow the oscillations to settle down to a steady state, we discard the first 10 oscillations in the system.
To simulate the (stochastic) gene replication events, for each gene in the model, we generate a list of replication times, , using Eqs. 4-6. The gene copy number for this gene, , equals 1 when , and 2 when , modulo . The discrete gene replication events enter the models via the gene density, , where is the cell volume Paijmans2016 .
To find the peak-to-peak times, , in the ODE simulations (including those with noise in the gene replication times), we use the built-in methods of Mathematica to return all local extrema in the concentration of (repressilator) or the activator (dual-feedback oscillator). These extrema correspond to the time points where the concentration is higher, in the case of a maximum, or lower, in the case of a minimum, than its two immediate neighbors. As is standard for numerical solution of differential equations, the spacing between successive time points is determined adaptively by the algorithm to meet imposed precision bounds but never exceeded 0.2 h. We then checked if a given local minimum is the lowest point within an interval of 3/4 the oscillator’s intrinsic period, , centered on the minimum; if so, we define this point as the global minimum of a single oscillation cycle. If there exist a local extremum with a lower value, we repeated this procedure around the lower point until we found a point which was the lowest within a time interval of . The same procedure is used for finding the local maxima of the oscillations. The peak-to-peak time is then calculated by subtracting the times of two consecutive minima; we verified that subtracting the times of two consecutive maxima gave essentially the same results.
Acknowledgements.
We thank Giulia Malaguti for a critical reading of the manuscript. This work is part of the research programme of the Netherlands Organisation for Scientific Research (NWO). (JP and PRtW), and by NSF Grant DMR-1056456 (DKL).References
- (1) M. B. Elowitz and S. Leibler, Nature 403, 335 (2000).
- (2) J. J. Collins, T. S. Gardner, and C. R. Cantor, Nature 403, 339 (2000).
- (3) a. Becskei and L. Serrano, Nature 405, 590 (2000).
- (4) A. Ernesto, S. Basu, D. K. Karig, and R. Weiss, Mol Syst Biol 2, 1 (2006).
- (5) M. Tigges, T. T. Marquez-Lago, J. Stelling, and M. Fussenegger, Nature 457, 309 (2009).
- (6) N. Nandagopal and M. B. Elowitz, Science 333, 1244 (2011).
- (7) S. W. Sowa, G. Gelderman, and L. M. Contreras, Curr Opin Biotechnol 36, 161 (2015).
- (8) M. B. Elowitz, W. Hsing, and S. Leibler, Science 296, 1466 (2002).
- (9) M. B. Elowitz, A. J. Levine, and E. D. Siggia, Science 297, 1183 (2002).
- (10) N. Rosenfeld et al., Science 307, 1962 (2005).
- (11) L. Cai, N. Friedman, and X. S. Xie, Nature 440, 358 (2006).
- (12) J. R. Chabot, J. M. Pedraza, P. Luitel, and A. van Oudenaarden, Nature 450, 1249 (2007).
- (13) J. Stricker et al., Nature 456, 516 (2008).
- (14) T. Y.-C. Tsai et al., Science 321, 126 (2008).
- (15) B. Novak and J. J. Tyson, Nat Rev Mol Cell Biol 9, 981 (2008).
- (16) W. Mather, M. R. Bennett, J. Hasty, and L. S. Tsimring, Phys Rev Lett 068105, 1 (2009).
- (17) M. L. Woods, M. Leon, R. Perez-Carrasco, and C. P. Barnes, ACS Synth Biol 5, 459 (2016).
- (18) L. Potvin-Trottier, N. D. Lord, G. Vinnicombe, and J. Paulsson, Nature 538, 514 (2016).
- (19) J. Garcia-Ojalvo, M. B. Elowitz, and S. H. Strogatz, Proc Natl Acad Sci 101, 10955 (2004).
- (20) O. Mondragón-Palomino et al., Science 333, 1315 (2011).
- (21) A. Prindle et al., Nature 508, 387 (2014).
- (22) C. Feillet et al., Proc Natl Acad Sci 111, 9828 (2014).
- (23) J. Bieler et al., Mol Syst Biol 10, 739 (2014).
- (24) B. Kang et al., PLoS Comput Biol 4, e1000019 (2008).
- (25) D. Gonze, J Theor Biol 325, 22 (2013).
- (26) J. Paijmans, M. Bosman, P. R. ten Wolde, and D. K. Lubensky, Proc Natl Acad Sci 113, 4063 (2016).
- (27) N. Walker, P. Nghe, and S. J. Tans, BMC Biol 14, 11 (2016).
- (28) A. Pikovsky, M. Rosenblum, and J. Kurths, Synchronisation: A universal concept in nonlinear sciences (Cambridge University Press, Cambridge, 2003).
- (29) M. Dies, L. Galera-Laporta, and J. Garcia-Ojalvo, Integr Biol (2015).
- (30) R. Bar-Ziv, Y. Voicheck, and N. Barkai, Trends Gen 32, 717 (2016).
- (31) M. Wallden et al., Cell 166, 729 (2016).
- (32) A. Adiciptaningrum et al., Sci Rep 5, 18261 (2015).
- (33) S. Cooper and C. E. Helmstetter, J Mol Biol 31, 519 (1968).
- (34) W. Donachie, Nature 219, 1077 (1968).
- (35) L. J. H. Koppes et al., J Bacteriol 143, 1241 (1980).
- (36) O. Michelsen, M. J. Teixeira de, P. R. Jensen, and F. G. Hansen, Microbiology 149, 1001 (2003).
- (37) J. A. Bogan et al., Plasmid 45, 200 (2001).
- (38) T. Mori and C. H. Johnson, J Bacteriol 183, 2439 (2001).
- (39) J. M. Hurley, J. J. Loros, and J. C. Dunlap, Trends Biochem Sci 41, 834 (2016).