Optical and Near-IR study of nova V2676 Oph 2012
Abstract
We present optical spectrophotometric and near-infrared (NIR) photometric observations of the nova V2676 Oph covering the period from 2012 March 29 through 2015 May 8. The optical spectra and photometry of the nova have been taken from SMARTS and Asiago; the near-infrared photometry was obtained from SMARTS and Mt. Abu. The spectra are dominated by strong H i lines from the Balmer series, Fe ii, N i and [O i] lines in the initial days, typical of an Fe ii type nova. The measured FWHM for the H and H lines was 800-1200 km s-1. There was pronounced dust formation starting 90 days after the outburst. The color was the largest among recent dust forming novae.
1 Introduction
The classical novae are interacting binary star systems containing a Roche-lobe filling secondary, on or near the main sequence, which is losing hydrogen-rich material through the inner Lagrangian point to the degenerate white dwarf primary. The mass transfer results in the formation of an accretion disc around the white dwarf. The runway thermonuclear reactions on the white dwarf surface give rise to the thermonuclear outburst, the sudden brightening seen in these systems.
Nova V2676 Oph (Nova Oph 2012) was discovered on 2012 March 25.789 UT (which we define as t=0) by Hideo Nishimura on three 13s unfiltered CCD frames with limiting magnitude 13.5 at = 12.1 (Nishimura et al. 2012). A low resolution optical spectrum obtained on March 27.74 UT with the 1.3m Arakai telescope at Koyama Astronomical Observatory (Arai & Isogai 2012) showed H, H, and O i lines having prominent P-Cygni profiles. The FWHM of the emission component of H was about 600 km s-1. They suggested that the object is an Fe ii-type classical nova. Another low-resolution spectrum taken by Imamura (2012) at similar time on March 27.836 UT showed prominent emission lines of H, H and Fe ii which confirmed that the nova was of Fe ii class.
The near-IR observations taken between March 28-30 UT also showed that the spectra are typically of a Fe ii class nova having prominent H i emission lines of Pa, Pa and Br, Fe ii and other Brackett-series lines (Rudy et al. 2012a). The other prominent features seen were C i, O i, N i and Ca ii infrared triplet. Rudy et al. (2012b) reported the fundamental, first and second overtone bands of CO in emission on 2012 May 1 and 2 and suggested a strong possibility of dust formation in the nova ejecta.
In this paper we present optical and NIR observations of V2676 Oph. The outline of the paper is as follows: Section 2 describes the observations and data analysis techniques. The results obtained from these observations are discussed in Section 3 and the summary is given in Section 4.
2 Observations
2.1 Near-infrared observations
Near-IR observations were obtained using the 1.2m telescope of Mt.Abu Infrared Observatory from 2012 March 29 to 2012 June 17 and SMARTS/CTIO 1.3m telescope with the Andicam dual channel photometer (see Walter et al. 2012 for a description of the of the instrument and the data reductions). The log of the photometric observations from Mt. Abu is given in Table 1 and the SMARTS photometry is available on SMARTS atlas. Photometry in the bands was done under clear sky conditions using a near-infrared Imager/Spectrometer with a 256256 HgCdTe NICMOS3 array in the imaging mode. Several frames, at 4 dithered positions, offset by 30 arcsec were obtained in all the bands. The sky frames, which are subtracted from the nova frames, were generated by median-combining the dithered frames (see Raj et al. 2013 for more details). The standard star SAO 185406 (spectral type - B9.5/A0V) having magnitudes 6.47, 6.53 and 6.53 respectively, was used for photometric calibration. The data are reduced and analyzed using the package.
2.2 Optical observations
Optical spectra were obtained with the Asiago 1.22m telescope + B&C spectrograph, 2 arcsec slit width and oriented along North-South. The calibration in absolute fluxes for each nova spectrum was done by observations of several spectrophotometric standards observed on same night around similar airmasses. More detailed description of ANS (Asiago Novae and Symbiotic stars) Collaboration instruments, operation modes and results on the monitoring of novae can be found in Munari et al. (2012).
Further low dispersion spectra and photometry were obtained using the SMARTS Facilities111http://www.astro.sunysb.edu/fwalter/SMARTS/NovaAtlas. The R-C grating spectrograph, the data reduction techniques, and the observing modes are described by Walter et al. (2012). Basically, mode 13/I is sensitive to the entire optical band, from 3200 Å through 9500 Å; mode 26/Ia is sensitive from 3650 Å through 5400 Å; mode 47/I covers 5650 through 6900 Å, and mode 47/IIb covers 4060 Å through 4720 Å. We obtained 19 spectra on an irregular cadence and with various sky conditions from 2012 April 5 through 2012 June 24. The target was observed using the COSMOS222http://www.ctio.noao.edu/noao/content/cosmos long slit spectrograph at CTIO on 2015 May 8, some 3 years after outburst. We used the r2k disperser in combination with the 3pxR slit and the OG570 filter to obtain wavelength coverage from 6082 Å through 10253 Å, with a reciprocal dispersion of 1 Å/pixel, and a resolution of about 3 Å. Data reductions are similar to those used for the SMARTS spectra. The log of the spectroscopic observations is given in Table 2.
3 Results
3.1 General characteristics of and band light curves
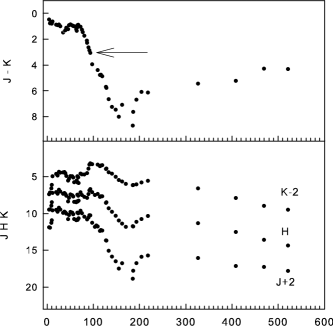
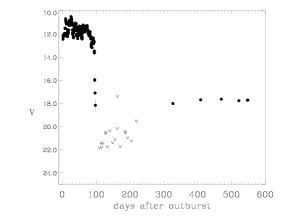
The and band light curves are made using the data from American Association of Variable Star Observers (AAVSO), SMARTS/CTIO 1.3m (Walter et al. 2012), Asiago 1.22m and Mt. Abu 1.2m telescope Facilities (see Fig. 1). The band light curve shows fluctuations of 0.7 magnitude around mv = 11.5 up to 70 days from outburst before beginning a slow decline. A sudden drop of more than 5 mag commencing after 90 days clearly indicates the dust formation in the nova ejecta (see Fig. 1, lower panel). The nova faded to 23 mag between 110-210 days from the outburst, suggesting that a large amount of dust was formed in the nova ejecta. After day 215 it recovered to 18. Since day 400 it has faded slowly, to magnitudes of about 21, 18.7, 18.3, and 19.2, respectively, in 2016 February.
The near-infrared light curves are made using the data from Mt. Abu observations (see Table 1) and SMARTS/CTIO 1.3m telescope facility (Walter et al. 2012). The NIR light curves are complex. The initial trends are downward in and more-or-less flat in and , with superposed fluctuations similar to those seen in the optical (see Fig. 1). After about day 70 the band brightness increased by over 2 mag, accompanied by a smaller brightening in , while continued to fade.
The K band brightness reached a peak value of 5.2 on day 93, the and colors were about 3.1 (marked in Fig. 1) and 1.5, respectively. These NIR color excess indicate that dust has been formed in the nova ejecta. Thereafter, the band light curves show a steep steady decline from 100-190 days from the outburst, lagging the dust dip seen in the optical. After day 190, the NIR brightness started recovering to brighter levels. The deep NIR dip suggests that the dust emission is optically thick even out to 2.2m. The dip is both shallower and narrower than the optical dip, consistent with dust opacity. After recovering, the NIR fluxes faded at a rate of about 0.015 mag/day until the target became too faint to follow with Andicam after 2014 August 14 (about day 700). At that time the J-K color had decreased to about 3 mag, which is consistent with a 1500-2000 K blackbody dust shell. Varricatt et al. (2013) reported NIR photometry between 2012 Sept 6 and 2013 Apr 9 which confirms the presence of the dust shell.
3.2 The reddening and distance of V2676 Oph
From the optical spectra presented in this paper, we estimate the reddening AV = 2.9 0.1 for the V2676 Oph using Balmer decrement method assuming the electron density 106 cm-3 and temperature 5000K (see section 3.5 for more details). However, it should be noted that the hydrogen-recombination lines are usually not described by the Case B approximation in novae and consequently the uncertainty in E(B-V) from this method is likely to be underestimated. The value for AV derived earlier is comparable with other estimated values for reddening e.g. AV = 2.39 0.12 (Nagashima et al. 2015) and AV = 2.67 0.16 (Kawakita et al. 2016) for R = 3.1 in the case of V2676 Oph. Alternatively, we can find the value of extinction from reddening E(B - V) 0.93 towards the nova direction taken from Schlafly & Finkbeiner (2011) which was estimated using the colors of stars with spectra in the Sloan Digital Sky Survey. This gives interstellar extinction AV 2.89 for R = 3.1 towards the nova direction. Though the value of AV derived from our spectra is close to the Schlafly & Finkbeiner (2011) value, the values for electron density and temperature are specific for the region where [O i] forms and are unlikely applicable to the region containing the H. Hence, for we use the value derived by Schlafly & Finkbeiner (2011) for reddening.
Since the brightness of the nova does not decline smoothly and there is large drop in magnitude due to dust formation, it is difficult to measure the characteristic time t2, the time to decline by two magnitude from visual maximum, of the nova, directly from the light curve. Instead, we can use the relation shown by Williams et al. (2013) to show that, given that the dust starts to condense about day 90, t2 is likely to be between 60 and 80 days. This indicates that V2676 Oph is a moderately fast nova. Applying maximum magnitude rate of decline (MMRD) relation by Downes & Duerbeck (2000) and the extinction value as mentioned above, we estimate the range for M between -6.5 to -6.8. Using this range for M together with the value of the visual maximum Vmax = 10.6 on April 5, we estimate the range for the distance d to the nova between 6.9 - 7.9 kpc and the height z of the nova to be in the range 637 - 730 pc above the Galactic plane. The large reddening is consistent with the location near the Galactic center (l,b = 0.26, +5.30) and the large distance.
3.3 Line identification, evolution and general characteristics of the optical spectra
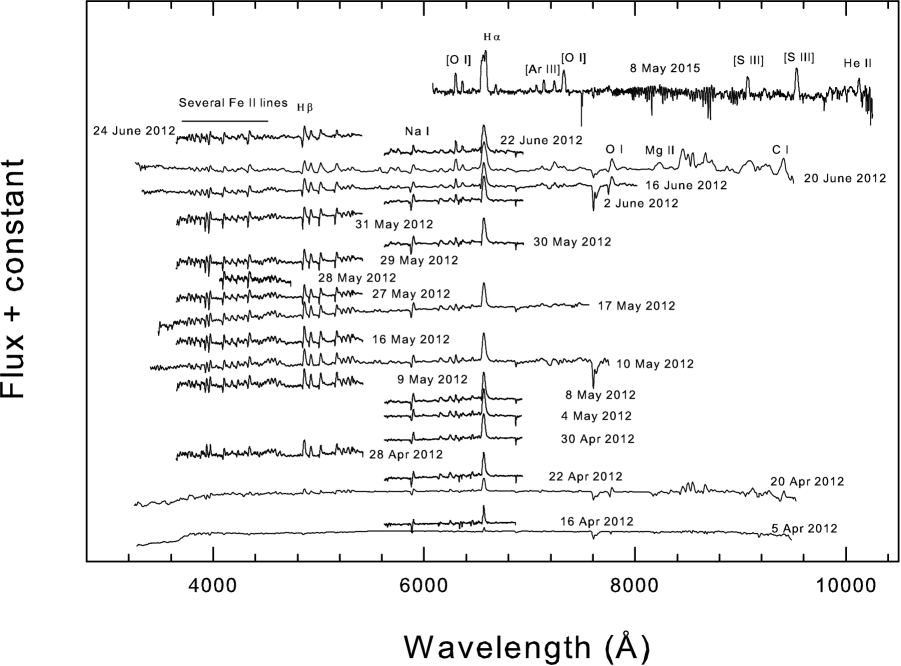
The optical spectra from SMARTS and Asiago, presented in Fig. 2 cover the pre-maximum to the early decline phase with one spectrum in the nebular phase. We obtained 19 low dispersion spectra using the SMARTS 1.5m/RC spectrograph from 2012 April 5 through 2012 June 24 (days 11 through 91). The initial spectrum covered the entire available spectrum at low dispersion. H was in emission (EW -7.3 Å), with a P-Cygni absorption evident (EW 0.6 Å). No other lines are seen in emission. The H i Balmer series is seen in absorption at least through H-10, and Paschen lines Pa9 - Pa12 also seem to be present. At this low dispersion absorption lines can be hard to identify unambiguously, but other strong absorption lines include Ca ii K & H, Na i (5890/5896; 6154/6160, 8191), possible O i 7774, and numerous lines that may be Fe ii multiplets 27, 28, 37, 38 and 74. By day 22 the strength of the H emission had grown to an equivalent width of -63 Å. At 3.1 Å resolution the line is asymmetric, with a notch about 350 km s-1 blue-ward of the emission peak. Na i D is in emission with a strong P-Cygni absorption feature. The Na i 6154/6160 lines are in emission, with absorption components at -600 km s-1. He i 6678 is in emission. Strong absorption may be P-Cygni outflows (and weak emission) in Si ii 6347 and various Fe ii multiplet 74 lines.
A low resolution spectrum on day 26 shows many emission lines, including the Balmer lines through H-10, the Fe ii multiplet 42, 48, 49 and 55 lines, and the Ca ii infrared triplet. The equivalent width of H remained at -63 Å. Prominent P-Cygni lines are seen at Na i D and 6154/6160, O i 7002, 7774, 8446, C i 7120, N i 7450, Ca ii-K & H are in absorption. On day 28 the Na i D1 and D2 absorption components are well-defined, at -660 km s-1. The H equivalent width had increased to -165 Å; the line profile is asymmetric with a notch 320 km s-1 blue-ward of the peak and a red tail extending to about 1500 km s-1. Our first blue spectrum, on day 34, shows a typical Fe ii nova spectrum. H is the strongest line, followed by Ca ii-K & H and the Fe ii multiplet 42 lines. The Fe ii multiplet 42 lines show narrow P-Cygni absorption at -950 km s-1. By day 46 this narrow fast P-Cygni outflow was also visible in the Balmer lines (H through H-11). This absorption component persisted at least through day 67, by which time it had accelerated to a velocity of about -1000 km s-1. The first two Asiago spectra were obtained in the midst of these, on days 45 and 52. The strong outflow in the Na i D lines which had persisted through day 69 (EW 9 Å) weakened by about a factor of 10 by day 89. At this time, based on a P-Cygni line profile at He i 6678, there may be similar emission at He i 5876 complicating the line profile. Also by day 89, H and the 6300/6364 Å[O i] lines are developing double-horned line profiles, with VR. The H equivalent width was -400 Å. In our last (blue) spectrum, on day 91, or about a week after the final Asiago spectrum, the P-Cygni absorption components (velocity -1100 km s-1) of the Balmer lines remain prominent, while those of the Fe ii lines are less distinct. The re-appearance of P-Cygni profiles in the later phase have been seen in other novae e.g. V1186 Sco, V2540 Oph, V4745 Sgr, V5113 Sgr, V458 Vul, and V378 Ser (Tanaka et al. 2011). This can be attributed to a re-expansion of the photosphere (see Tanaka et al. 2011 for more details).
The COSMOS spectrum taken on 2015 May 8 shows that the nova was in the nebular phase. In the 6100-10200 Å spectral range the strongest line by far is H+[N ii] 6548/6584, followed by the forbidden lines of [S iii] 9531, the four [O ii] lines from 7319-7331 Å, and [O i] 6300 and [Ar iii] 7751. The only permitted lines are H and some He i and He ii lines. Overall the spectrum resembles that of V443 Sct some 2 years after its outburst (Williams, Phillips & Hamuy, 1994). The H+[N ii] lines appear to be resolved, and can be fit as a sum of 3 Gaussians. The median FWHM is 623 km s-1, while the instrumental resolution is about 100 km s-1. Radial velocities are measured from the line centroids. The median radial velocity is 6 km s-1, with an uncertainties of order 50 km s-1, from convolving measurement errors with uncertainties in line rest wavelengths. Our observations are consistent with the results of Nagashima et al. (2014, 2015) and Kawakita et al. (2015, 2016). A list of the prominnet lines identified and the reddening-corrected emission line fluxes (in erg s-1 cm-2) for selected epochs is given in Tables 3, 4 and 5. The complete tables are available in the online version of the paper.
3.4 Dust formation and colors
A sharp decline in the optical light curve (the dust dip) about 90 days after the outburst and a steady increase in the near-IR magnitudes, especially in the K band clearly indicate the onset of the dust formation. The dust dip in the band light curves is very similar to the nova V5668 Sgr which, like V2676 Oph, also showed the CO band in emission (Banerjee et al. 2016). The presence of CO molecules in early nova spectra are indicators of low-temperature zones which are conducive to dust formation in the nova ejecta. This is clearly confirmed in the case of V2676 Oph. However, only 10 novae have shown the CO bands in emission before the dust formation so far (Banerjee et al. 2016, Raj et al. 2015) and there are so many cases such as V1280 Sco (see Das et al. 2008), V5579 Sgr (Raj et al. 2011) where dust formation was reported without any CO emission. The reason is not clearly understood; possibly these molecules were present but the strengths were below detection levels or due to observational constraints they might have formed and destroyed before the detection.
An increase in flux in the H and K bands coincides with the onset of the dust dip at shorter wavelengths. This is likely thermal emission from the dust. The larger excess in K is consistent with expectations that the thermal emission will peak in or beyond the K band. Similar behavior was seen in V5579 Sgr (Raj et al. 2011) and V496 Sct (Raj et al. 2012), which also showed the dust formation. The color excess reached a maximum of 8 mag at 190 days from outburst. This seems to be the largest value observed for the dust forming novae in recent years; () = 2.76 for V5579 Sgr (Raj et al. 2011), 3.79 for V496 Sct (Raj et al. 2012), 4.58 for V5584 Sgr (Raj et al. 2015), 4.65 for V1280 Sco (Das et al. 2008) and 3.97 for V2615 Oph (Das et al. 2009). Thereafter the color decreased, presumably because the dust thinned due to geometrical dilution.
The presence of strong C i lines and the early dust formation (just after 90 days) in the case of V2676 Oph indicate the presence of carbon grains in the dust shell (Clayton & Wickramasinghe 1976). This is further supported by the detection of C2 and CN molecules in V2676 Oph in the early phase (Nagashima et al. 2014).
| Date of | Days after | Magnitudes | ||
|---|---|---|---|---|
| observation | discovery | |||
| 2012 (UT) | ||||
| Mar 30 | 04 | 9.89 0.05 | 9.50 0.06 | 9.41 0.15 |
| Apr 01 | 06 | 9.95 0.04 | 9.46 0.12 | 9.17 0.15 |
| Apr 03 | 08 | 9.29 0.04 | 8.97 0.09 | 8.61 0.16 |
| Apr 04 | 09 | 8.94 0.04 | 8.49 0.09 | 8.14 0.10 |
| May 27 | 62 | 8.93 0.07 | 8.49 0.09 | 7.69 0.07 |
| May 28 | 63 | 8.89 0.07 | 8.38 0.03 | 7.53 0.21 |
| May 29 | 64 | 8.86 0.03 | 8.46 0.03 | 8.29 0.09 |
| May 30 | 65 | 8.89 0.04 | 8.39 0.01 | 7.82 0.12 |
| May 31 | 66 | 9.18 0.08 | 8.70 0.05 | 8.28 0.09 |
| June 01 | 67 | 8.67 0.04 | 8.28 0.03 | 7.88 0.12 |
| June 02 | 68 | 9.10 0.04 | 8.75 0.13 | 8.59 0.03 |
| June 03 | 69 | 8.73 0.04 | 8.40 0.07 | 8.42 0.03 |
| June 07 | 73 | 8.61 0.05 | 8.29 0.03 | 8.30 0.20 |
| June 09 | 75 | 8.81 0.01 | 8.29 0.03 | 7.35 0.19 |
| June 18 | 84 | 9.39 0.06 | 8.53 0.02 | 7.27 0.13 |
3.5 Physical Parameters
The optical spectra can be helpful for estimating the physical parameters of the nova ejecta with the use of hydrogen and oxygen line fluxes. The electron number densities are large in the early phase of nova evolution thus the optical depth which is an important parameter can be used to estimate the elemental abundances. Using the formulation of Williams (1994),
we estimate the optical depth for the [O i] 6300 Å line for the period between 2012 May 10 to 2012 June 16, in the range of 1.1-1.7. Using the value of we can estimate the electron temperature given by the relation:
we find Te 4400 K which is consistent with other novae (Ederoclite et al. 2006). To estimate the mass of the hydrogen m(H), we use the following relation from Osterbrock & Ferland (2006) which relates the intensity of the H line and the mass of the hydrogen in the emitting nebula having pure hydrogen as,
where eff is the effective recombination coefficient taken from Storey & Hummer (1995) and I is the flux for H line. We have used two I flux values as 6.33 10-11 and 5.19 10-11 erg cm-2 sec-1 for May 17, 2012 and June 16, 2012, respectively. The [O I] 6300, 6364 and 5577 Å lines are used to set the range for the electron density (), 106 - 107 cm-3. We do not notice any significant change in Te and Ne estimated above for both the epochs. The mass of the hydrogen m(H) is estimated as (2.7 10-7 - 3.3 10-6)M⊙ where is the distance to the nova.
4 Summary
We have presented the optical spectrophotometry and near-IR photometry of nova V2676 Oph which erupted in late-March 2012. The optical spectra indicate that the nova belongs to Fe ii class. The reddening and distance to the nova are calculated. The nova showed a large amount of dust formation 90 days after the outburst. The physical parameters, optical depth, electron temperature and the mass of hydrogen are estimated in V2676 Oph.
5 Acknowledgements
The research work at Physical Research Laboratory is funded by the Department of Space, Government of India. Access to SMARTS is made possible by generous support from the Provost of Stony Brook University, Dennis Assanis. Based in part on observations at Cerro Tololo Inter-American Observatory, National Optical Astronomy Observatory (NOAO Prop. 2015A-0261, PI F.M. Walter, plus SMARTS time), which is operated by the Association of Universities for Research in Astronomy (AURA) under a cooperative agreement with the National Science Foundation. We thank the referee Prof. A. Evans for his helpful comments as well as Prof. G. C. Anupama (IIA), Dr. U. S. Kamath (IIA) and Dr. B. C. Lee (KASI) for their useful discussions. We acknowledge the use of AAVSO (American Association of Variable Star Observers) optical photometric data and the spectrophotometric data which was privately communicated by the Asiago ANS (Asiago Novae and Symbiotic stars) Collaboration team.
| Date of | Days after | Time (s) | Mode | Resolution | Observatory |
|---|---|---|---|---|---|
| observation | discovery | or | |||
| (UT) | Instrument | ||||
| (2012) | |||||
| Apr 04 | 10 | 1500 | 13/I | 17 Å | SMARTS |
| Apr 16 | 22 | 900 | 47/Ib | 3.1 Å | SMARTS |
| Apr 20 | 26 | 900 | 13/I | 17 Å | SMARTS |
| Apr 22 | 28 | 900 | 47/Ib | 3.1 Å | SMARTS |
| Apr 28 | 34 | 900 | 26/Ia | 4.4 Å | SMARTS |
| Apr 30 | 36 | 900 | 47/Ib | 3.1 Å | SMARTS |
| May 04 | 40 | 900 | 47/Ib | 3.1 Å | SMARTS |
| May 08 | 44 | 900 | 47/Ib | 3.1 Å | SMARTS |
| May 09 | 45 | 900 | 26/Ia | 4.4 Å | SMARTS |
| May 10 | 46 | 900 | – | 2.31 Å | ASIAGO |
| May 16 | 52 | 900 | 26/Ia | 4.4 Å | SMARTS |
| May 17 | 53 | 1200 | – | 2.31 Å | ASIAGO |
| May 27 | 63 | 900 | 26/Ia | 4.4 Å | SMARTS |
| May 28 | 64 | 1800 | 47/IIb | 1.6 Å | SMARTS |
| May 29 | 65 | 900 | 26/Ia | 4.4 Å | SMARTS |
| May 30 | 66 | 900 | 47/Ib | 3.1 Å | SMARTS |
| May 31 | 67 | 900 | 26/Ia | 4.4 Å | SMARTS |
| Jun 02 | 69 | 900 | 47/Ib | 3.1 Å | SMARTS |
| June 16 | 83 | 1800 | – | 2.31 Å | ASIAGO |
| Jun 20 | 87 | 900 | 13/I | 17 Å | SMARTS |
| Jun 22 | 89 | 900 | 47/Ib | 3.1 Å | SMARTS |
| Jun 24 | 91 | 900 | 26/Ia | 4.4 Å | SMARTS |
| (2015) | |||||
| May 08 | 1138 | 3600 | – | 3 Å | CTIO |
| Wavelength | Species | April 28 | May 10 |
|---|---|---|---|
| (Å) | |||
| 3934 | Ca ii | 1.37E-10 | 1.96E-11 |
| 3970 | Ca ii and H | 1.49E-10 | 2.00E-11 |
| 4023 | He i | 1.57E-11 | |
| 4101 | H | 9.89E-11 | 2.08E-11 |
| 4129 | Fe ii(27) | 2.52E-11 | |
| 4173 | Fe ii(27) | 3.06E-11 | |
| 4178 | Fe ii(28) | 1.45E-11 | |
| 4233 | Fe ii(27) | 4.73E-11 | 1.42E-11 |
| 4273 | Fe ii(27) | 1.09E-11 | 5.24E-12 |
| 4303 | Fe ii(27) | 3.35E-11 | 1.71E-11 |
| 4340 | H | 1.21E-10 | 3.08E-11 |
| 4378 | He i | 6.52E-12 | |
| 4488 | N ii | 1.58E-11 | |
| 4555 | Fe ii(37) | 2.81E-11 | 8.50E-12 |
| 4586 | Fe ii(38) | 5.42E-11 | |
| 4634 | N iii | 3.77E-11 | 9.64E-12 |
| 4861 | H | 1.16E-10 | 5.59E-11 |
| 4924 | Fe ii(42) | 7.96E-11 | 2.43E-11 |
| 5018 | Fe ii(42) | 7.25E-11 | 2.32E-11 |
| 5169 | Fe ii + Mg i | 6.03E-11 | 1.86E-11 |
| 5235 | Fe ii(49) | 3.24E-11 | 7.83E-12 |
| 5276 | Fe ii(49+48) | 4.46E-11 | 1.04E-11 |
| 5316 | Fe ii(49) | 1.84E-11 | 1.48E-11 |
| 5361 | Fe ii(48) | 3.97E-12 | |
| 5528 | Mg i | 3.41E-12 | |
| 5577 | [O i] | 4.10E-12 | |
| 5676 | N ii | 2.83E-12 | |
| 5755 | [N ii](3) | 2.53E-12 | |
| 5890-5896 | Na i | 1.31E-11 | |
| 5991 | Fe ii(46) | 1.92E-12 | |
| 6154-6160 | Na i | 7.31E-12 | |
| 6243 | Fe ii + N ii | 7.63E-12 | |
| 6300 | [O i] | 1.25E-11 | |
| 6364 | [O i] | 3.58E-12 | |
| 6419 | Fe ii(74) | 1.04E-12 | |
| 6456 | Fe ii | 3.48E-12 | |
| 6563 | H | 1.89E-10 |
| Wavelength | Species | May 17 | June 16 |
|---|---|---|---|
| (Å) | |||
| 3934 | Ca ii | 4.66E-11 | 3.75E-11 |
| 3970 | Ca ii and H | 4.81E-11 | 4.42E-11 |
| 4101 | H | 3.55E-11 | 4.18E-11 |
| 4178 | Fe ii(28) | 2.90E-11 | 1.50E-12 |
| 4233 | Fe ii(27) | 2.28E-11 | 2.33E-11 |
| 4340 | H | 4.89E-11 | 5.77E-11 |
| 4586 | Fe ii(38) | 2.22E-11 | 1.39E-12 |
| 4634 | N iii | 1.50E-11 | 1.26E-11 |
| 4861 | H | 6.33E-11 | 5.19E-11 |
| 4924 | Fe ii(42) | 5.00E-11 | 5.17E-11 |
| 5018 | Fe ii(42) | 4.62E-11 | 4.81E-11 |
| 5169 | Fe ii + Mg i | 8.27E-11 | 6.36E-11 |
| 5235 | Fe ii(49) | 1.91E-11 | 7.38E-12 |
| 5276 | Fe ii(49+48) | 2.35E-11 | 1.33E-12 |
| 5316 | Fe ii(49) | 3.17E-11 | 1.94E-12 |
| 5577 | [O i] | 3.26E-12 | 3.74E-12 |
| 5890-5896 | Na i | 2.96E-11 | 1.99E-11 |
| 6154-6160 | Na i | 2.49E-11 | 1.25E-11 |
| 6243 | Fe ii + N ii | 2.02E-11 | 1.13E-11 |
| 6300 | [O i] | 1.65E-11 | 1.49E-11 |
| 6364 | [O i] | 7.53E-12 | 7.81E-12 |
| 6456 | Fe ii | 1.15E-11 | 5.44E-12 |
| 6563 | H | 4.99E-11 | 3.56E-10 |
| 6678 | He i | 3.33E-12 | 3.36E-11 |
| 7120 | C i | 1.07E-11 | 5.29E-12 |
| 7237 | [Ar iv] | 1.79E-11 | 1.47E-11 |
| 7477 | O i | 1.73E-11 | 8.22E-12 |
| Wavelength | Species | June 20 | 2015 May 8 |
|---|---|---|---|
| (Å) | |||
| 3934 | Ca ii | 2.89E-11 | |
| 3970 | Ca ii and H | 3.43E-11 | |
| 4101 | H | 5.51E-12 | |
| 4178 | Fe ii(28) | 1.65E-12 | |
| 4340 | H | 7.84E-11 | |
| 4555 | Fe ii(37) | 6.46E-12 | |
| 4663 | Al ii | 2.94E-12 | |
| 4861 | H | 1.45E-11 | |
| 4924 | Fe ii(42) | 4.71E-11 | |
| 5018 | Fe ii(42) | 6.27E-12 | |
| 5169 | Fe ii + Mg i | 4.08E-12 | |
| 5235 | Fe ii(49) | 3.28E-12 | |
| 5276 | Fe ii(49+48) | 6.61E-12 | |
| 5316 | Fe ii(49) | 1.35E-11 | |
| 5535 | Fe ii(55) + N ii | 2.66E-12 | |
| 5577 | [O i] | 9.27E-12 | |
| 5755 | [N ii](3) | 1.13E-11 | |
| 5890-5896 | Na i | 1.88E-11 | |
| 5942 | N ii(28) | 2.54E-12 | |
| 6154-6160 | Na i | 9.73E-12 | |
| 6243 | Fe ii + N ii | 4.80E-12 | 1.89E-13 |
| 6300 | [O i] | 3.69E-11 | 4.84E-12 |
| 6364 | [O i] | 1.54E-11 | 1.59E-12 |
| 6563 | H | 8.20E-11 | 1.76E-10 |
| 6678 | He i | 2.23E-12 | 8.24E-13 |
| 6716-6730 | [S ii] | 2.64E-12 | 1.84E-13 |
| 7002 | [O i] | 2.23E-13 | |
| 7065 | He i | 5.32E-13 | |
| 7281 | He i | 9.04E-14 | |
| 7319-7331 | [O ii] | 5.65E-12 | |
| 9069 | [S iii] | 1.57E-12 | |
| 9531 | [S iii] | 4.21E-12 | |
| 10126 | He ii | 8.16E-13 |
References
- Nakano (2009) Arai, A., Isogai, M., 2012, CBAT 3072, 1
- Banerjee (2009) Banerjee D. P. K. et al. 2016, MNRAS, 455L, 109
- Das (2004) Clayton D. D., Wickramasinghe N. C., 1976, Ap&SS, 42, 463
- Das (2008) Das R.K., Banerjee D.P.K., Ashok N.M., Chesneau O., 2008, MNRAS, 391, 1874
- Das (2008) Das R.K., Banerjee D.P.K., Ashok N.M., 2009, MNRAS, 398, 375
- della (2002) Downess R. A., Duerbeck H. W., 2000, AJ, 120, 2007
- Eyles (2003) Ederoclite A. et al., 2006, A&A, 459, 875
- Nakano (2009) Imamura K., 2012, CBAT 3072, 1
- Kahabka (1999) Kawakita, Hideyo; Fujii, Mitsugu; Nagashima, Masayoshi; Kajikawa, Tomoyo; Kubo, Natsuki; Arai, Akira, 2015, PASJ, 67, 17
- Kahabka (1999) Kawakita, Hideyo; Arai, A.; Fujii, M.; 2016, PASJ, 87, 1
- Nakano (2009) Munari U. et al., 2012, Baltic Astronomy, 21, 13
- Nakano (2009) Nagashima, M., Arai, A., Kajikawa, T., Kawakita, H., Kitao, E., Arasaki, T., Taguchi, G., Ikeda, Y., 2014, ApJL, 780, 26
- Nakano (2009) Nagashima, M., Arai, A., Kajikawa, T., Kawakita, H., Kitao, E., Arasaki, T., Taguchi, G., Ikeda, Y., 2015, AcPPP, 2, 212
- Nakano (2009) Nishimura, H., Kaneda, H., Kojima, T., Yusa, T., 2012, CBAT 3072, 1
- Nakano (2009) Osterbrock D. E., Ferland G. J., 2006, Astrophysics of gaseous nebulae and active galactic nuclei, 2nd. ed. Sausalito, CA: University Science Books
- Raj (2011) Raj Ashish, Ashok N. M., Banerjee D. P. K., 2011, MNRAS, 415, 3455
- Raj (2012) Raj Ashish, Ashok N. M., Banerjee D. P. K., Munari U., Valisa P., Dallaporta S., 2012, MNRAS, 425, 2576
- Raj (2013) Raj Ashish, Banerjee D. P. K., Ashok N. M., 2013, MNRAS, 433, 2657
- Raj (2015) Raj A., Banerjee D. P. K., Ashok N. M., Kim S. C., 2015, Res. Astron. Astrophys., 15, 993
- Nakano (2009) Rudy et al., 2012a, CBAT 3081, 1
- Nakano (2009) Rudy et al., 2012b, CBAT 3103, 1
- Schlegel (1998) Schlafly E., Finkbeiner D. P., 2011, ApJ, 737, 103
- Storey (1995) Storey P. J., Hummer D. G., 1995, MNRAS, 272, 41
- Storey (1995) Tanaka Jumpei, Nogami Daisaku, Fujii Mitsugu, Ayani Kazuya, Kato Taichi, 2011, PASJ, 63, 159
- Nelson (2008) Varricatt, W. P. et al., 2013, ATel, 5090, 1
- Warner (2005) Walter, F. M., Battisti, A., Towers, S. E., Bond, H. E., & Stringfellow, G. S. 2012, PASP, 124, 1057
- Williams (1995) Williams R. E., 1994, ApJ, 426, 279
- Williams (1995) Williams R. E., Phillips M. M., Hamuy M., 1994, ApJS, 90, 297
- Williams (1995) Williams S. C., Bode M. F., Darnley M. J., Evans A., Zubko V., Shafter A. W., 2013, ApJ, 777, L32