Programmable Active Janus Droplets Driven by Water/Alcohol Phase Separation
Abstract
We report the existence of self–propelled Janus droplets driven by phase separation, which are able to deliver cargo in a programmable manner. The self–propelling droplets are initially formed by a water/ethanol mixture in a squalane/monoolein solution, and evolve in up to three stages depending on ethanol concentration. In the first stage, the droplet propulsion is generated by Marangoni flow originating from the solubilization of ethanol in the oily phase. During this process the droplets absorb surfactant molecules; in combination with the continuous loss of ethanol this leads to a phase separation of the water/ethanol/monoolein mixture and the formation of Janus droplets, i.e. a water–rich droplet connected to an ethanol–rich droplet that is able to deliver cargo. We characterize the different evolution stages of self-propulsion by the flow field around the droplet that evolves from a weak pusher, over a neutral swimmer, to a dimer of neutral swimmers. Finally, we utilize this active system to deliver DNA as a cargo. Tuning the delay time before phase separation, by varying the chemical composition of the droplets, several different cargo delivery processes can be programmed.
I Introduction
In recent years, significant efforts were dedicated to realize artificial micro– and nano–swimmers that locomote at low Reynolds numbers, and that are further able to perform tasks, like cargo delivery Sanchez2015 ; Baylis2015 ; Wang2013 . Swimmers driven by periodic conformational changes have to break the time-reversal symmetry to achieve a net propulsion at small Reynolds numbers Purcell1977 ; Lauga2011 . However, swimmers driven by a continuous propulsion mechanism need to break spatial symmetry and display a permanent polarity. Despite the theoretical possibility to observe a spontaneous symmetry breaking for homogeneous spherical particles Michelin2013 , all solid autophoretic swimmers realized in experiments so far exhibit an ingrained polarity. Spherical Janus particles, for instance, exploit a difference in chemical surface composition of the two opposing hemispheres Jiang2010 . Recent studies have shown that Janus nanorods can not only self–propel but also deliver drugs during self–propulsion Xuan2014 , repair cracks in electrical circuits Li2015a , or even halt blood hemorrhages Baylis2015 . Beside their desired properties, is the nature of these colloidal (Janus) particles and the way to trigger their self–propulsion often incompatible with biological applications Sanchez2015 .
In contrast, emulsion droplets can be formed with bio–compatible liquids. It was shown that emulsion droplets can self–propel by Marangoni flow Seemann2016 when a surface tension gradient is either maintained by chemical reactions Thutupalli2011 , micellar solubilization Peddireddy2012 ; Izri2014 , or liquid–liquid phase separations Maass2015 . However, the realization of self–propelled Janus droplets has been proven difficult Bormashenko2011 ; Jeong2015 ; Choi2013 ; Guzowski2012 ; Li2015b and swimming droplets could so far not perform tasks comparable to solid self–propelling particles.
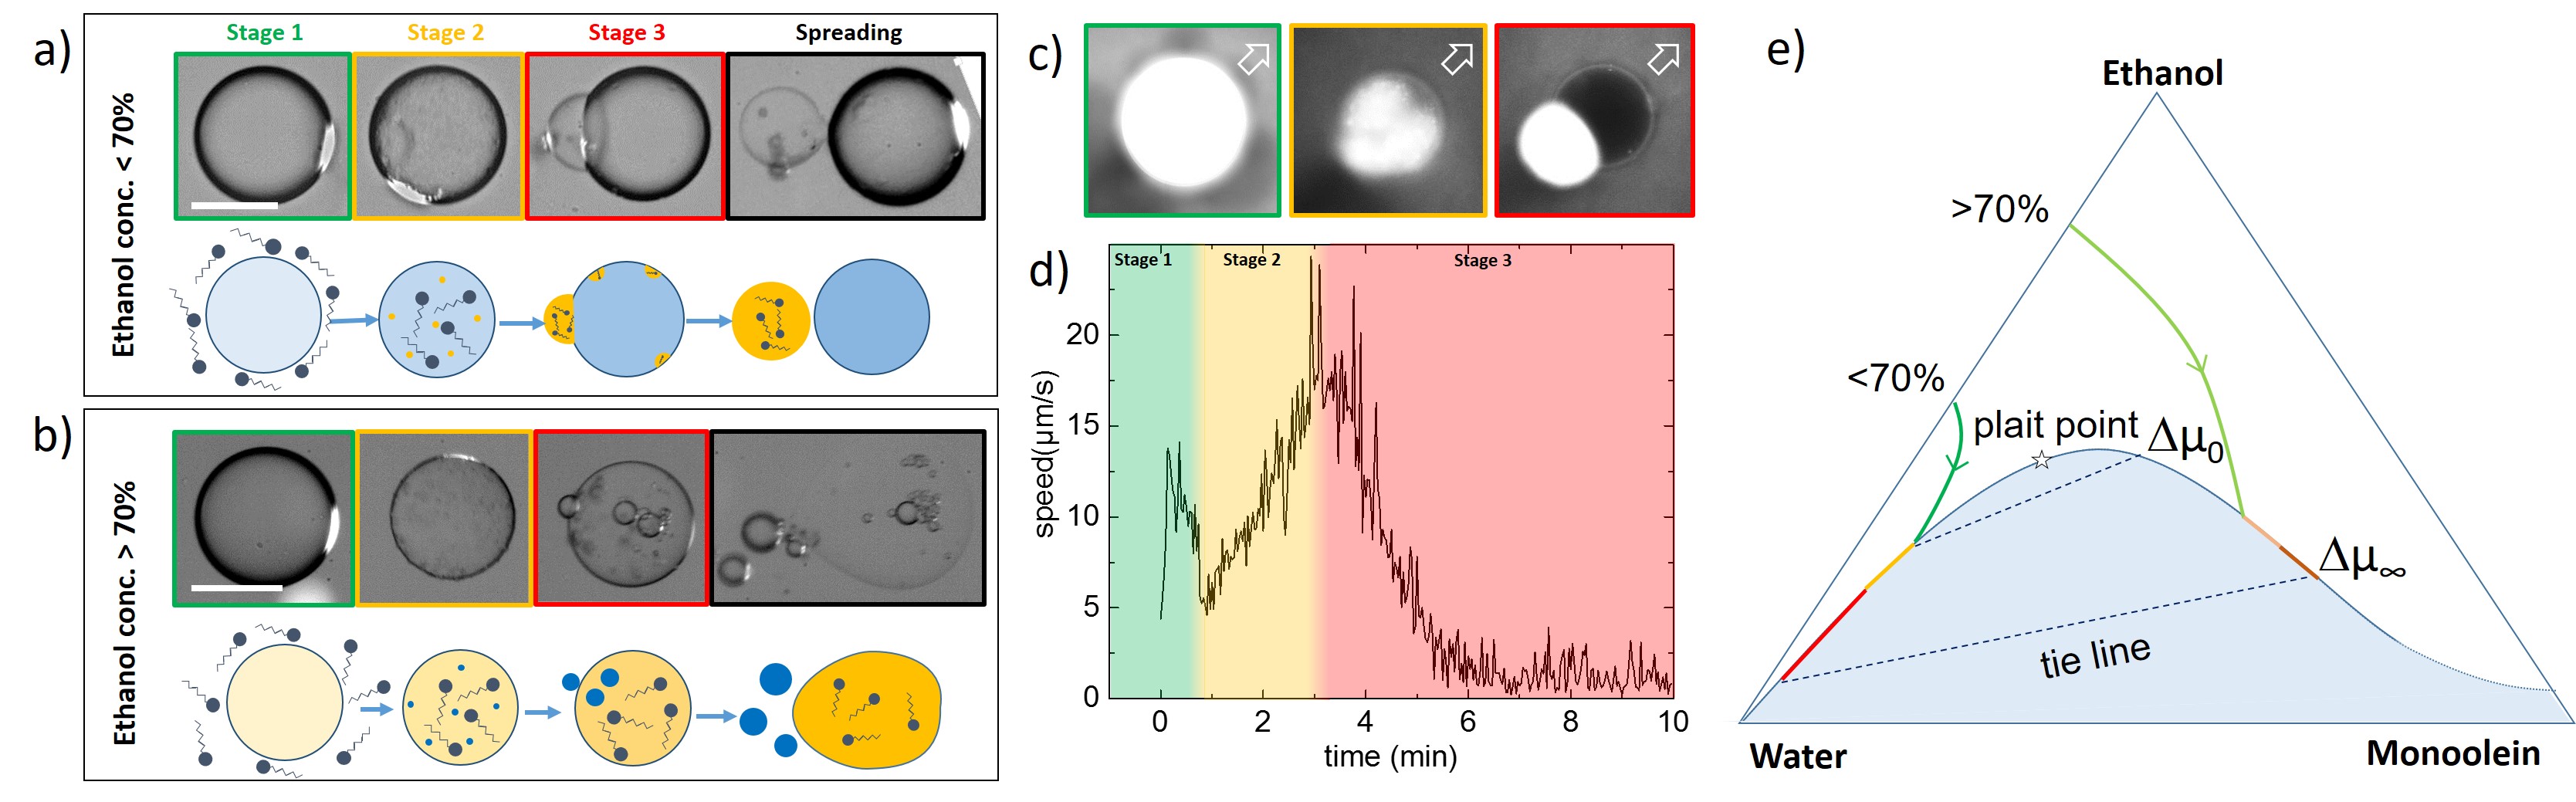
In this article, we report time–evolutive self–propelled ethanol/water droplets in a surrounding squalane/monoolein solution, which are able to deliver cargo. The evolution of the emulsion droplets is caused by a continuous release of ethanol from the droplet into the continuous phase and simultaneous uptake of monoolein from the continuous phase into the droplet phase. This leads, after a certain time, to a spontaneous phase separation between water and ethanol in the presence of the surfactant monoolein, see Fig. 1a. Depending on initial ethanol/water mixing ratio, the droplets evolve in up to three stages and potentially form Janus droplets with a water–rich leading droplet and an ethanol–rich trailing droplet. We describe and characterize the conditions of emergence and evolution of the different stages, and their corresponding propulsion mechanism. Furthermore, we demonstrate that the droplets can extract and precipitate DNA during the phase separation process, which can is delivered via the ethanol–rich droplet to a target location. Because the emergence of phase separation is controlled by the initial chemical composition of the droplets, several different cargo delivery processes can be achieved in a programmable manner. The propulsion mechanism is universal and could be realized with several other liquid mixtures or lipidic surfactant, including a wide range of alcoholic beverages (if having sufficiently high alcohol content).
II Results
II.1 Production and Hydrodynamic Properties
The generation of evolutive self–propelling droplets is achieved using a four component system consisting of water, a water–miscible solvent, which is less polar than water and partially soluble in the surrounding phase, an oily phase, and an oil soluble surfactant. The surfactant needs a chemical affinity for the solvent and the oil should be immiscible with water. A combination of chemical substances satisfying all these conditions is water/ethanol/monoolein and squalane (as 4 % of ethanol is soluble in squalane). For simplicity we will restrict our following description to this particular system, but the reported concept is universal and similar results could be obtained for seven other chemical compositions fulfilling the above mentioned requirements, see Suppmatt .
II.1.1 Evolution stages of the droplets as function of ethanol concentration
Droplets with a diameter of about 200 m were generated by injecting an ethanol/water mixture through a glass capillary (inner diameter m) into a flat observation chamber that is pre–filled with a continuous squalane/monoolein mixture. The bottom of the observation chamber is rendered hydrophobic with a self–assembled monolayer of octadecyltrichlorosilane (OTS) to prevent adhesion and subsequent spreading of the droplets at the bottom surface of the chamber. Depending on ethanol concentration, the generated water/ethanol droplets evolve with time assuming up to three different stages, as displayed Fig. 1. We start our description for a medium ethanol concentration, where all three stages can be observed (Fig. 1a), and subsequently extend our discussion to smaller and respectively to larger initial ethanol concentrations. In the following discussion the monoolein concentration in squalane is always fixed to 15 mM, i.e. 7 times above the critical micellar composition (CMC), if not explicitly stated otherwise.
For intermediate ethanol concentrations, between and , the droplets start to self–propel in the oil phase just after their production. During self–propulsion every droplet looses a few percent of its volume, and takes up monoolein molecules from the surrounding phase. The influx of monoolein to the swimming droplet is monitored by adding fluorescent lipids to the initial water/ethanol mixture. Similar to monoolein, the fluorescent lipids display a strong affinity to ethanol and follows the repartition of monoolein molecules between the fluid phases, cf. Fig. 1c. After minutes in stage 1, a nucleation process occurs inside the self–propelling droplet (stage 2) which lasts for about minutes and leads to the formation of an ethanol–rich droplet inside a water–rich droplet. The ethanol–rich droplet is finally pushed out of the water–rich droplet when touching its interface, generating an ethanol–rich droplet trailing behind the leading water–rich droplet. Such a droplet pair formed by the coexistence of two phase–separated droplets constitutes a long–lived Janus droplet that is self–propelling for about min (stage 3). At the end of stage 3, the two droplets forming the Janus droplet break up, Fig. 1a. After separation the ethanol–rich trailing droplet typically spreads on the hydrophobic substrate and the water–rich leading droplet stops its motion suddenly, or in rare cases, continues its self–propulsion by a few droplet radii.
When initially producing water/ethanol droplets with smaller ethanol concentration of just , the demixing starts almost immediately after droplet production, cf. Fig. 1e. Droplets with this low ethanol concentration are directly starting to self–propelled in stage 2. The demixing in stage 2 is very fast ( min) and the self–propelling behavior of the formed Janus droplets can effectively be observed only in stage 3 for around min. The qualitative behavior in these stages is as described previously for intermediate ethanol concentrations. Reducing the initial ethanol concentration in the droplets even below , phase separation is not always observed and self–propelled motion is not occurring reliably.
Droplets produced with an ethanol concentration between to show all three evolution stages (Fig. 1b), whereas the duration of stage 1 is extended to min before the phase separation occurs in stage 2. The duration of the subsequent demixing in stage 2 is around min. In contrast to the intermediate and low ethanol concentrations, the water–rich phase is now clearly the minority phase and several water–rich droplets are formed inside the ethanol–rich droplet. Accordingly, the water–rich droplets are finally pushed out of the larger ethanol–rich droplet and may continue to locomote. The ethanol–rich mother droplet finally spreads on the OTS-coated bottom of the device and stops moving. Generating droplets with ethanol concentrations well above is not possible as those droplets directly wet the OTS-coated bottom of the observation chamber and do not self–propel.
II.1.2 Characteristics of the evolution stages
Having introduced the the appearance of the evolution stages as function of ethanol concentration, we will shed some light on their characteristics. A self–propelling droplet in stage 1 collects a large amount of monoolein from the oil phase as can be seen from the fluorescence activity after a short propulsion time. In case of large ethanol concentration (), additional dark clouds can be observed around the droplet, which we suspect to be Marangoni rolls Schwarzenberger2014 , together with a dark trail (Fig. 1c). The droplet is releasing more material with increasing ethanol concentration, visibly by the reduction of droplet volume ranging from only a few percent at ethanol concentration to about for an ethanol concentration of . Obviously, the released material is ethanol which is soluble by in the surrounding squalane. Because we neither observed self–propelling nor volume loss in the case of pure water droplets within the duration of the experiment irrespectively of the monoolein concentration, we further conclude that the fraction of water leaving the droplets can be neglected with respect to the ethanol loss. The absence of self–propelled motion of pure water droplets agrees with the findings of Thutupalli et al. Thutupalli2011 but is at variance with the observations of Izri et al. Izri2014 .
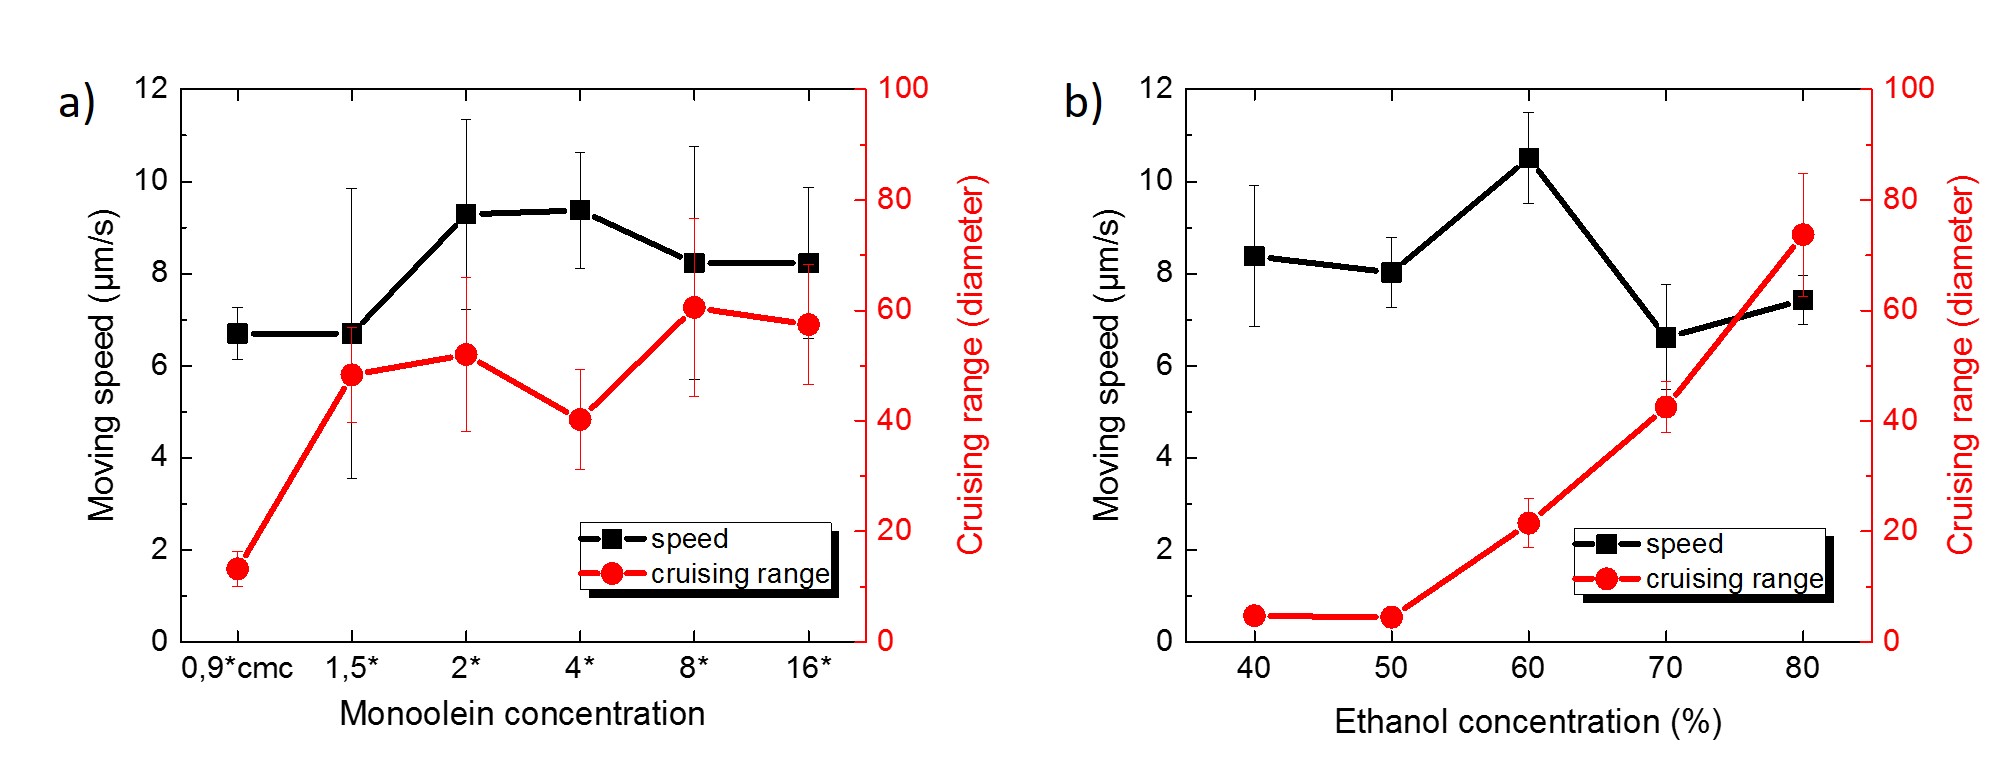
Based on the above findings we conclude that the solubilization of ethanol into the squalane solution is driving the droplet motion. This effect is described for the case of liquid–crystal droplets Peddireddy2012 ; Maass2015 , where liquid–crystal molecules are solubilized in a monoolein/squalane solution by filling surfactant micelles Suppmatt , leading to a variation of the surface tension at the droplet surface and so to a Marangoni flow Peddireddy2012 ; Maass2015 ; Seemann2016 . However our situation is more complex than in Refs. Peddireddy2012 ; Maass2015 as ethanol can be solubilized not only in micelles, but also at the molecular lever. We demonstrate this point by observing the self–propulsion of droplets below the critical micellar concentration (CMC), cf. Fig. 2a , in contrast to all the other reported examples of self–propelling droplets Peddireddy2012 ; Thutupalli2011 ; Izri2014 ; Maass2015 ; Seemann2016 .
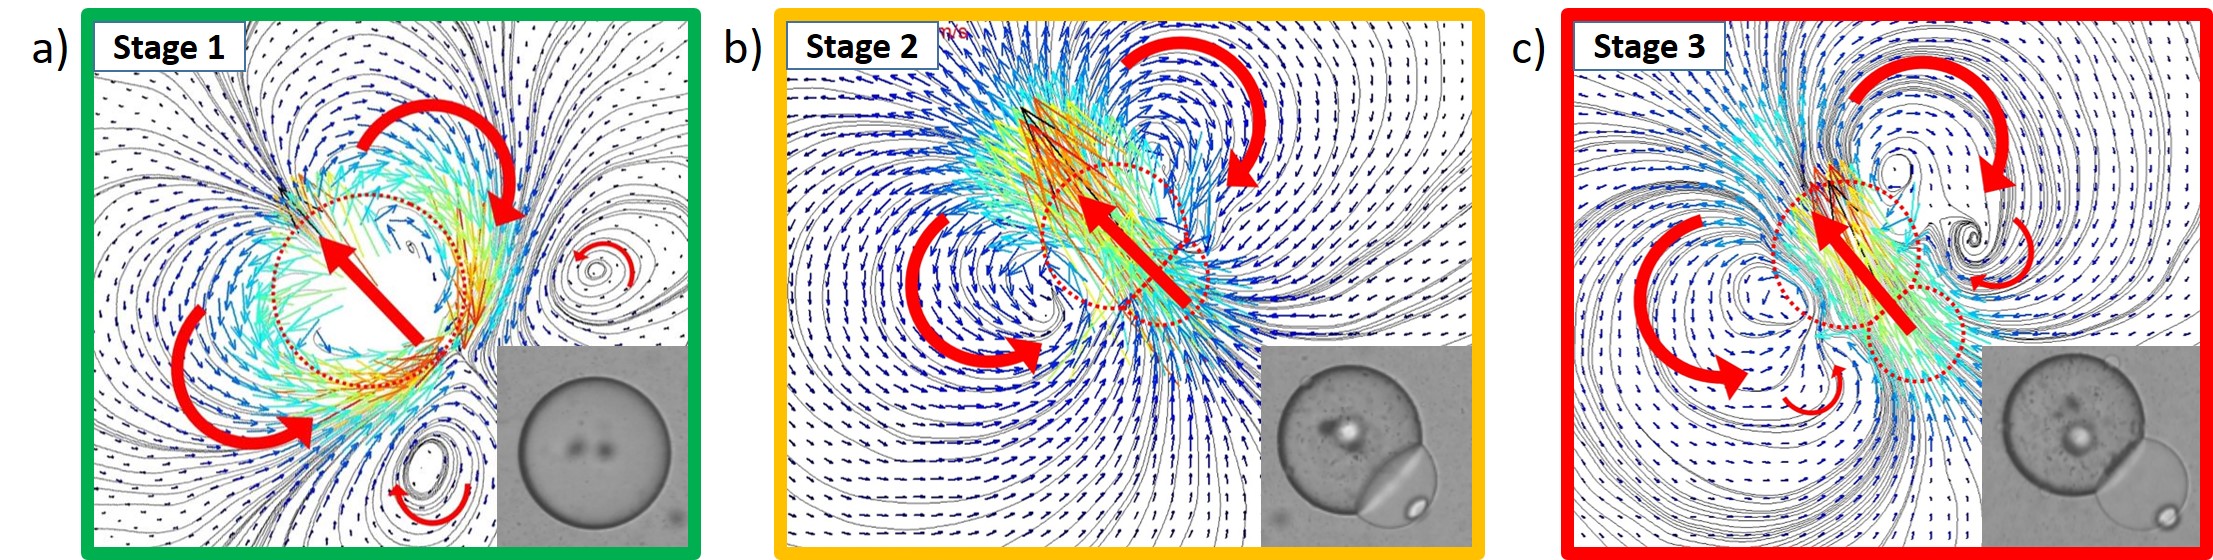
The droplets velocities in stage 1 are constant in average with strong fluctuations, similar to other reported systems displaying self–propelled motion due to solubilization Peddireddy2012 ; Maass2015 . The droplet velocity has no clear dependence on the initial ethanol concentration provided it is in a range that droplets self–propel () and can be stabilized against coalescence (), see Fig 2b. But the self–propulsion running time and with it the cruising range in stage 1 is significantly increased with increasing ethanol concentration which is the fuel for this propulsion process, cf. Fig. 2b. Measurements of the surrounding flow field by micro-Particle Image Velocimetry (), shown in Fig 3a, characterize this type of self–propelling droplets in stage1 as squirmer in a weak–pusher mode. Note that this flow field is different from flow fields reported for comparable systems which reveal a more symmetric flow field, as expected of neutral squirmers Lighthill1952 ; Blake1977
Upon self–propulsion, ethanol solubilization and surfactant absorption are working together until the condition of phase separation is eventually reached Efrat2007 ; Spicer2001 ; Engstrom1998 , leading to the observed water/ethanol phase separation in stage 2. Stage 2 persists only a short time with a continuous increase of the droplet velocity while nucleation and coarsening processes are ongoing, see Fig. 1c. According to the measured flow field around a droplet in stage 2, see Fig. 3b, the droplets can be characterized as neutral squirmers. The demixing of water/ethanol in the presence of monoolein is reported in literature for the corresponding ternary mixture (water/ethanol/monoolein) Efrat2007 ; Spicer2001 ; Engstrom1998 . Inspecting these phase diagrams, sketched in Fig. 1e, it is obvious why droplets with larger initial ethanol concentration have to loose more ethanol and are sustained longer in stage1 before reaching the decomposition line that is leading to the phase separation.
The small ethanol–rich droplets nucleating in the bulk of the mother droplet coarsen quickly until a Janus state is reached. Due to the swirl inside the mother droplet the coarsening droplets are preferentially transported towards the rear side of the mother droplet where they coalesce to even bigger droplets leading to one large ethanol–rich droplet inside the mother droplet. When this coalesced ethanol–rich droplet touches the inner surface of the mother droplet it forms a three phase contact line and finally grows out of the mother droplet forming a stable Janus-droplet when nucleation and coarsening are completed, see Fig. 1c.
After the completed formation of self–propelling Janus droplets, they consist of a water–rich leading droplet in contact with an ethanol–rich trailing droplet that contains the majority of the monoolein molecules, which were previously taken up by the mother droplet. A water-rich droplet looses some of its volume (up to a few percent), while the Janus droplet velocity decreases exponentially until reaching a constant cruising speed.
No further nucleation in visible droplets or coarsening events could be observed. However, estimating, the volume of both droplets and comparing them to the droplet volume at the beginning of stage 2 and the initial water/ethanol composition indicates that a non–negligible amount of ethanol is still present in the water–rich phase. Based on PIV measurements of the flow field, the stable Janus droplets can be identified as chains of neutral swimmer Suppmatt , cf. Fig. 3c. A surface flow at the water–rich droplet can be directly observed in stage 3 by secondary nucleated small ethanol–rich droplets at the surface of the water–rich leading droplet. These small droplets are continuously transported towards the ethanol–rich trailing droplet and merge with it Suppmatt . During transport the small droplets eventually grow in size, reaching m, when reaching the trailing ethanol droplet Suppmatt . Interestingly, the distribution of the secondary droplet surface indicate the future macroscopic direction of motion of a Janus drop: Each small droplet nucleated at the interface of the water–rich droplet is a local sink for monoolein molecules in its near surrounding and is thus influencing the symmetry of the Marangoni flow pattern around the Janus droplet. If the distribution of the small ethanol–rich droplets is homogeneous, the flow is symmetric with respect to the symmetry axis of the Janus droplet leading to a relatively straight trajectory. In contrast, an inhomogeneous distribution of the secondary nucleated droplets induces an asymmetric flow field and triggers a rotation of the water–rich droplet away from the small droplets Suppmatt .
II.1.3 Propulsion mechanism in stage 2 and 3
Based on the above findings, we already concluded that the droplets in stage 1 are driven by the solubilization of ethanol into the surrounding oil phase. In view of the accumulation of monoolein inside the trailing droplet in stage 3 and the continuing formation of a monoolein depleted layer in the squalane around the leading droplet, it suggests itself to model the propulsion in stage 2 and 3 from a balance between the work dissipated in viscous flows and the chemical energy released by monoolein molecules on their path from the ambient squalane phase into the trailing droplet. This release of chemical energy drives a Marangoni flow that continuously propels the Janus droplet. Since the small solvent molecules ethanol and water diffuse much faster than the large monoolein molecules, we assume a chemical equilibrium of water and ethanol between the two bulk phases. Under these assumptions the concentration of solvents to the bulk phases follows the binodal line of the phase diagram, while the relative partition of ethanol and water to the leading and trailing droplet is solely controlled by the total amount of monoolein in the Janus droplets.
The flux of monoolein molecules into the trailing droplet in stage 3 can be expressed by the droplet velocity and the surface coverage of monoolein on the interface of the leading droplet. Close the final chemical equilibrium of the Janus droplet with the squalane phase, it is justified to approximate the surface coverage by the its corresponding equilibrium value. By virtue of the Gibbs adsorption isotherm, we can relate the gradient of the interfacial free energy to the gradient of the chemical potential of monoolein molecules. The thin depletion layer of monoolein in the squalane solution around the Janus droplet with thickness indicates large Peclet numbers , and we can set the chemical potential of the adsorbed monoolein molecules at the tip of the leading droplet to the value in the squalane solution. The chemical potential at the three phase contact line can be related to the concentration of monoolein molecules in the trailing droplet. But as more and more monoolein accumulate in the trailing droplet, the difference of chemical potentials of the monoolein molecules in the squalane phase, and in the ethanol–rich trailing droplet, , decreases, and the Janus droplets slow down. In return, this deceleration reduces the flux of monoolein molecules into the trailing droplet and we predict an exponential decrease of the droplet velocity to zero in stage 3. The time constant of this exponential decrease can be expressed as
| (1) |
where is the dynamic viscosity of the squalane phase, the volume of the trailing droplet and a factor of order unity that contains the dependence on the geometry of the Janus droplet and the viscosity ratios of the bulk fluids Suppmatt .
Spontaneous de–mixing of the mother droplet into an ethanol–rich and a water–rich phase marking the end of stage 1 starts once the composition of the Janus droplet reaches the boundary of the miscibility gap. Provided a low initial ethanol concentration of the mother droplet at the beginning of stage 1 we observe the nucleation of small ethanol–rich minority phase droplets that quickly coarsen. With a certain delay after the onset of nucleation, the first minority phase droplets attach to the interface between the squalane and the water–rich phase of the mother droplet. The thus formed three–phase contact line allows the monoolein molecules on the interface between the water–rich majority phase and the squalane phase start to solubilize into the bulk of the ethanol–rich trailing droplet. As outlined above for the droplet propulsion in stage 3 the resulting gradient in the chemical potential of monoolein molecules causes a Marangoni flow. Since the trailing droplet is initially very small, it is quickly saturated with monoolein unless larger, ‘fresh’ minority phase droplets coalesce with the trailing droplet and dilute the monoolein. The increase of concentration caused by the influx of monoolein molecules from the interface of the leading droplet is quickly surpassed by the dilution with minority phase droplets that coalesce with the trailing droplet. As a result, the difference of the chemical potential between the monoolein molecules in the ambient squalane and the ethanol–rich trailing droplet increases in stage 2, and thus the propulsion velocity.
To estimate the balance of monooleine accumulation and its dilution in stage 2, we employ the average radius of the minority phase droplets measured in our experiments. A quantitative analysis of the experimental data shows that both the radius of the minority phase droplets in the bulk of the mother droplet and the radius of the trailing droplet in stage 2 conforms to a power law in time Suppmatt . A linear growth of the typical domain size after a quench into the miscibility gap of a binary liquid was already predicted from dimensional analysis of the transport equations Siggia1978 and observed in experiments Mauri2003 .
Setting the growth exponent of the radius to , the non–dimensionalized undersaturation of monoolein in the trailing droplet in stage 2, and the propuslion velocity are described by the equation
| (2) |
Solutions of Eqn. (2) and, hence, the velocity , displays a nearly linear rise in stage 2, in agreement with experimental findings Suppmatt .
Since the final volume of the trailing droplet scales as , eqn. (1) predicts a relaxation time in stage 3 whereas our experimental data show a relaxation time that is independent on the dimensions of the droplet Suppmatt . In agreement with the experiments, the peak velocity of self–propulsion is observed at a time marking the transition between stage 2 and stage 3. Numerical solutions of eqn. (2) show that the peak velocity is monotoneously decreasing with an increasing ratio of the coarsening time to the final relaxation time. Only in the limit of small ratios we find a constant peak velocity as in the experiments Suppmatt .
The model introduced above is based on the assumption that the water and ethanol molecules of two fluid phases of the Janus droplet are chemically equilibrated at any instance in time. However, we know from experimental observations that this assumption cannot be completely fulfilled. In stage 3, in particular, we observe the nucleation and growth of small ethanol–rich droplets at the interface between the water–rich droplet with the squalane phase. These droplets are advected to and merge with the trailing droplet. A secondary nucleation indicates that the de–mixing of ethanol and water is still ongoing in stage 3. Droplets of the minority phase created in this secondary nucleation could be responsible for an increased influx of monoolein molecules into the trailing droplet that allows larger droplets to reach a chemical equilibrium on the same time scale as droplets with a smaller radius.
The discrepancy between the perdictions of the model and the experimental results could also arise from an unjustified assumption of chemcial equilibration of water and ethanol in the Janus droplet. It is well possible that ethanol and water molecules in two bulk phases of the Janus droplet are not close to a chemcial equilibrium, and the gradients in the composition of the solvents also contribute to the propelling Marangoni stresses. Moreover, the quick uptake of monoolein in stage 1, and the synchroneous appearance of monodisperse minority phase droplets suggests a spinodal decomposition of an unstable phase at the beginning of stage 2 rather than a homogeneous nucleation. In view of the complexity of the many competing kinetic effects, it does not come as a surprise that the maximum velocity and the scaling of the exponential decay time recorded in experiments do not conform to the prediction of our simple simple model.
II.1.4 Smart Carrier for Programmable DNA Cargo Delivery
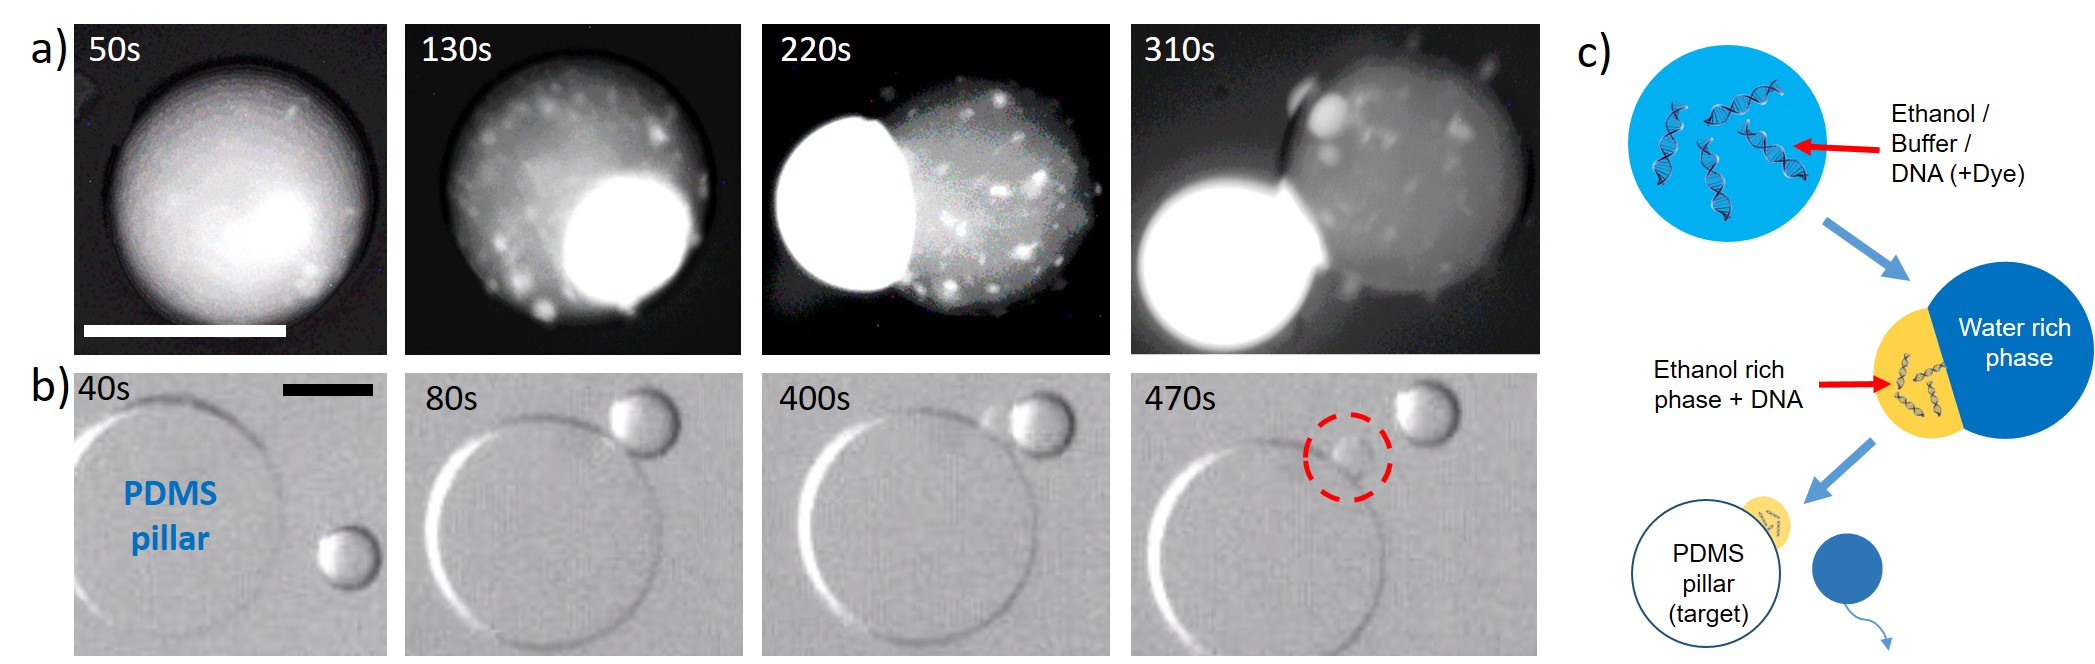
In this section, we will use the particular properties of our evolutive self–propelling droplets for controlled cargo delivery in a programmable manner. For that purpose, we used a water/ethanol solution containing DNA ( mg/ml) and M of sodium acetate as droplet phase in a surrounding monoolein/squalane solution. Even in the presence of DNA, the droplets undergo the previously described evolution stages ending with a Janus droplet consisting of a water–rich leading droplet and an ethanol–rich trailing droplet. In contrast to similar bulk methods Zeugin1985 ; Smalla1993 ; Chiu2015 , DNA extraction in self-propelling and phase separating droplets occurs in a single step during less than minutes with sample volumes on the picoliter scale, cf. Fig. 4a,c.
To achieve a controlled cargo delivery, we use the fact that the ethanol–rich droplet, which is formed during the evolutive self–propulsion spreads easily on a polydimethylsyloxane (PDMS) surface upon contact. Using this strategy, three different scenarios of cargo delivery can be achieved simply by varying the initial ethanol/water concentration of the droplet.
For intermediate ethanol concentration between and the droplet is self–propelling minutes before starting its phase separation. After the Janus fromtion, a drop-off cargo delivery is realized; i.e. the swimmer delivers its cargo and leaves the target area. If such a droplet self–propels around an obstacle in the Janus stage 2 or , the ethanol–rich trailing droplet is spreading on the surface when touching the obstacle, see Fig. 4b. This touching is inevitable when the Janus droplet tries to swim away from the obstacle. The remaining water–rich droplet is continuing its self–propelled motion moving away from the obstacle. However, the cargo can also be delivered if the droplet approaches the PDMS obstacle already in stage 1, or stage 2, i.e. in a stage before the trailing droplet is formed. In these stages a self-propelling droplet will either stay in contact to the PDMS surface, or self–propel in a bound orbit around it depending on its specific squirmer mode Papavassiliou2014 . Therefore it is just a matter of time until the Janus droplet is formed leading to the above described drop-off cargo delivery.
For low ethanol concentration (), the formation of Janus droplets occurs almost immediately after droplet production; such a droplet has a short total running time. As consequence, those water–rich droplets will stop to move soon after cargo delivery and stay close to the cargo delivery area shielding it after a certain number of delivery events.
For large ethanol concentration (), the droplet is self-propelling 10–15 minutes before starting it phase separation. Several small water–rich droplets are formed inside an ethanol–rich droplet that are finally pushed out of the larger ethanol–rich droplet. The ethanol–rich droplets spread on the surface after separation, while the water–rich droplets typically continue to locomote, cf. Fig. 1d. These self–propelling water–rich droplets are still containing a non-negligible quantity of ethanol being able to deliver the cargo. However this type of multi-droplet cargo delivery is hardly controllable.
All these variants can be combined with selective DNA extraction, as the DNA extraction is only enabled in the presence of M sodium acetate. Because the presence of salt reduced the DNA solubility in water, and therefore the DNA precipitates and extracts into the ethanol–rich trailing droplet during the phase separation. It results, that the final cargo content can be selectively controlled by the initial chemical composition of the droplet. In particular, the different value of delay time before the phase separation, are controlling the brownian distance travel by the droplet before starting the process of cargo-delivery. In total, three different types of cargo delivery scenarios could be time controlled and programmed just depending on the initial chemical composition Suppmatt .
II.2 Figures
III Material and Method
To fabricate the observation chambers, glass slides were cut into squares of about () cm2 and were pre-cleaned by sonication in ethanol, acetone and toluene for 10 min each. The glass squares were blow-dried with nitrogen gas after each cleaning step. After this pre-cleaning they are immersed for 30 min in Piranha etch (50 vol.% sulfuric acid (98 %) and 50 vol.% hydrogen peroxide (30 vol.%). After that, the glass squares were thoroughly rinsed with hot (80–90)∘ C ultrapure water and immersed in hot water for another 15 min. Subsequently, the glass squares were again blow-dried with nitrogen. The thus cleaned glass squares were coated with octadecyl-trichlorosilane (OTS) by immersing them for 12 min in a solution consisting of 50 ml bicyclohexane, 20–40 drops of carbon tetrachloride, and 5–20 drops of OTS Sagiv1980 ; Lessel2015 . Remains from the OTS solution were removed from the OTS-coated glass by rinsing it with chloroform and blow-drying with nitrogen. The OTS coated glass squares were stacked with a cover slide (thickness 150 m) as a spacer and glued together (epoxy glue).
To conduct an experiment the observation chamber is prefilled with an oil/surfactant mixture and ethanol/water mixture were carefully injected into the reservoir using a glass capillary (20 m inner diameter, connected to a syringe pump. As water/ethanol were leaving the glass capillary, droplets were formed spontaneously. The diameter of the droplets could be controlled between 100 and 150 m. The density of the aqueous phase was always higher than that of the oily phase (0.81 g/ml), even for the highest ethanol concentration (80 vol.%) used. The concentration of monoolein is fixed at 3.5 mg/ml (i.e. 15 mM) if not explicitly mentioned otherwise. In experiments with varying monoolein concentration, the ethanol/water concentration was fixed to 50 vol.%. All chemicals were purchased from Sigma-Aldrich, except the fluorescent lipid that was purchase from Avanti Polar Lipids.
IV Conclusion
We reported a general method to produce artificial self–propelling Janus droplets, which evolve from monoolein stabilized water/ethanol emulsion droplets. These type of active matter is universal and could be achieved also for other surfactants and organic solvents including liqueurs and brandies. During ethanol solubilization, in stage 1, the droplet velocity fluctuates around a constant value revealing a flow field of a weak pusher. The droplet takes up monoolein molecules from the surrounding continuous phase finally leading to a phase separation in stage 2, where the droplet velocity increases and the droplet moves as a neutral squirmer. When the phase separation is completed, a Janus droplet is formed in stage 3 with a leading water–rich droplet and a trailing ethanol–rich droplet. The flow field around this Janus droplet is that of a pair of neutral squirmers and the droplet velocity decays exponentially with time. The chemical potential difference of the monoolein molecules in the bulk of the oil phase and the ethanol phase drives the motion in stage 2 and stage 3. We introduced a theoretical model that captures the relevant driving mechanism and describes qualitatively the characteristic velocity behavior during the stage 2 and stage 3, despite the complexity of the propulsion mechanism.
Due to the phase separation occurring in stage 2, these droplets could be used as a quasi-programmable smart carrier. Macromolecules could be selectively precipitated and delivered at a target location in a single step within a short time, as was demonstrated for DNA delivery at PDMS pillars. Because the droplets self–propelling properties are only controlled by the initial chemical composition, we can realized three different cargo delivery modes in a programmable manner. We expect that the simple strategy reported here allows to design new classes of active emulsions that could be used as smart self–propelling carriers or operators. The combination of this controlled DNA cargo released with microfluidic devices may enable new strategies for droplet digital PCR Hindson2013 , massive droplet DNA barcoding Lan2016 , and gene, or drugs, delivery into cells Chiu2015 .
Acknowledgements.
ML, MB and RS acknowledges funding from SPP1726. The authors thank Frank Cichos, Klaus Kroy, Marcus Melke, Birthe Riechers, Dimitry Fedosov and Stephan Herminghaus for discussions.References
- (1) Parmar, J. et al. Nano and micro architectures for self–propelled motors. Sci. Technol. Adv. Mater. 16, 014802 (2015)
- (2) Baylis, J. R. et al. Self–propelled particles that transport cargo through flowing blood and halt hemorrhage. Science Advances 1, 9 (2015)
- (3) Wang, J. Nanomachines: Fundamentals and Applications Wiley-VCH (2013)
- (4) Purcell, E. M. Life at low Reynolds-number. Am. J. Phys. 45, 11 (1977).
- (5) Lauga, E. Life around the scallop theorem. Soft Matter 7, 3060–3065 (2011).
- (6) Michelin, S., Lauga, E., and Bartolo, D. Spontaneous autophoretic motion of isotropic particles. Phys. Fluids 25, 061701 (2013).
- (7) Jiang, S. et al. Janus Particle Synthesis and Assembly. Advance Material 22, 1060–1071 (2010).
- (8) Xuan, M. et al. Self–Propelled Janus Mesoporous Silica Nanomotors with Sub-100 nm Diameters for Drug Encapsulation and Delivery. ChemPhysChem 15, 2255–2260 (2014).
- (9) Li, J. et al. Self–Propelled Nanomotors Autonomously Seek and Repair Cracks. Nano Lett. 15, 7077–7085 (2015).
- (10) Bormashenko, E. et al. Janus Droplets: Liquid Marbles Coated with Dielectric/Semiconductor Particles. Langmuir 27, 7–10 (2011).
- (11) Jeong, J. et al. Liquid crystal Janus emulsion droplets: preparation, tumbling, and swimming. Soft Matter 11, 6747–6754 (2015).
- (12) Choi, C. H., Weitz, D. A., and Lee, C-S. One Step Formation of Controllable Complex Emulsions: From Functional Particles to Simultaneous Encapsulation of Hydrophilic and Hydrophobic Agents into Desired Position. Advance Material 25, 2536-2541 (2013).
- (13) Guzowski, J. et al. The structure and stability of multiple micro-droplets. Soft Matter 8, 7269-7278 (2012).
- (14) Li, W. et al. Controllable microfluidic fabrication of Janus and microcapsule particles for drug delivery applications RSC Adv., 5, 23181 (2015).
- (15) Efrat, R. et al. Liquid micellar discontinuous cubic mesophase from ternary monoolein/ethanol/water mixtures Colloids and Surfaces A: Physicochem. Eng. Aspects 299, 133–145 (2007).
- (16) Schwarzenberger, K., Pattern formation and mass transfer under stationary Marangoni instability Adv. Coll. Interf. Sci 206, 344–371 (2014).
- (17) Spicer, P. T. et al. Novel process for producing cubic liquid crystalline nanoparticles (cubosomes) Langmuir 17, 5748 (2001).
- (18) Engstrom, S., Alfons, K., Rasmusson, M., and Ljusberg-Wahren. H., Solvent-induced sponge () phases in the solvent-monoolein-water system. Progr Colloid Polym Sci 108, 93–98 (1998).
- (19) Dimova, R., and Lipowsky, R., Wetting-induced budding of vesicles in contact with several aqueous phases. Soft Matter, 8, 6409 (2012)
- (20) Deng, N-N., et al. Wetting-induced formation of controllable monodisperse multiple emulsions in microfluidics. Lab Chip, 13, 4047 (2013)
- (21) Lighthill, M., J., On the squirming motion of nearly spherical deformable bodies through liquids at very small Reynolds numbers. Communications on Pure and Applied Mathematics, 2, 109–118, (1952)
- (22) Blake, J., R., A spherical envelope approach to ciliary propulsion. Journal of Fluid Mechanics, 46, 199 (1971)
- (23) Downton, M., and Stark, H,. Simulation of a model microswimmer. Journal of Physics: Condensed Matter, 21, 204101, (2009)
- (24) Seemann, R., Fleury, J–B., and Maass, C. Self–Propelled Droplets. Eur. Phys. J. Special Topics, 225, 2227–2240, (2016)
- (25) Thutupalli, S., Seemann, R., and Herminghaus, S. Swarming behavior of simple model squirmers. original J. Phys., 7, 073021 (2011)
- (26) Peddireddy, K., et al. Solubilization of Thermotropic Liquid Crystal Compounds in Aqueous Surfactant Solutions. Langmuir 28, 12426, (2012)
- (27) Izri, Z., et al. Self–Propulsion of Pure Water Droplets by Spontaneous Marangoni-Stress-Driven Motion. Phys. Rev. Lett., 113, 248302, (2014)
- (28) Maass, C.,Kruger, C., Herminghaus, H., and Bahr, C,. Swimming Droplets. Annu. Rev. Condens. Matter Phys., 7 6.1-6.23, (2016)
- (29) Zeugin, J., A., and Hartley, J., L., Ethanol Precipitation of DNA. Focus, 4, 1–2 (1985)
- (30) Smalla, K., Cresswell, N., Mendonca-Hagler, L., C., Wolters, A., and Van Elsas, J., D., Rapid DNA extraction protocol from soil for polymerase chain reaction-mediated amplification. Journal of Applied Bacteriology 74, 70–05, (1993)
- (31) Chiu, F. W. Y., et al., A microfluidic toolbox for cell fusion. J. Chem. Technol. Biotechnol. 91, 16–24, (2015)
- (32) Papavassiliou., D. and Alexander G., P, Orbits of swimmers around obstacles arXiv:1407.1337 (2014)
- (33) Sagiv, J., Organized monolayers by adsorption. 1. Formation and structure of oleophobic mixed monolayers on solid surfaces J. Am. Chem. Soc. 102, 95–98 (1980).
- (34) Lessel, M., et al., Self-assembled silane monolayers: an efficient step-by-step recipe for high-quality low energy surfaces Surf. Interf. Anal. 47, 557–564 (2015).
- (35) Hindson, C, M., Absolute quantification by droplet digital PCR versus analog real-time PCR. Nature Methods 10, 1003–1005 (2013).
- (36) Lan, F., Haliburton, John, R,. Yuan, Aaron,. and Abate, Adam, R., Droplet barcoding for massively parallel single-molecule deep sequencing. Nature Communications 7, 11784 (2016).
- (37) Mauri, R., Califano, F., Calvi, E., Gupta, R., and Shinnar, R., Convection-driven phase segregation of deeply quenched liquid mixtures, J. Chem. Phys. 118, 8841–8846 (2003).
- (38) E. D. Siggia, Late stage of spinodal decomposition in binary demixing, Phys. Rev. A, 20, 595–605 (1978).
- (39) See supporting information at [URL will be inserted by publisher].