Flux and polarization variability of OJ 287 during early 2016 outburst
Abstract
The gamma-ray blazar OJ 287 was in a high activity state during December 2015 - February 2016. Coinciding with this high brightness state, we observed this source for photometry on 40 nights in -band and for polarimetry on 9 epochs in bands. During the period of our observations, the source brightness varied between to mag and the degree of polarization () fluctuated between % and % in -band. Focusing on intra-night optical variability (INOV), we find a duty cycle of about 71% using -statistics, similar to that known for blazars. From INOV data, the shortest variability time scale is estimated to be min yielding a lower limit of the observed Doppler factor , the magnetic field strength G and the size of the emitting region cm. On inter-night timescales, a significant anti-correlation between -band flux and is found. The observed at -band is generally larger than that observed at longer wavelength bands suggesting a wavelength dependent polarization. Using -band photometric and polarimetric data from Steward Observatory obtained during our monitoring period we find a varied correlation between and -band brightness. While an anticorrelation is seen between and -band mag at sometimes, no correlation is seen at other times, thereby, suggesting the presence of more than one short-lived shock components in the jet of OJ 287.
=1
1 Introduction
OJ 287 is a well-known BL Lac object that shows featureless continuum spectrum. It has been extensively studied for optical flux variability (Blake, 1970; Andrew et al., 1971; O’Dell et al., 1978). The long term optical light curve shows a well-defined 11.65 years of periodicity between large outbursts (Sillanpaa et al., 1988). Several models have been proposed to explain the periodicity in outburst such as the binary black hole model with the primary having an accretion disk (Sillanpaa et al., 1988, 1996), quasi-periodic oscillations in an accretion disc (Igumenshchev & Abramowicz, 1999), and a binary black hole without relativistic precession (Katz, 1997; Villata et al., 1998; Valtaoja et al., 2000). Among them, a precessing binary black hole in which the secondary black hole affects the accretion disk of the primary is more favorable than others as it predicts more accurately the timing of the major outburst (Sundelius et al., 1997; Valtonen & Ciprini, 2012). OJ 287 has also been studied for polarization variability (Shakhovskoi & Efimov, 1977; Sillanpaa et al., 1991, 1992; Valtaoja et al., 2000; Pursimo et al., 2000; Efimov et al., 2002; Villforth et al., 2009). Sillanpaa et al. (1991), based on the observations carried over six nights, found anticorrelation between flux and polarization variations which they explained as a result of highly rotating plasma inside a relativistic jet. However, Villforth et al. (2009) did not find any clear correlation between flux and polarization. From long term (year time scale) photopolarimetric observations, Efimov et al. (2002) noticed rapid continuous rotation of the position angle of about 4.92 degrees/day in clockwise direction suggesting a helical magnetic field jet structure. OJ 287 is also known to show variability and flares at GeV -ray energy (Ciprini et al., 2009; Escande & Schinzel, 2011; Neronov & Vovk, 2011; Agudo et al., 2011).
OJ 287 was predicted to have a major outburst in 2015 by Valtonen et al. (2011). In line with the prediction, many episodes of flaring behavior were noted since December 2015. Shappee et al. (2015) and Valtonen et al. (2016) reported a strong optical flare on 05 December 2015, wherein they found an increase in brightness of about 1.5 mag. The WEBT/GASP project (Larionov et al., 2015) reported that the source reached maximum brightness in the -band on 04 December 2015. During the same period, enhanced brightness was also reported by the SMARTS monitoring program (MacPherson et al., 2015) and also independently by Valtonen et al. (2015). In the X-ray band too, Swift/XRT observations (Wierzcholska & Siejkowski, 2015; Ciprini et al., 2015; Valtonen et al., 2016) found the source in a high brightness level on 05 December 2015. The source was again detected in a flaring activity on 05 February 2016 (Zola et al., 2016).
We have been monitoring OJ 287 repeatedly for photometric and polarimetric variations since January 2016 (Paliya et al., 2016; Muneer et al., 2016). Here, we present our new -band photometric observations obtained during 40 nights from 07 January 2016 to 11 April 2016 including 21 nights of intra-night optical variability (INOV) as well as polarimetry including the ones already reported by us in Paliya et al. (2016) and Muneer et al. (2016), and -band intra-night polarization variability (INPV) on 3 nights. The main motivation behind this monitoring is to understand (i) the INOV nature of the source in its recent flaring state and (ii) the relation between total flux and polarization characteristics of the source. The paper is organized as follows. In Section 2 we present our observations and analysis, the results of our monitoring are reported in Section 3, followed by the discussion in Section 4. We summarize our results in Section 5. We adopt a cosmology and .
2 Observation and data reduction
2.1 Photometry
Photometric observations in -band were carried out with a 1k 1k CCD attached to the 0.75-m telescope at the Vainu Bappu Observatory (VBO) in Kavalur, India. The CCD has a pixel size of 24 microns, image scale of /pixel, gain of 1.01 e- ADU-1 and readout noise of 11.51 e-. Due to weather constraints, on some nights we were able to get only few points but on 21 nights we obtained more than 20 frames which allowed us to study INOV of the source. The source was suitably placed in the CCD so as to get at least three comparison stars given in Fiorucci & Tosti (1996). The log of the photometric observations is given in Table LABEL:Table:log. The images were analyzed using standard procedures in IRAF111IRAF is by the Association of Universities for Research in Astronomy, Inc. under cooperative agreement with the National Science Foundation.. To get the optimum aperture for aperture photometry we followed the procedure described in Stalin et al. (2004).
2.2 Polarimetry
Polarimetric observations were carried out on a total of 9 nights, of which on 6 nights single epoch multi-band observations were performed and on three nights continuous monitoring was done in -band. For polarimetric observations, two telescopes were used, one the 104 cm telescope, located at VBO and the other the 104 cm Sampurnand telescope located at the Aryabhatta Research Institute for Observational Sciences (ARIES), Nainital. At the telescope in VBO, a three-band, double beam photo-polarimeter was used, the details of which can be found in Srinivasulu et al. (2015). We used diaphragm of 20′′ diameter for the observations. In addition to the bands, we also obtained polarimetric measurements in the light integrated in the spectral region; we refer to this band as . At ARIES, the ARIES Imaging Polarimeter (AIMPOL, Medhi et al. 2007) was used. A detailed description of AIMPOL and the techniques of polarization measurements may be found in (Ramaprakash et al., 1998; Rautela et al., 2004; Neha et al., 2016). All polarimetric data are presented in Table 2.
3 Results
3.1 Intra-night optical variability (INOV)
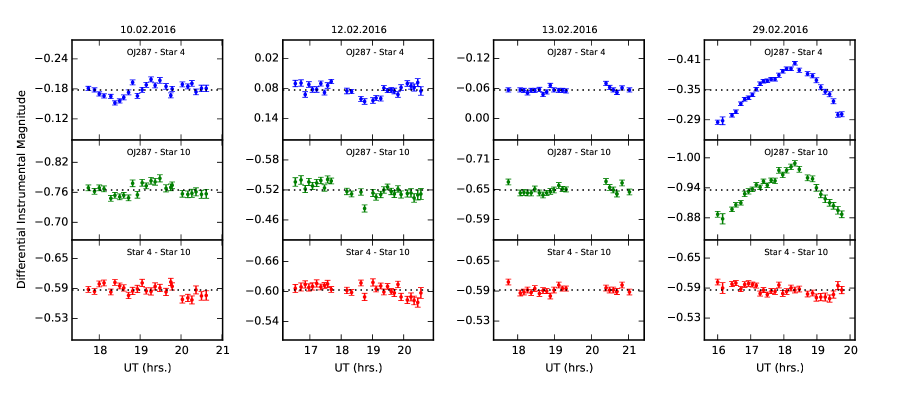
To study INOV, we restricted to only observations carried out for a minimum of about two hours so as to ensure the availability of a sufficient number of photometric points to characterize INOV. DLCs of the OJ 287 was generated relative to two comparison stars present on the same CCD frame as described in Section 2. We note that the chosen optimum aperture for photometry on each night is often close to the median FWHM and the host galaxy has negligible effects in our photometry (Cellone et al., 2000). Some DLCs are shown in Figure 1. In the star-star DLCs (with the comparison stars having similar brightness to OJ 287) at certain epochs, deviant points are noticed due to non-photometric sky conditions. Such data points are identified if they are greater than 2, where is the standard deviation of the star-star DLCs. The number of such deviant points that are removed amounts to maximum of two data points each in less than half a dozen of observing nights. To ascertain the variability nature of OJ 207 on any given night, we have employed three criteria outlined below.
One method is based on the parameter given by Jang & Miller (1997). It is defined as the ratio of the standard deviation of the source-comparison star () and the comparison stars () DLCs and is given as . As the DLCs of OJ 287 were generated relative to two comparison stars, we obtained two values of . The source is considered variable only when both the values of (see, Paliya et al., 2013).
As an alternative to the widely used -statistics, de Diego (2010) proposed the -statistics. It is defined as the ratio of the variance of source-comparison star () and the comparison stars () DLCs and is given by . To find the variability on any given night using value, we compared both the values (relative to the two comparison stars) with the critical value, , where is the significance level and is the degrees of freedom ( where is the number of data points in the DLC). Following Paliya et al. (2013), we used , which corresponds to a probability . The source is considered to be variable only if both the values are greater than .
We also used -statistics (Kesteven et al., 1976) to characterize INOV. According to this, if the value of a DLC exceeds the critical value, , with significance , then the source is considered variable. -statistics is defined by
| (1) |
Here is the error of the measurement , and is defined as
| (2) |
We calculated the amplitude of variability (, Romero et al. 1999) from the DLCs as . Here, and are the maximum and the minimum in the DLC of OJ 287 relative to the comparison stars and is the variance of the star-star DLC. Thus, corresponding to the two DLCs of the source with respect to the two comparison stars, we have two values of on each night. The results of the , and -statistics and for all the 21 DLCs are given in Table 3.
We also estimated the duty cycle () of INOV of OJ 287 using the definition of Romero et al. (1999),
| (3) |
where is the duration of the monitoring session of the source on the night after cosmological redshift () correction. If INOV is detected then , otherwise . We find an INOV % when variability was characterized using -statistics. However, using -statistics the increased to 45%, and further increased to 71 % considering -statistics. This enhanced is similar to what is known for blazars (Stalin et al., 2004).
We calculated the minimum variability time scale in our INOV data as following the definition given by Burbidge et al. (1974). Here, is the time difference between any two flux measurements and . From our observed DLCs we calculated all possible time differences for all allowable pairs of observations for which . From the ensemble of values, the minimum time scale is obtained as . Here, runs from 1 to , and runs from to , where is the total number of data points. The uncertainties in the values are determined by propagating the errors in the flux measurements (Bevington, 1969). Using this method on all the DLCs where INOV is detected we find a minimum of min in the observations done on 07 April 2016.
3.2 Long-term optical variability (LTOV)
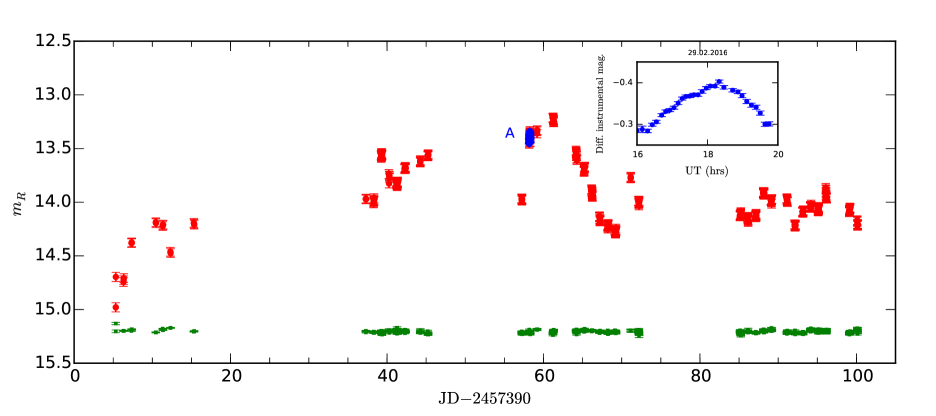
The time span of our monitoring program is large enough to search for LTOV. The LTOV light curve of OJ 287 from 07 January 2016 to 11 April 2016 is shown in Figure 2. The magnitude of OJ 278 was calibrated using the three standard stars as mentioned in section 3.1. Figure 2 shows OJ 287 is variable on day like time scale. During our monitoring program a change of about 2 mag was found within a few days.
3.3 Polarization variability
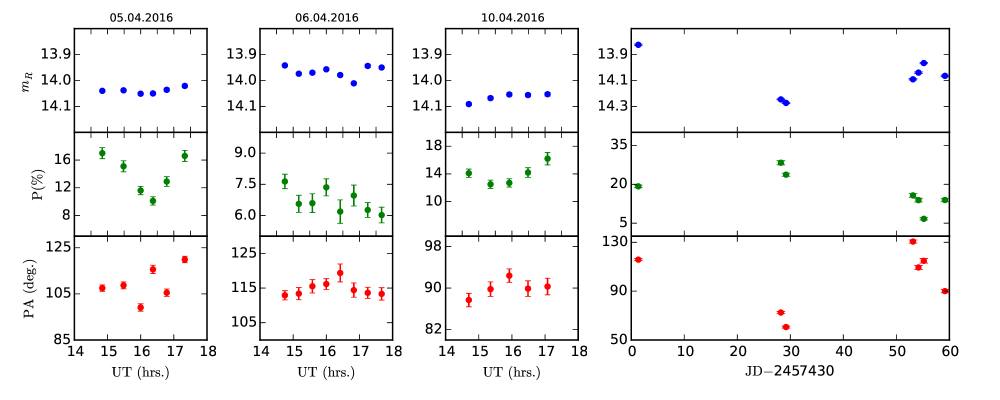
Intra-night polarization variability (INPV) of OJ 287 has been studied earlier by Villforth et al. (2009) who found about 16 % polarization. On the nights of 05, 06 and 10 April 2016, we have sufficient data points in -band to characterize the INPV of OJ 287. The polarization properties displayed by the source on those three nights are plotted in the 1st three panels of Figure 3. We also have in total 7 epochs of -band polarization measurements between February and April 2016. These observations are shown in the last panel of Figure 3. When more than one measurements are available on any particular night, we have taken their average value to study Long-term polarization variability (LTPV). From this Figure, it is clear that the source has shown INPV as well as LTPV.
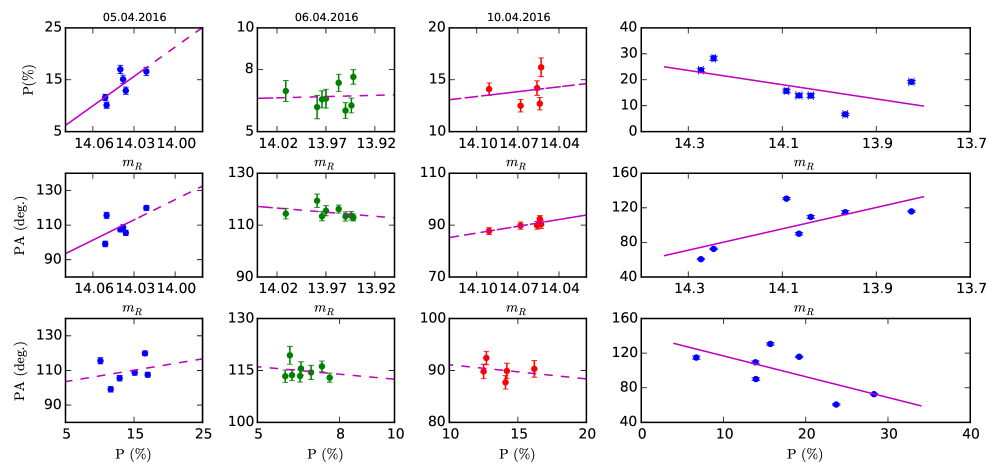
We also studied the correlation between different observed quantities and the results are shown in Figure 4. The solid lines in these Figures are the linear least-squares fit to the data. A correlation between brightness and is found on 05 April 2016. Less INPV was observed on 06 April 2016 with changing by only 1.5 % while changed by about 7 degrees. On 10 April 2016, the source becomes fainter by about 0.2 mag than its brightness on 06 April 2016, however, increased by 7% and decreased by about 20 degrees.
On the LTPV, we find a clear anticorrelation between source brightness and . However, is found to be correlated with brightness. We also find a negative correlation between and . Similar results have been found by Sillanpaa et al. (1991). The statistics of the correlation analysis between the photometric and polarimetric properties of OJ 287 are shown in Table 4.
To characterize INPV in our data we used the -statistics (see section 3.1). We considered the source as variable in polarization if value exceeds the critical value with significance . The fractional variability (FV) index of the source is defined by
| (4) |
Here, and are the maximum and minimum amplitude of variations in both and . The results of INPV are given in Table 5. The of INPV is found to be 81 %, which is similar to the of about 77 % found by Andruchow et al. (2005) for radio selected BL Lacs for which OJ 287 belongs to.
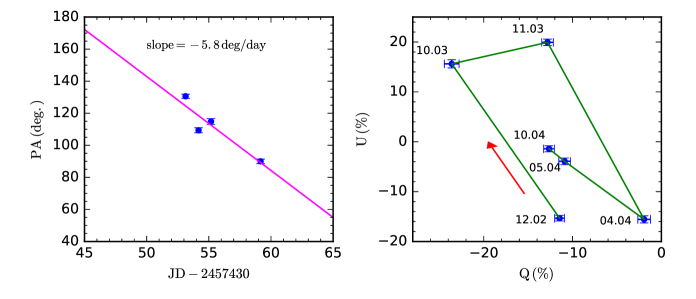
Figure 5 shows the long term variation of observed in the month of April 2016. Linear least squares fit to the data gives a rotation rate of 5.8 degree/day. This rate is close to the rate of 4.92 degree/day, found by Efimov et al. (2002). The observed Q and U parameters are plotted in Figure 5. The average values of Q and U are % and % respectively. This deviates from the origin implying the presence of a stable polarized component (see, Jones et al., 1985).
3.4 Wavelength dependent polarization (WDP)
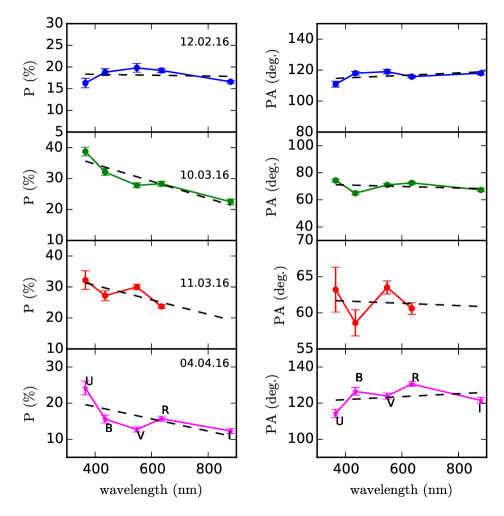
On few epochs, we have polarization observations in bands. The multi-band polarization variations are shown in Figure 6. During all the epochs except that on 12 February 2016, in -band is larger than the other bands and thus OJ 287 showed WDP. The variation of as a function of wavelength for different nights is shown in Figure 6. From the Figure, it is clear that on some epochs, both and decreases with wavelength, although the anticorrelation of and wavelength is stronger than with wavelength.
4 Discussion
OJ 287 has shown remarkable optical flux and polarization variations during its recent bright state in December 2015 April 2016. We find the source to show large amplitude and high duty cycle of INOV. A large amplitude flare (0.12 mag) with a slow rise and fast declining pattern was found on 29 February 2016. Though the exact mechanisms for the cause of INOV are not known, the observations reported here can be used to put constraints on the physical characteristics of the source. From our INOV observations, we find the shortest time scale of variability, of min on 07 April 2016 that sets an upper limit on the size of the emission region, cm, where is the Doppler factor.
We estimated the observed Doppler factor, , based on relativistic beaming model (Marscher & Scott, 1980; Aharonian et al., 2007; Xiang & Dai, 2007). Following Bessell (1979), the observed monochromatic flux () is calculated from the apparent -band magnitude () of OJ 287 (see Figure 2) as . The observed source-frame monochromatic luminosity () at the frequency (considering as the -band frequency) is calculated from using
| (5) |
where the luminosity distance , and are the effective central wavelengths of and band respectively, and is the spectral index. We used , which is the average spectral index found by Efimov et al. (2002). Though blazars show spectral variations, the value of used here is similar to the value found for OJ 287 and other blazars from power law fits to broad band optical data (Williamson et al., 2014).
Following Elvis et al. (1994), we estimated the observed bolometric luminosity as where is the -band frequency. Considering the fact that any strong outburst having energy must occur on timescale larger than (light crossing time of ), the inferred efficiency of accretion, can be calculated as (Fabian & Rees, 1979). For our observed min, we find min, during which the bolometric luminosity has changed by corresponding to . In the case of disk accretion, a rapidly rotating black hole has an intrinsic value of accretion efficiency () less than about 0.3 (Frank et al., 1986). As our calculated value is greater than 0.1, the observed INOV is due to relativistic beaming.
The can be computed from the relationships of and (Frank et al., 1986; Zhang et al., 2002), and using and we find
| (6) |
where ‘’ and ‘’ refer to the observed and intrinsic values. Since the value of can be between 0.007 (nuclear reaction) to 0.32 (maximum accretion), we used (a geometric mean value) in the above equation and found . Using this and observed of 142 min, we found cm.
Considering that the variable emission seen in OJ 287 is due to synchrotron processes, and requiring that to be shorter than the synchrotron lifetime of the relativistic electrons in the observer frame (Hagen-Thorn et al., 2008), the magnetic field () can be estimated as
| (7) |
Using the observed and , we find G. However, using (Baliyan et al., 1996; Neronov & Vovk, 2011; Marscher & Jorstad, 2011), we find cm and G. A Doppler factor of 17 has been reported by Aller et al. (2014) based on fits to monitoring observations of OJ 287 in the radio band. Using we obtain G, which is close to the value of 0.93 G found in the OJ 287 by Baliyan et al. (1996).
Analysis of the long term variation of based on our limited polarimetric observations give a rotation rate of 5.8 degrees/day, similar to the value of 4.92 degree/day found by Efimov et al. (2002). This is also in general agreement with the recent results obtained from dedicated optical polarimetric monitoring of blazars, which indicates that the rotation of the plane of optical polarization is a characteristics property of blazars (Blinov et al., 2016). The same set of polarimetric observations also find differences in the polarization properties of different sub-classes of blazars (Angelakis et al., 2016). In our polarimetric observations, shown in Figure 6, for most of the epochs we find to decrease with wavelength. This is similar to that noted by Takalo et al. (1994), however, inconsistent with that observed by Tommasi et al. (2001). The observed WDP can be explained in terms of a two-component model identified with the jet that gives rise to the constant polarized component and the shock that gives rise to the more polarized component (Valtaoja et al., 1991). The presence of this stable polarized component is also evident in the position of the average Q and U values that deviate from zero in the Q vs U plane as seen in Figure 5.
If the accretion disk/host galaxy contributes significantly to the optical emission (in addition to the synchrotron jet emission) of OJ 287, one would have expected higher polarization at longer wavelengths (Malkan & Sargent, 1982; Smith et al., 1986). This is not observed in any of our data except that obtained on 12 February 2016 during which epoch the source was in an intermediate brightness state. Also, in the broadband SED of OJ 287, emission from the accretion disk is not prominent (Massaro et al., 2003). Moreover, OJ 287 is a highly core dominated object222The ratio of core to extended emission is 995 (Antonucci & Ulvestad, 1985). and thus, the contribution of accretion disk to the optical emission of OJ 287 is insignificant. Alternatively, in the binary black hole model of OJ 287, thermal flares are expected when the secondary black hole crosses the accretion disk of the primary black hole. Observations do indicate that such outbursts are not accompanied by increased optical polarization. However, secondary outbursts after the major one do show a correlated behavior in polarization as well, which could be due to the jet of the secondary black hole getting activated. Our polarization observations reported here are during February - April 2016, much later than the thermal outburst of December 2015 (Valtonen et al., 2016). This along with other observational evidences outlined above indicate that the polarization emission during our observations of OJ 287 is mainly due to synchrotron processes happening in the jet of the source.
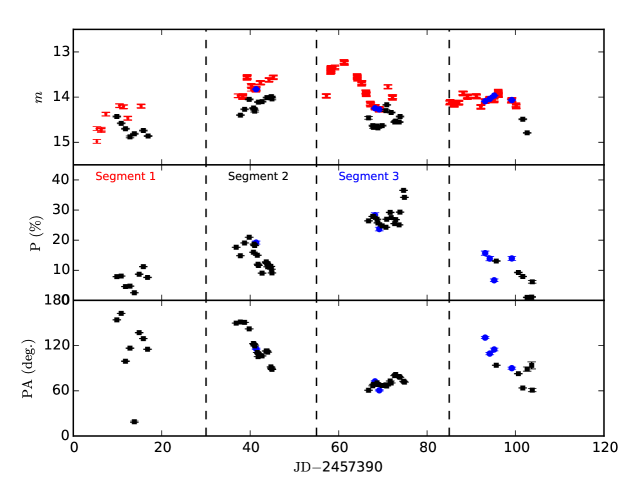
The LTPV observations show a clear anticorrelation between and optical brightness as well as between and . These results agree with the polarization monitoring of OJ 287 by Sillanpaa et al. (1991). However, D’arcangelo et al. (2009) noticed a positive correlation between polarization and brightness which is contrary to what we have found. To check for the robustness of our results we looked for the availability of photometric and polarimetric data during the period of our observation. From the Fermi monitoring program of Steward Observatory (Smith et al., 2009) supporting the Fermi mission all-sky survey, we collected 48 epochs of polarimetric and 34 epochs of -band photometric data between the period 12 January 2016 and 15 April 2016. The data set along with our observations are shown in Figure 7. The data set is divided into four segments based on the seasonal gaps (as shown by dotted lines) for detailed correlation analysis between flux and polarization variations.
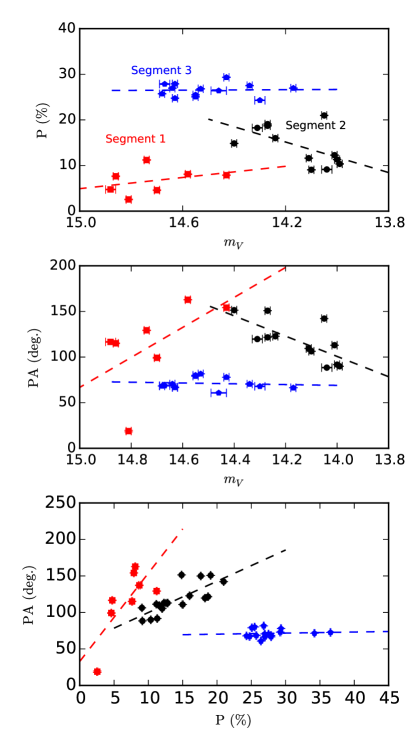
In Figure 8, we show the observed relation between flux and polarization behavior of the source for the first three segments. The correlation between these quantities in segment 4 is shown in Figure 4 as the Steward observations have only two epochs of data in this segment. From Figures 8 and 4 it is evident that the brightness of the source positively correlates with polarization during segment 1 (January 2016), correlates negatively during segment 2 (February 2016) and segment 4 (April 2016) and not show any trend during segment 3 (March 2016). The positively correlates with in segments 1 and 2, however, correlates negatively in segment 4 and no correlation in segment 3. The results of the correlation analysis are given in Table 6.
In the shock-in-jet model of blazar variability, a positive correlation between flux and polarization variations is expected (Marscher & Gear, 1985) which could be due to the magnetic field getting aligned because of the shock. Alternatively, if the flux variability is due to the emergence of a new blob of plasma (identified as a VLBI scale knot) which has either a chaotic magnetic field or a magnetic field that is misaligned with the large scale field, an anticorrelation between flux and polarization variations can be expected (Hagen-Thorn et al., 2002; Homan et al., 2002). The observed correlation and anticorrelation between total flux and polarized flux can also be explained by changes in the trajectories of the shocks propagating down the relativistic jets as postulated in the “swinging jets” model of Gopal-Krishna & Wiita (1992). From the observations of OJ 287 reported here we find varied behavior between flux and polarization variations, which could happen because of the presence of more than one emission region in the jet of OJ 287 (Marscher et al., 2008) or due to the interaction between the jet and accretion disk (Valtonen et al., 2008, 2016). Near simultaneous flux and polarization observations of blazars are very limited and observations on a large sample of blazars are needed, which will give important leads to our understanding on the emission processes in blazars.
5 Conclusions
We have carried out photometric (40 nights) and polarimetric (9 epochs) observations of OJ 287 coinciding with its high brightness state during December 2015 February 2016. The key findings are summarized below:
-
1.
From 21 nights of INOV observations we found the source to show INOV on few nights. Using -statistics we found the of INOV as 30 %, which increases to 45% and 71 % on using the -statistics and -statistics respectively. On nights when INOV is observed, is larger than 3%. The observed large amplitude ( 3%) and high of INOV are similar to that known for blazars.
-
2.
We find the shortest flux variability time scale of min on April 07, 2016. Using this we put constraints on the size of the emitting region and magnetic field strength as () cm and 3.8 (1.8) G using (10) respectively.
-
3.
Considering LTOV, we find that OJ 287 has varied by about 2 mag during the period of our observations. During this period, it showed a maximum and minimum brightness of 13.20 0.04 mag and 14.98 0.04 mag respectively. A change of 1 mag was noticed in March within 10 days.
-
4.
From polarimetric observations, we find OJ 287 showed both INPV and LTPV. Considering the polarization variations during February to April 2016, minimum and maximum of 6 0.3 % and 28.3 0.8 % in -band was observed. During the same period varied between 60.6 0.8 degrees and 130.6 1.3 degrees respectively.
-
5.
In U v/s Q plane, the average Q and U deviate from zero, indicating the presence of two optically thin synchrotron emission components contributing to the polarized emission from OJ 287 jet.
-
6.
The in different wavebands are correlated, with the polarization at shorter wavelengths generally larger than at longer wavelengths, thus showing a wavelength dependent polarization behavior. This demands that the observed polarization is due to synchrotron process happening in the jet of the source.
-
7.
During most of the observing period an anticorrelation is observed between flux and polarization variations. A wide variety of correlations are also noticed between and as well as between and brightness. Such a variety of relations observed between flux and polarization variations might be because of the presence of more than one emission components in the jet of OJ 287.
References
- Agudo et al. (2011) Agudo, I., Jorstad, S. G., Marscher, A. P., et al. 2011, ApJ, 726, L13
- Aharonian et al. (2007) Aharonian, F., Akhperjanian, A. G., Bazer-Bachi, A. R., et al. 2007, ApJ, 664, L71
- Aller et al. (2014) Aller, M. F., Hughes, P. A., Aller, H. D., Latimer, G. E., & Hovatta, T. 2014, ApJ, 791, 53
- Andrew et al. (1971) Andrew, B. H., Harvey, G. A., & Medd, W. J. 1971, Astrophys. Lett., 9, 151
- Andruchow et al. (2005) Andruchow, I., Romero, G. E., & Cellone, S. A. 2005, A&A, 442, 97
- Angelakis et al. (2016) Angelakis, E., Hovatta, T., Blinov, D., et al. 2016, MNRAS, 463, 3365
- Antonucci & Ulvestad (1985) Antonucci, R. R. J., & Ulvestad, J. S. 1985, ApJ, 294, 158
- Baliyan et al. (1996) Baliyan, K. S., Joshi, U. C., & Deshpande, M. R. 1996, Ap&SS, 240, 195
- Bessell (1979) Bessell, M. S. 1979, PASP, 91, 589
- Bevington (1969) Bevington, P. R. 1969, Data reduction and error analysis for the physical sciences
- Blake (1970) Blake, G. M. 1970, Astrophys. Lett., 6, 201
- Blinov et al. (2016) Blinov, D., Pavlidou, V., Papadakis, I., et al. 2016, MNRAS, 462, 1775
- Burbidge et al. (1974) Burbidge, G. R., Jones, T. W., & Odell, S. L. 1974, ApJ, 193, 43
- Cellone et al. (2000) Cellone, S. A., Romero, G. E., & Combi, J. A. 2000, AJ, 119, 1534
- Ciprini et al. (2009) Ciprini, S., Gasparrini, D., Reyes, L. C., et al. 2009, The Astronomer’s Telegram, 2256
- Ciprini et al. (2015) Ciprini, S., Perri, M., Verrecchia, F., & Valtonen, M. 2015, The Astronomer’s Telegram, 8401
- D’arcangelo et al. (2009) D’arcangelo, F. D., Marscher, A. P., Jorstad, S. G., et al. 2009, ApJ, 697, 985
- de Diego (2010) de Diego, J. A. 2010, AJ, 139, 1269
- Efimov et al. (2002) Efimov, Y. S., Shakhovskoy, N. M., Takalo, L. O., & Sillanpää, A. 2002, A&A, 381, 408
- Elvis et al. (1994) Elvis, M., Wilkes, B. J., McDowell, J. C., et al. 1994, ApJS, 95, 1
- Escande & Schinzel (2011) Escande, L., & Schinzel, F. K. 2011, The Astronomer’s Telegram, 3680
- Fabian & Rees (1979) Fabian, A. C., & Rees, M. J. 1979, in X-ray Astronomy, ed. W. A. Baity & L. E. Peterson, 381–398
- Fiorucci & Tosti (1996) Fiorucci, M., & Tosti, G. 1996, A&AS, 116, 403
- Frank et al. (1986) Frank, J., King, A. R., & Raine, D. J. 1986, S&T, 71, 579
- Gopal-Krishna & Wiita (1992) Gopal-Krishna, & Wiita, P. J. 1992, A&A, 259, 109
- Hagen-Thorn et al. (2008) Hagen-Thorn, V. A., Larionov, V. M., Jorstad, S. G., et al. 2008, ApJ, 672, 40
- Hagen-Thorn et al. (2002) Hagen-Thorn, V. A., Larionova, E. G., Jorstad, S. G., Björnsson, C.-I., & Larionov, V. M. 2002, A&A, 385, 55
- Homan et al. (2002) Homan, D. C., Ojha, R., Wardle, J. F. C., et al. 2002, ApJ, 568, 99
- Igumenshchev & Abramowicz (1999) Igumenshchev, I. V., & Abramowicz, M. A. 1999, MNRAS, 303, 309
- Jang & Miller (1997) Jang, M., & Miller, H. R. 1997, AJ, 114, 565
- Jones et al. (1985) Jones, T. W., Rudnick, L., Aller, H. D., et al. 1985, ApJ, 290, 627
- Katz (1997) Katz, J. I. 1997, ApJ, 478, 527
- Kesteven et al. (1976) Kesteven, M. J. L., Bridle, A. H., & Brandie, G. W. 1976, AJ, 81, 919
- Larionov et al. (2015) Larionov, V. M., Arkharov, A. A., Efimova, N. V., Klimanov, S. A., & Di Paola, A. 2015, The Astronomer’s Telegram, 8374
- MacPherson et al. (2015) MacPherson, E., Isler, C. J., Urry, M., et al. 2015, The Astronomer’s Telegram, 8382
- Malkan & Sargent (1982) Malkan, M. A., & Sargent, W. L. W. 1982, ApJ, 254, 22
- Marscher & Gear (1985) Marscher, A. P., & Gear, W. K. 1985, ApJ, 298, 114
- Marscher & Jorstad (2011) Marscher, A. P., & Jorstad, S. G. 2011, ApJ, 729, 26
- Marscher & Scott (1980) Marscher, A. P., & Scott, J. S. 1980, PASP, 92, 127
- Marscher et al. (2008) Marscher, A. P., Jorstad, S. G., D’Arcangelo, F. D., et al. 2008, Nature, 452, 966
- Massaro et al. (2003) Massaro, E., Giommi, P., Perri, M., et al. 2003, A&A, 399, 33
- Medhi et al. (2007) Medhi, B. J., Maheswar, G., Brijesh, K., et al. 2007, MNRAS, 378, 881
- Muneer et al. (2016) Muneer, S., Stalin, C. S., Venkataramana, A. K., & Baskar, R. 2016, The Astronomer’s Telegram, 8806
- Neha et al. (2016) Neha, S., Maheswar, G., Soam, A., Lee, C. W., & Tej, A. 2016, A&A, 588, A45
- Neronov & Vovk (2011) Neronov, A., & Vovk, I. 2011, MNRAS, 412, 1389
- O’Dell et al. (1978) O’Dell, S. L., Puschell, J. J., Stein, W. A., & Warner, J. W. 1978, ApJS, 38, 267
- Paliya et al. (2016) Paliya, V. S., Muneer, S., Venkataramana, C. S. S. A. K., et al. 2016, The Astronomer’s Telegram, 8697
- Paliya et al. (2013) Paliya, V. S., Stalin, C. S., Kumar, B., et al. 2013, MNRAS, 428, 2450
- Pursimo et al. (2000) Pursimo, T., Takalo, L. O., Sillanpää, A., et al. 2000, A&AS, 146, 141
- Ramaprakash et al. (1998) Ramaprakash, A. N., Gupta, R., Sen, A. K., & Tandon, S. N. 1998, A&AS, 128, 369
- Rautela et al. (2004) Rautela, B. S., Joshi, G. C., & Pandey, J. C. 2004, Bulletin of the Astronomical Society of India, 32, 159
- Romero et al. (1999) Romero, G. E., Cellone, S. A., & Combi, J. A. 1999, A&AS, 135, 477
- Shakhovskoi & Efimov (1977) Shakhovskoi, N. M., & Efimov, I. S. 1977, Izvestiya Ordena Trudovogo Krasnogo Znameni Krymskoj Astrofizicheskoj Observatorii, 56, 39
- Shappee et al. (2015) Shappee, B. J., Stanek, K. Z., Holoien, T. W.-S., et al. 2015, The Astronomer’s Telegram, 8372
- Sillanpaa et al. (1988) Sillanpaa, A., Haarala, S., Valtonen, M. J., Sundelius, B., & Byrd, G. G. 1988, ApJ, 325, 628
- Sillanpaa et al. (1991) Sillanpaa, A., Takalo, L. O., Kikuchi, S., Kidger, M., & de Diego, J. A. 1991, AJ, 101, 2017
- Sillanpaa et al. (1992) Sillanpaa, A., Takalo, L. O., Nilsson, K., Kidger, M., & de Diego, J. A. 1992, A&A, 254, L33
- Sillanpaa et al. (1996) Sillanpaa, A., Takalo, L. O., Pursimo, T., et al. 1996, A&A, 315, L13
- Smith et al. (1986) Smith, P. S., Balonek, T. J., Heckert, P. A., & Elston, R. 1986, ApJ, 305, 484
- Smith et al. (2009) Smith, P. S., Montiel, E., Rightley, S., et al. 2009, ArXiv e-prints, arXiv:0912.3621
- Srinivasulu et al. (2015) Srinivasulu, G., Raveendran, A. V., Muneer, S., et al. 2015, ArXiv e-prints, arXiv:1505.04244
- Stalin et al. (2004) Stalin, C. S., Gopal Krishna, Sagar, R., & Wiita, P. J. 2004, Journal of Astrophysics and Astronomy, 25, 1
- Sundelius et al. (1997) Sundelius, B., Wahde, M., Lehto, H. J., & Valtonen, M. J. 1997, ApJ, 484, 180
- Takalo et al. (1994) Takalo, L. O., Sillanpaeae, A., & Nilsson, K. 1994, A&AS, 107
- Tommasi et al. (2001) Tommasi, L., Palazzi, E., Pian, E., et al. 2001, A&A, 376, 51
- Valtaoja et al. (2000) Valtaoja, E., Teräsranta, H., Tornikoski, M., et al. 2000, ApJ, 531, 744
- Valtaoja et al. (1991) Valtaoja, L., Sillanpaa, A., Valtaoja, E., Shakhovskoi, N. M., & Efimov, I. S. 1991, AJ, 101, 78
- Valtonen & Ciprini (2012) Valtonen, M., & Ciprini, S. 2012, Mem. Soc. Astron. Italiana, 83, 219
- Valtonen et al. (2015) Valtonen, M., Zola, S., Gopakumar, A., et al. 2015, The Astronomer’s Telegram, 8378
- Valtonen et al. (2011) Valtonen, M. J., Mikkola, S., Lehto, H. J., et al. 2011, ApJ, 742, 22
- Valtonen et al. (2008) Valtonen, M. J., Lehto, H. J., Nilsson, K., et al. 2008, Nature, 452, 851
- Valtonen et al. (2016) Valtonen, M. J., Zola, S., Ciprini, S., et al. 2016, ApJ, 819, L37
- Villata et al. (1998) Villata, M., Raiteri, C. M., Sillanpaa, A., & Takalo, L. O. 1998, MNRAS, 293, L13
- Villforth et al. (2009) Villforth, C., Nilsson, K., Østensen, R., et al. 2009, MNRAS, 397, 1893
- Wierzcholska & Siejkowski (2015) Wierzcholska, A., & Siejkowski, H. 2015, The Astronomer’s Telegram, 8395
- Williamson et al. (2014) Williamson, K. E., Jorstad, S. G., Marscher, A. P., et al. 2014, ApJ, 789, 135
- Xiang & Dai (2007) Xiang, Y., & Dai, B.-Z. 2007, PASJ, 59, 1061
- Zhang et al. (2002) Zhang, L. Z., Fan, J.-H., & Cheng, K.-S. 2002, PASJ, 54, 159
- Zola et al. (2016) Zola, S., Debski, B., Goyal, A., et al. 2016, The Astronomer’s Telegram, 8667
| Date | Exp. time | Duration | |
| (dd.mm.yyyy) | (s) | (h) | |
| (1) | (2) | (3) | (4) |
| 07.01.2016 | 2 | 300 | 0.2 |
| 08.01.2016 | 3 | 900 | 0.9 |
| Date | Band | JD | ||||
|---|---|---|---|---|---|---|
| (dd.mm.yyyy) | (%) | (%) | (deg.) | (deg.) | ||
| (1) | (2) | (3) | (4) | (5) | (6) | (7) |
| 12.02.2016 | 2457431.3201 | 16.3 | 1.1 | 110.9 | 1.9 | |
| 12.02.2016 | 2457431.3201 | 18.8 | 0.8 | 118.0 | 1.2 | |
| 12.02.2016 | 2457431.3648 | 19.8 | 1.0 | 119.0 | 1.4 | |
| 12.02.2016 | 2457431.3372 | 19.2 | 0.5 | 115.8 | 0.8 | |
| 12.02.2016 | 2457431.3104 | 16.6 | 0.3 | 118.0 | 1.0 | |
| 12.02.2016 | 2457431.2796 | 18.9 | 0.3 | 116.9 | 0.5 | |
| 08.03.2016 | 2457456.2399 | 33.0 | 1.8 | 62.4 | 1.7 | |
| 08.03.2016 | 2457456.2399 | 28.6 | 1.5 | 59.9 | 1.6 | |
| 08.03.2016 | 2457456.1932 | 22.6 | 0.2 | 60.8 | 0.3 | |
| 09.03.2016 | 2457457.1786 | 27.7 | 0.5 | 61.2 | 0.5 | |
| 10.03.2016 | 2457458.2526 | 38.7 | 1.4 | 74.3 | 1.1 | |
| 10.03.2016 | 2457458.2526 | 32.1 | 1.1 | 64.9 | 1.1 | |
| 10.03.2016 | 2457458.2475 | 27.8 | 0.8 | 71.0 | 0.9 | |
| 10.03.2016 | 2457458.2230 | 28.3 | 0.8 | 72.5 | 0.8 | |
| 10.03.2016 | 2457458.2870 | 22.5 | 0.9 | 67.3 | 1.2 | |
| 10.03.2016 | 2457458.2012 | 27.4 | 0.4 | 71.6 | 0.4 | |
| 11.03.2016 | 2457459.2242 | 32.2 | 3.0 | 63.2 | 3.1 | |
| 11.03.2016 | 2457459.2242 | 27.2 | 1.6 | 58.6 | 1.8 | |
| 11.03.2016 | 2457459.2232 | 30.0 | 0.9 | 63.5 | 0.9 | |
| 11.03.2016 | 2457459.1924 | 23.7 | 0.6 | 60.6 | 0.8 | |
| 11.03.2016 | 2457459.1703 | 26.7 | 0.4 | 61.1 | 0.5 | |
| 04.04.2016 | 2457483.1590 | 24.2 | 1.9 | 114.3 | 2.3 | |
| 04.04.2016 | 2457483.1590 | 15.6 | 1.1 | 126.5 | 2.1 | |
| 04.04.2016 | 2457483.1690 | 12.7 | 0.7 | 123.9 | 1.7 | |
| 04.04.2016 | 2457483.1331 | 15.7 | 0.7 | 130.6 | 1.3 | |
| 04.04.2016 | 2457483.2047 | 12.3 | 0.7 | 121.5 | 1.7 | |
| 04.04.2016 | 2457483.1112 | 16.8 | 0.4 | 127.5 | 0.6 | |
| 05.04.2016 | 2457484.1184 | 17.0 | 0.8 | 107.5 | 1.4 | |
| 05.04.2016 | 2457484.1451 | 15.1 | 0.8 | 108.7 | 1.5 | |
| 05.04.2016 | 2457484.1666 | 11.6 | 0.6 | 99.1 | 1.6 | |
| 05.04.2016 | 2457484.1821 | 10.1 | 0.6 | 115.6 | 1.8 | |
| 05.04.2016 | 2457484.1994 | 12.9 | 0.7 | 105.5 | 1.6 | |
| 05.04.2016 | 2457484.2221 | 16.6 | 0.8 | 119.9 | 1.4 | |
| 06.04.2016 | 2457485.1145 | 7.6 | 0.3 | 112.9 | 1.3 | |
| 06.04.2016 | 2457485.1320 | 6.5 | 0.4 | 113.4 | 1.7 | |
| 06.04.2016 | 2457485.1491 | 6.5 | 0.4 | 115.5 | 1.9 | |
| 06.04.2016 | 2457485.1666 | 7.3 | 0.4 | 116.1 | 1.5 | |
| 06.04.2016 | 2457485.1841 | 6.1 | 0.5 | 119.3 | 2.5 | |
| 06.04.2016 | 2457485.2012 | 6.9 | 0.5 | 114.4 | 2.0 | |
| 06.04.2016 | 2457485.2187 | 6.2 | 0.3 | 113.6 | 1.6 | |
| 06.04.2016 | 2457485.2362 | 6.0 | 0.3 | 113.3 | 1.7 | |
| 10.04.2016 | 2457489.1125 | 14.1 | 0.6 | 87.7 | 1.3 | |
| 10.04.2016 | 2457489.1398 | 12.5 | 0.6 | 89.8 | 1.4 | |
| 10.04.2016 | 2457489.1634 | 12.7 | 0.6 | 92.4 | 1.3 | |
| 10.04.2016 | 2457489.1869 | 14.2 | 0.7 | 89.9 | 1.5 | |
| 10.04.2016 | 2457489.2115 | 16.2 | 0.9 | 90.3 | 1.6 |
| Date | 1 | 2 | Status | Status | Status | (hrs.) | ||||||
|---|---|---|---|---|---|---|---|---|---|---|---|---|
| (dd.mm.yyyy) | ( % ) | (%) | ||||||||||
| (1) | (2) | (3) | (4) | (5) | (6) | (7) | (8) | (9) | (10) | (11) | (12) | (13) |
| 10.02.2016 | 4.70 | 4.00 | 1.380 | 1.171 | NV | 1.175 | 1.082 | NV | 163.208 | 42.980 | V | 2.2 |
| 12.02.2016 | 4.00 | 5.80 | 1.026 | 1.365 | NV | 1.013 | 1.168 | NV | 122.299 | 46.963 | V | 3.1 |
| 13.02.2016 | 2.20 | 2.70 | 0.598 | 1.626 | NV | 0.773 | 1.275 | NV | 26.847 | 37.566 | NV | 2.5 |
| 29.02.2016 | 11.80 | 11.10 | 12.912 | 10.753 | V | 3.593 | 3.279 | V | 1932.985 | 48.278 | V | 2.9 |
| 03.03.2016 | 4.70 | 2.10 | 1.325 | 0.308 | NV | 1.151 | 0.555 | NV | 281.167 | 38.932 | V | 2.2 |
| 06.03.2016 | 9.00 | 10.30 | 17.322 | 14.964 | V | 4.162 | 3.868 | V | 1020.255 | 37.566 | V | 2.2 |
| 07.03.2016 | 4.90 | 5.50 | 6.707 | 9.300 | V | 2.590 | 3.050 | V | 284.627 | 34.805 | V | 1.8 |
| 08.03.2016 | 7.20 | 7.20 | 42.775 | 43.884 | V | 6.540 | 6.625 | V | 490.736 | 41.638 | V | 2.0 |
| 09.03.2016 | 4.80 | 4.80 | 9.294 | 7.986 | V | 3.049 | 2.826 | V | 218.527 | 37.566 | V | 1.8 |
| 10.03.2016 | 3.50 | 4.10 | 2.440 | 3.003 | NV | 1.562 | 1.733 | NV | 99.288 | 34.805 | V | 2.3 |
| 11.03.2016 | 3.70 | 3.90 | 3.916 | 4.508 | V | 1.979 | 2.123 | NV | 132.167 | 46.963 | V | 2.8 |
| 27.03.2016 | 3.89 | 2.38 | 1.310 | 0.471 | NV | 1.145 | 0.686 | NV | 29.150 | 38.932 | NV | 2.1 |
| 29.03.2016 | 3.30 | 3.00 | 4.958 | 4.507 | V | 2.227 | 2.123 | NV | 57.634 | 36.191 | V | 1.8 |
| 30.03.2016 | 2.70 | 3.60 | 0.747 | 1.174 | NV | 0.864 | 1.084 | NV | 47.865 | 45.642 | V | 2.5 |
| 31.03.2016 | 2.00 | 2.70 | 1.420 | 2.111 | NV | 1.192 | 1.453 | NV | 27.399 | 40.289 | NV | 2.3 |
| 03.04.2016 | 2.20 | 2.90 | 1.476 | 2.342 | NV | 1.215 | 1.530 | NV | 23.993 | 38.932 | NV | 2.0 |
| 04.04.2016 | 2.40 | 2.40 | 1.027 | 1.262 | NV | 1.013 | 1.123 | NV | 24.070 | 36.191 | NV | 2.0 |
| 05.04.2016 | 3.00 | 3.20 | 0.987 | 1.305 | NV | 0.993 | 1.142 | NV | 37.446 | 42.980 | NV | 2.2 |
| 06.04.2016 | 4.20 | 5.80 | 1.200 | 2.071 | NV | 1.095 | 1.439 | NV | 69.109 | 42.980 | V | 2.1 |
| 07.04.2016 | 10.10 | 10.40 | 14.908 | 13.025 | V | 3.861 | 3.609 | V | 484.825 | 42.980 | V | 2.2 |
| 10.04.2016 | 4.50 | 4.70 | 4.238 | 6.485 | V | 2.059 | 2.547 | NV | 110.030 | 40.289 | V | 2.0 |
.
.
| Date | Parameter | Significance | |
|---|---|---|---|
| (1) | (2) | (3) | (4) |
| All | -0.66 | 0.000 | |
| +0.75 | 0.000 | ||
| -0.62 | 0.001 | ||
| 05.04.2016 | +0.73 | 0.093 | |
| +0.57 | 0.230 | ||
| +0.24 | 0.635 | ||
| 06.04.2016 | +0.04 | 0.909 | |
| -0.33 | 0.416 | ||
| -0.19 | 0.646 | ||
| 10.04.2016 | +0.16 | 0.787 | |
| +0.83 | 0.079 | ||
| -0.24 | 0.694 |
| Date | F.V. | Status | F.V. | Status | ||||||
|---|---|---|---|---|---|---|---|---|---|---|
| (dd.mm.yyyy) | ( % ) | ( ∘ ) | ||||||||
| (1) | (2) | (3) | (4) | (5) | (6) | (7) | (8) | (9) | (10) | (11) |
| 05.04.2016 | 13.24 | 2.552 | 0.255 | 80.230 | V | 109.57 | 6.759 | 0.095 | 117.480 | V |
| 06.04.2016 | 6.73 | 0.539 | 0.119 | 15.701 | NV | 114.39 | 2.015 | 0.028 | 7.478 | NV |
| 10.04.2016 | 13.62 | 1.328 | 0.129 | 15.380 | V | 90.01 | 1.496 | 0.026 | 6.598 | NV |
| Segment | vs | vs | vs |
|---|---|---|---|
| (1) | (2) | (3) | (4) |
| Segment 1 | -0.34 (0.45) | -0.56 (0.19) | 0.74 (0.0327) |
| Segment 2 | 0.55 (0.05) | 0.70 (0.01) | 0.78 (0.0001) |
| Segment 3 | -0.02 (0.92) | 0.10 (0.72) | 0.08 (0.7566) |