Three-dimensional critical phase diagram of the Ising antiferromagnet CeRh2Si2
under intense magnetic field and pressure
Abstract
Using novel instrumentation to combine extreme conditions of intense pulsed magnetic field up to 60 T and high pressure up to 4 GPa, we have established the three-dimensional (3D) magnetic field - pressure - temperature phase diagram of a pure stoichiometric heavy-fermion antiferromagnet (CeRh2Si2). We find a temperature- and pressure-dependent decoupling of the critical and pseudo-metamagnetic fields, at the borderlines of antiferromagnetism and strongly-correlated paramagnetism. This 3D phase diagram is representative of a class of heavy-fermion Ising antiferromagnets, where long-range magnetic ordering is decoupled from a maximum in the magnetic susceptibility. The combination of extreme conditions enabled us to characterize different quantum phase transitions, where peculiar quantum critical properties are revealed. The interest to couple the effects of magnetic field and pressure on quantum-critical correlated-electron systems is stressed.
pacs:
71.27.+a,74.70.Tx,75.30.Kz,75.30.MbI Introduction
The importance of quantum criticality Hertz (1976) has been emphasized for a large variety of electronic materials, ranging from high-temperature - cuprate Valla et al. (1999) and iron-based Shibauchi et al. (2014) - superconductors, heavy-fermion systems Knafo et al. (2009), to low-dimensional quantum magnets Coldea et al. (2010); Merchant et al. (2014), tuned by chemical doping, high pressure, or intense magnetic field. In many of these systems both pressure (or doping) and magnetic field can destabilize a magnetically-ordered phase and lead to critical non-Fermi liquid behaviors Stewart (2001); Cooper et al. (2009). However, the critical properties they induce are not necessarily equivalent. While pressure usually drives to a quantum phase transition between a magnetically-ordered state and a paramagnetic (PM) regime, a magnetic field leads to drastically-different effects caused by the polarization of the magnetic moments along the field direction. The comparison between the effects of magnetic field and pressure on quantum criticality has been scarcely explored so far, mainly due to the experimental challenges of such experiments under combined extreme conditions, to which one should add a third dimension, the temperature. For this purpose, heavy-fermion materials are ideal systems: they present the unique advantage of having low electronic energy scales, which allows their quantum critical properties to be tuned by experimentally-accessible pressures and fields. From now on we will focus on Ce-based anisotropic heavy-fermion antiferromagnets, to which belongs CeRh2Si2 investigated here. In the following, we present the main features of their 3D magnetic phase diagram, drawn schematically in Fig. 1.
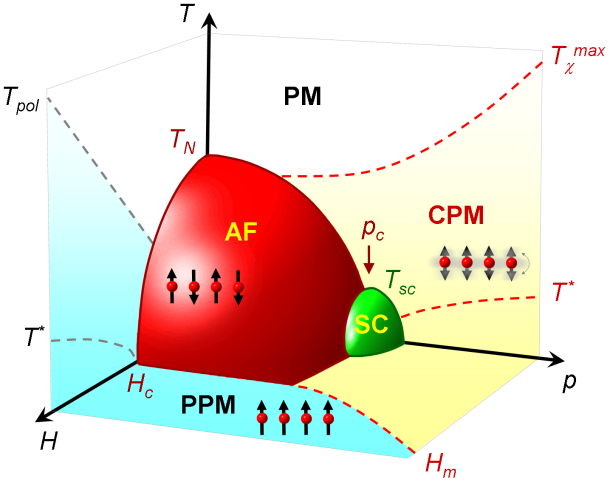
Applied to Ce-based antiferromagnets, pressure can tune the electronic correlations and induce a quantum magnetic phase transition at a critical pressure , where the antiferromagnetic (AF) ordering temperature collapses to zero and is replaced by a correlated paramagnetic (CPM) regime. Well-defined anomalies (for instance steps or kinks in the magnetic susceptibility , the heat capacity , and the electrical resistivity ) are the signature of the phase transitions at and . The onset of the CPM regime is a crossover and consists in a progressive change of the physical properties induced by low-temperature electronic correlations. Strong intersite magnetic fluctuations are generally observed in the CPM regime of anisotropic heavy-fermion paramagnets, indicating the proximity of quantum magnetic instabilities Aoki et al. (2013). Several characteristic temperatures (instead of a unique critical temperature at a phase transition) can be associated with this crossover to the CPM regime. Its setting in leads to a broad maximum of at the temperature , below which almost saturates Aoki et al. (2013); Settai et al. (2007). At low temperature, the relation , where is the Sommerfeld coefficient and is the specific heat, is verified, indicating a Fermi liquid behavior associated with an effective mass Lee et al. (1986). The crossover to the CPM regime also leads to a broad maximum at the temperature in the electronic (non-phononic) contribution to the electrical resistivity, which is related with an inflexion point at a temperature in the resistivity Ohashi et al. (2003). A similarity between the broad anomalies observed at in and at in has been emphasized Scheerer et al. (2012). A Fermi-liquid variation of the resistivity, with a quadratic coefficient , is also generally observed at temperatures below Tsujii et al. (2005). These different temperature scales, with a hierarchy generally observed in heavy-fermion paramagnets (cf. the prototypical heavy-fermion paramagnet CeRu2Si2, where mK Daou et al. (2006) and K Fisher et al. (1991)), are all linked to the crossover into the CPM regime. Fermi-liquid behavior is not restricted to the CPM regime and can be observed inside the antiferromagnetic state. At , passes through a minimum or vanishes, whereas the resistivity coefficient is maximal and may even show a divergence Gegenwart et al. (2008). Driven by quantum criticality, i.e., usually by critical magnetic fluctuations, heavy effective masses can reach up to a thousand times that of the free electrons Flouquet (2005); Löhneysen et al. (2007). In many systems, low-temperature superconductivity mediated by the critical magnetic fluctuations also develops below a temperature in the vicinity of Pfleiderer (2009). Interestingly, in several heavy-fermion antiferromagnets, a broad maximum of susceptibility is observed at a temperature higher than the Néel temperature , indicating a CPM regime preceding the AF ordering Aoki et al. (2013); Settai et al. (2007) (see Fig. 1 at pressures just below ).
Quantum criticality can also be reached by applying magnetic field, which destroys magnetic order and leads to a quantum phase transition to a polarized paramagnet (PPM) regime, above which a large part of the magnetic moments is aligned, at a critical field Aoki et al. (2013); Friedemann et al. (2009). In strongly-anisotropic heavy-fermion antiferromagnets, varies significantly with the field-direction and spin-flop transitions not (a) are forbidden. This contrasts with the case of isotropic or nearly-isotropic antiferromagnets, where is almost-independent of the field direction and where spin-flop transitions Grube et al. (2007) (or crossovers controlled by a spin-flop-like domain alignment Knafo et al. (2007)) can be induced at low field. When the Ising anisotropy is strong, a magnetic field applied along the easy axis induces a first-order metamagnetic transition at . Well-defined anomalies are induced at the transition field in measured physical quantities, such as a jump in the magnetization driven by a sudden polarization of the moments along the field direction Stryjewski and Giordano (1977); Settai et al. (1997), or a sudden step in at low temperature, which is replaced by kink when the temperature is raised Knafo et al. (2010). Similarly to the pressure effect, an enhancement of the resistivity coefficient and a vanishing of have been reported at Gegenwart et al. (2008). In anisotropic heavy-fermion paramagnets, a magnetic field applied along the easy axis also leads to a PPM regime, at a pseudo-metamagnetic field usually noted Aoki et al. (2013); not (b). corresponds to a magnetic crossover and leads to broad anomalies in measured physical quantities, as a rounded step in at low-temperature, which transforms into a broad maximum when the temperature is raised Daou et al. (2006). Although they are both paramagnetic, the low-temperature CPM and PPM regimes may differ significantly. The CPM regime is characterized by strong electronic correlations and a small magnetic polarization under magnetic field, while the PPM regime is associated with a strong magnetic polarization and reduced intersite electronic correlations. This difference is highlighted in the prototypical heavy-fermion paramagnet CeRu2Si2, where antiferromagnetic fluctuations are present in the CPM state but vanish in the PPM regime Rossat-Mignod et al. (1988); Flouquet et al. (2004). Under high fields, a high-temperature scale also indicates the crossover from the low-temperature PPM regime to the high-temperature paramagnetic regime, being associated with a progressive loss of the field-induced magnetic polarization when the temperature is raised.
In the Ising antiferromagnet CeRh2Si2 investigated here, the Néel temperature of 36 K at ambient pressure, below which AF moments are aligned along Grier et al. (1984), vanishes under a pressure GPa Kawarazaki et al. (2000); Muramatsu et al. (1999). Superconductivity appears in a restricted pressure window around Movshovich et al. (1996); Araki et al. (2002). A magnetic field T applied along induces a first-order transition into the PPM regime Settai et al. (1997); Abe et al. (1997); Knafo et al. (2010), which is pushed to higher fields under pressure Hamamoto et al. (2000). Pressure- and magnetic-field-induced changes of the magnetic structure inside the AF phase have also been reported Kawarazaki et al. (2000); Knafo et al. (2010); Araki et al. (2002). Contrary to most other Ce-systems where a non-Fermi-liquid behavior is found, a low-temperature Fermi-liquid dependence of the resistivity is reported in CeRh2Si2 at all pressures and magnetic fields Araki et al. (2002); Knafo et al. (2010), including at and where first-order transitions occur. Although the superconducting (SC), PM and/or AF phases boundaries have been determined for several compounds in restricted pressure, field, and temperature windows Aoki et al. (2013); Friedemann et al. (2009); Knebel et al. (2011); Zaum et al. (2011); Matsubayashi et al. (2015), a full (,,) phase diagram, including the temperature and pressure evolution of the critical lines and , had not been established yet for a pure stoichiometric compound.
Here, we explore the complete three-dimensional (,,) phase diagram of CeRh2Si2, and we extract its magnetic-field- and pressure-induced quantum critical properties. In particular, the need to consider carefully the high-temperature properties to understand the complex quantum critical properties in the (,) plane, i.e., at the borderlines between the AF, CPM, and PPM quantum states, is emphasized. After an introduction to the experimental techniques in Section II, magnetoresistivity data and the 3D magnetic phase diagram obtained here are presented in Section III. A comparison of the temperature and magnetic field scales, and an extraction of the quantum critical properties (via the quadratic coefficient in the resistivity), are presented in Section IV. Finally, discussion and conclusion are made in Sections V and VI, respectively.
II Experimental techniques
The single crystals studied here were grown by the Czochralsky method in a tetra-arc furnace. Magnetoresistivity measurements have been performed under combined extreme conditions of high pressure up to 4 GPa, pulsed magnetic fields up to 60 T, and temperatures down to 1.4 K. The results presented here correspond to four sets of experiments under pulsed magnetic fields (using four single crystals: samples , , , and ): the first one at ambient pressure (cf. Knafo et al. (2010) for the experiment details), and the three others using a pressure cell. Residual resistivity ratios of , 40, 145, and 25 were found for samples , , , and , respectively, at ambient pressure. Two new Bridgman-type pressure cells specially designed - at the Niigata University (cell ”1”) and the CEA Grenoble (cell ”2”) - for the pulsed fields have been used in 20-mm bore 4He cryostats under long-duration (rise of 50 ms and fall of 330 ms) pulsed magnetic fields up to 60 T generated at the LNCMI-Toulouse. The electrical resistivity was measured by the four-point technique, at frequencies from 20 to 70 kHz, with a current of 10 mA. Data have been analyzed using digital lock-ins (developed at the LNCMI-T by Hanappel and Fabrèges). Cell ”1” was used for a set of measurements on sample , at the pressures , 0.75, 1, 1.2, 1.5, 2, 2.5 and 3 GPa, and cell ”2” was used to study sample at the pressures , 2, 3, and 4 GPa, and sample at the pressures , 0.75, 0.85, and 0.9 GPa. The pressure was estimated by checking the superconducting transition from the resistivity of a lead sample, placed into the cell close to the CeRh2Si2 sample, and by comparing the temperature dependence of measured here with data from Ohashi et al. (2002, 2003). To perform experiments under pulsed magnetic fields combined with pressures as high as 4 GPa, the price to pay was to accept small heating effects induced on the sample by the metallic body of the cell, whose other parts (anvils, gasket, etc.) are non-metallic, during the pulsed-field shots. The presented data were recorded during the rise of the field pulses, where the sample heating remains acceptable. Assuming a linear increase of the temperature versus time during the pulse, the temperature of the sample has been corrected to extract the coefficient and the magnetic phase diagram from the resistivity data. Details about the pressure cells, but also the procedure to estimate the heating effects and correct the sample temperature during the field pulses, can be found in Refs. Braithwaite et al. (2016); Settai et al. (2015).
III Magnetoresistivity and magnetic phase diagram
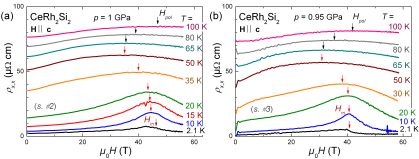
The in-plane magnetoresistivity of CeRh2Si2 under magnetic fields up to 60 T is shown in Fig. 2 for a wide range of pressures and temperatures (cf. Knafo et al. (2010) for a similar study at ambient pressure). In spite of different residual resistivity ratios varying from 25 to 145, the magnetoresistivity of the four samples investigated here shows similar features, indicating their magnetic - but not orbital - origin (see Ref. not (c) and Appendix). For (Figs. 2(a-b), and 0.75 GPa) and at low temperature, a step in vs is seen at the AF borderline , which coincides with . At intermediate temperatures, a decoupling of (kink) and (broad maximum) is seen for and 10 K, at and 0.75 GPa, respectively. The maximum of , which is ascribed to the pseudo-metamagnetic field , survives above at pressures GPa and can be observed down to the lowest temperatures at pressures GPa (see Figs. 2(c-d)). At low pressures , the decoupling of and can be observed only in a narrow temperature range , and it is active down to the lowest temperature for pressures just below , as shown in Fig. 3 for the pressures and 0.9 GPa. Conversely to , increases under pressure, from 26 T at bar to 35 T at GPa. For , at low temperatures is found to increase, reaching 51.5 T at GPa (see Fig. 2(d)). decreases with increasing temperature and we lose its trace at temperatures higher than 50 and 80 K, at the pressures and 1.2 GPa, respectively. At high temperature, another broad maximum in is observed at the field , which increases with increasing . , which is equivalent to in Fig. 1, is a signature of the crossover between the low-field high-temperature PM and the high-field PPM regimes. At GPa and low temperature, is beyond the experimental window [0;60 T], and we can only see its trace, as well as that of , at temperatures above 65 K (see Fig. 2(e)). At GPa, no trace of nor can be found up to 141 K, due to field scales far beyond the accessible experimental window (see Fig. 2(f)).
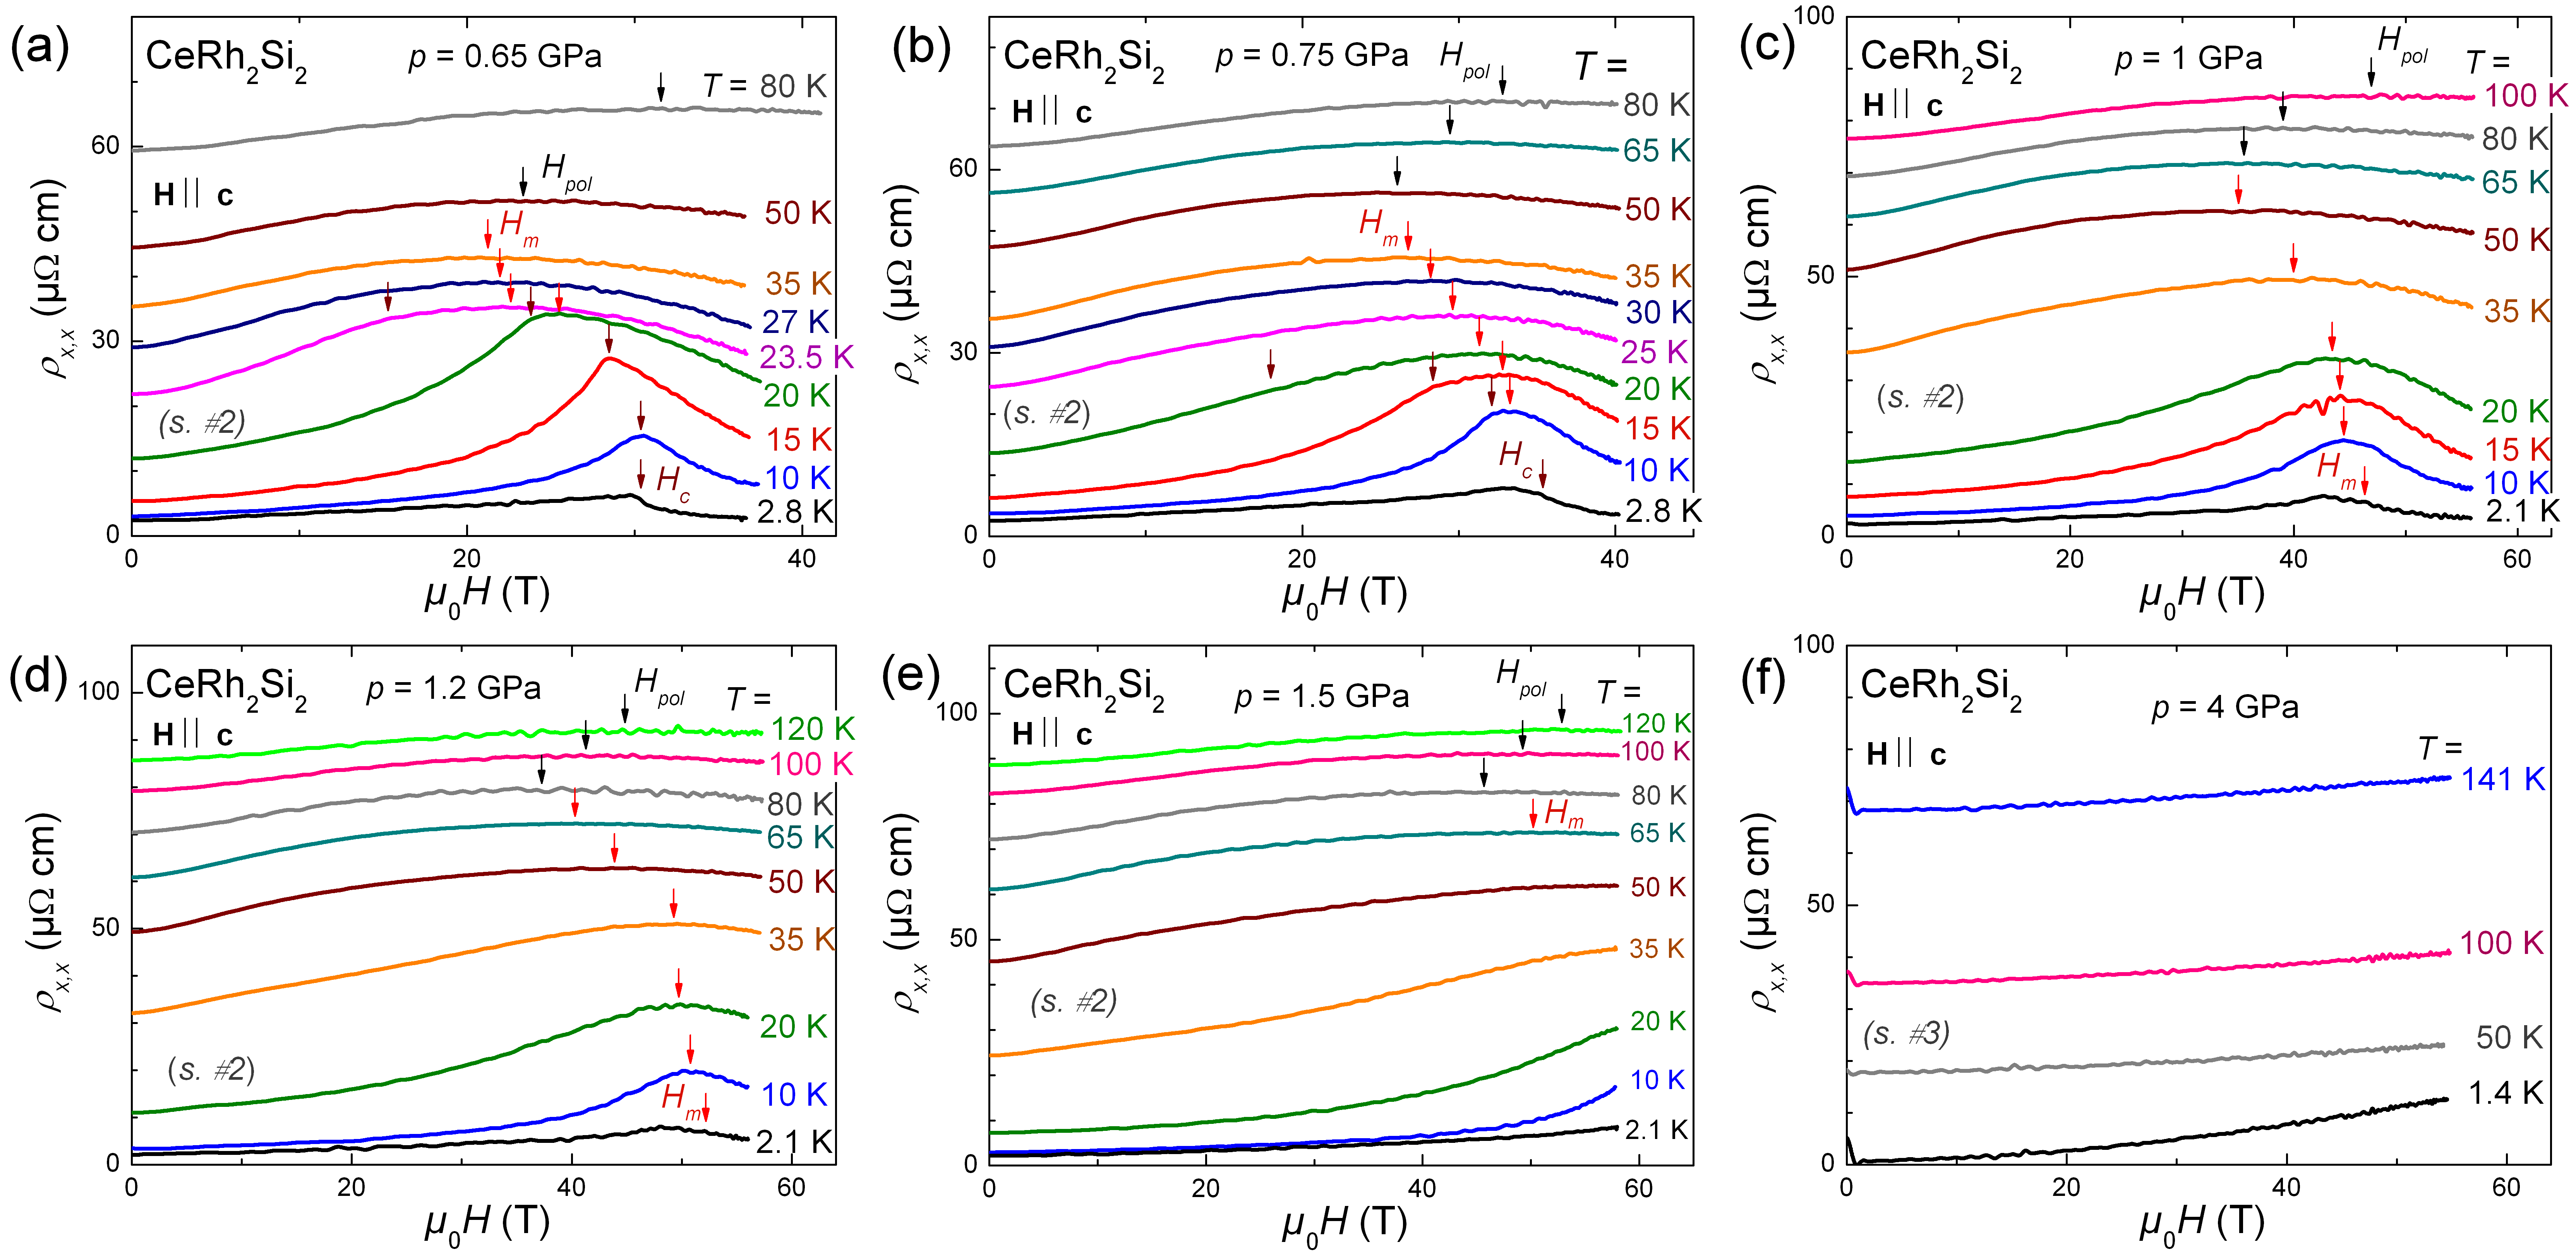
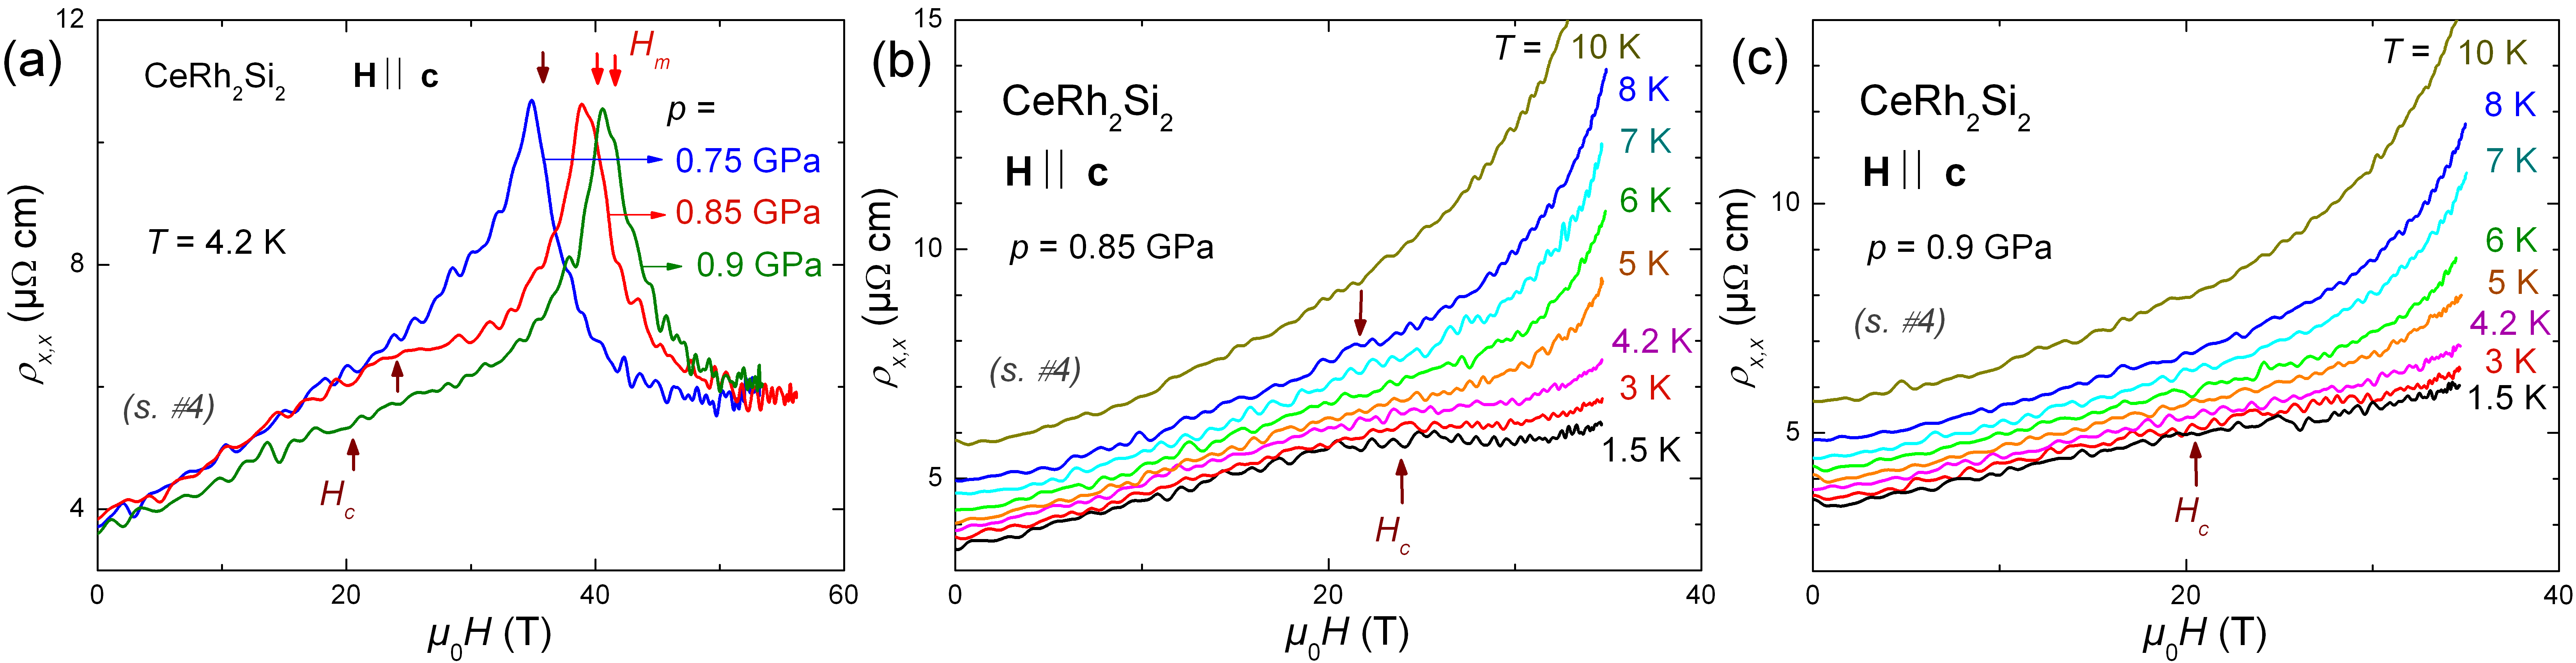
Fig. 4(a) presents the zero-field (,) phase diagram of CeRh2Si2 (constructed using susceptibility data from Ref. [Muramatsu et al., 1999] and resistivity data from Ref. [Araki et al., 2002]), showing that antiferromagnetism vanishes at GPa, where superconductivity develops at very low temperature. is almost constant for GPa and increases almost linearly with for GPa. Hence the CPM regime, which exists at temperatures , becomes more extended under pressure and is the low-temperature ground state for . Figs. 4(b-c) show the (,) phase diagrams obtained here at and 1.2 GPa. At GPa and at low temperature, antiferromagnetism vanishes at T, above which the system is polarized paramagnetically. At temperatures K, and become separated. The temperature of K at which vanishes and appears coincides with the temperature scale . At GPa, the CPM regime is, thus, established at temperatures and magnetic fields up to . At pressures , the ground state is the CPM regime. The temperature at which its boundary falls and appears is also similar to . This indicates that the CPM regime can be delimited by the crossover scales and , which both increase with increasing pressure. When , increases linearly with at all pressures, as observed at bar Knafo et al. (2010), and shows little pressure dependence. Fig. 4(d) presents the (,) phase diagram extracted in the limit , showing that the AF phase boundary slowly increases with for GPa, before suddenly decreasing above . The borderline of the zero-resistivity SC state , which reaches T for (data from Araki et al. (2002)), is also plotted in Fig. 4(d). The critical point (,), where T, separates the AF phase, the high-pressure CPM regime, and the high-field PPM regime in the limit . Interestingly, the pseudo-metamagnetic field increases linearly with in a similar manner to for (see Figs. 4(a,d)).
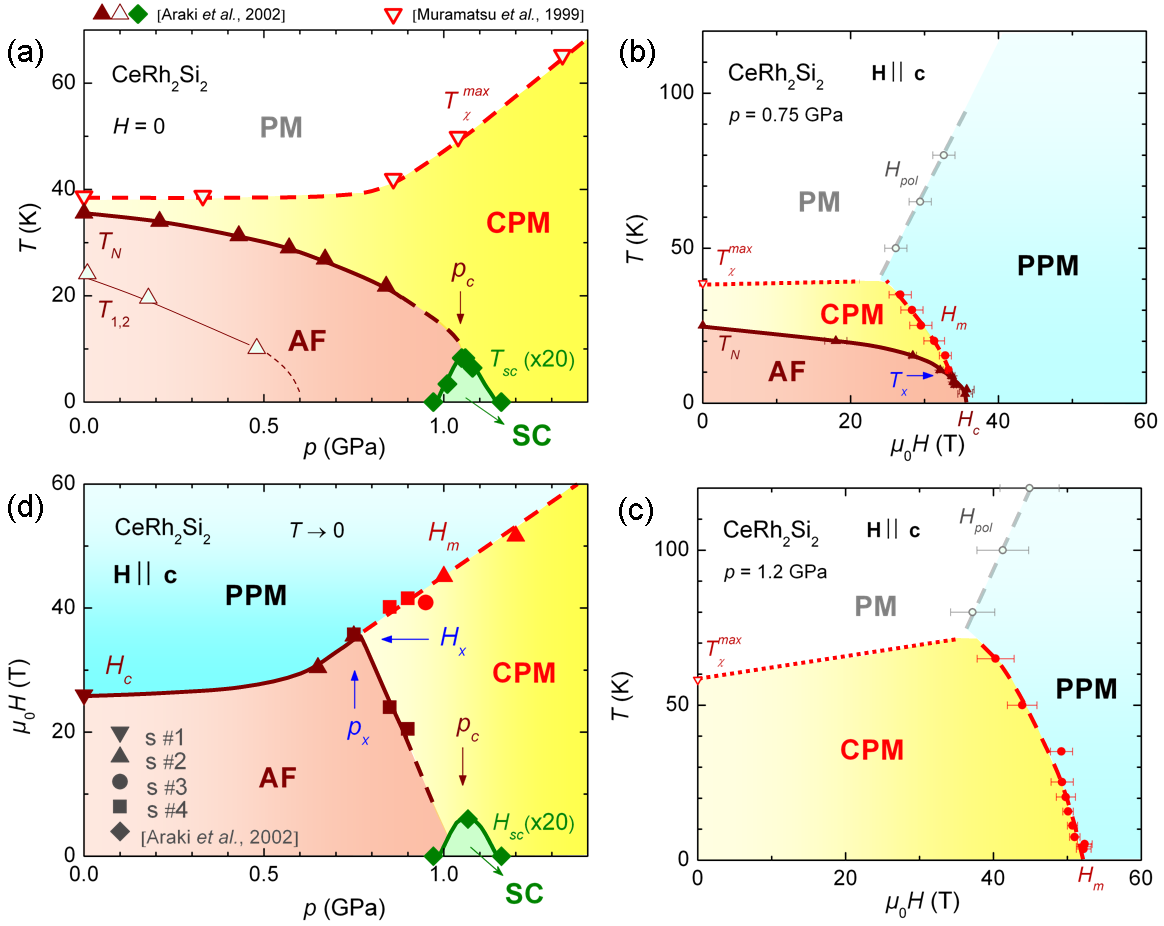
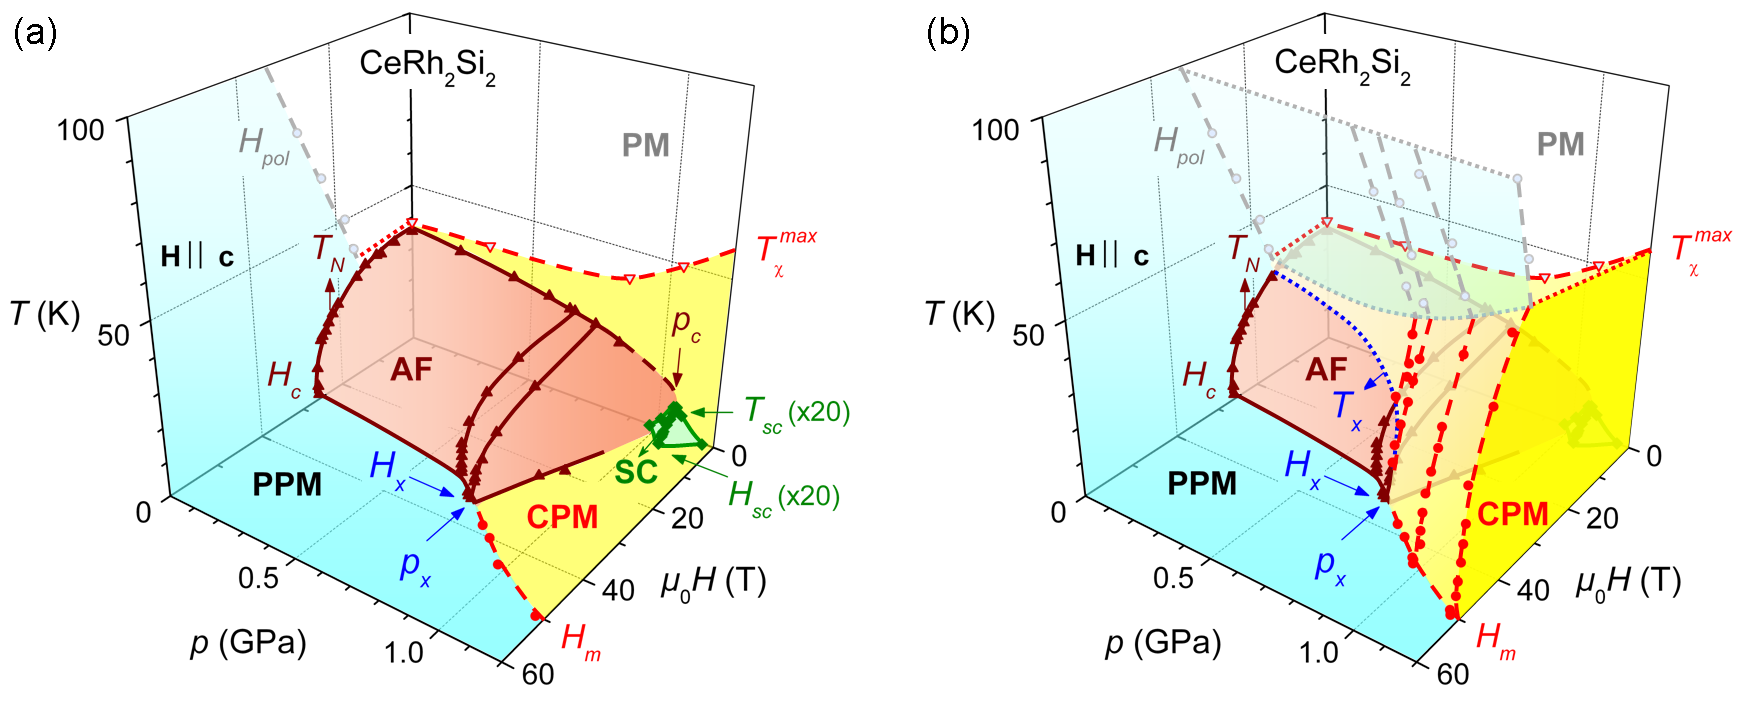
Fig. 5 shows the three-dimensional magnetic field - pressure - temperature phase diagram of CeRh2Si2 extracted from our magnetoresistivity measurements (but also including data from Refs. Muramatsu et al. (1999); Knafo et al. (2010); Araki et al. (2002)). Fig. 5(a) presents a 3D view of the AF and SC phases, while Fig. 5(b) extends the 3D view to the CPM and PPM regimes. These plots permit to show that the CPM regime englobes the AF phase as long as at pressures . Fig. 5(b) emphasizes that the temperature separating the three low-temperature phases decreases under pressure and vanishes at the critical point (,,). The decoupling of and and its intimate relationship with the decoupling of and are the central features of this phase diagram. We note that the high-temperature border of the PPM regime is almost pressure-independent and defines a high-temperature plane ending on the CPM border.
IV Energy scales and quantum critical properties
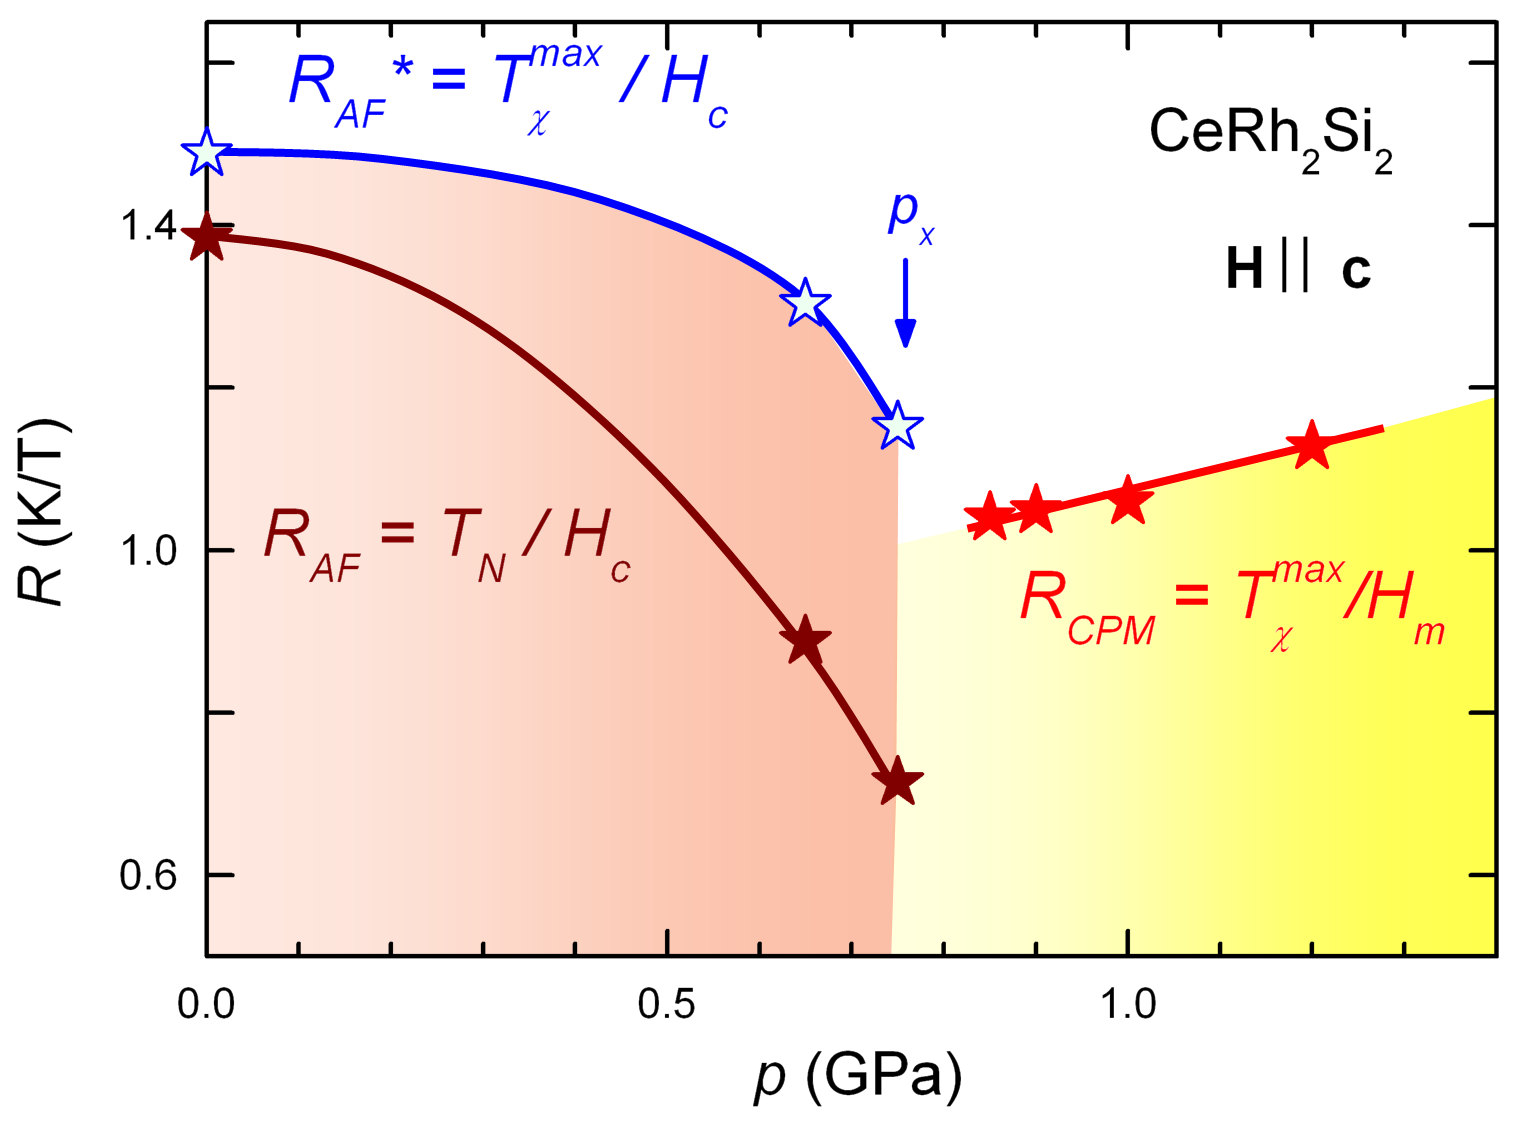
We can better understand the 3D phase diagram by comparing the pressure dependences of the different energy scales. Fig. 6 shows the pressure dependence of the ratios and extracted for CeRh2Si2 in its CPM regime and AF phase, respectively. While K/T is almost pressure-independent for , strongly varies with for . This is consistent with a trend already observed for other heavy-fermion systems Aoki et al. (2013). The universal constant K/T characterizes many heavy-fermion paramagnets Aoki et al. (2013); Ōnuki et al. (2004) and indicates that and are controlled by a single parameter. In heavy-fermion paramagnets, the magnetic susceptibility almost saturates at temperatures below and the low-field magnetization is linear in fields up to almost . Pseudo-metamagnetism occurs, thus, at a similar critical value of the magnetization ( ) in heavy-fermions paramagnets where . Conversely, is not a universal constant for heavy-fermion antiferromagnets, where multiple parameters have to be considered Aoki et al. (2013). As seen in Figs. 4(a,d), the increase of with for seems to be linked with that of , but not with the decrease with of . The ratio , also plotted in Fig. 6 for , is found to vary less than , showing that is partly controlled by the magnetic interactions which govern .
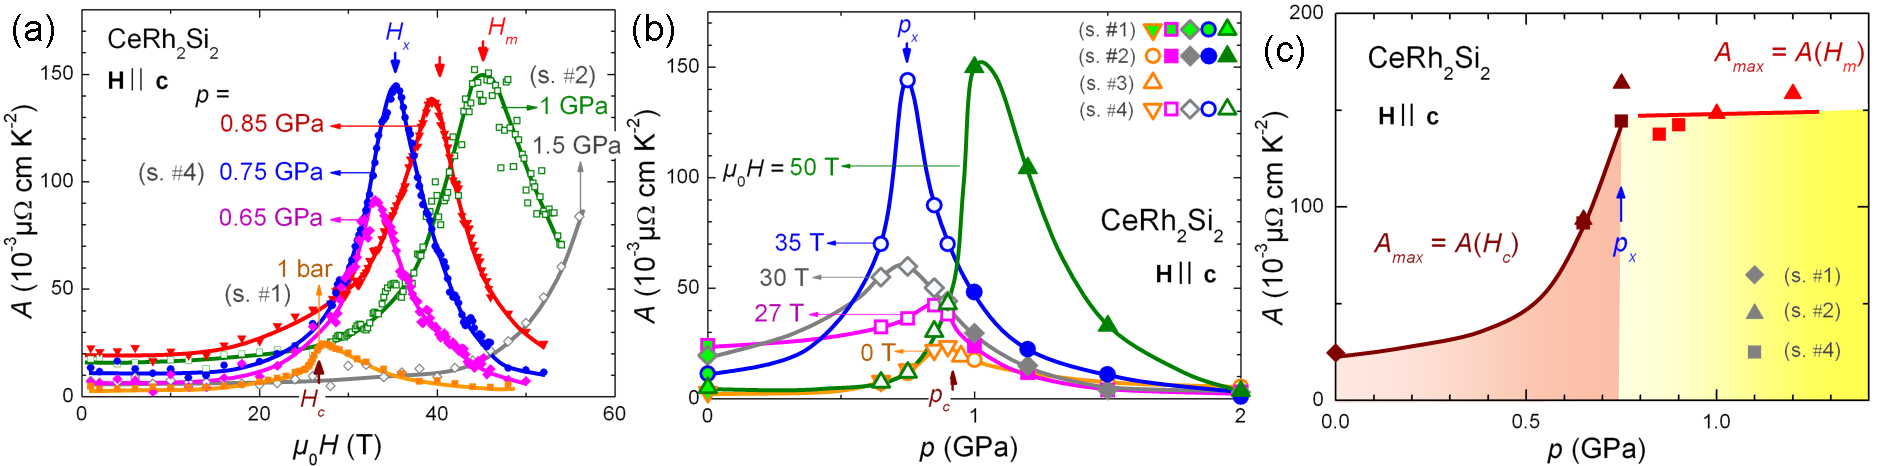
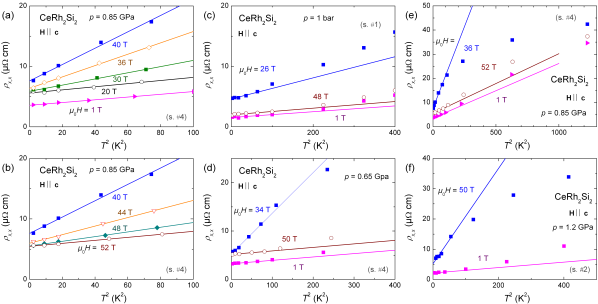
Having established the phase diagram, we now turn to characterize its quantum critical properties by analyzing the evolution of the effective mass, extracted through the temperature dependence of the resistivity, in the two-dimensional quantum plane (,). At first approximation, we assume that the quadratic coefficient in the electrical resistivity , where is the residual resistivity, is proportional to . Here, a law is observed within the experimental uncertainty in a large temperature window going from 1.5 to K, for all investigated pressures and magnetic fields. The upper temperature limit of the law is minimal at the critical fields and and pressure , where it reaches K, and is maximal in magnetic fields far from and , and pressures far from , where it reaches K (see Appendix). Fig. 7(a) presents the field-dependence of extracted from versus curves (reconstructed from versus data measured at constant temperature; see Appendix) at pressures up to 1.5 GPa. Combined magnetic fields and pressures lead to an enhancement of at (or ) for (). For , an enhancement at is not visible in this versus plot because the anomaly at is a rather weak and broad shoulder, in comparison with the anomaly at in the measurement. However, the anomaly at is clearly visible as a well-defined maximum in versus plots (see Fig. 7(b)) in agreement with the low-temperature (,) phase diagram (Fig. 4(d)).
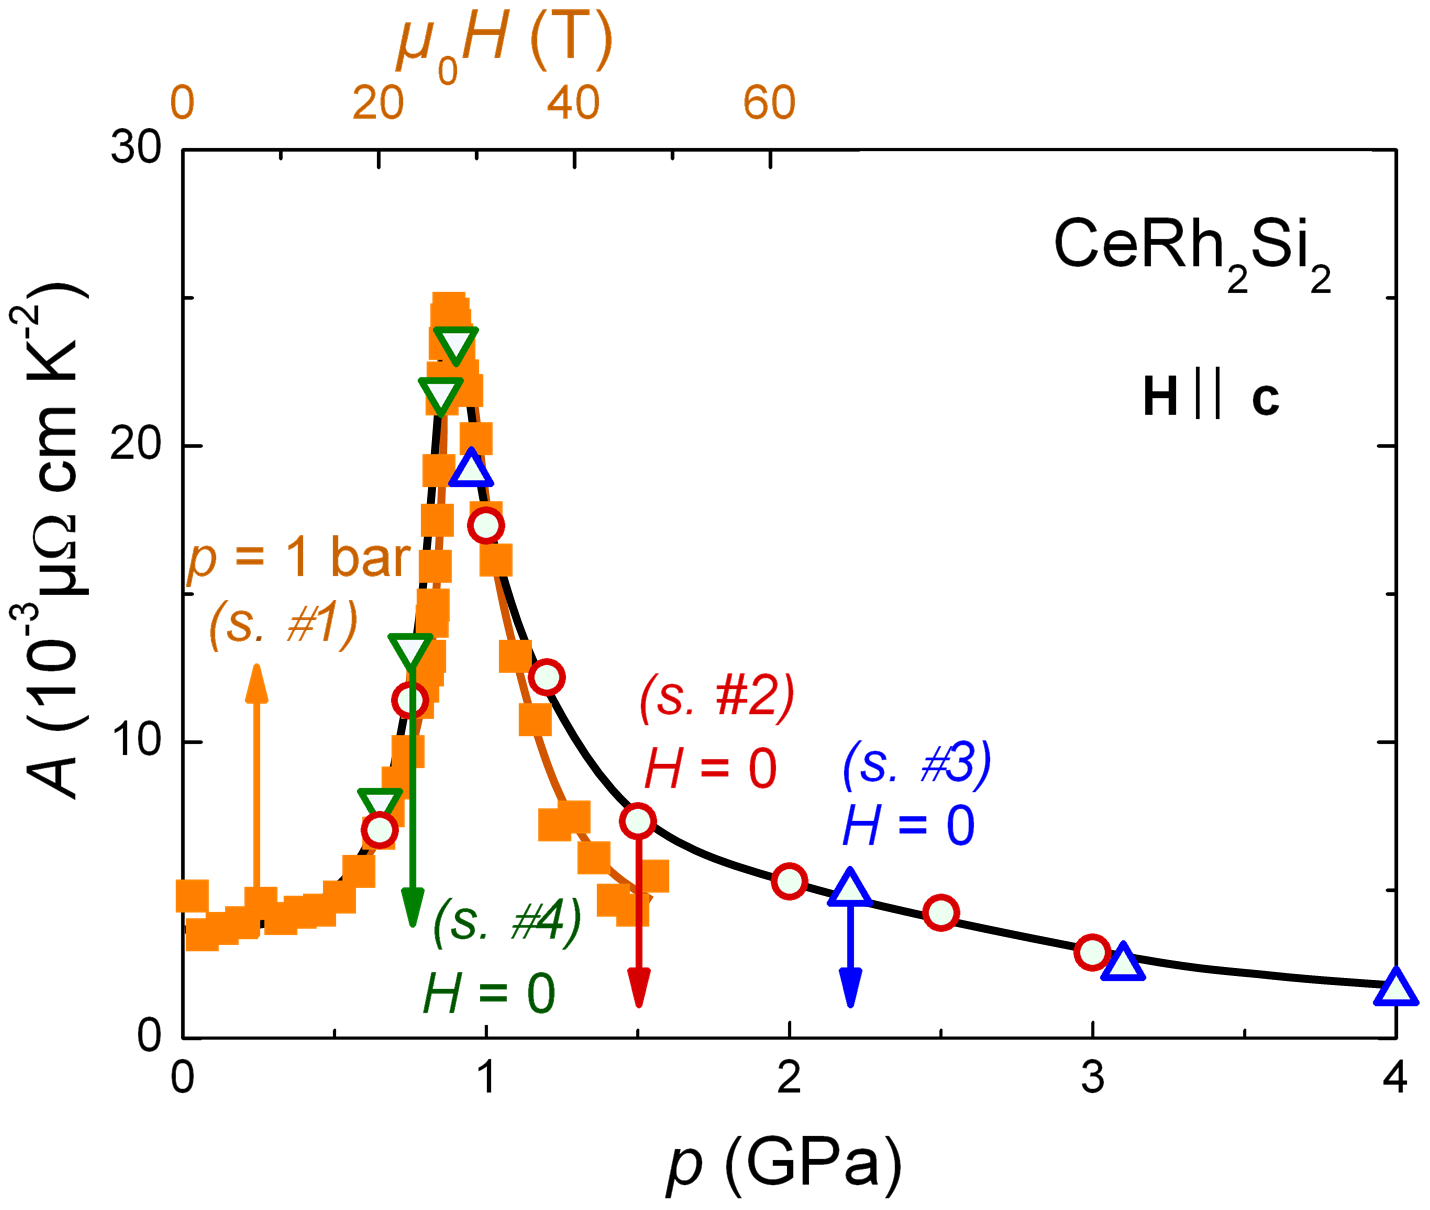
Confirming previous reports Knafo et al. (2010); Flouquet et al. (2010), the field-driven enhancement of at ambient pressure is similar to the pressure-driven one at zero-field, the same maximal value of cmK-2 being reached at (, bar) and (, ) (cf. Fig. 11 in the Appendix). However, quite surprisingly, as pressure is increased, the enhancement of at the field or becomes considerably larger. This is illustrated in Fig. 7(c) by the pressure-dependence of , which is defined as the maximal value of versus at a given pressure. Quantum criticality at and leads to the maximal values for and for . We remark that the strong increase of with at pressures ends in a maximal value of cmK-2 at (,), and is followed by an almost pressure-independence of for .
V Discussion
Here, we present the first study of a pure stoichiometric heavy-fermion antiferromagnet, where the decoupling of two critical fields and is systematically investigated as function of temperature and pressure. Such decoupling of and has also been observed down to mK in the Ising antiferromagnet Ce(Ru0.92Rh0.08)2Si2 at ambient pressure Aoki et al. (2012), and at K in Ce0.8La0.2Ru2Si2 under pressure Haen et al. (1996). In the Ising antiferromagnet Ce0.9La0.1Ru2Si2 at ambient pressure, a decoupling of and has been observed in an intermediate range of temperatures K Aoki et al. (2012); Fisher et al. (1991); Haen et al. (1996), but not at temperatures below 1.5 K. While pressure and chemical doping generally lead to similar effects on the magnetic phase diagram of heavy-fermion systems, pressure has the advantage to continuously tune the properties of a single crystal without altering its quality. Its combination with intense magnetic fields over a large temperature window permits here to draw the complete (,,) magnetic phase diagram of CeRh2Si2. We show that the low-temperature decoupling of and occurs at pressures just below and is connected with a high-temperature phenomenon, the decoupling of and . The wrapping of the CPM regime over the AF phase, as seen in the 3D phase diagram in Fig. 5, is a consequence of the decoupling of these magnetic field and temperature scales. The similarities with studies made on Rh- and La-doped CeRu2Si2 indicate that the complete phase diagram established here for CeRh2Si2 might be generic of a class of heavy-fermion Ising antiferromagnets, where a decoupling of and drives that of and .
However, the quantum critical properties at and are sensitive to specific sample properties. In CeRh2Si2, the highest value of is reached on the critical line, where is pressure-independent. Oppositely, in La-doped CeRu2Si2, decreases with while the Sommerfeld coefficient ( in a Fermi liquid picture) is maximal and constant at Aoki et al. (2011). Microscopically, we speculate that the enhancement of at is controlled by critical antiferromagnetic fluctuations (similarly to the Ce1-xLaxRu2Si2 case Knafo et al. (2009)), while that found at may result from additional mechanisms. In CeRu2Si2, critical ferromagnetic fluctuations Aoki et al. (2013); Rossat-Mignod et al. (1988); Flouquet et al. (2004) (accompanied by a Fermi surface Lifshitz transition Pourret et al. (2014)) drive the enhancement of at . Such critical ferromagnetic fluctuations probably play a role in CeRh2Si2 at too. However, in sole magnetic-fluctuations frame there is no obvious reason why the enhancement should be so much larger at than at . The relatively ’low’ value of the coefficient extracted here indicates a moderate effective mass in CeRh2Si2. Under pressure, a decrease of the Kadowaki-Woods ratio Palacio Morales et al. (2015) and a reduction of the Ising character of the system Mori et al. (1999) indicate the progressive recovery of the degeneracy of the multiplet, which could result from a Kondo temperature higher than the crystal-field energy scale Hanzawa et al. (1985), due to the proximity to a valence transition Watanabe and Miyake (2011) (see also Matsuda et al. (2014)). This picture is supported by the moderate and almost pressure-independent Sommerfeld coefficient mJ/mol/K2 in the high-pressure CPM regime (at zero magnetic field) Graf et al. (1997), where a low-temperature Grüneisen parameter , i.e., much smaller than in typical heavy-fermion paramagnets (cf. CeRu2Si2 where Lacerda et al. (1989)), can also be extracted not (d). An open question is the evolution of the Fermi surface under pressure combined with magnetic field, i.e., through and at pressures close to and . At ambient pressure, the Fermi surface established experimentally in the AF phase agrees well with LDA+U band calculations Palacio Morales et al. (2015); Araki et al. (2001). On crossing , clear marks of Fermi surface change have been established, but a debate remains on the validity of its description by LDA, LDA+U, or some more sophisticated band calculation. Unfortunately, the Fermi surface of the PPM regime in fields above has only be detected by the emergence of a single frequency Sheikin . New attempts to study the Fermi surface, but also valence, under combined pressure and magnetic field, allowing to access the PPM regime in magnetic fields higher than and , are now requested.
VI Conclusion
The 3D phase diagram of CeRh2Si2, as well as the pressure- and magnetic-field-variations of its effective mass, confirm the importance of studying over a large temperature window the effects of pressure and magnetic field on quantum critical phenomena. The need to consider the high-temperature properties, such as the onset of antiferromagnetism and correlated paramagnetism, and their intimate relationship with the quantum properties, has been highlighted.
Thanks to a systematic tuning of a 3D phase diagram under combined pressure and magnetic field, we have determined the temperature and pressure dependences of the critical and pseudo-metamagnetic fields and , respectively. In particular, our study permitted to show:
-
1.
that a low-temperature decoupling of and occurs in a narrow pressure range in the vicinity of the critical pressure (at pressures ),
-
2.
that this low-temperature decoupling of and results from a strong high-temperature decoupling of and ,
-
3.
that the decoupling of and can also occur in a limited temperature range when and are not sufficiently decoupled (at pressures ).
A significant enhancement of the Fermi liquid coefficient has also been observed at the critical point ( GPa, T), which delimits the three low-temperature states (AF phase, CPM and PPM regimes), and on the critical line , which separates the CPM and PPM regimes. From a sole magnetic-fluctuations picture, it is difficult to understand why the enhancement of is much larger at than at . Additional effects, like changes of the Fermi surface, valence, and/or magnetic anisotropy, might also play a role in the critical enhancements of . To go beyond the present study and understand the evolution of quantum criticality in the (,) phase diagram, further experiments (e.g., on magnetic fluctuations, valence, Fermi surface etc.) on CeRh2Si2, as well as new theoretical descriptions, are needed.
More generally, the combination of extreme conditions of intense magnetic field and high pressure constitutes a goldmine of novel phenomena in a large variety of strongly-correlated-electron systems. As in heavy-fermion systems, a decoupling of the long-range magnetic ordering and the maximum of the magnetic susceptibility is also observed in low-dimensional quantum magnets dej (1990) and in high-temperature cuprate superconductors Johnston (1989); Pines (2013). Studying the evolution of this decoupling under combined pressure and magnetic field will shed new light on the quantum critical properties of these systems. In the region of optimal doping of cuprate superconductors, where several electronic energy scales fall drastically Pines (2013), it will be pertinent to test whether, and if so how, the quantum critical properties could be affected by intense magnetic fields.
Acknowledgements
We acknowledge J. Béard and M. Nardone for useful discussions. This work has been partly funded by the French ANR contract PRINCESS and the CEFIPRA project 4906 ExtremeSpinLadder.
APPENDIX
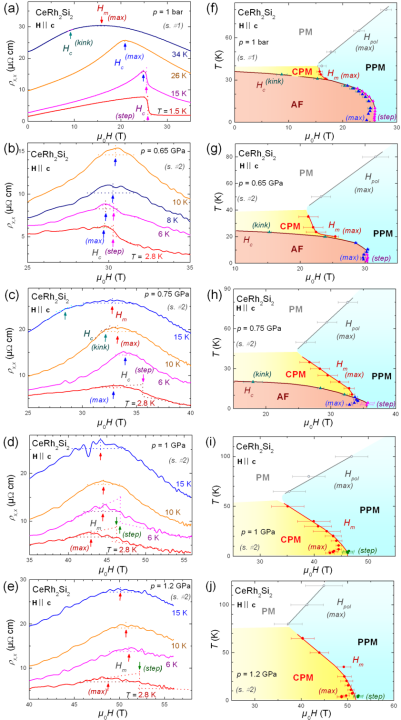
Fig. 8 presents how the different critical and crossover fields have been defined here. Fig. 8 (a) shows that, at ambient pressure (data from Knafo et al. (2010)), is characterized by a step at low temperature, which progressively transforms into a maximum and then a kink at higher temperature, in the magnetoresistivity data. At temperatures above K and below K, a broad maximum at a field ascribed to the pseudo-metamagnetic field is decoupled from the kink at the critical field . The different anomalies observed the resistivity at ambient pressure are summarized in the magnetic-field - temperature phase diagram in Fig. 8 (f). Fig. 8(b-e) show the magnetoresistivity obtained here on sample at pressures from 0.65 to 1.2 GPa. At low temperature, the anomalies at and under pressure are broadened, in comparison with that at at ambient pressure, presumably because of pressure inhomogeneities in the cells. In the light of other heavy-fermion paramagnets studies (see Ref. Daou et al. (2006)) and for continuity in the data analysis, has been defined at low temperature at the mid of a step in the resistivity, and at high temperature at the maximum of the resistivity. The magnetic-field - temperature phase diagrams obtained under pressure are plotted in Fig. 8 (g-j). They indicate that the correlated paramagnetic regime is progressively stabilized under pressure, extending from a narrow high-temperature region at ambient pressure to a large region down to the lowest temperature under pressures higher than GPa.
Figs. 9 (a-b) show the magnetoresistivity versus magnetic field data obtained at similar pressures of 1 and 0.95 GPa on samples and , respectively, for a large set of temperatures from 2.1 to 100 K. This comparison emphasizes the very similar anomalies at and observed in the magnetoresistivity of two samples of very different residual resistivity ratios (of for sample and for sample ), indicating that these anomalies are not controlled by an orbital effect, i.e., the field-induced cyclotron motion of the conduction electrons, and result from the magnetic properties of the system.
For all data, the fit by a law of the magnetoresistivity has been made in a temperature window from 1.5 to 10 K, the temperature having been corrected as described in Braithwaite et al. (2016). Fig. 10 (a-b) shows the variation of the resistivity extracted at GPa on sample using cell ”2”, for different fields up to 52 T, which indicates a significant enhancement of the quadratic coefficient at 40 T. Fig. 10 (c-f) shows, in an extended temperature scale, the variation of the resistivity extracted for different values of the magnetic field, at bar, 0.65 GPa, 0.85 GPa, and 1.2 GPa, indicating the departure from the low-temperature behavior at a temperature estimated to K at and , and to K at magnetic fields far from and .
Fig. 11 (a) shows a comparison of the field-dependence (at ambient pressure) and the pressure-dependence (at zero-field) of the coefficient extracted here for samples , , , and , confirming the similar enhancements of up to cm K-2 observed at (, bar) and (, ) reported previously Knafo et al. (2010); Flouquet et al. (2010).
References
- Hertz (1976) J. A. Hertz, Phys. Rev. B 14, 1165 (1976).
- Valla et al. (1999) T. Valla, A. V. Fedorov, P. D. Johnson, B. O. Wells, S. L. Hulbert, Q. Li, G. D. Gu, and N. Koshizuka, Science 285, 2110 (1999).
- Shibauchi et al. (2014) T. Shibauchi, A. Carrington, and Y. Matsuda, Annu. Rev. Condens. Matter Phys. 5, 113 (2014).
- Knafo et al. (2009) W. Knafo, S. Raymond, P. Lejay, and J. Flouquet, Nat. Phys. 5, 753 (2009).
- Coldea et al. (2010) R. Coldea, D. A. Tennant, E. M. Wheeler, E. Wawrzynska, D. Prabhakaran, M. Telling, K. Habicht, P. Smeibidl, and K. Kiefer, Science 327, 177 (2010).
- Merchant et al. (2014) P. Merchant, B. Normand, K. W. Kraemer, M. Boehm, D. F. McMorrow, and C. Rueegg, Nat. Phys. 10, 373 (2014).
- Stewart (2001) G. R. Stewart, Rev. Mod. Phys. 73, 797 (2001).
- Cooper et al. (2009) R. A. Cooper, Y. Wang, B. Vignolle, O. J. Lipscombe, S. M. Hayden, Y. Tanabe, T. Adachi, Y. Koike, M. Nohara, H. Takagi, C. Proust, and N. E. Hussey, Science 323, 603 (2009).
- Aoki et al. (2013) D. Aoki, W. Knafo, and I. Sheikin, C. R. Physique 14, 53 (2013).
- Settai et al. (2007) R. Settai, T. Takeuchi, and Y. Ōnuki, Journal of the Physical Society of Japan 76, 051003 (2007).
- Lee et al. (1986) P. A. Lee, T. M. Rice, J. W. Serene, L. J. Sham, and J. W. Wilkins, Comment. Cond. Mat. Phys. 12, 99 (1986).
- Ohashi et al. (2003) M. Ohashi, G. Oomi, S. Koiwai, M. Hedo, and Y. Uwatoko, Phys. Rev. B 68, 144428 (2003).
- Scheerer et al. (2012) G. W. Scheerer, W. Knafo, D. Aoki, G. Ballon, A. Mari, D. Vignolles, and J. Flouquet, Phys. Rev. B 85, 094402 (2012).
- Tsujii et al. (2005) N. Tsujii, H. Kontani, and K. Yoshimura, Phys. Rev. Lett. 94, 057201 (2005).
- Daou et al. (2006) R. Daou, C. Bergemann, and S. R. Julian, Phys. Rev. Lett. 96, 026401 (2006).
- Fisher et al. (1991) R. A. Fisher, C. Marcenat, N. E. Phillips, P. Haen, F. Lapierre, P. Lejay, J. Flouquet, and J. Voiron, Journal of Low Temperature Physics 84, 49 (1991).
- Gegenwart et al. (2008) P. Gegenwart, Q. Si, and F. Steglich, Nat. Phys. 4, 186 (2008).
- Flouquet (2005) J. Flouquet, Prog. Low Temp. Phys. 15, 139 (2005).
- Löhneysen et al. (2007) H. v. Löhneysen, A. Rosch, M. Vojta, and P. Wölfle, Rev. Mod. Phys. 79, 1015 (2007).
- Pfleiderer (2009) C. Pfleiderer, Rev. Mod. Phys. 81, 1551 (2009).
- Friedemann et al. (2009) S. Friedemann, T. Westerkamp, M. Brando, N. Oeschler, S. Wirth, P. Gegenwart, C. Krellner, C. Geibel, and F. Steglich, Nat. Phys. 5, 465 (2009).
- not (a) A spin-flop transition corresponds to the sudden alignment of the AF moments perpendicular to the magnetic field and is accompanied by a step-like variation of the magnetization.
- Grube et al. (2007) K. Grube, W. Knafo, S. Drobnik, P. Adelmann, T. Wolf, C. Meingast, and H. Löhneysen, Journal of Magnetism and Magnetic Materials 310, 354 (2007).
- Knafo et al. (2007) W. Knafo, C. Meingast, K. Grube, S. Drobnik, P. Popovich, P. Schweiss, P. Adelmann, T. Wolf, and H. v. Löhneysen, Phys. Rev. Lett. 99, 137206 (2007).
- Stryjewski and Giordano (1977) E. Stryjewski and N. Giordano, Adv. Phys. 26, 487–650 (1977).
- Settai et al. (1997) R. Settai, A. Misawa, S. Araki, M. Kosaki, K. Sugiyama, T. Takeuchi, K. Kindo, Y. Haga, E. Yamamoto, and Y. Ōnuki, Prog. Low Temp. Phys. 66, 2260 (1997).
- Knafo et al. (2010) W. Knafo, D. Aoki, D. Vignolles, B. Vignolle, Y. Klein, C. Jaudet, A. Villaume, C. Proust, and J. Flouquet, Phys. Rev. B 81, 094403 (2010).
- not (b) By tradition in the heavy-fermion community, the metamagnetic transition at the border of antiferromagnetism is usually noted , while the pseudo-metamagnetic crossover at the border of correlated paramagnetism is usually noted .
- Rossat-Mignod et al. (1988) J. Rossat-Mignod, L. Regnault, J. Jacoud, C. Vettier, P. Lejay, J. Flouquet, E. Walker, D. Jaccard, and A. Amato, J. Magn. Magn. Mater. 76-77, 376 (1988).
- Flouquet et al. (2004) J. Flouquet, Y. Haga, P. Haen, D. Braithwaite, G. Knebel, S. Raymond, and S. Kambe, J. Magn. Magn. Mater. 272-276, 27 (2004).
- Grier et al. (1984) B. Grier, J. Lawrence, V. Murgai, and R. Parks, Phys. Rev. B 29, 2664 (1984).
- Kawarazaki et al. (2000) S. Kawarazaki, M. Sato, Y. Miyako, N. Chigusa, K. Watanabe, N. Metoki, Y. Koike, and M. Nishi, Phys. Rev. B 61, 4167 (2000).
- Muramatsu et al. (1999) T. Muramatsu, S. Eda, T. Kobayashi, M. Eremets, K. Amaya, S. Araki, R. Settai, and Y. Ōnuki, Physica B 259–261, 61 (1999).
- Movshovich et al. (1996) R. Movshovich, T. Graf, D. Mandrus, J. D. Thompson, J. L. Smith, and Z. Fisk, Phys. Rev. B 53, 8241 (1996).
- Araki et al. (2002) S. Araki, M. Nakashima, R. Settai, T. C. Kobayashi, and Y. Ōnuki, Journal of Physics: Condensed Matter 14, L377 (2002).
- Abe et al. (1997) H. Abe, H. Suzuki, H. Kitazawa, T. Matsumo, and G. Kido, Journal of the Physical Society of Japan 66, 2525 (1997).
- Hamamoto et al. (2000) T. Hamamoto, K. Kindo, T. Kobayashi, Y. Uwatoko, S. Araki, R. Settai, and Y. Ōnuki, Physica B: Condensed Matter 281–282, 64 (2000).
- Knebel et al. (2011) G. Knebel, J. Buhot, D. Aoki, G. Lapertot, S. Raymond, E. Ressouche, and J. Flouquet, J. Phys. Soc. Jpn. 80, SA001 (2011).
- Zaum et al. (2011) S. Zaum, K. Grube, R. Schäfer, E. Bauer, J. Thompson, and H. v. Löhneysen, Phys. Rev. Lett. 106, 087003 (2011).
- Matsubayashi et al. (2015) K. Matsubayashi, T. Hirayama, T. Yamashita, S. Ohara, N. Kawamura, M. Mizumaki, N. Ishimatsu, S. Watanabe, K. Kitagawa, and Y. Uwatoko, Phys. Rev. Lett. 114, 086401 (2015).
- Ohashi et al. (2002) M. Ohashi, F. Honda, T. Eto, S. Kaji, I. Minamitake, G. Oomi, S. Koiwai, and Y. Uwatoko, Physica B: Condensed Matter 312-313, 443 (2002).
- Braithwaite et al. (2016) D. Braithwaite, W. Knafo, R. Settai, D. Aoki, S. Kurahashi, and J. Flouquet, Review of Scientific Instruments 87, 023907 (2016).
- Settai et al. (2015) R. Settai, W. Knafo, D. Braithwaite, S. Kurahashi, D. Aoki, and J. Flouquet, Review of High Pressure Science and Technology / Koatsuryoku No Kagaku To Gijutsu 25, 325 (2015).
- not (c) See Refs. Scheerer et al. (2012, 2014), where a sample dependence of the orbital contribution to the high-field electrical resistivity, resulting from the cyclotron motion of conduction electrons, was evidenced in the heavy-fermion paramagnet URu2Si2.
- Ōnuki et al. (2004) Y. Ōnuki, R. Settai, K. Sugiyama, T. Takeuchi, T. C. Kobayashi, Y. Haga, and E. Yamamoto, Journal of the Physical Society of Japan 73, 769 (2004).
- Flouquet et al. (2010) J. Flouquet, D. Aoki, W. Knafo, G. Knebel, T. D. Matsuda, S. Raymond, C. Proust, C. Paulsen, and P. Haen, Journal of Low Temperature Physics 161, 83 (2010).
- Aoki et al. (2012) D. Aoki, C. Paulsen, H. Kotegawa, F. Hardy, C. Meingast, P. Haen, M. Boukahil, W. Knafo, E. Ressouche, S. Raymond, and J. Flouquet, Journal of the Physical Society of Japan 81, 034711 (2012).
- Haen et al. (1996) P. Haen, F. Lapierre, J. Voiron, and J. Fouquet, J. Phys. Soc. Jpn. (Suppl. B) 65, 27 (1996).
- Aoki et al. (2011) D. Aoki, C. Paulsen, T. D. Matsuda, L. Malone, G. Knebel, P. Haen, P. Lejay, R. Settai, Y. Ōnuki, and J. Flouquet, Journal of the Physical Society of Japan 80, 053702 (2011).
- Pourret et al. (2014) A. Pourret, D. Aoki, M. Boukahil, J.-P. Brison, W. Knafo, G. Knebel, S. Raymond, M. Taupin, Y. Ōnuki, and J. Flouquet, Journal of the Physical Society of Japan 83, 061002 (2014).
- Palacio Morales et al. (2015) A. Palacio Morales, A. Pourret, G. Seyfarth, M.-T. Suzuki, D. Braithwaite, G. Knebel, D. Aoki, and J. Flouquet, Phys. Rev. B 91, 245129 (2015).
- Mori et al. (1999) H. Mori, N. Takeshita, N. Môri, and Y. Uwatoko, Physica B: Condensed Matter 259-261, 58 (1999).
- Hanzawa et al. (1985) K. Hanzawa, K. Yamada, and K. Yosida, J. Magn. Magn. Mater. 47-48, 357 (1985).
- Watanabe and Miyake (2011) S. Watanabe and K. Miyake, Journal of Physics: Condensed Matter 23, 094217 (2011).
- Matsuda et al. (2014) Y. H. Matsuda, J.-L. Her, S. Michimura, T. Inami, T. Ebihara, and H. Amitsuka, JPS Conf. Proc. 3, 011044 (2014).
- Graf et al. (1997) T. Graf, J. D. Thompson, M. F. Hundley, R. Movshovich, Z. Fisk, D. Mandrus, R. A. Fisher, and N. E. Phillips, Phys. Rev. Lett. 78, 3769 (1997).
- Lacerda et al. (1989) A. Lacerda, A. de Visser, P. Haen, P. Lejay, and J. Flouquet, Phys. Rev. B 40, 8759 (1989).
- not (d) The Grüneisen parameter is calculated in the pressure range following , where is extracted from Graf et al. (1997) and the compressibility coefficient Mbar-1 is extracted from Ohashi et al. (2003).
- Araki et al. (2001) S. Araki, R. Settai, T. C. Kobayashi, H. Harima, and Y. Ōnuki, Phys. Rev. B 64, 224417 (2001).
- (60) I. Sheikin, (unpublished) .
- dej (1990) Magnetic properties of layered transition metal compounds (Kluwer Academic Publishers, Dordrecht / Boston / London, Edited by L.J. De Jongh, 1990).
- Johnston (1989) D. C. Johnston, Phys. Rev. Lett. 62, 957 (1989).
- Pines (2013) D. Pines, The Journal of Physical Chemistry B 117, 13145 (2013).
- Scheerer et al. (2014) G. W. Scheerer, W. Knafo, D. Aoki, M. Nardone, A. Zitouni, J. Béard, J. Billette, J. Barata, C. Jaudet, M. Suleiman, P. Frings, L. Drigo, A. Audouard, T. D. Matsuda, A. Pourret, G. Knebel, and J. Flouquet, Phys. Rev. B 89, 165107 (2014).