Present address: ]Sonoma State University, Department of Engineering Science, Rohnert Park, CA 94928 Present address: ]Durham University, Centre for Materials Physics, South Road, Durham DH1 3LE, UK Present address: ]Neutron Scattering and Magnetism, Laboratory for Solid State Physics, ETH Zürich, CH-8093 Zürich, CH
Quantum Griffiths phase inside the ferromagnetic phase of Ni1-xVx
Abstract
We study by means of bulk and local probes the d-metal alloy Ni1-xVx close to the quantum critical concentration, , where the ferromagnetic transition temperature vanishes. The magnetization-field curve in the ferromagnetic phase takes an anomalous power-law form with a nonuniversal exponent that is strongly -dependent and mirrors the behavior in the paramagnetic phase. Muon spin rotation experiments demonstrate inhomogeneous magnetic order and indicate the presence of dynamic fluctuating magnetic clusters. These results provide strong evidence for a quantum Griffiths phase on the ferromagnetic side of the quantum phase transition.
Quantum phase transitions (QPTs) Sachdev (1999) continue to be a central topic in condensed matter physics because they are responsible for a variety of unconventional low-temperature phenomena. For example, the spin fluctuations associated with QPTs between magnetic and nonmagnetic ground states can lead to non-Fermi liquid behavior or even induce novel phases of matter von Löhneysen et al. (2007).
Real materials always contain some disorder in the form of vacancies, impurities, and other defects. In particular, disorder is unavoidable if the QPT is tuned by varying the composition in a random alloy such as Ni1-xPdx, CePd1-xRhx, or Sr1-xCaxRuO3. Research has shown that disorder can dramatically change a QPT and induce a quantum Griffiths phase, a parameter region close to the transition point that is characterized by anomalous thermodynamic behavior. This was established for model Hamiltonians Fisher (1992); *Fisher95; Thill and Huse (1995) and later predicted to occur in itinerant magnets Castro Neto and Jones (2000); Vojta and Schmalian (2005), superconductors Hoyos et al. (2007); *VojtaKotabageHoyos09; Del Maestro et al. (2008), and other systems (for reviews see, e.g., Refs. Vojta (2006); *Vojta10).
Signatures of a magnetic quantum Griffiths phase have been observed, e.g., in diluted Ce compounds Sereni et al. (2007); *Westerkampetal09 and, perhaps most convincingly, in the paramagnetic phase of the d-metal alloy Ni1-xVx Ubaid-Kassis et al. (2010); Schroeder et al. (2011). They consist in anomalous nonuniversal power-law dependencies of the magnetization, susceptibility and other thermodynamic quantities on temperature and magnetic field for concentrations close to but above the quantum critical concentration (where the ferromagnetic transition temperature is suppressed to zero). These quantum Griffiths singularities can be attributed to rare magnetic regions embedded in the paramagnetic bulk, as predicted in the infinite-randomness scenario for disordered itinerant Heisenberg magnets Vojta and Schmalian (2005); Hoyos et al. (2007); *VojtaKotabageHoyos09.
Do such Griffiths singularities also exist inside the long-range ordered, ferromagnetic phase? Theoretical arguments Senthil and Sachdev (1996); Motrunich et al. (2000) suggest that rare isolated magnetic clusters produce anomalous thermodynamic behavior on the ferromagnetic side of the QPT as well as on the paramagnetic side. However, the resulting quantum Griffiths singularities are less universal; depending on the details of the underlying disorder, they range from being stronger than the paramagnetic ones to being much weaker. So far, clear-cut experimental observations of a quantum Griffiths phase inside the long-range ordered phase have been missing 111Unusual scaling behavior in the ferromagnetic phase of URu2-xRexSi2 was initially suggested to stem from a Griffiths phase but later work showed that this is likely not the case Bauer et al. (2005); Butch and Maple (2009). (see Ref. Brando et al. (2016) for a comprehensive review of QPTs in metallic ferromagnets).
In this Letter, we report the results of magnetic measurements and muon spin rotation (SR) experiments in Ni1-xVx across the ferromagnetic QPT. Close to the critical concentration , the dependence of the low-temperature magnetization on the magnetic field is well described by anomalous power laws on both sides of the transition. On the paramagnetic side, as in earlier work Ubaid-Kassis et al. (2010); Schroeder et al. (2011). On the ferromagnetic side, we observe where is the spontaneous magnetization. The exponent is strongly -dependent (i.e., nonuniversal) and decreases towards zero at . Strikingly, its -dependence is almost symmetric in . SR measures the local magnetic fields inside the sample and reveals the microscopic origins of this anomalous behavior. In the ferromagnetic phase we find a broad distribution of local magnetic fields signifying inhomogeneous magnetic order. SR data for samples close to also indicate that fluctuating magnetic clusters coexist with the long-range ordered bulk. These results provide strong evidence for a quantum Griffiths phase on the ferromagnetic side of the QPT in Ni1-xVx.
Polycrystalline spherical samples of Ni1-xVx with to 15% were prepared and characterized as described in Refs. Ubaid-Kassis et al. (2010); Schroeder et al. (2014). A pair distribution function analysis supports the random distribution of the V atoms. Details of the sample preparation, the characterization with neutron scattering, as well as the magnetization and SR measurements (performed at PSI and ISIS) are summarized in the Supplemental Material Sup .
At first glance, Ni1-xVx features a simple phase diagram: The ferromagnetic ordering temperature and the spontaneous magnetization are linearly suppressed with increasing and vanish between and 12%, as shown in Figs. 1(a) and 1(c).

This critical concentration is much smaller than the corresponding for Ni1-xPdx Nicklas et al. (1999) because the V atoms, with 5 fewer d-electrons than Ni, also suppress the spins of their Ni neighbors and thus create large defects Friedel (1958); Collins and Low (1965). The inhomogeneous suppression of magnetic order causes deviations from the linear -dependence of close to the critical concentration. We determined from the maximum of the susceptibility Schroeder et al. (2011), the cusp in the ac susceptibility Wang et al. (2015) (see Fig. 1(b)), and the onset of the zero-field SR amplitude Schroeder et al. (2014) (see Fig. 4 below). All estimates agree well with each other. The resulting curve develops a tail and follows the prediction Hoyos et al. (2007); *VojtaKotabageHoyos09 of the infinite-randomness scenario, giving a critical concentration . (In contrast, the tail is absent when an ordering temperature is estimated via extrapolation from high fields, e.g, via standard Arrott plots of vs. .)
The actual quantum critical point at and is masked by a cluster glass phase that appears for below a freezing temperature K, see Fig. 1(a) Ubaid-Kassis et al. (2010); Wang et al. (2015). It is rapidly suppressed by small dc fields and does not affect the physics considered in this Letter.
We now analyze the field dependence of the magnetization at low . Figure 2 shows vs. at K for V concentrations on both sides of the QPT.
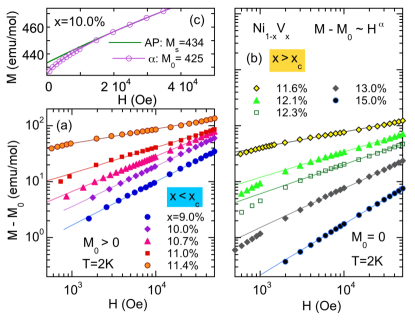
For paramagnetic samples (), the magnetization follows the anomalous power law over an extended field range from about 2 kOe to the highest available field of 50 kOe. Interestingly, the field dependence of the magnetization in the long-range ordered ferromagnetic phase () is also well described by a power-law form, viz., where represents the nonzero spontaneous magnetization. As in the paramagnetic phase, these power laws hold in a wide field range from about 1 or 2 kOe to 50 kOe (while the conventional Arrott plot description breaks down below about 10 kOe, see Fig. 2(c)).
The exponent is nonuniversal, i.e., strongly -dependent. It has a minimum close to the critical concentration and increases monotonically towards the linear-response value with increasing distance from , as shown in Fig. 3(b).
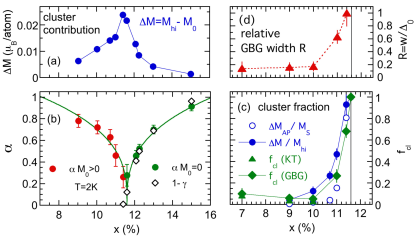
Strikingly, the curve is nearly symmetric in . It can be fitted with a power law, with exponent 222This estimate of is somewhat smaller than the value obtained in Ref. Ubaid-Kassis et al. (2010) from the -dependence of the susceptibility exponent . The deviation is within the error bars. confirming .
What is the origin of these unusual magnetization-field curves? In the paramagnetic phase, they can be attributed to magnetic clusters that are embedded in the paramagnetic bulk Ubaid-Kassis et al. (2010); Schroeder et al. (2011). These clusters exist on rare Ni-rich regions in the sample. Their slow independent fluctuations lead to anomalous power laws, the Griffiths singularities, in the temperature and field dependencies of various thermodynamic quantities Vojta (2006); *Vojta10. Deviations at the lowest fields and temperatures stem from weak interactions between the rare regions that freeze their dynamics Dobrosavljevic and Miranda (2005); Ubaid-Kassis et al. (2010) 333If the relevant rare regions are so large that order parameter conservation hampers the dynamics of the clusters, the functional form of the Griffiths singularities changes Nozadze and Vojta (2012). Based on a typical cluster moment of about 12 at Ubaid-Kassis et al. (2010); Schroeder et al. (2011), this likely does not play a role here.. Our observation of anomalous magnetization-field curves below the critical concentration indicates that disconnected magnetic clusters that fluctuate independently from the long-range ordered bulk also play a crucial role inside the ferromagnetic phase.
To analyze the importance of these clusters quantitatively, we estimate their contribution to the magnetization. A conservative estimate can be obtained by comparing the spontaneous magnetization with the zero-field magnetization obtained via Arrott plot extrapolation from high fields (see in Fig. 1(c)). As the clusters are disconnected from the bulk, they do not contribute to . In high fields they are fully polarized, however, and thus included in . Consequently, measures the cluster contribution to . Alternatively, one could simply evaluate with and define the cluster fraction as 444This measure somewhat overestimates the cluster contribution because in 50 kOe also contains the bulk response to the field.. The -dependence of is shown in Fig. 3(a). has a maximum close to and decreases for because the total number of magnetic Ni atoms decreases. also decreases for because it becomes less likely that a magnetic cluster remains disconnected from the bulk. By comparing with the typical cluster moment of 12 Ubaid-Kassis et al. (2010); Schroeder et al. (2011), we estimate a cluster density at of about one cluster per 500 Ni atoms. Figure 3(c) presents the cluster fractions and as functions of . The measures track each other and indicate that clusters become relevant for .
To gain microscopic insight into these clusters and their dynamics, we employ SR experiments (see, e.g., Ref. Blundell (1999) for an introduction and Ref. Yaouanc and Dalmas de Reotier (2011) for a technical review). In this technique, spin-polarized positive muons are implanted in the sample. Their spins then precess in the local magnetic field at the stopping site until the muon decays, with a positron emitted preferentially in the direction of the muon spin. Analyzing the asymmetry of the positron emission as a function of time thus gives direct access to the distribution of local magnetic fields in the sample. SR played an important role in characterizing unconventional magnetism, e.g., in heavy-fermion compounds Amato (1997), spin glasses Uemura et al. (1985), and disordered, non-Fermi liquid metals MacLaughlin et al. (2004). As SR experiments are sensitive towards small magnetic moments, spatial inhomogeneities, and slow fluctuations, they are well suited to identify and study magnetic clusters.
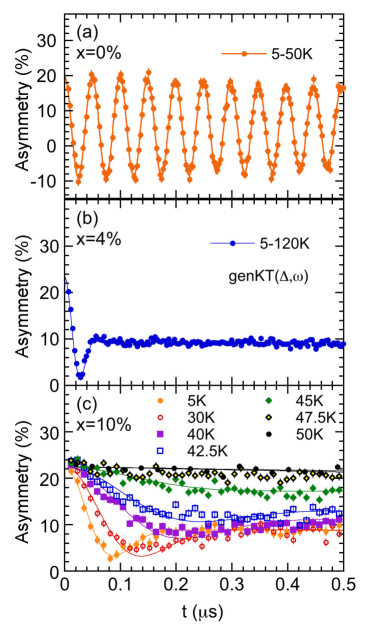
Data for the muon asymmetry in zero magnetic field for several samples from to are presented in the Supplemental Material Sup , together with further details of the analysis. For pure Ni (), features a single (nearly undamped) precession frequency confirming a uniform local magnetic field and thus uniform ferromagnetic order. In contrast, the sample on the paramagnetic side of the QPT shows a very weak depolarization. It can be described by a simple exponential decay, , caused by quasistatic diluted V nuclear spins as well as by fluctuating Ni clusters in the extreme motional narrowing limit.
Here, we focus on two samples ( and 11%) that are close to the QPT but on its ferromagnetic side. At low temperatures, of the sample (shown in Fig. 4(a)) features a single dip but no further oscillations.
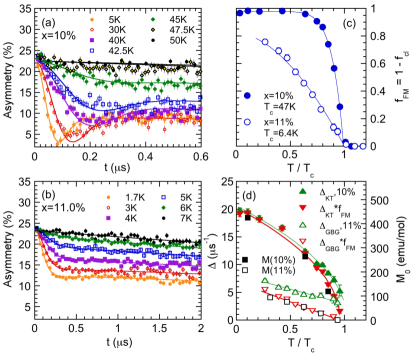
Analogous behavior is observed for Schroeder et al. (2014). It can be described by a Gaussian distribution of local magnetic fields of width , leading to with where is the well-known Kubo-Toyabe (KT) depolarization function Hayano et al. (1979). At temperatures below about 0.5 , the data follow the static KT form, signifying a moderately inhomogeneous, long-range ordered state.
Over the entire temperature range, can be modeled by two components (with temperature-dependent amplitudes) and a small constant background term,
| (1) |
The temperature dependence of the relative amplitude which represents the FM fraction of the sample is presented in Fig. 4(c). It rapidly increases as the temperature is lowered below and reaches values close to unity for . The width of the local magnetic field distribution increases with decreasing ; below about , as shown in Fig. 4(d).
For , the KT form fails to describe (shown in Fig. 4(d)) as the typical dip is missing; data taken in longitudinal fields also exclude a dynamic KT form Schroeder et al. (2014). A nearly static broader-than-Gaussian field distribution can account for the main, fast time dependence of . In fact, can be fitted well using Eq. (1) with where is the static “Gaussian-broadened Gaussian” (GBG) depolarization function suggested in Ref. Noakes and Kalvius (1997), and and are the average and width of the Gaussian of Gaussians. The temperature dependencies of the effective distribution width and of the relative amplitude are shown in Figs. 4(d) and (c). The need for a broad field distribution to describe the ferromagnetic component indicates strongly inhomogeneous order. Moreover, the ferromagnetic ratio increases only slowly below , and a sizable paramagnetic contribution representing about 20% of the sample volume remains even at the lowest . This paramagnetic contribution stems from the fluctuating moments of Ni-rich clusters that are disconnected from the long-range ordered bulk.
The cluster fraction can be obtained for all using KT and GBG fits of at the lowest . As shown in Fig. 3(c), these SR based cluster fractions agree well with the estimates from the magnetization data and indicate that clusters are relevant for . Accordingly, the relative width of the Gaussian of Gaussians Noakes and Kalvius (1997) in the field distribution starts increasing for , as shown in Fig. 3(d).
In summary, we studied the d-metal alloy Ni1-xVx close to its quantum-critical concentration , focusing on the ferromagnetic side of the QPT. We found that the low-temperature magnetization-field curve in the ferromagnetic phase follows the power-law in analogy to the power-law Griffiths singularity on the paramagnetic side. This anomalous behavior can be attributed to magnetic clusters existing on disconnected rare Ni-rich regions of the sample. Further evidence for such clusters comes from SR experiments that reveal strongly inhomogeneous magnetic order and the presence of paramagnetic, fluctuating moments inside the long-range ordered ferromagnet (for samples sufficiently close to ). These results provide evidence for a quantum Griffiths phase inside the ferromagnetic phase and demonstrate that QPTs in strongly disordered systems are qualitatively different not just from their clean counterparts but also from disordered classical phase transitions. Disorder at a classical transition may change its universality class or turn a first-order transition continuous. In contrast, we observed much stronger effects. Thermodynamic and other properties of Ni1-xVx close to its QPT are dominated by rare events, resulting, for example, in a diverging magnetic susceptibility not just at but over a range of close to .
In theoretical studies of model Hamiltonians Senthil and Sachdev (1996); Motrunich et al. (2000), quantum Griffiths phases on the magnetic side of the QPT are much less universal than those on the paramagnetic side. This stems from the fact that the probability of finding a magnetic cluster that is disconnected from the long-range ordered bulk of the system depends on the details of the disorder. Specifically, in a percolation scenario, a magnetic cluster can be isolated by a surface (shell) of nonmagnetic sites (or broken bonds). Such events have a comparatively high probability; the resulting Griffiths singularities on the ferromagnetic side are thus expected to be stronger than power laws, i.e., stronger than their paramagnetic analogs Senthil and Sachdev (1996). For weak disorder, in contrast, a cluster has be far away from the long-range ordered bulk to be isolated. This reduces the cluster probability and leads to ferromagnetic Griffiths singularities that are weaker than the power laws on the paramagnetic side Motrunich et al. (2000). The disorder in Ni1-xVx is not purely percolational because the material is a metal, but it is rather strong because each V atom creates a large local defect. The strength of the quantum Griffiths singularities is therefore expected to be between the above limiting cases, in agreement with our observations. However, the existing theories cannot explain the striking symmetry in of the Griffiths singularities found here 555Such a symmetry does occur in certain one-dimensional random spin chains Fisher (1992); *Fisher95, but it does not generalize to higher dimensions.. This remains a challenge for future work.
This work was supported by the NSF under Grant No. DMR-1506152 and by EPSRC (UK). We are grateful for the provision of beam time at the STFC ISIS Muon Facility and SS, Paul Scherrer Institut, Switzerland. This work has benefitted from the use of NPDF at the Los Alamos Neutron Science Center, Los Alamos National Laboratory, funded by the US Department of Energy. Part of this research was conducted at the NOMAD instrument at the Spallation Neutron Source, a US Department of Energy Office of Science User Facility operated by Oak Ridge National Laboratory.
References
- Sachdev (1999) S. Sachdev, Physics World 12, 33 (1999).
- von Löhneysen et al. (2007) H. von Löhneysen, A. Rosch, M. Vojta, and P. Wölfle, Rev. Mod. Phys. 79, 1015 (2007).
- Fisher (1992) D. S. Fisher, Phys. Rev. Lett. 69, 534 (1992).
- Fisher (1995) D. S. Fisher, Phys. Rev. B 51, 6411 (1995).
- Thill and Huse (1995) M. Thill and D. A. Huse, Physica A 214, 321 (1995).
- Castro Neto and Jones (2000) A. H. Castro Neto and B. A. Jones, Phys. Rev. B 62, 14975 (2000).
- Vojta and Schmalian (2005) T. Vojta and J. Schmalian, Phys. Rev. B 72, 045438 (2005).
- Hoyos et al. (2007) J. A. Hoyos, C. Kotabage, and T. Vojta, Phys. Rev. Lett. 99, 230601 (2007).
- Vojta et al. (2009) T. Vojta, C. Kotabage, and J. A. Hoyos, Phys. Rev. B 79, 024401 (2009).
- Del Maestro et al. (2008) A. Del Maestro, B. Rosenow, M. Müller, and S. Sachdev, Phys. Rev. Lett. 101, 035701 (2008).
- Vojta (2006) T. Vojta, J. Phys. A 39, R143 (2006).
- Vojta (2010) T. Vojta, J. Low Temp. Phys. 161, 299 (2010).
- Sereni et al. (2007) J. G. Sereni, T. Westerkamp, R. Küchler, N. Caroca-Canales, P. Gegenwart, and C. Geibel, Phys. Rev. B 75, 024432 (2007).
- Westerkamp et al. (2009) T. Westerkamp, M. Deppe, R. Küchler, M. Brando, C. Geibel, P. Gegenwart, A. P. Pikul, and F. Steglich, Phys. Rev. Lett. 102, 206404 (2009).
- Ubaid-Kassis et al. (2010) S. Ubaid-Kassis, T. Vojta, and A. Schroeder, Phys. Rev. Lett. 104, 066402 (2010).
- Schroeder et al. (2011) A. Schroeder, S. Ubaid-Kassis, and T. Vojta, J. Phys. Condens. Matter 23, 094205 (2011).
- Senthil and Sachdev (1996) T. Senthil and S. Sachdev, Phys. Rev. Lett. 77, 5292 (1996).
- Motrunich et al. (2000) O. Motrunich, S. C. Mau, D. A. Huse, and D. S. Fisher, Phys. Rev. B 61, 1160 (2000).
- Note (1) Unusual scaling behavior in the ferromagnetic phase of URu2-xRexSi2 was initially suggested to stem from a Griffiths phase but later work showed that this is likely not the case Bauer et al. (2005); Butch and Maple (2009).
- Brando et al. (2016) M. Brando, D. Belitz, F. M. Grosche, and T. R. Kirkpatrick, Rev. Mod. Phys. 88, 025006 (2016).
- Schroeder et al. (2014) A. Schroeder, R. Wang, P. J. Baker, F. L. Pratt, S. J. Blundell, T. Lancaster, I. Franke, and J. S. Möller, J. Phys. Conf. Series 551, 012003 (2014).
- (22) See Supplemental Material in XXX with Refs. Gebretsadik et al. ; Proffen et al. (2002); Neuefeind et al. (2012); Proffen and Billinge (1999); *PDFgui; Proffen et al. (2009); Liu et al. (2016); Kornilov and Pomjakushin (1991); Pratt (2000) for details on sample preparation, experiments and SR analysis.
- Bölling (1968) F. Bölling, Phys. Kondens. Mater. 7, 162 (1968).
- Gregory and Moody (1975) I. P. Gregory and D. E. Moody, J. Phys. F: Met. Phys. 5, 36 (1975).
- Nicklas et al. (1999) M. Nicklas, M. Brando, G. Knebel, F. Mayr, W. Trinkl, and A. Loidl, Phys. Rev. Lett. 82, 4268 (1999).
- Friedel (1958) J. Friedel, Nuovo Cimento 7, 287 (1958).
- Collins and Low (1965) M. F. Collins and G. G. Low, Proceedings of the Physical Society 86, 535 (1965).
- Wang et al. (2015) R. Wang, S. Ubaid-Kassis, A. Schroeder, P. Baker, F. Pratt, S. Blundell, T. Lancaster, I. Franke, J. Möller, and T. Vojta, J. Phys. Conf. Series 592, 012089 (2015).
- Note (2) This estimate of is somewhat smaller than the value obtained in Ref. Ubaid-Kassis et al. (2010) from the -dependence of the susceptibility exponent . The deviation is within the error bars.
- Dobrosavljevic and Miranda (2005) V. Dobrosavljevic and E. Miranda, Phys. Rev. Lett. 94, 187203 (2005).
- Note (3) If the relevant rare regions are so large that order parameter conservation hampers the dynamics of the clusters, the functional form of the Griffiths singularities changes Nozadze and Vojta (2012). Based on a typical cluster moment of about 12\tmspace+.1667em at Ubaid-Kassis et al. (2010); Schroeder et al. (2011), this likely does not play a role here.
- Note (4) This measure somewhat overestimates the cluster contribution because in 50 kOe also contains the bulk response to the field.
- Blundell (1999) S. J. Blundell, Contemporary Physics 40, 175 (1999).
- Yaouanc and Dalmas de Reotier (2011) A. Yaouanc and P. Dalmas de Reotier, Muon Spin Rotation, Relaxation, and Resonance: Applications to Condensed Matter (Oxford University Press, Oxford, 2011).
- Amato (1997) A. Amato, Rev. Mod. Phys. 69, 1119 (1997).
- Uemura et al. (1985) Y. J. Uemura, T. Yamazaki, D. R. Harshman, M. Senba, and E. J. Ansaldo, Phys. Rev. B 31, 546 (1985).
- MacLaughlin et al. (2004) D. E. MacLaughlin, R. H. Heffner, O. O. Bernal, K. Ishida, J. E. Sonier, G. J. Nieuwenhuys, M. B. Maple, and G. R. Stewart, J. Phys. Condens. Matter 16, S4479 (2004).
- Hayano et al. (1979) R. S. Hayano, Y. J. Uemura, J. Imazato, N. Nishida, T. Yamazaki, and R. Kubo, Phys. Rev. B 20, 850 (1979).
- Noakes and Kalvius (1997) D. R. Noakes and G. M. Kalvius, Phys. Rev. B 56, 2352 (1997).
- Note (5) Such a symmetry does occur in certain one-dimensional random spin chains Fisher (1992); *Fisher95, but it does not generalize to higher dimensions.
- Bauer et al. (2005) E. D. Bauer, V. S. Zapf, P.-C. Ho, N. P. Butch, E. J. Freeman, C. Sirvent, and M. B. Maple, Phys. Rev. Lett. 94, 046401 (2005).
- Butch and Maple (2009) N. P. Butch and M. B. Maple, Phys. Rev. Lett. 103, 076404 (2009).
- (43) A. Gebretsadik, R. Wang, A. Schroeder, and K. Page, To be published.
- Proffen et al. (2002) T. Proffen, T. Egami, S. Billinge, A. Cheetham, D. Louca, and J. Parise, Appl. Phys. A 74, s163 (2002).
- Neuefeind et al. (2012) J. Neuefeind, M. Feygenson, J. Carruth, R. Hoffmann, and K. K. Chipley, Nuclear Instruments and Methods in Physics Research B 287, 68 (2012).
- Proffen and Billinge (1999) T. Proffen and S. J. L. Billinge, J. Appl. Crystallogr. 32, 572 (1999).
- Farrow et al. (2007) C. L. Farrow, P. Juhas, J. W. Liu, D. Bryndin, E. S. Bozin, J. Bloch, T. Proffen, and S. J. L. Billinge, J. Phys. Condens. Matter 19, 335219 (2007).
- Proffen et al. (2009) T. Proffen, V. Petkov, S. J. L. Billinge, and T. Vogt, Zeitschrift für Kristallographie - Crystalline Materials 217, 47 (2009).
- Liu et al. (2016) J. Liu, A. Huq, Z. Moorhead-Rosenberg, A. Manthiram, and K. Page, Chemistry of Materials 28, 6817 (2016).
- Kornilov and Pomjakushin (1991) E. Kornilov and V. Pomjakushin, Physics Letters A 153, 364 (1991).
- Pratt (2000) F. Pratt, Physica B 289-290, 710 (2000).
- Nozadze and Vojta (2012) D. Nozadze and T. Vojta, Phys. Rev. B 85, 174202 (2012).
Supplemental material for
Quantum Griffiths phase inside the ferromagnetic phase of Ni1-xVx
S1. Sample preparation and experimental procedures
Polycrystalline spherical samples of Ni1-xVx with V concentrations to 15% were prepared by arc melting from high purity elements (Ni 99.995%, Ni58 99.9%, V 99.8%), annealed at 900 - 1050∘C for 3 days, cooled rapidly (C/min) and characterized as described in Refs. Ubaid-Kassis et al. (2010); Schroeder et al. (2014).
Magnetization and ac-susceptibility were measured in a Quantum Design SQUID magnetometer and in an Oxford 3He/4He dilution or 4He cryostat equipped with a pickup coil. A small orbital contribution has been subtracted from the magnetization as explained in Ubaid-Kassis et al. (2010), and all data (except the ac susceptibility) are demagnetized displaying the internal field .
Muon spin rotation (SR) data were collected at the DOLLY instrument at Swiss Muon Source (SS), Paul Scherrer Institut and at the MuSR instrument at the ISIS facility using 7-30 pellets of each composition wrapped in silver foil. All samples were measured at DOLLY in a similar Ag-mount, the compound was also investigated in different cryostats at MuSR. The asymmetry is shown for the DOLLY data, the other data (with different background) are corrected to match.
To probe the structure and chemical distribution, neutron diffraction data of the same samples were collected Gebretsadik et al. at the NPDF instrument Proffen et al. (2002) at the Los Alamos Neutron Science Center and at the NOMAD instrument Neuefeind et al. (2012) at the Spallation Neutron Source. A detailed pair distribution function analysis (using PDFgui Proffen and Billinge (1999); *PDFguisup) does not reveal any deviations from a FCC-lattice with random occupancy of V atoms, the fit quality for is as high as in pure Ni. PDF data is known to be sensitive to presence and length-scale of chemical short range order Proffen et al. (2009); Liu et al. (2016). While simulated neutron PDF patterns of several V aggregate models confirm a weak sensitivity to the presence of V, V-cluster model fits Gebretsadik et al. to experimental data were found inferior to random occupancy model fits. The lattice constant and the average atomic displacements increase with as expected due to the larger V-radius ()Gebretsadik et al. .
S2. Raw data and details of the muon spin rotation analysis
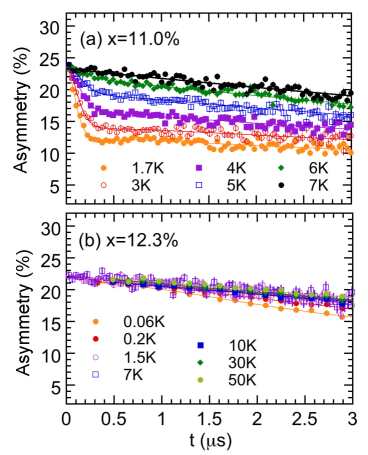
The muon asymmetries in zero magnetic field for samples having compositions , 4%, 10%, 11%, and 12.3% are shown in Figs. S1 and S2. We model these data over the entire composition and temperature range by a superposition of a ferromagnetic component with amplitude , a paramagnetic component with amplitude and a small constant background ,
| (S1) |
is mainly due to the silver mount and was about for all Ni1-xVx samples (measured in DOLLY instrument). The paramagnetic component is well described by simple exponential decay,
| (S2) |
It is dominated by the quasistatic nuclear V-spins and also contains the effects of fluctuating Ni magnetic clusters. For the nuclear spins, the exponential decay can be understood as the short term limit of a Lorentzian Kubo-Toyabe form appropriate for the diluted V atoms. The fluctuations of Ni magnetic clusters are expected to be fast in this d-metal system with high . The average decay rate is thus very small and well in the motional narrowing regime.
The ferromagnetic component is modeled by different functional forms depending on the composition (see e.g. overview in Ref. Schroeder et al. (2014)). For and 4%, we use a generalized Kubo-Toyabe Hayano et al. (1979) form Kornilov and Pomjakushin (1991); Yaouanc and Dalmas de Reotier (2011),
| (S3) |
It corresponds to a Gaussian distribution of the local magnetic fields with a nonzero mean and width with MHz/T. If , this function reduces to a simple undamped oscillation indicating a homogeneous field (at the same stopping site) in a uniform ferromagnet, as observed for . For %, we use a static Kubo-Toyabe (KT) Hayano et al. (1979) function
| (S4) |
at low temperatures. It indicates a Gaussian distribution of local fields with negligible mean and width . At temperatures closer to , a dynamic KT form with a finite fluctuation rate provides a better fit (using the WIMDA program Pratt (2000)).
The KT form works well for up to 10% but fails for . (Note that longitudinal-field data do not support a dynamic KT form for these samples Schroeder et al. (2014).) A better description for is achieved by using a broader static field distribution. A Gaussian broadened Gaussian (GBG) is the superposition of multiple Gaussians whose widths themselves are Gaussian distributed with mean and width . It takes the form Noakes and Kalvius (1997)
| (S5) |
with , where is a relative distribution width and is the square of the recorded effective width. To account for dynamics, the longitudinal term was multiplied by an exponential giving
| (S6) |
where is the fluctuation rate of the field.
The evolution of the mean and width of the local-field distribution with at low temperatures is shown in Fig. S3. The average field decreases rapidly with as the probability of large domains is reduced beyond , while the width shows a maximum at about . An effective field is linearly suppressed with and can be scaled directly to the mean magnetic moment Schroeder et al. (2014).
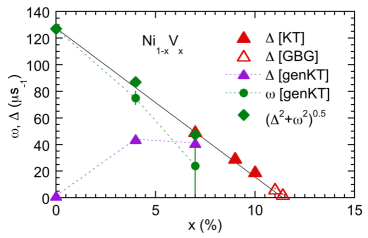
Figure S4 shows additional SR details for the samples analyzed in the main text, and .
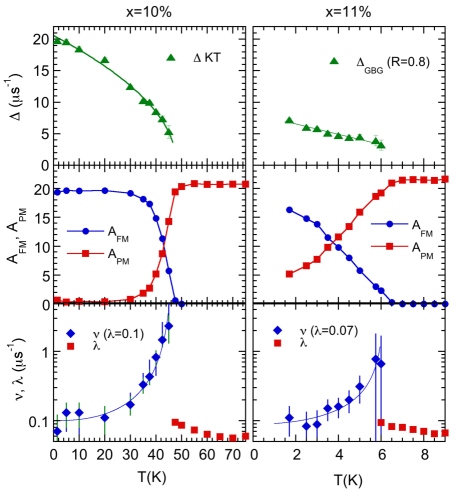
For , a single Gaussian () is sufficient to represent the local field distribution. Its width vanishes at , defined by the vanishing of (which matches determined from thermodynamic measurements Wang et al. (2015)). The FM contribution reaches nearly at low . In contrast, for , a broad field distribution ( used for all ) is required to describe the increased inhomogeneities close to ; and the effective distribution width does not vanish at . Even at the lowest temperatures, the FM contribution does not reach 100%, instead about 20% of remains paramagnetic. In both compounds the FM contribution is essentially static at low (fluctuation rate ); it becomes more dynamic towards . The decay rate of the PM component increases towards the phase transition indicating that it is sensitive towards the magnetic fluctuations of the Ni spins and clusters.
We note in passing that the behavior of the sample close to can also be described by a stretched exponential form with . Such behavior is often found for spin glasses Uemura et al. (1985) or in non-Fermi liquid compounds MacLaughlin et al. (2004) and implies multiple time scales and/or spatial correlations. At lower temperatures , a single stretched exponential form cannot account for the short and long time depolarization. The very different depolarization rates are better represented by a two-component model (S1).
Our analysis of the SR data thus demonstrates that the sample features strongly inhomogeneous static ferromagnetic order coexisting with fluctuating magnetic clusters.
References
- Ubaid-Kassis et al. (2010) S. Ubaid-Kassis, T. Vojta, and A. Schroeder, Phys. Rev. Lett. 104, 066402 (2010).
- Schroeder et al. (2014) A. Schroeder, R. Wang, P. J. Baker, F. L. Pratt, S. J. Blundell, T. Lancaster, I. Franke, and J. S. Möller, J. Phys. Conf. Series 551, 012003 (2014).
- (3) A. Gebretsadik, R. Wang, A. Schroeder, and K. Page, To be published.
- Proffen et al. (2002) T. Proffen, T. Egami, S. Billinge, A. Cheetham, D. Louca, and J. Parise, Appl. Phys. A 74, s163 (2002).
- Neuefeind et al. (2012) J. Neuefeind, M. Feygenson, J. Carruth, R. Hoffmann, and K. K. Chipley, Nuclear Instruments and Methods in Physics Research B 287, 68 (2012).
- Proffen and Billinge (1999) T. Proffen and S. J. L. Billinge, J. Appl. Crystallogr. 32, 572 (1999).
- Farrow et al. (2007) C. L. Farrow, P. Juhas, J. W. Liu, D. Bryndin, E. S. Bozin, J. Bloch, T. Proffen, and S. J. L. Billinge, J. Phys. Condens. Matter 19, 335219 (2007).
- Proffen et al. (2009) T. Proffen, V. Petkov, S. J. L. Billinge, and T. Vogt, Zeitschrift für Kristallographie - Crystalline Materials 217, 47 (2009).
- Liu et al. (2016) J. Liu, A. Huq, Z. Moorhead-Rosenberg, A. Manthiram, and K. Page, Chemistry of Materials 28, 6817 (2016).
- Hayano et al. (1979) R. S. Hayano, Y. J. Uemura, J. Imazato, N. Nishida, T. Yamazaki, and R. Kubo, Phys. Rev. B 20, 850 (1979).
- Kornilov and Pomjakushin (1991) E. Kornilov and V. Pomjakushin, Physics Letters A 153, 364 (1991).
- Yaouanc and Dalmas de Reotier (2011) A. Yaouanc and P. Dalmas de Reotier, Muon Spin Rotation, Relaxation, and Resonance: Applications to Condensed Matter (Oxford University Press, Oxford, 2011).
- Pratt (2000) F. Pratt, Physica B 289-290, 710 (2000).
- Noakes and Kalvius (1997) D. R. Noakes and G. M. Kalvius, Phys. Rev. B 56, 2352 (1997).
- Wang et al. (2015) R. Wang, S. Ubaid-Kassis, A. Schroeder, P. Baker, F. Pratt, S. Blundell, T. Lancaster, I. Franke, J. Möller, and T. Vojta, J. Phys. Conf. Series 592, 012089 (2015).
- Uemura et al. (1985) Y. J. Uemura, T. Yamazaki, D. R. Harshman, M. Senba, and E. J. Ansaldo, Phys. Rev. B 31, 546 (1985).
- MacLaughlin et al. (2004) D. E. MacLaughlin, R. H. Heffner, O. O. Bernal, K. Ishida, J. E. Sonier, G. J. Nieuwenhuys, M. B. Maple, and G. R. Stewart, J. Phys. Condens. Matter 16, S4479 (2004).