Chromospherically Active Stars in the RAVE Survey. II. Young dwarfs in the Solar neighborhood
Abstract
A large sample of over 38,000 chromospherically active candidate solar-like stars and cooler dwarfs from the RAVE survey is addressed in this paper. An improved activity identification with respect to the previous study was introduced to build a catalog of field stars in the Solar neighborhood with an excess emission flux in the calcium infrared triplet wavelength region.
The central result of this work is the calibration of the age–activity relation for the main sequence dwarfs in a range from a few up to a few Gyr. It enabled an order of magnitude age estimation of the entire active sample. Almost 15,000 stars are shown to be younger than and 2000 younger than . The young age of the most active stars is confirmed by their position off the main sequence in the versus diagram showing strong ultraviolet excess, mid-infrared excess in the versus diagram and very cool temperatures (). They overlap with the reference pre-main sequence RAVE stars often displaying X-ray emission. The activity level increasing with the color reveals their different nature from the solar-like stars and probably represents an underlying dynamo generating magnetic fields in cool stars.
50% of the RAVE objects from DR5 are found in the TGAS catalog and supplemented with accurate parallaxes and proper motions by Gaia. This makes the database of a large number of young stars in a combination with RAVE’s radial velocities directly useful as a tracer of the very recent large-scale star formation history in the Solar neighborhood. The data are available online in the Vizier database.
I. Introduction
A large portion of solar-like and later-type dwarf stars exhibit signs of chromospheric activity during their young ages, especially before they reach Solar age (2008ApJ...687.1264M, hereafter M08). Chromospheric activity develops in stars with a subsurface convective layer, i.e., stars in the cooler part of the Hertzsprung-Russell diagram. There are two components responsible for the excessive emission flux. The dominant component is produced by a complex rotation-driven magnetic dynamo. It is superimposed on the basal emission (e.g., 1989ApJ...337..964S) originating from the acoustic energy released into the atmosphere from the ubiquitous convective cells. While the basal emission remains constant the loss of the angular momentum of the star over time leads to the decline of the rotation period and activity. Because the decline of the excess flux over hundreds of millions of years exceeds the short-term variations on the scales of days (stellar flares), months (starspot rotation) and decades (Solar 11-year cycle analogues) - e.g., 2004ApJS..152..261W - this observable is a suitable age estimator. While precise dating is not possible due to many reasons (e.g. pre-main sequence and zero-age main sequence stars exhibit a broad range of activity levels at a given age, 2010ARA&A..48..581S), an order of magnitude age estimate is easily attainable in the range from a few tens of millions of years up to a few Gyr.
In contrast to the more fundamental but observationally demanding gyrochronology-based dating, the detection of chromospheric activity is straightforward as it manifests itself in a wide range of emission intensities in the strongest spectral lines (, , Ca II H&K, Ca II infrared triplet; Mg II h&k – the latter not visible from the ground). A single spectral measurement with moderate signal-to-noise ratio ( per pixel) and mid-range resolving power is adequate for stellar age estimation using the age-activity relation. This fact is of huge importance in the era of large Milky Way spectroscopic surveys covering hundreds of thousands of stars as it enables the age estimation of a large number of young candidates. Such catalogs of young stars enhanced with the individual abundances (e.g., Galah (2015MNRAS.449.2604D) and Gaia-ESO (2014A&A...570A.122S) Surveys) and astrometric data and parallaxes from Gaia (2015A&A...574A.115M) hold a huge potential for the investigation not only of the recent star formation history in the Solar neighborhood and the evolution of the Milky Way galaxy but the nature of stellar dynamo mechanisms and the influence of stellar activity and abundances on the planetary environments as well.
In this paper we investigate the data from the RAVE Survey (RAdial Velocity Experiment111https://www.rave-survey.org/, 2006AJ....132.1645S; 2008AJ....136..421Z; 2011AJ....141..187S; 2013AJ....146..134K; 2016arXiv160903210K). While most of the literature studying chromospheric activity covers the strong Ca II H&K (3967 and ; 2015RAA....15.1282Z for example report on a catalog of 120,000 F, G, and K stars with the Ca II H&K emission in the first LAMOST data release), RAVE focuses on the Ca II infrared triplet (Ca II IRT; 8498, 8542 and ). The latest data release (DR5, 2016arXiv160903210K) includes 520,781 multi-fibre spectroscopic measurements of 457,588 stars collected between 2003 and 2013 with radial velocity determination being one of the main goals of the survey.
With the help of an efficient unsupervised stellar classification algorithm based on normalized stellar fluxes and independent of stellar parameters (locally linear embedding, 2012ApJS..200...14M, hereafter M12) tens of thousands of candidate active stars have been uncovered. A large catalog of 44,000 candidate chromospherically active RAVE stars described in the first paper in the series (2013ApJ...776..127Z, hereafter Z13) contains over 14,000 stars above the excess emission detection limit.
Around 65% of all the objects in the RAVE database (and 60% of the active candidates) are also found in the Tycho-2 astrometric catalog (2000A&A...355L..27H). Because these dwarfs reside in the Solar neighborhood their distance errors in the first Gaia data release (TGAS: “using the positions from the Tycho-2 Catalog as additional information for a joint solution with early Gaia data”; 2015A&A...574A.115M) are expected to be of the order of 10%, a number that will become considerably more precise with future data releases (reaching a level of %, e.g., 2013A&A...559A..74B). The catalog of active stars in combination with radial velocities (provided by RAVE) and reliable distances and proper motions will directly enable the study of the early stellar evolution and recent star formation history in the local neighborhood.
The dataset will be significantly enhanced by the Gaia-RVS catalog (Radial Velocity Spectrometer, covering the same Ca II IRT domain, 2004MNRAS.354.1223K; 2011EAS....45..181C). By the end of the mission the set of around 9 million stars (with their magnitude brighter than and the signal-to-noise ratio of their spectra over 20 per pixel) will be the largest database to look for active stars in.
In paper I (Z13) we listed our selection of candidate active stars, in the present paper II we derive their ages. First we introduce an improved activity identification procedure by elimination of stars with non-chromospheric sources of emission from the original catalog (Sec. II). The catalog is enhanced with 46 additional very active candidates not included in Z13. A study of the versus diagram in Sec. LABEL:sec.photometry shows an offset of the youngest stars with the highest emission levels from the main sequence. This group of stars accumulates in a relatively confined part of the plot where young, T Tauri, pre-main sequence stars and stars with X-ray emission are found. A calibration of the age–activity relation using ages from the literature is presented in Sec. LABEL:sec.age as the leading result of this paper which allows an order of magnitude age determination for more than 22,000 young RAVE stars in the Solar neighborhood. The lower and upper distance limit determination is described in Sec. LABEL:sec.distance. Conclusions with a discussion, open questions and future plans including orbital simulations of the youngest stars using Gaia astrometry are presented in Sec. LABEL:sec.discussion. A table of the external reference ages used in the age–activity relation calibration is presented in the Appendix.
II. Improved catalog
The catalog of candidate active stars used in this work is described in detail by Z13. Here we very briefly review the determination of activity levels and basic characteristics of the sample to allow the reader to better understand the context of present study.
Chromospheric activity in the RAVE domain manifests itself in an excessive emission flux in the Ca II IRT while the rest of the spectrum remains indistinguishable from an inactive state. The strength of the emission can range from marginally detectable levels to individual cases with fluxes above the continuum level. The qualitative classification of the RAVE database using the locally linear embedding (LLE) technique (M12) entirely based on normalized spectra revealed over 44,000 stars with the possible presence of an excessive emission in the Ca II IRT. For the detailed selection criteria see Z13.
The photospheric component of the flux was eliminated from the active candidate star by the subtraction of the best-matching inactive template spectrum. For the purpose of the spectral subtraction technique a database of over 12,000 inactive single solar-like or later-type main sequence dwarfs with no emission or any other peculiarities was built from the measured RAVE sample. Although chromospheric activity has been detected in evolved stars (e.g. 1976ApJ...205..823W), objects with were excluded from the inactive sample because magnetic activity is not expected to be notably present in giant stars above the main sequence. 1984A&A...130..353R (hereafter R84) showed that the emission rate in evolved stars is very close to the basal level.
The number of stars in the inactive set is sufficient to cover the entire parameter space of active candidates, including the effective temperature, gravity and metallicity, varied noise realizations as well as possible variations of resolving power along the spectra. Most of the inactive stars are concentrated around the Solar temperature. It becomes less likely to find an inactive star in the cooler regions of the main sequence because active stars become more and more dominant there. Due to lack of inactive stars above the main-sequence the same database of 12,000 stars is used for the activity estimation of the pre-main sequence stars.
The advantage of the approach using the measured inactive library from the RAVE Survey in contrast to a synthetic dataset is the fact that active and inactive sets share the same instrumental profile of the spectra (e.g. resolving power and point-spread function along the spectra). It avoids problems with an invalid assumption of the local thermodynamic equilibrium in the chromospheric layer used in models which affects the cores of the strongest lines that are at the same time sensitive to magnetic activity. Moreover, the determination of the best-matching templates is parameter-free because it is based solely on the comparison of the normalized fluxes of active and inactive spectra. Atmospheric parameters are excluded from the template search. This is an important aspect as values for the highly active stars, together with the radial velocities, could be inaccurate due to the influence of the excessive flux. Additionally, the parameter estimation for RAVE stars with a temperature cooler than 4000 K shows systematic offsets. The search for the best-matching template by a comparison of the normalized fluxes was performed in an iterative algorithm to apply radial velocity corrections. To avoid the impact of the shallower calcium lines these regions were eliminated across a range of from the line cores of all active and template spectra. Equivalent widths of the excessive emission for each calcium line in the spectrum combined into the sum are used as the activity proxy.
For reference, activity of the inactive database was estimated using the same method. The distribution of equivalent widths in the latter case is centred at with a standard deviation of . An investigation of the subtracted spectra revealed that their average value outside calcium lies slightly below zero ( in the normalized flux units) which translates to the negative offset of the emission equivalent width. is accepted as an internal error on the derived .
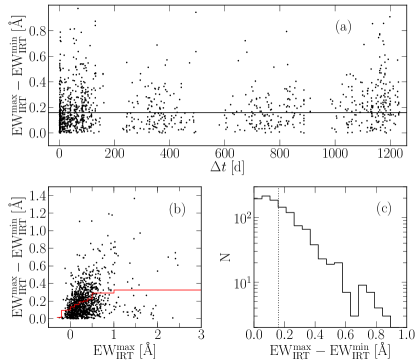
Another contribution to the uncertainty is the intrinsic time variability of the activity on the scales of days (stellar flares), months (starspot rotation) and decades (Solar 11-year cycle analogues). The statistics of the repeated observations of the same active stars from the active RAVE catalog (1146 stars, of which 30% were observed more than twice) shows that the median difference between the minimum and maximum values of activity for a single star () is (Fig. 1, panel a). In general more active stars show higher variability rates (1998ApJS..118..239R). A moving average of versus confirms the statement (panel b). For stars with between 1 and the mean variability is (panel c). It is important to stress that intrinsic variations of the chromospheric activity occur on time scales from days to months and tens of years (due to flares, stellar rotation of active regions and spots and 11-year Solar cycle analogs). The variations are smaller than the global decline of the activity with time.
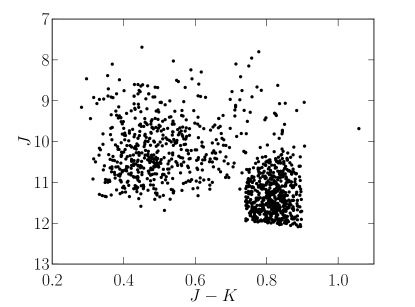
II.1. The Aquarius overdensity
The Aquarius stream, which is known to consist of at least 15 stars between and has been identified in the RAVE data by 2011ApJ...728..102W. The stream members are giants at distances of with radial velocities and estimated to be old. An additional group of 11 adjacent fields of red stars with was intentionally observed by RAVE in the direction of the Aquarius constellation at and in order to collect more stream candidates. As a consequence, a supplementary set of red dwarfs was observed as well. As the probability for activity increases toward the lower part of the main sequence, many of them turned out to be active (Fig. 2). Nevertheless, the number of all observed stars in Aquarius and the number of all dwarfs with , proper motions and radial velocities show no other peculiarities with respect to similar regions at the same Galactic latitude.
The ratio between red () active stars and all red RAVE dwarfs in Aquarius is at least 80%. The same is true for stars with . For this reason the Aquarius fields notably contribute to the statistics of the reddest active stars which are otherwise underpopulated in the RAVE sample due to their low luminosities.
II.2. Improved activity identification
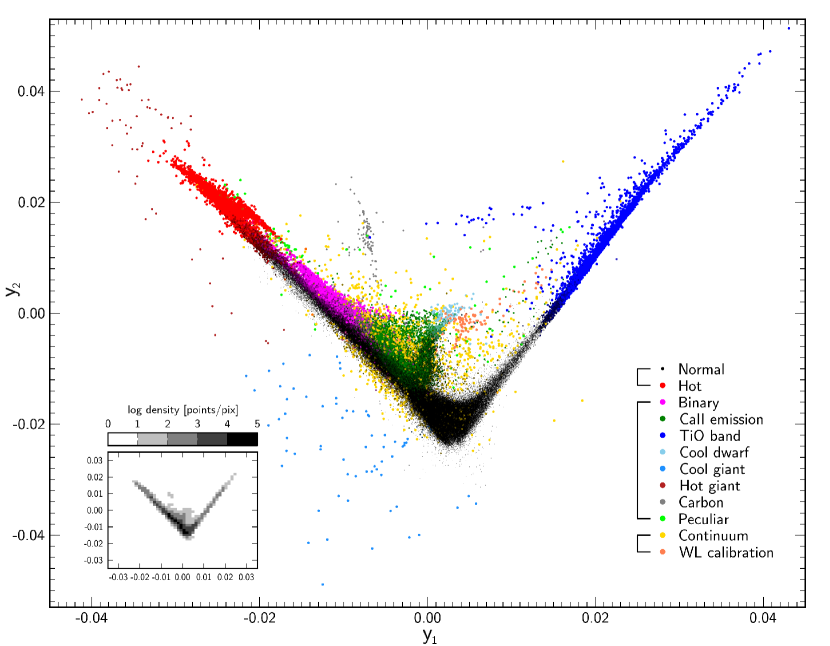
The selection of candidates in the catalog is based on the set of morphological flags produced by the spectral classification technique. The classification algorithm compares the flux of the spectrum in question with fluxes from the reference database. The reference database was set up in the process involving a locally linear embedding (LLE). LLE is a general dimensionality reduction procedure that conserves relations between the neighboring points of the high-dimensional manifold. Because a selected spectrum in the projected space is surrounded by its neighbors from the high-dimensional space, the algorithm is useful for the classification purposes. An example of the projection of the RAVE data in the two-dimensional space is shown in Fig. 3 where different colors indicate 11 distinct classes of spectra.
The method includes three steps. After the nearest neighbors are found for each data point in the original space, the set of weights that best describe the data point as a linear combination of its neighbors is derived. The final, key step is a projection on the low-dimensional space where each point is still best represented by the same weights from the previous step. For the details about the key steps see M12 or 2000Science...190...2323R; 2009AJ....138.1365V and references therein.
The classification of the RAVE data was broken down into two crucial steps. First, a reference database of the most representative spectra was established by iteratively sifting the most dense areas of the LLE projection containing the most populated groups of stars. This way all distinct classes of objects were represented as evenly as possible in the final dataset. The reference set was then manually assigned classification flags of 11 distinct morphological classes. The classification of the rest of the RAVE spectra was calculated in the second step by comparing the spectra to the reference set. The outcome for each spectrum is a list of 20 flags ordered by the distance between the flux and its nearest reference neighbors. For more details see M12.
A star was selected as an active candidate when at least one nearest neighbor within its first 6 neighbors from the LLE reference database showed an emission-type spectrum. While this relatively loose criterion helps to unravel marginally active spectra, it on the other hand contaminates the catalog with individual peculiar stars (where some of their nearest neighbors show unsuitable morphology, e.g., binaries, giants etc.). The aim of an improved activity identification is thus the elimination of active candidates that show peculiarity other than an excess emission in the Ca II IRT.
The search for such stars was performed in a few independent ways including nearest neighbor investigation, morphology notes and spectral types from the Simbad database and visual spectral inspection of the most active stars with manual elimination besides manual exclusion of stars with inadequate atmospheric parameters. Each star was examined by all these criteria.
The largest group of suspicious active candidates were giants with (6147 stars). Such stars were excluded from the candidate list introduced in Z13.
An additional 68 hot stars with Paschen lines and shallow calcium lines mistaken for activity were recognized manually. If any of the repeated observations (where available) were recognized as binary all spectra of such objects were removed (101 spectra).
Spectra with were manually checked for systematic errors. A few additional cases with peculiar fluxes were eliminated.
| Type of peculiarity | N |
|---|---|
| 5465 | |
| LLE b | 1490 |
| Double or Binary | 541+37 |
| LLE e, | 323 |
| LLE e | 194 |
| SimbadSpType | 110 |
| LLE c | 107 |
| LLE b, | 104 |
| , SimbadSpType | 59 |
| LLE e, LLE o | 56 |
| LLE b, Binary or Double | 51+34 |
| LLE e, LLE b | 46 |
| , Double | 44 |
| Galaxy | 34 |
| LLE e, LLE o, Hot | 28 |
| , LLE t, LLE p, | 27 |
| LLE e, SimbadSpType | 26 |
| LLE c, | 22 |
| LLE e, , SimbadSpType | 21 |
| Mira | 18 |
| LLE e, , LLE o | 14 |
| LLE b, SimbadSpType | 12 |
| LLE e, LLE o, SimbadSpType | 12 |
| LLE t, LLE p, | 11 |
| BY Dra | 10 |
| Other | 242 |
| Total | 9138 |
The nearest LLE neighbor investigation revealed binary candidates (marked as LLE b) with more than 2 binary neighbors (or the first or the second neighbor is a binary), stars with continuum problems (LLE c), wavelength calibration errors (LLE w), hot stars (LLE o), stars with TiO bands (LLE t) and other types of peculiarity (LLE p).
LLE e denotes stars with no emission-type neighbors (a few 100 stars). These stars were originally included in the catalog because they are candidate members of young clusters and were tested for possibly overlooked emission, especially for cases with a faulty radial velocity shift of several due to very strong emission. They were removed from the sample because they do not meet the LLE selection criteria.
A cross-check using the online Simbad database for stars with available morphology types (25,238 objects) confirmed the presence of binaries, Miras (marked as ’LLE t, LLE p, ’ in the table), Cepheids, galaxies (34 cases; most objects are actually stars with galaxies located nearby within ), stars of BY Dra, RS CVn and RR Lyr type, 9 (micro)lensing events, red giant branch and carbon stars, gamma-ray sources and 2 stars of an unknown nature. The frequency of peculiar Simbad morphology types is less than 3%. Note that spectra of RS CVn-type stars can look identical to active single stars and BY Dra stars can mimic chromospheric activity. Because the frequency of such known stars in the active sample is relatively small (13 RS CVn and 28 BY Dra objects) it is assumed that only a few individual cases could be left unrecognised in the database.
Simbad spectral types (’SimbadSpType’) available for 4691 stars uncovered B, A and F-types and giants (luminosity classes I, II and III). The rest of the spectra has a clear peak on the main sequence: most of the stars are G- and K-type dwarfs.
9138 stars were removed in total from the initial catalog. A list of the number of stars meeting either of the rejection criteria described above is given in Table 1.
46 new active (young) candidates were found during the Simbad classification study (‘T Tau’, ‘Pre-main sequence’ and ‘Young’ types). These stars were not recognized as active by the LLE technique because they do not show signs of activity or have large radial velocity shifts (not derived correctly due to their strong emission) that make them look very peculiar. However, when allowing for these radial velocity shifts, 24 stars out of 46 were found to have and 16 with .
Inspection of the new spectra, first listed in DR5, revealed new active candidates. After the removal of unsuitable cases following the same requirements as above, 2919 new spectra of 2882 stars were found to show signs of activity. The sample was added to the catalog.
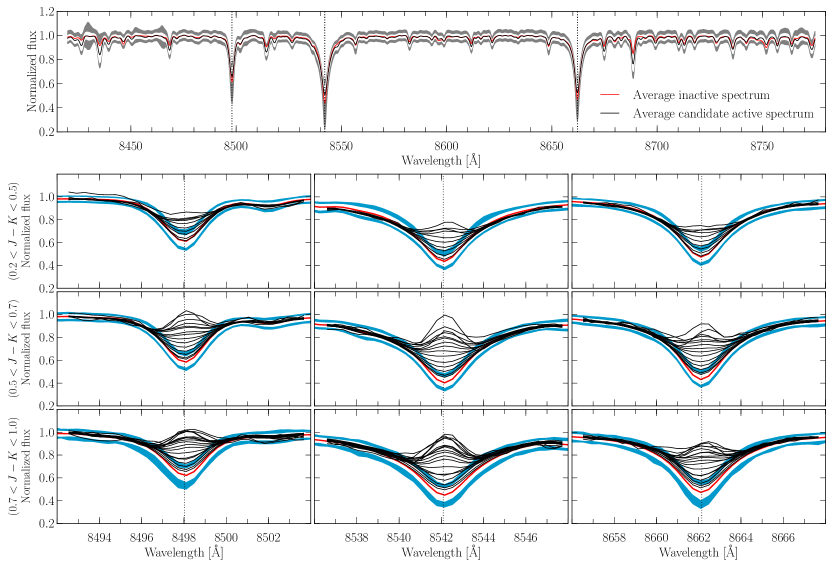
An averaged spectrum in the decontaminated catalog together with 1 and flux variations is compared with the averaged spectrum from the inactive database in Figure 4. The main contribution to the variations is a range of different atmospheric temperatures (see Sec. LABEL:sec.photometry for further discussion) and noise. The average variation of the continuum parts is in the middle and at the very ends of the spectrum. The value is consistent with the signal-to-noise estimation. Notable variation occurs within the strong lines, e.g. Ti I , Fe I , etc. due to the temperature variations of the spectra (and to a smaller extent due to metallicity).
Because marginally active stars outnumber the stars with higher emission levels due to the selection criteria the average calcium lines almost match the inactive profiles. However, averaged spectra within the selected activity ranges (an range from 0 to with stepsize of ) reveal a continuous and solid increase of excess emission fluxes (Fig. 4, bottom panels), which establishes confidence in the reliability of the data. The most active averaged spectra suffer from more noise because only very few stars fall within these ranges (6 stars between and , 5 stars between and and 2 stars between and .)
Besides calcium lines, a mismatch between the averaged inactive and active spectrum occurs in other strong lines because the active database consists of cooler stars than the inactive dataset (see Sec. LABEL:sec.photometry for the comparison).
| Above | |||||
|---|---|---|---|---|---|
| 0.62 | 16753 | 0.433 | 0.841 | 0.515 | |
| 0.62 | 21925 | 0.567 | 0.159 | 3.7 | |
| 1.10 | 12768 | 0.330 | 0.0228 | 14.5 | |
| 1.77 | 7000 | 0.180 | 0.001 | 134 | |
| 2.63 | 3881 | 0.100 | 3168 | ||
| 3.69 | 2456 | 0.063 | 221,519 |
Note: A comparison between the number of active candidate stars above selected values (probability is given as well) and the expected number for the unimodal Gaussian distribution with the average of and (these are parameters for the inactive database activity distribution). The ratio shows that the number of active stars largely exceeds the expected number from the unimodal distribution. This is quantitative evidence for the bimodality of the distribution of active stars.