Role of magnetic dopants in the phase diagram of Sm1111 pnictides: The Mn case
Abstract
The deliberate insertion of magnetic Mn dopants in the Fe sites of the optimally-doped SmFeAsO0.88F0.12 iron-based superconductor can modify in a controlled way its electronic properties. The resulting phase diagram was investigated across a wide range of manganese contents () by means of muon-spin spectroscopy (SR), both in zero- and in transverse fields, respectively, to probe the magnetic and the superconducting order. The pure superconducting phase (at ) is replaced by a crossover region at intermediate Mn values (), where superconductivity coexists with static magnetic order. After completely suppressing superconductivity for , a further increase in Mn content reinforces the natural tendency towards antiferromagnetic correlations among the magnetic Mn ions. The sharp drop of and the induced magnetic order in the presence of magnetic disorder/dopants, such as Mn, are both consistent with a recent theoretical model of unconventional superconductors [M. Gastiasoro et al., ArXiv 1606.09495], which includes correlation-enhanced RKKY-couplings between the impurity moments.
I Introduction
The controlled insertion of disorder in superconducting (SC) materials via chemical substitution is a well known method to obtain valuable information regarding the gap symmetry. To this aim, several substitutions, either in the FeAs superconducting- or in the charge-reservoir layers of iron-based superconductors (IBS), have been regularly considered since their discovery in 2008.Hirschfeld et al. (2011) At the same time, this method demands particular caution in order to draw unambiguous conclusions about the gap symmetry, in particular in multiband systems.Wang et al. (2013); Gastiasoro et al. (2016) More generally, the use of diluted impurities represent a powerful tool for tuning the superconductivity or inducing magnetic order (MO), with the detailed outcome depending on the nature of the impurity itself. Here we focus on the deliberate insertion of magnetic disorder in the FeAs layers of the 1111 family of superconducting compounds to evidence how and to what extent the presence of electronic correlations can enhance the magnetic coupling between diluted impurities and, hence, tune SC and MO, as suggested in a recent theoretical work.Gastiasoro et al. (2016)
Three types of Fe substitutions are possible: isovalent (Ru)Tropeano et al. (2010), hole-dopant (Cr, Mn)Sato and Kobayashi (2012); Singh et al. (2013), or electron-dopant (Co,Ni).Sato and Kobayashi (2012); Prando et al. (2013); Singh et al. (2013) In general, all of them induce a decrease of , yet the decrease rate seems to depend significantly on the type of the substituted ion. The Mn-for-Fe substitution represents a particularly intriguing case, since even tiny amounts of manganese were shown to completely suppress the superconducting state.Sato and Kobayashi (2012) This type of substitution has been object of intense studies in the 122 IBS family, mostly because of the possibility to synthesize high-quality single crystals. In this case, magnetic resonance measurements (NMR and NQR) could show that, against the expections, Mn atoms do not induce any charge doping, most likely due to the localization of an additional manganese hole by the strong random potential induced by the magnetic Mn atoms.Texier et al. (2012) Photoemission and x-ray absorption measurements evidenced that large magnetic moments () are formed at the Mn sites,Suzuki et al. (2013) around which small fluctuating regions with dominant nearest-neighbor AFM exchange interactions are created. The latter phase dominates at high Mn content as, e.g., in BaMn2As2 ( K),Kim et al. (2010); Tucker et al. (2012) where Mn ions play the role of localized magnetic scattering centers. Interestingly, a new magnetic component, persisting well beyond the Néel temperature, sets in for Mn contents above a critical valueKim et al. (2010); Inosov et al. (2013). Its presence was subsequently justified by taking into account the magnetic coupling among the Mn impurities through the conduction electrons via the Ruderman-Kittel-Kasuya-Yosida interactionGastiasoro and Andersen (2014).
The role of Mn ions as localized magnetic impurities was confirmed by recent NMR-NQR studies also on 1111 compounds, such as LaFe1-xMnxAsO1-yFy.Hammerath et al. (2014) The latter case seems particularly puzzling: very small amounts of Mn (%) are sufficient to fully suppress SC and to drive the system towards a short-range antiferromagnetic order. While passing through a quantum critical point at , the spin fluctuations progressively freeze and competing low-frequency dynamic correlations (in the MHz range) develop as Mn content is increased.Hammerath et al. (2014, 2015) Interestingly, the partial substitution of La with smaller Y ions drives the system away from quantum criticality, implying that a higher chemical pressure reduces the effects of Mn magnetic correlations.Moroni et al. (2016) It is conceivable that the same mechanism, i.e., a higher chemical pressure, reflecting the smaller size of Sm ions, can explain why decreases more slowly in the Sm-1111 than in La-1111 compounds for nominally equal Mn contents.Singh et al. (2013) Although a higher chemical pressure implies weaker electronic correlations, these still persist and have been shown to enhance the inter-impurity Ruderman–Kittel–Kasuya–Yosida (RKKY) exchange interaction, responsible for the competition between the magnetically-ordered and the superconducting phase.Gastiasoro et al. (2016)
In this paper, we investigate the evolution of the superconducting state and the type of magnetic correlations that develop in the SmFe1-xMnxAsO0.88F0.12 system when the Mn content x is systematically increased. Subsequently, we discuss our findings in the framework of the above mentioned theoretical work.Gastiasoro et al. (2016)
II Sample synthesis and characterization
Two series of SmFe1-xMnxAsO0.88F0.12 polycrystalline samples were investigated. The first one (#A) was synthesized at IFW Dresden with nominal compositions 0, 0.01, 0.08, 0.10, and 0.15. Another series (#B) was prepared at the University of Tokyo with nominal compositions 0, 0.01, 0.03, 0.06, and 0.1. Together they cover a broad range of Mn doping in finely-tuned steps. Samples of series #A were synthesized in a single step, by using SmAs, Fe, Fe2O3, FeF3, and Mn as precursors. These were mixed according to the relevant stoichiometry and then thoroughly ground and pelletized. The pellets were inserted in quartz tubes which, after being evacuated and sealed, were heated in a furnace at 900∘C for 45 h and then cooled down to room temperature at 150∘C/h. Samples of #B series too were synthesized in a single-step solid-state reaction,Singh et al. (2013) but the last two precursors were FeF2 and MnO (instead of FeF3 and Mn). Compositions corresponding to different Mn doping values were mixed and pressed under 40 MPa into separate pellets, which were then wrapped in Ta foils and heated under identical conditions, following the same protocol as for the previous series.
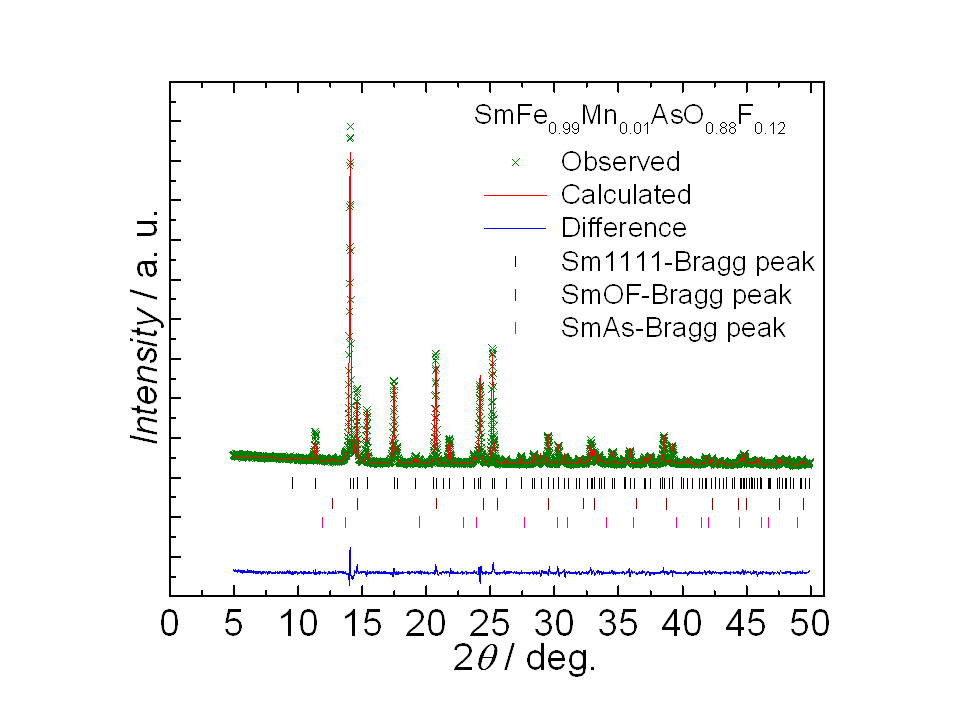
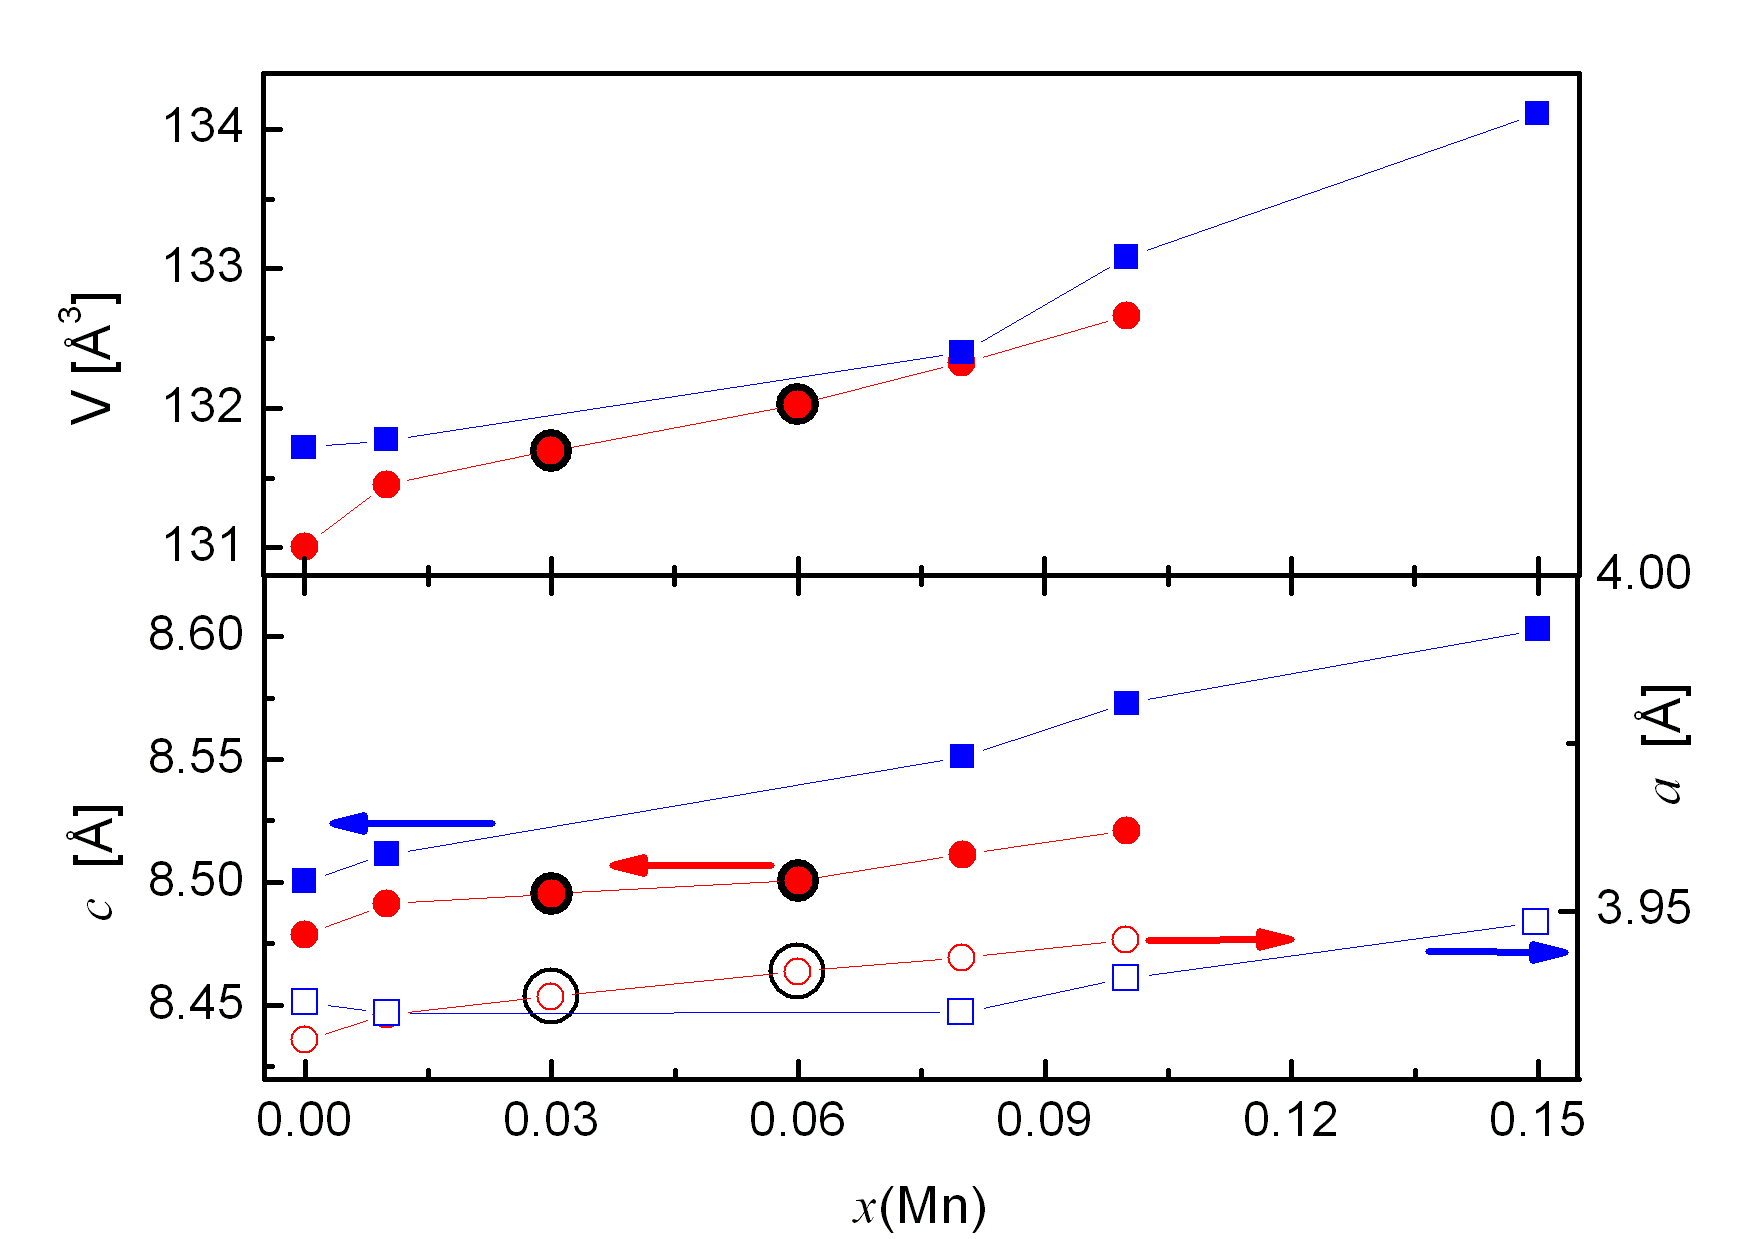
Samples from both series were characterized by powder x-ray diffraction (XRD) using Mo-K and Cu-K radiation, respectively, with silicon powder being used as a standard reference. Rietveld analysis was employed to determine the lattice parameters of the #A series, with an example for the case being shown in Fig. 1. For the #B series, instead, the lattice parameters were calculated based on the lattice spacing from the observed diffraction patterns (see Ref. Singh et al., 2013). For a comparison of the two series, the cell parameter dependence vs. Mn content is shown in Fig. 2. While the lattice parameter is mostly constant, the -axis value increases linearly with increasing Mn content, with both sample sets showing a consistent behavior. As a result, by completing the series #A with the and 0.06 samples from series #B, a full set of Mn-doping values could be achieved.
II.1 Resistivity measurements
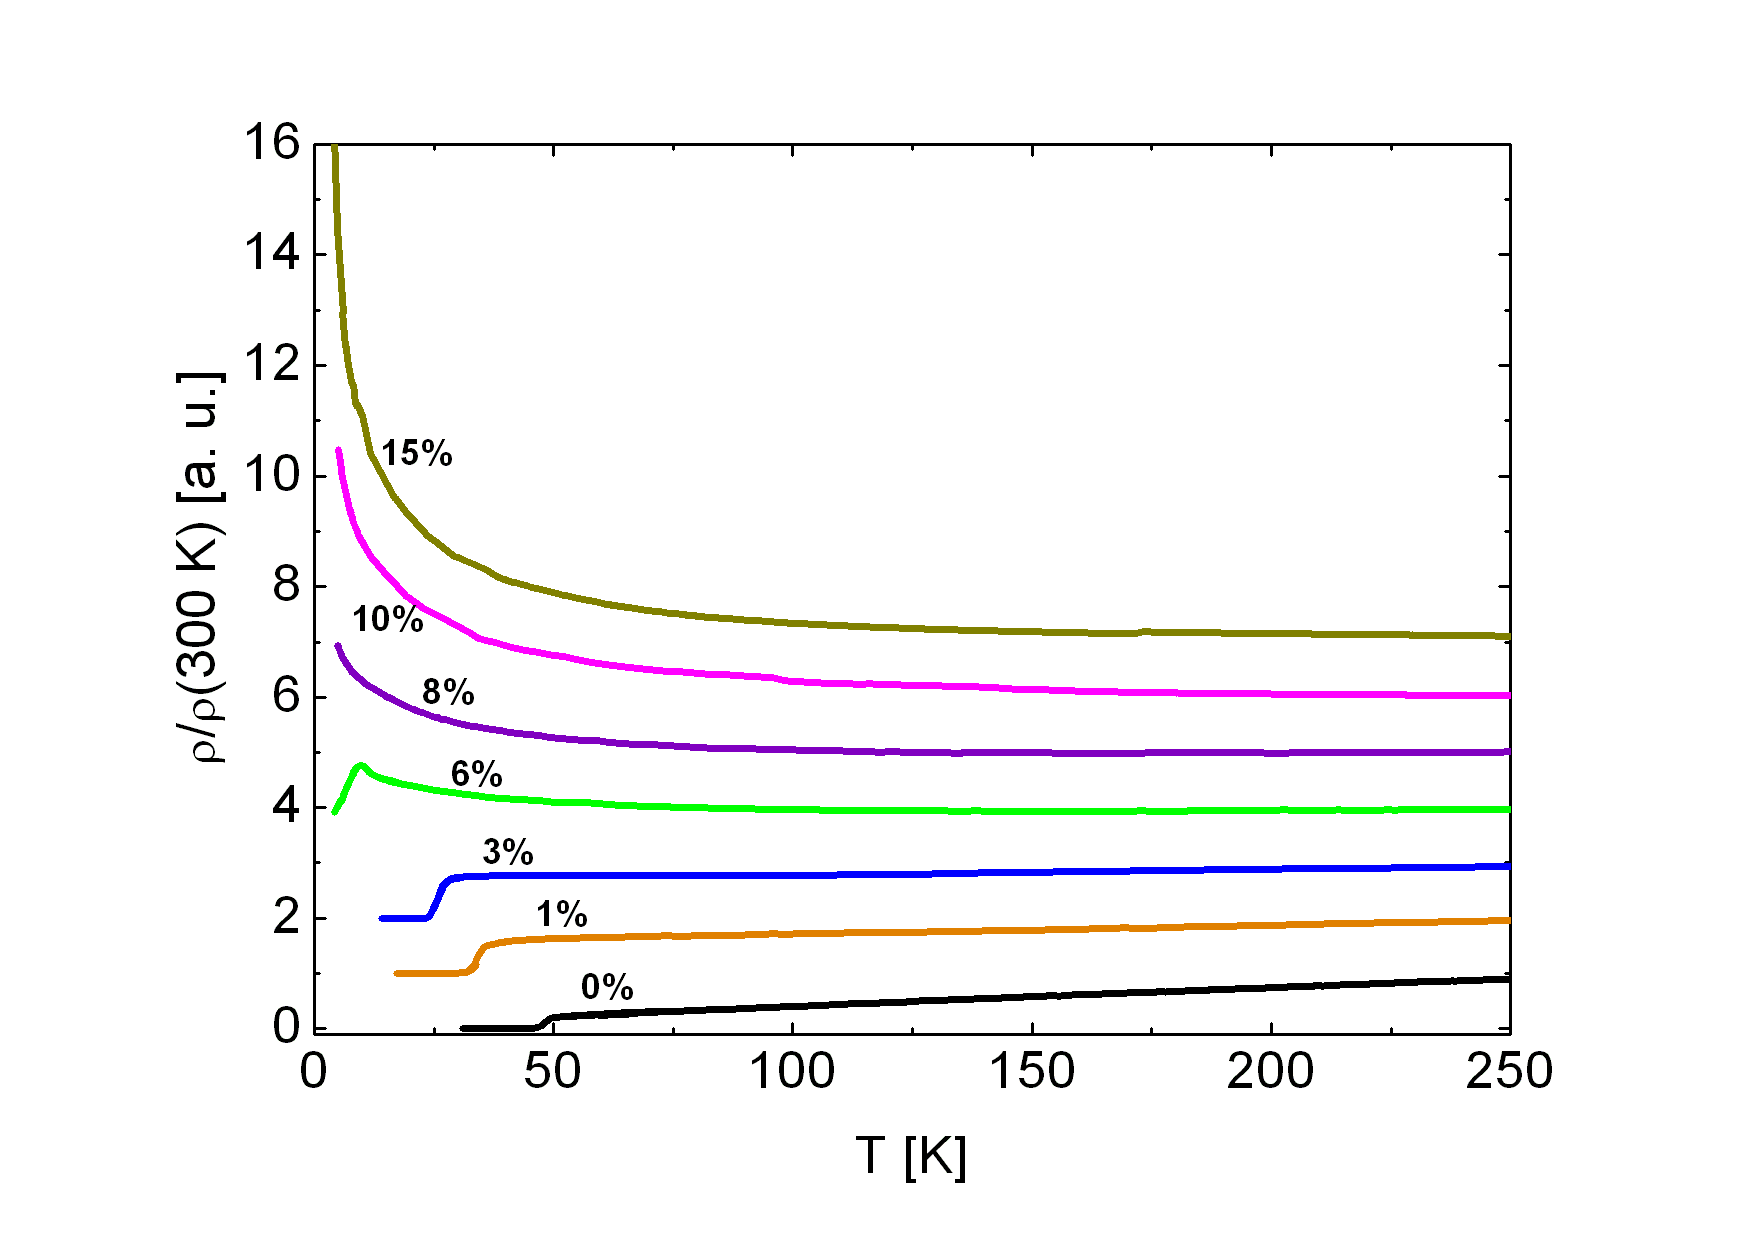
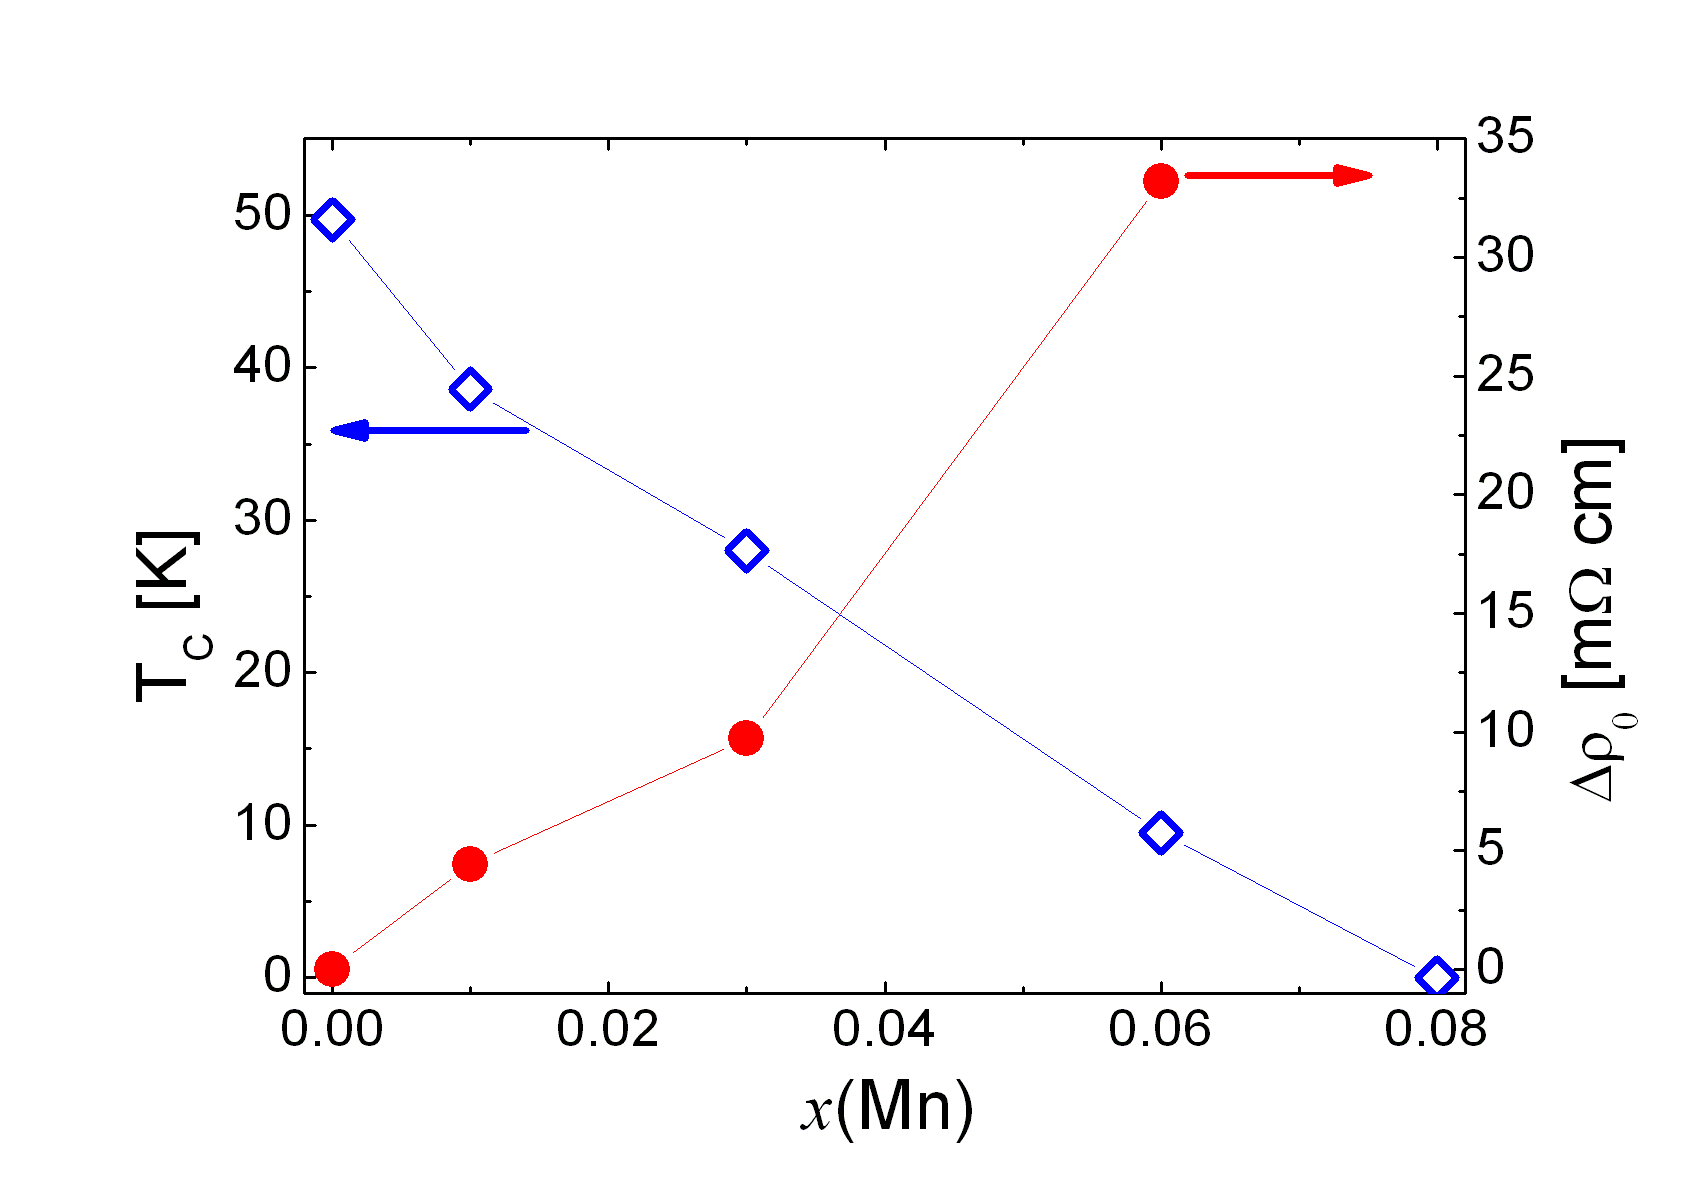
The resistivity of the SmFe1-xMnxAsO0.88F0.12 samples was measured by means of a standard four-point method, with the temperature dependences being shown in Fig. 3. Upon cooling, the resistivity of the sample decreases linearly with temperature down to the superconducting transition K, defined as the feet of the resistivity drop. As the manganese content increases, the critical temperature decreases too, the superconductivity being fully suppressed for . A further increase in Mn content results in an increase of the residual resistivity and in a low-temperature upturn, most likely due to weak localization effects. To evaluate the excess resistivity due to Mn dilution, in the superconducting samples the high-temperature resistivity (i.e., from 100 to 250 K) was fitted by a quadratic polynomial , where is the residual resistivity of the sample with a Mn fraction x. The excess resistivity at K was then estimated via ,Tarantini et al. (2010) with m cm the residual resistivity of the sample. Figure 4 shows the critical temperature and the excess resistivity vs. the Mn content: while decreases, increases with , both displaying an almost linear behavior. The residual resistivities shown in Fig. 4 deserve some comment: (i) their magnitude is higher than expected due to grain-boundary effects reflecting the polycrystalline nature of our samples. By scaling the current resistivity data by a factor of ca. 1/4, one can remove the grain-boundary and anisotropy effects and hence estimate the in-plane resistivity.Sato et al. (2010) (ii) The low- resistivity values are generally lower than those reported in Ref. Frankovsky et al., 2013. For instance, the resistivity of the Sm-1111 sample is roughly 2/3 of the corresponding La-1111 sample. This suggests a lower degree of electronic correlation.Gastiasoro et al. (2016)
II.2 Magnetization measurements
To characterize the superconducting state of the SmFe1-xMnxAsO0.88F0.12 samples, we carried out dc susceptibility measurements on finely ground powders (demagnetizing factor , nominal density 7.5 g/cm3) by means of a superconducting quantum interference device (SQUID) magnetometer. The susceptibility curves were measured at mT from 2 K to above , both in zero-field-cooled (ZFC) and in field-cooled (FC) conditions.
To estimate the superconducting volume fraction we considered the variation of FC susceptibility with respect to its normal-state value: . In the case, the superconductivity has a clear bulk character, as inferred from TF-SR data (see below), which determines a lower bound of for the superconducting volume fraction. Consequently, one can define the superconducting volume fraction of the other samples by normalizing their values to :
| (1) |
The resulting volume fractions , calculated by means of Eq. 1, are shown in Fig. 5. Clearly, to a moderate increase in Mn content corresponds a steep decrease in .
III Muon-spin spectroscopy
The muon-spin spectroscopy (SR) measurements were carried out at the GPS and Dolly instruments of the SS facility at the Paul Scherrer Institute, Switzerland. Zero-field (ZF) SR measurements were used to detect a possible spontaneous magnetic order, or to distinguish between short- and long-range order.Shiroka et al. (2011); Yaouanc and Dalmas de Réotier (2011) By means of longitudinal-field (LF) measurements we could establish the static nature of magnetism (on the SR timescale).Drew et al. (2008); Yaouanc and Dalmas de Réotier (2011) Finally, by transverse-field (TF) SR experiments we could determine the properties of the vortex lattice in the superconducting phase. The relatively large samples’ thickness (about 1 mm) and the use of veto counters implied good signal-to-noise ratios, hence ensuring that in all the experiments the signals were due exclusively to muons stopped in the samples.
III.1 Superconducting properties as probed by SR
III.1.1 Fluctuating magnetism due to paramagnetic Sm ions
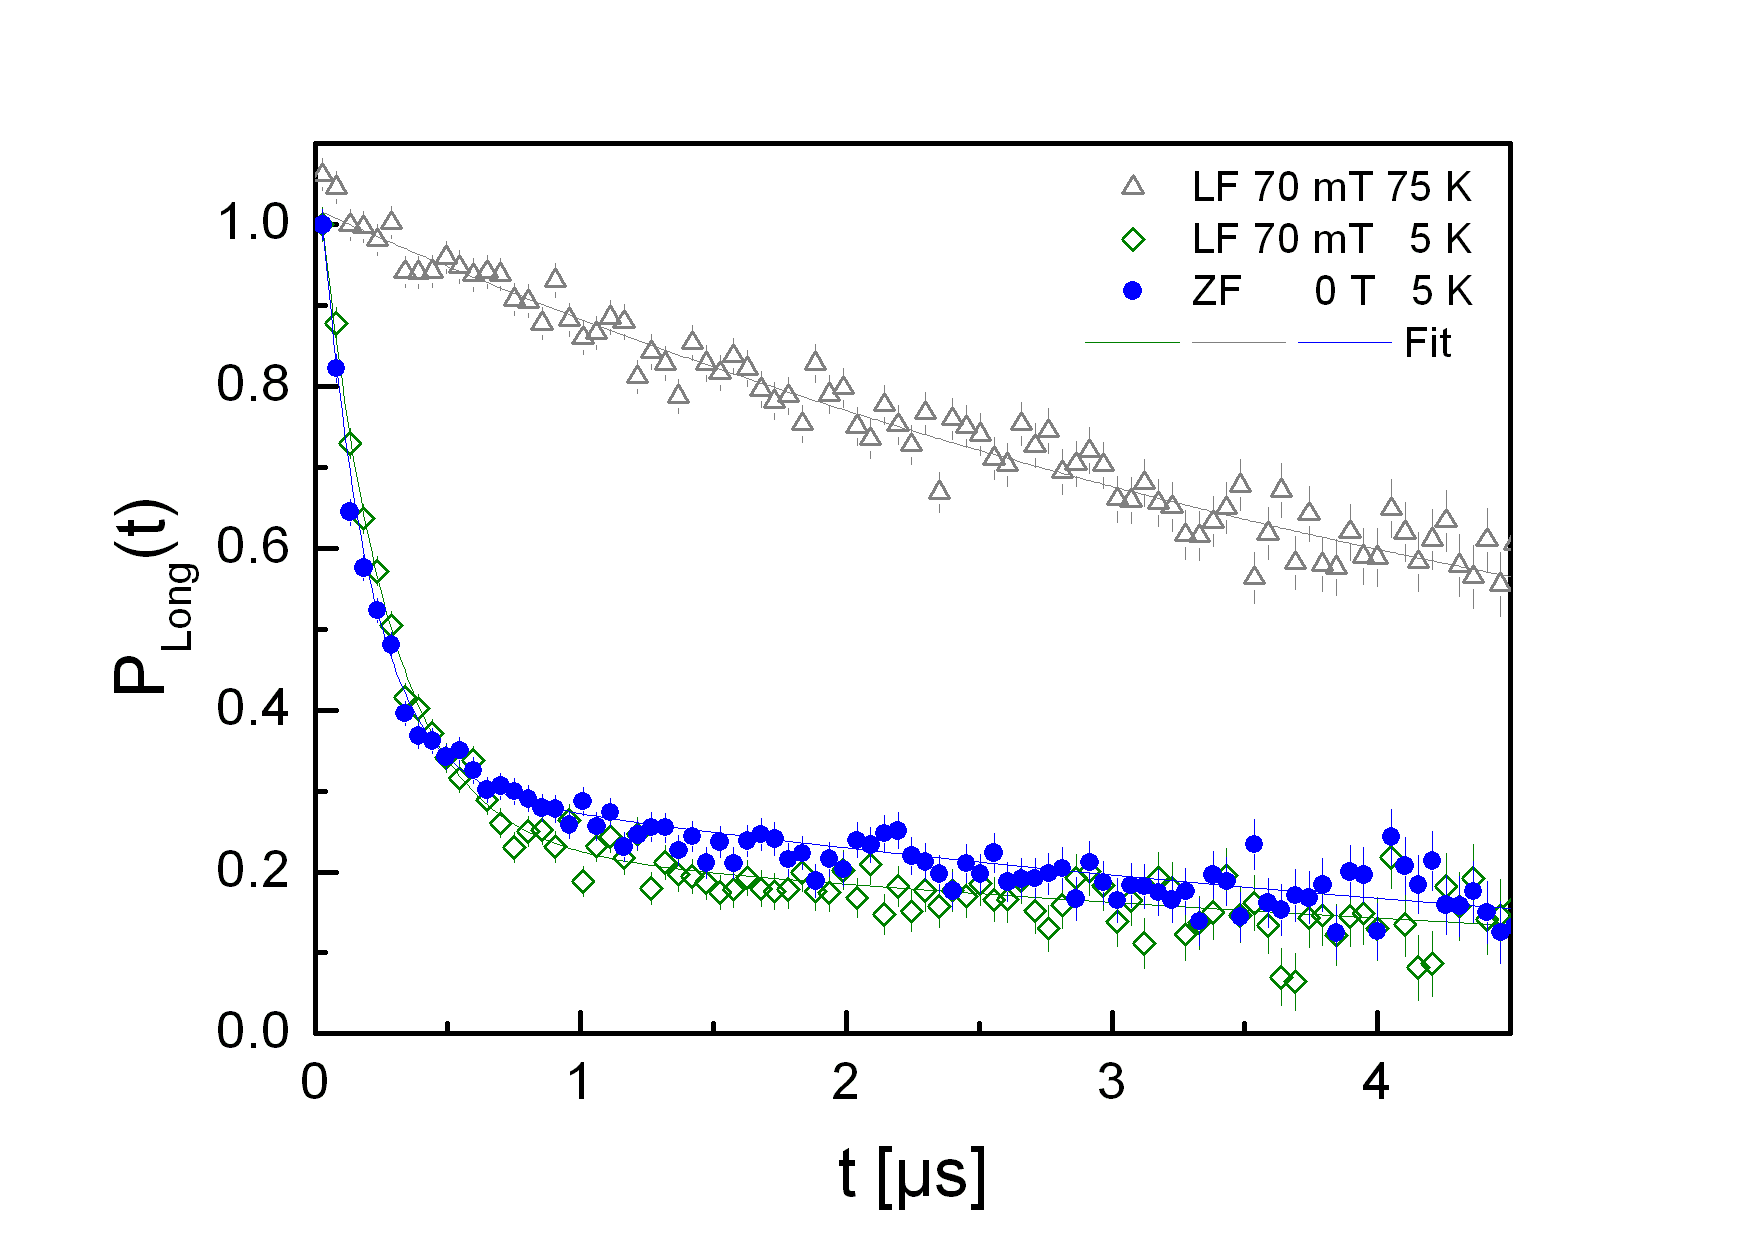
Figure 6 shows the low-temperature ZF muon-spin polarization , with and being the time-dependent and initial asymmetry, respectively. It is relevant to note that the significant depolarization observed at short times ( s) is insensitive to the application of a 70-mT longitudinal field, yet the depolarization is markedly reduced at K, well above the superconducting critical temperature. Both ZF and LF data could be fitted by means of:Khasanov et al. (2008)
| (2) |
where and are the relative weights and relaxation rates of muons implanted in two inequivalent sites, namely close to the SmO and to the FeAs planes.Khasanov et al. (2008); Drew et al. (2008); Sanna et al. (2009a); Renzi et al. (2012); Möller et al. (2013); Prando et al. (2015) The different relaxation rates reflect the different dipolar fields created by the Sm3+ moments at the two muon sites. LF data were fitted by keeping the ratio fixed. At K, the muon polarization could be adequately fitted by a single-exponential decay.
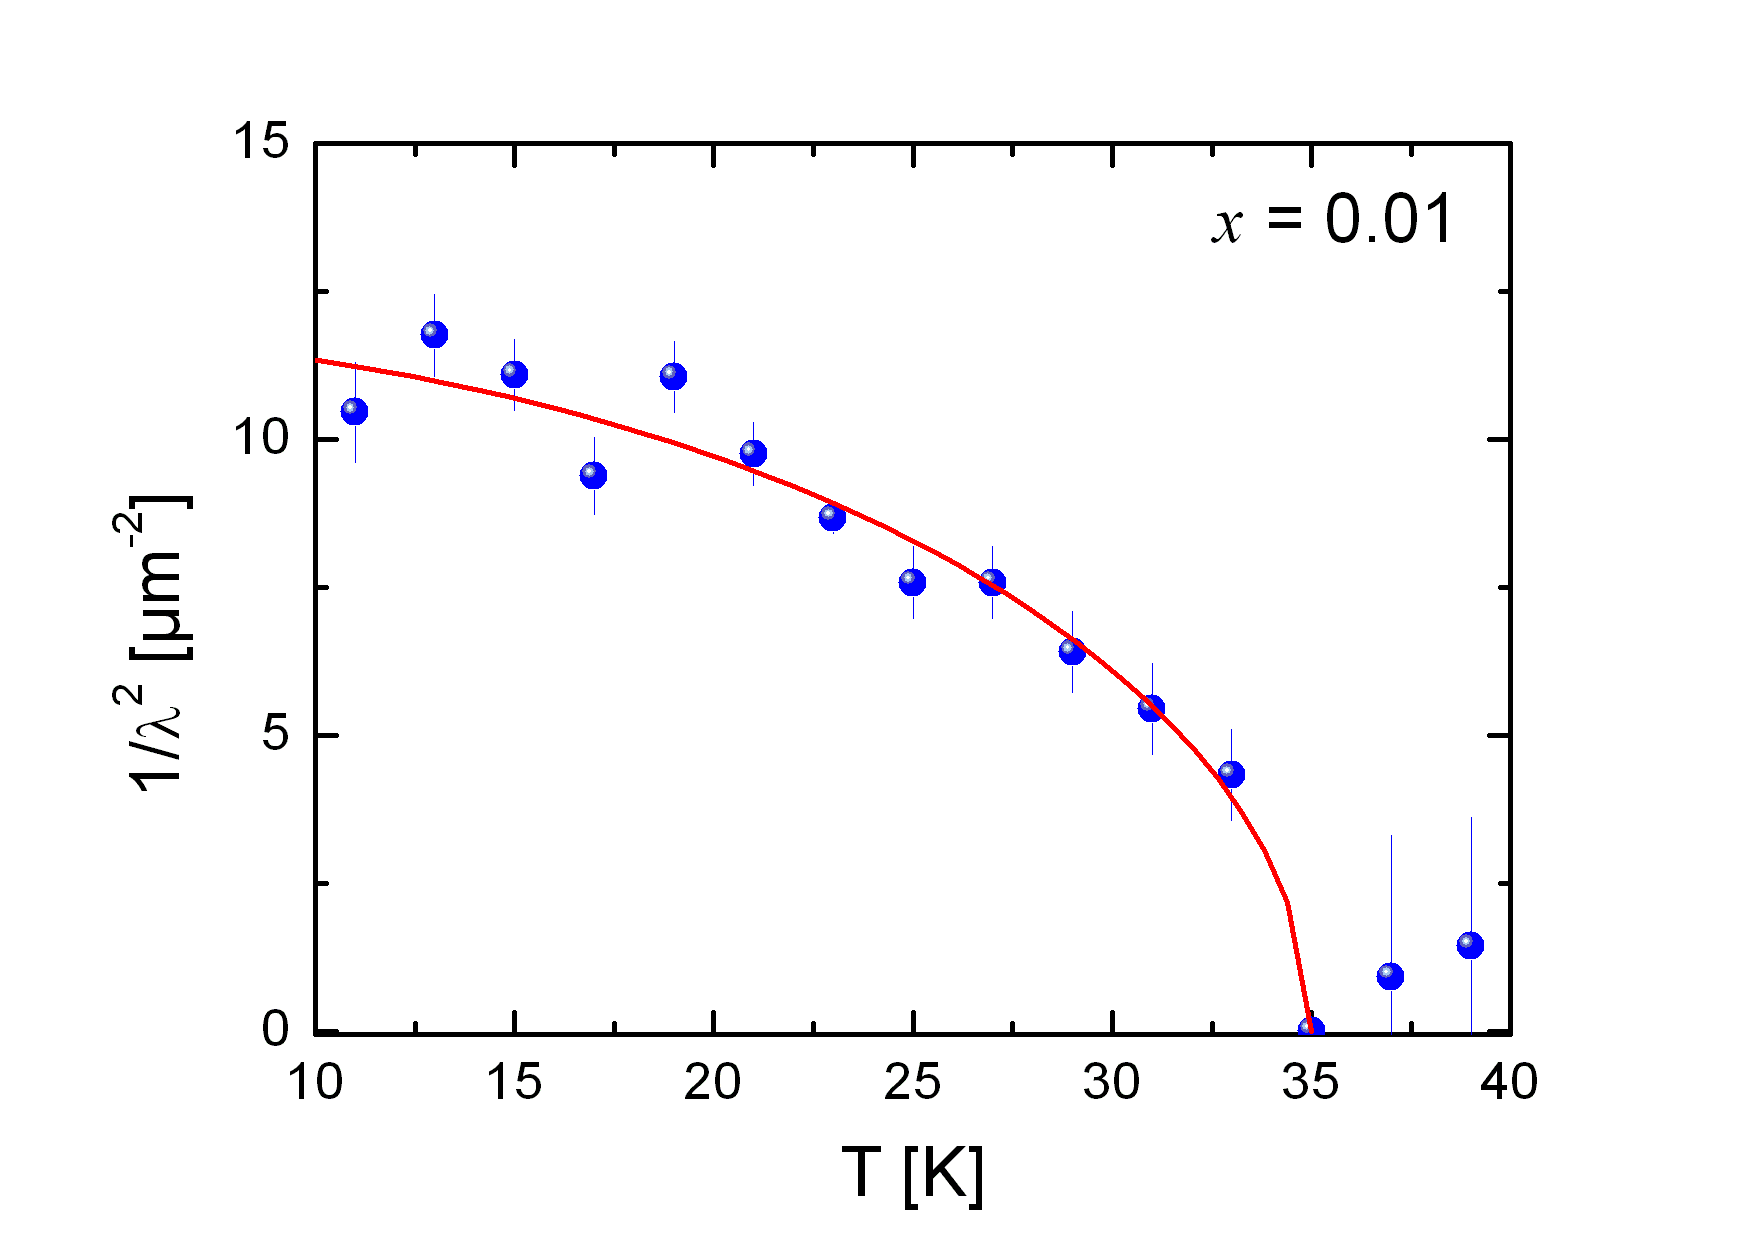
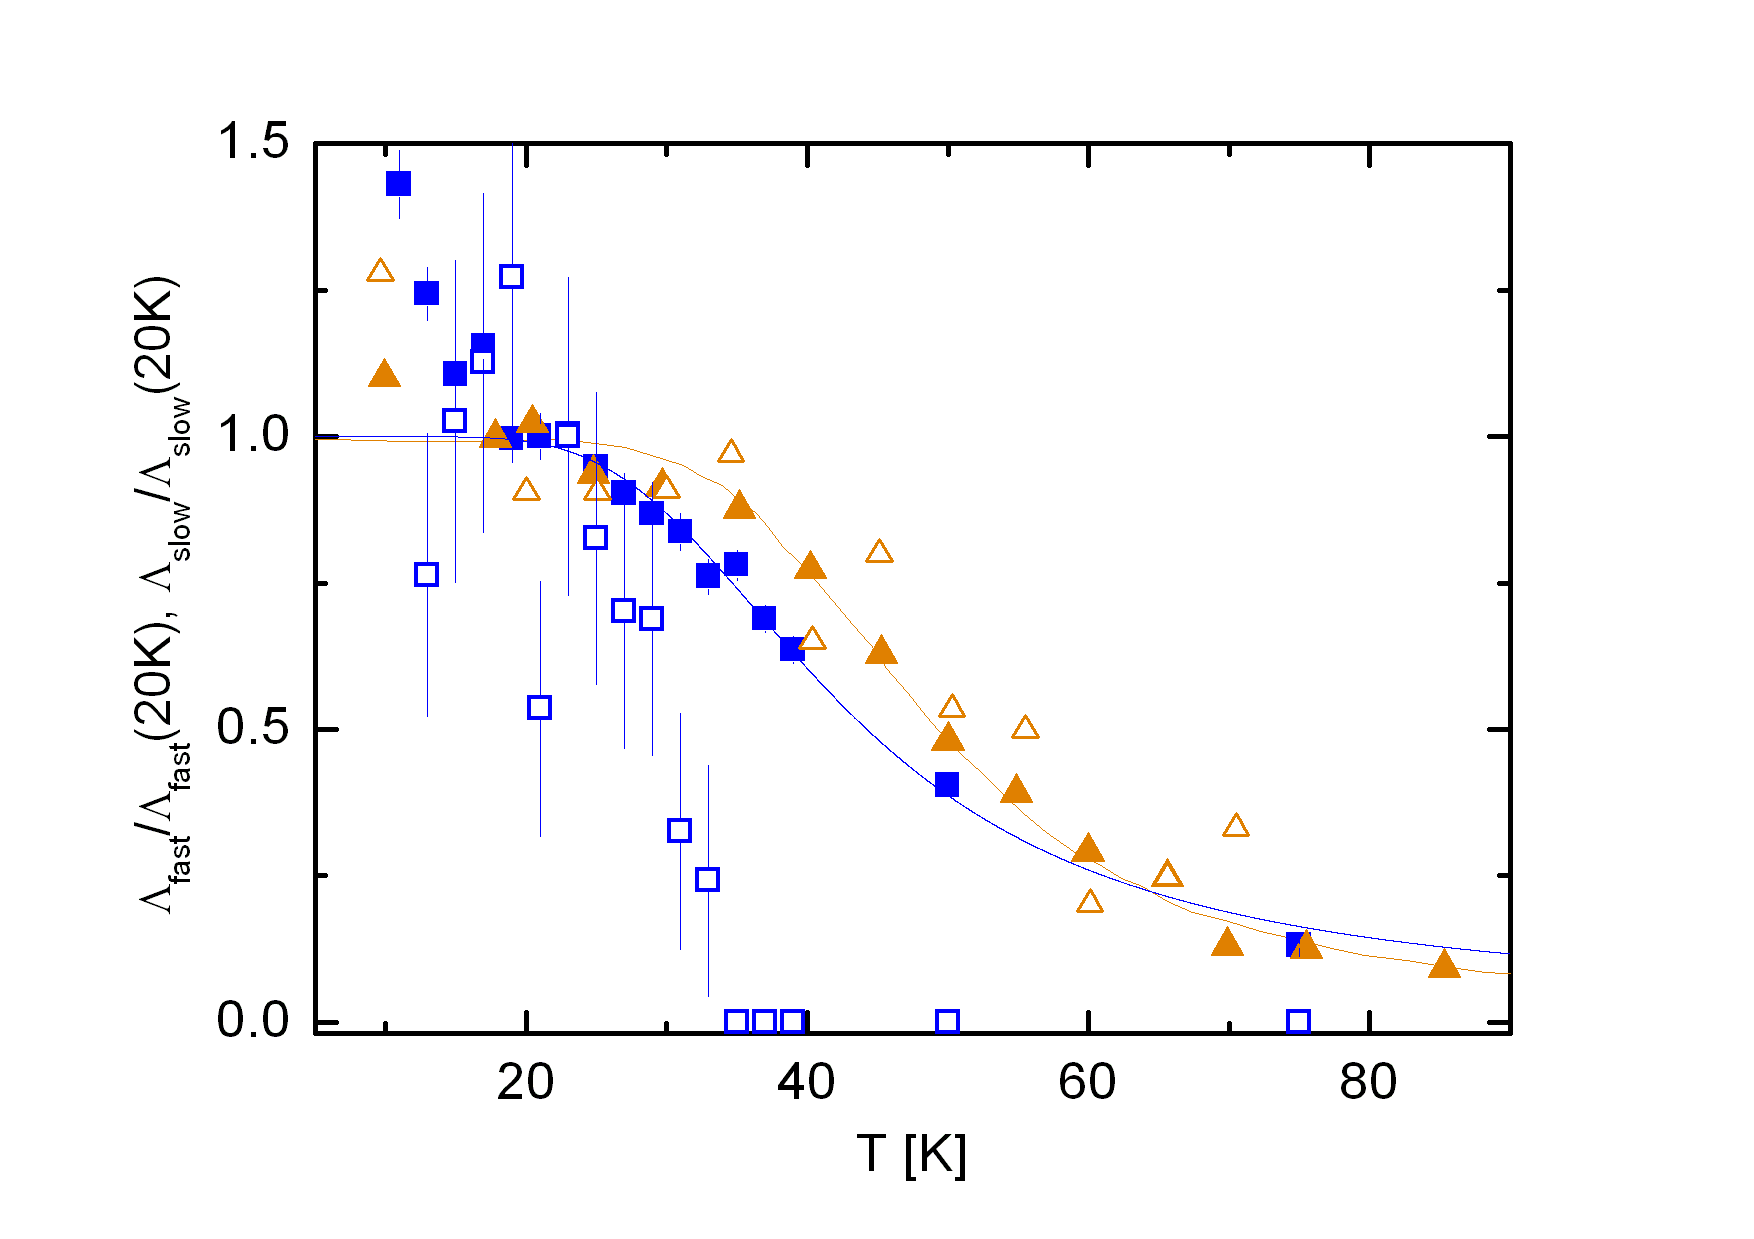
Figure 7 shows the temperature variation of the normalized and values. While the former agrees well with previous results on superconducting Sm-1111 samples,Khasanov et al. (2008); Drew et al. (2008) the latter shows a moderate agreement only at low temperature. At high temperature, instead, muon diffusion apparently narrows the lineshape, with the resulting slow relaxation becoming too small to be detected. Consequently, we limit our discussion to the fast relaxation term only. Generally, the observed behavior was ascribed to Sm3+ magnetic moment fluctuations. In a simplified model, the Sm-moment fluctuation rate can be considered as the sum of a -independent and a thermally-activated term.Branzoli et al. (2009) The latter accounts for the thermally populated Sm crystal-field levels via:Khasanov et al. (2008); Cimberle et al. (2009)
| (3) |
where is an activation energy and is a constant. In the fast fluctuation limit the measured relaxation rate is , with the mean-square amplitude of the fluctuating field generated by the Sm3+ moments at the muon sites.Branzoli et al. (2009) Since for the system is in its ground-state, the field amplitude due to the fluctuating Sm3+ ions can be considered as temperature independent. Therefore, the only temperature dependence of can come from . Accordingly, the relaxation rate assumes the empirical form already used for SmFeAsO (see, e.g., Refs. Khasanov et al., 2008; Maeter et al., 2009). To verify how and to what extent the Sm moment fluctuations are altered by the Mn dilution, we fit the data by using the dependence as given by Eq. 3. For the fits, only the data in the 20–100 K temperature range were considered, so as to exclude the low-temperature upturn due to the magnetic ordering of the Sm sub-lattice. The fit (see Fig. 7) yields meV, close to the value reported in Ref. Khasanov et al., 2008. The analogous temperature dependence of the measured relaxation rates, including their slowing down around 80 K, and their insensitivity to the superconducting phase, confirms that these fluctuations are due to the Sm paramagnetic moments. A slight reduction in the excitation-gap value with respect to the known values,Khasanov et al. (2008); Cimberle et al. (2009) could be ascribed to the influence of the diluted Mn magnetic moments.
III.1.2 Superconducting properties
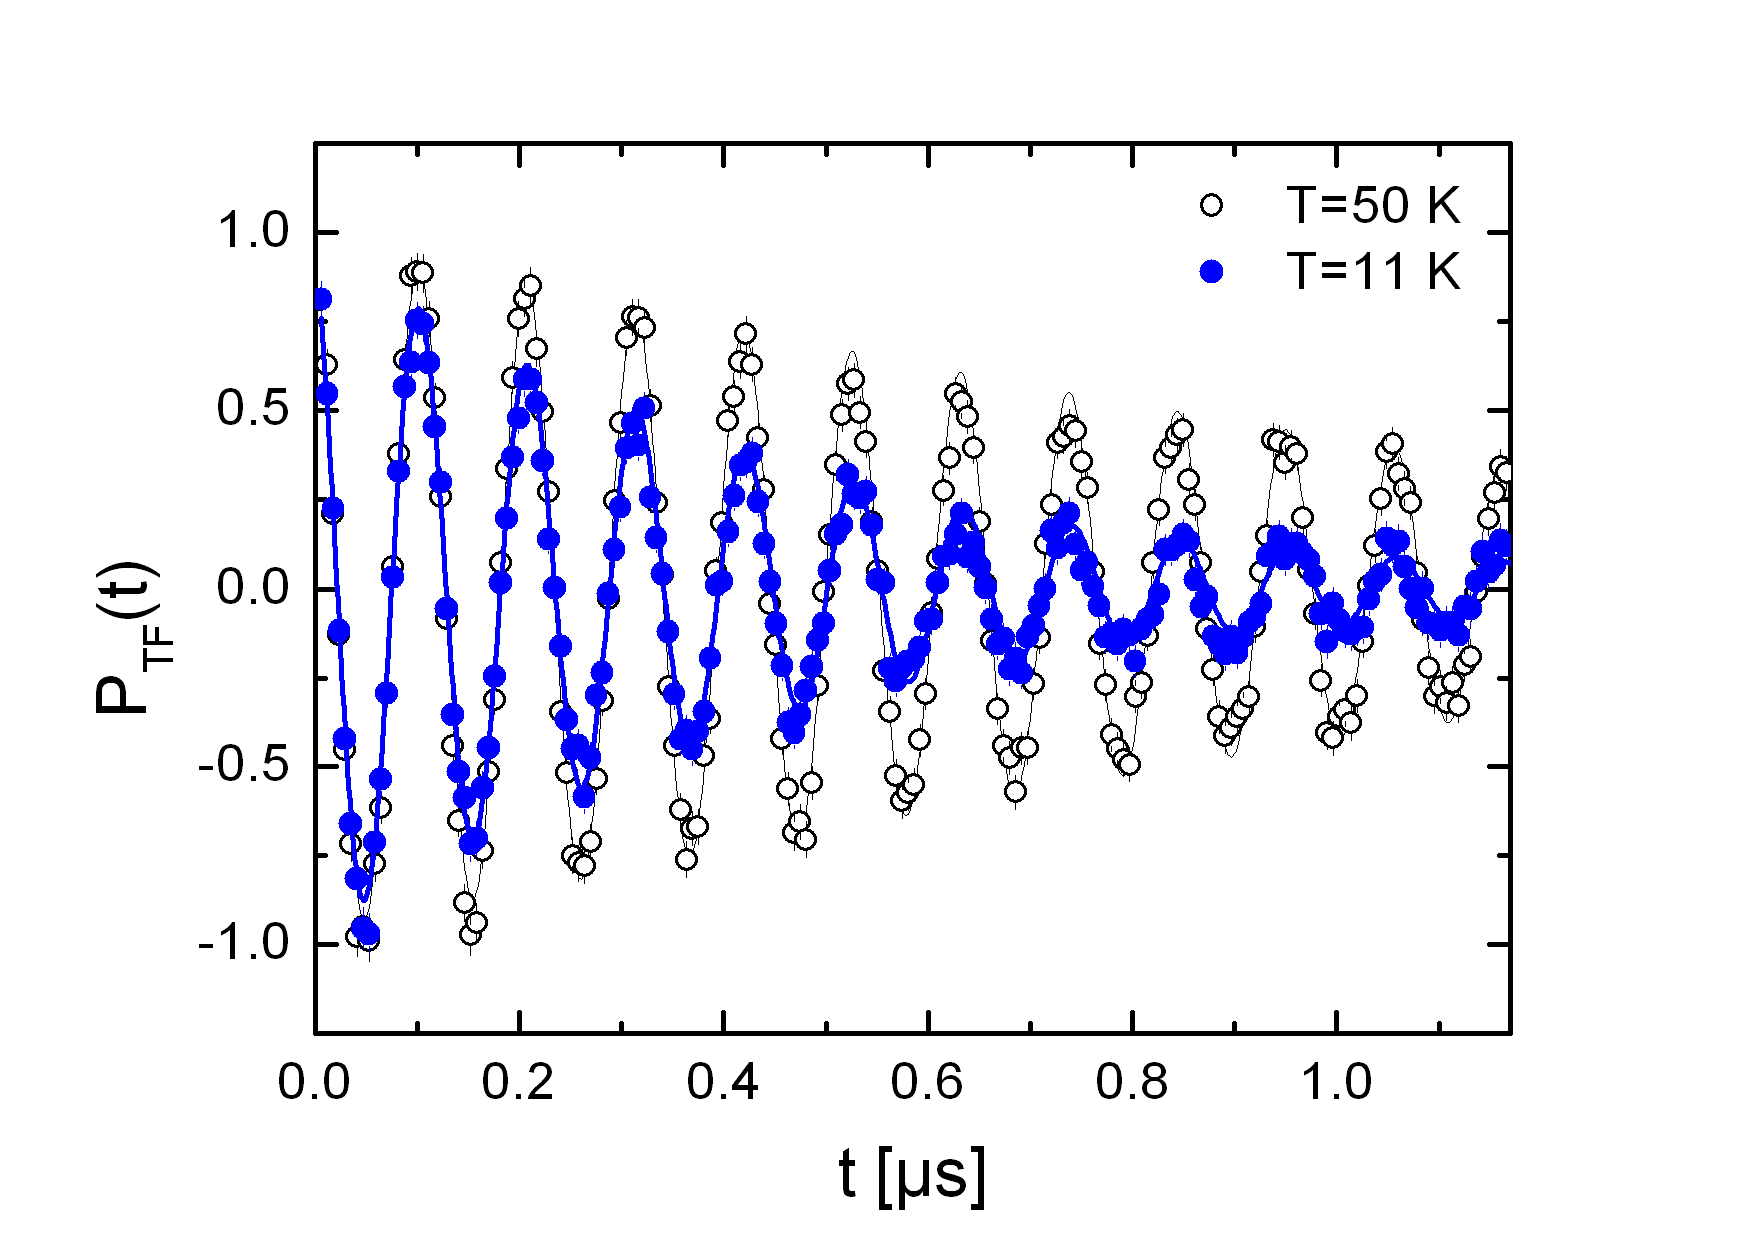
TF-SR spectroscopy measurements were performed on the , 0.03, and 0.06 samples. Unfortunately, the presence of static antiferromagnetic order in the FeAs planes (see Section III.B), coexisting with superconductivity, prevented a reliable evaluation of the magnetic penetration depth in the and 0.06 case. However, since no traces of static magnetism could be found down to 1.5 K in the sample, its superconducting properties could be investigated in detail via TF-SR after cooling the sample in an applied field mT. Figure 8 shows the short-time polarization of the muon ensemble below and above . To disentangle the depolarization effects due to the vortex lattice from contributions due to the fluctuating Sm paramagnetic moments, the time-dependent transverse polarization in the SC phase was fitted by means of the equation:Khasanov et al. (2008)
| (4) |
where is defined in Eq. (2), is the average field at the muon site, MHz/T is the muon gyromagnetic ratio, the initial phase, the Gaussian relaxation rate, and represents the normal-phase signal, whose relaxation and oscillating frequency (exactly at ) were determined above and then kept fixed. The relative weight of was determined at long times () and the lowest temperature: in the superconducting state it represents only 6.4% of the total signal, which implies a Meissner fraction of about 94%.
At each temperature, the parameters defining the term were taken from the corresponding LF parameters at the same temperature [see Eq. (2)].
As for the Gaussian depolarization rate, it consists of a superconducting contribution (), a magnetic contribution due to the ordering of Sm ions (), and a nuclear magnetic contribution (), the latter being determined in the normal state:Khasanov et al. (2008); Drew et al. (2008)
| (5) |
Since the Sm contribution is relevant only at low temperatures, by considering the data above 10 K the term in Eq. (5) is negligible, hence enabling us to extract . For anisotropic superconductors in the limit of low fields, the effective magnetic penetration depth is related to through the equation:Brandt (1988)
| (6) |
where Tm2 is the quantum of magnetic flux. Figure 9 shows the temperature dependence of the superfluid density, , and a numerical fit with an average-field model , which gives m-2 and . Subsequently, by considering that in anisotropic polycrystalline samples the relation holds,Fesenko et al. (1991) we could estimate the in-plane magnetic penetration depth nm. Since this value is slightly higher than that measured in optimally doped Sm-1111 samples,Khasanov et al. (2008); Drew et al. (2008) it suggests a reduced zero-temperature superfluid density in the Mn-doped case.
III.2 ZF-SR and magnetic properties
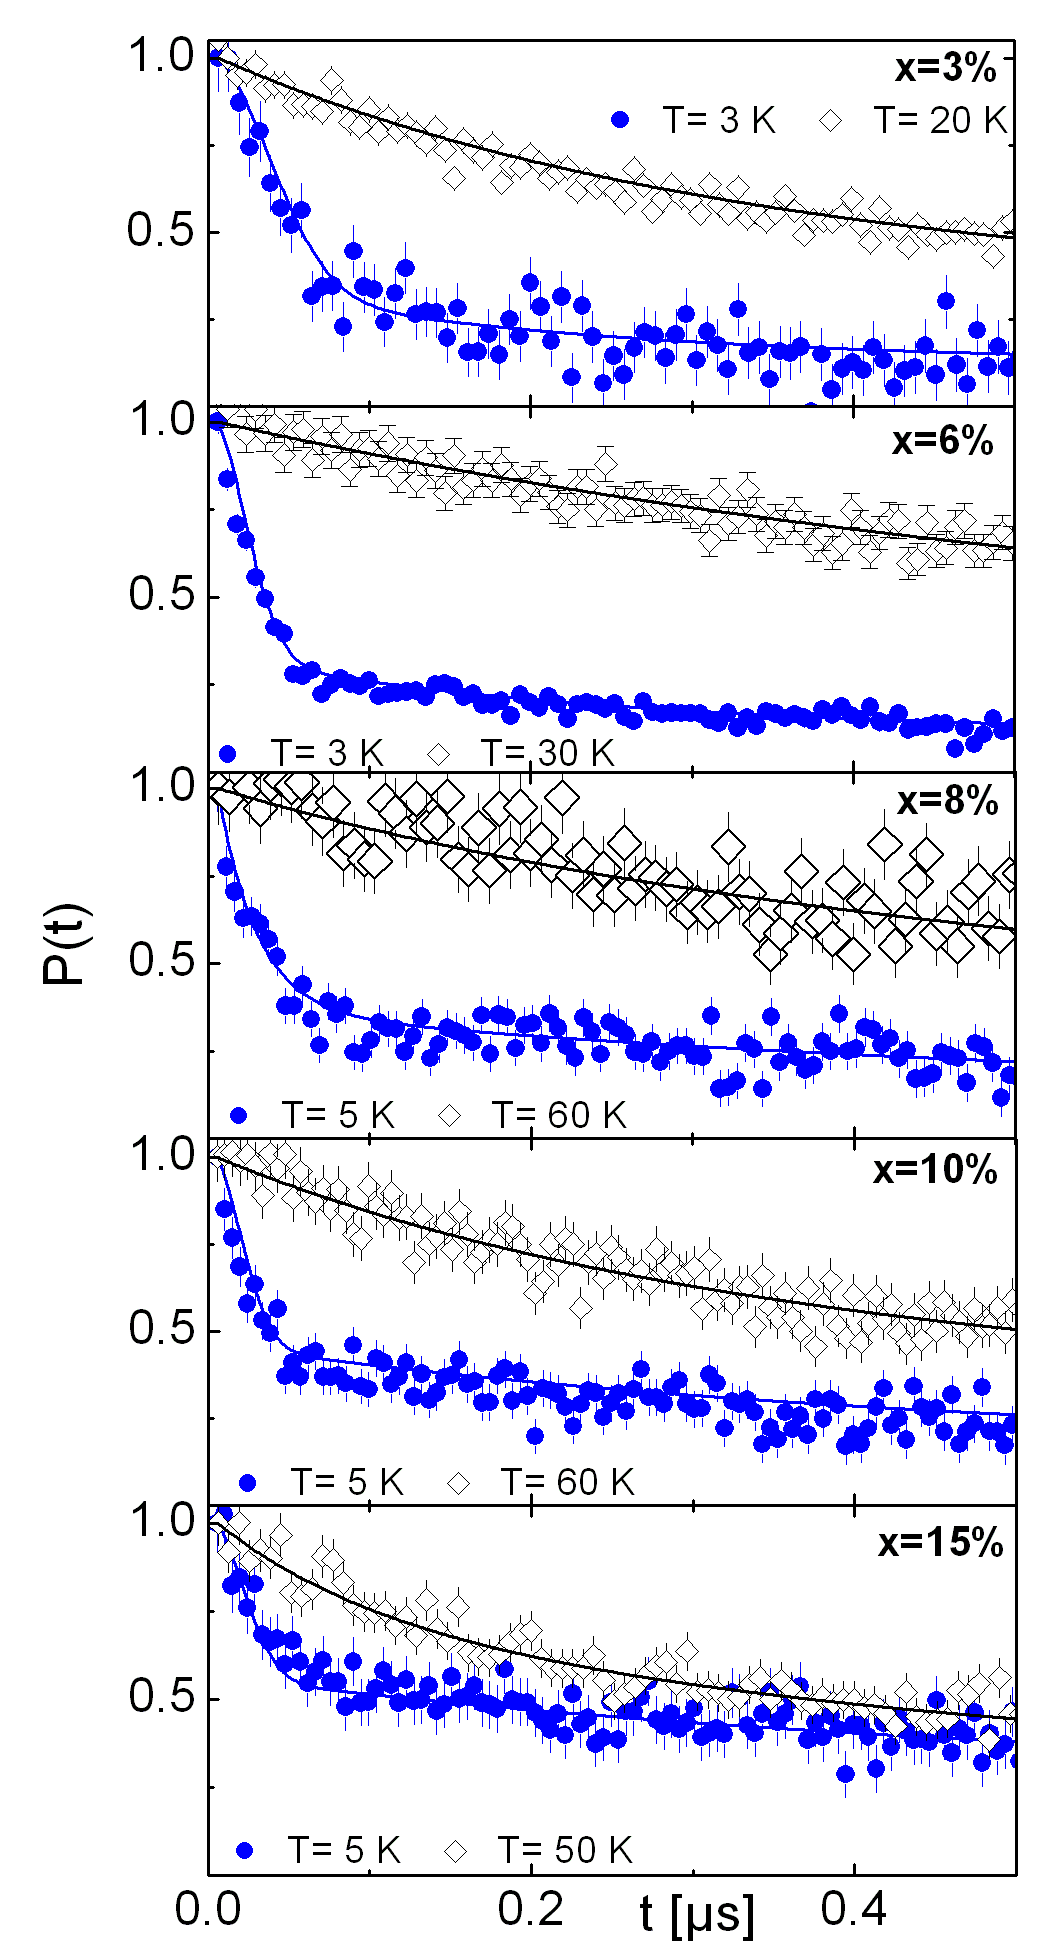
Figure 10 shows a selection of ZF spectra for all those SmFe1-xMnxAsO0.88F0.12 samples where we found evidence of static magnetism. The most prominent features are the presence of a rather large relaxation at high temperatures and a significantly damped signal with no coherent precessions below about 60 K. The time-dependent polarization was fitted by the following model:
| (7) |
where is the magnetic volume fraction and the time-dependent relaxation in the paramagnetic state. In the magnetically ordered state a nonzero fraction of muons probes a local magnetic field at the implantation site ; and in Eq. (7) refer to muons probing local fields in the transverse (T) or longitudinal (L) directions with respect to the initial muon-spin polarization. The coherent precession of muons is taken into account by the function, whereas and model the precession damping. The decay reflects the static distribution of local magnetic fields, whereas is due to dynamical relaxation processes. Finally, the sum over i generalizes Eq. (7) to the case of several inequivalent crystallographic implantation sites, whose relative populations are normalized to 1.
Yet, Sm-1111 is a peculiar pnictide system, since the implanted muons in the FeAs and SmO planes couple differently with the Sm magnetic moment fluctuations, always detectable on the SR time scaleDrew et al. (2008); Khasanov et al. (2008); Sanna et al. (2009a); Drew et al. (2009); Maeter et al. (2009). For this reason, differently from other SC pnictides, the longitudinal relaxations arising from muons implanted in two different sites are distinct in our case in both the paramagnetic and the magnetically ordered state.
In the magnetically ordered phase (), a very strong damping below about 60 K indicates the onset of magnetic order. For the best fits were obtained by reducing Eq. (7) to the sum of a transverse component (with Gaussian decay) and two longitudinal ones, corresponding to the longitudinal relaxations (fast/slow) discussed above.Drew et al. (2009) Only for the sample the magnetically ordered phase was fitted by one transverse and one longitudinal exponential terms. In the high-temperature paramagnetic phase () some small differences arise: for the best fit was obtained by using two Lorentzian relaxation terms, as described by Eq. (2), which suggests the presence of fast fluctuating magnetic moments. For , instead, the term is best described by the sum of two Lorentzian Kubo-Toyabe (KT) functions, more suitable for fitting large relaxation rates arising from homogeneously diluted ferromagnetic impurities.Sanna et al. (2009b); Lamura et al. (2014)
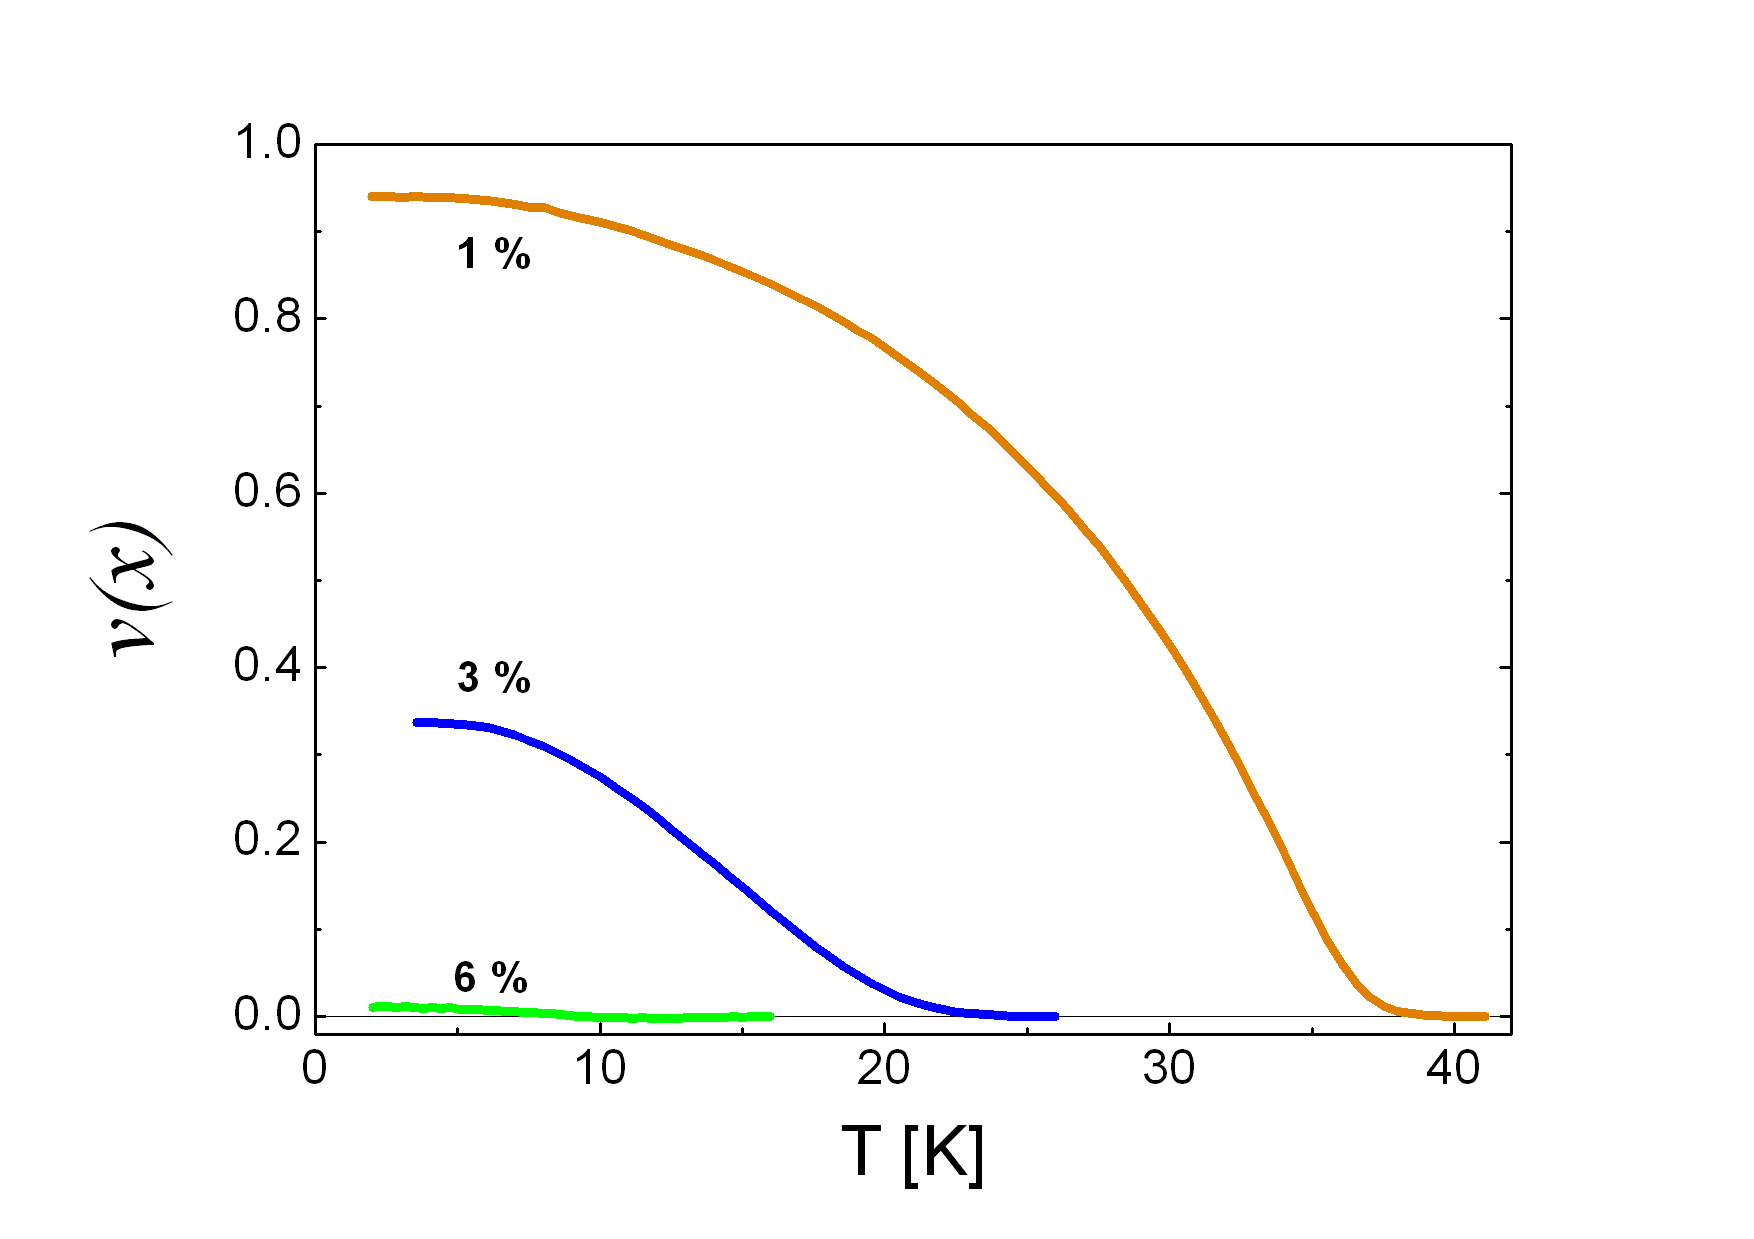
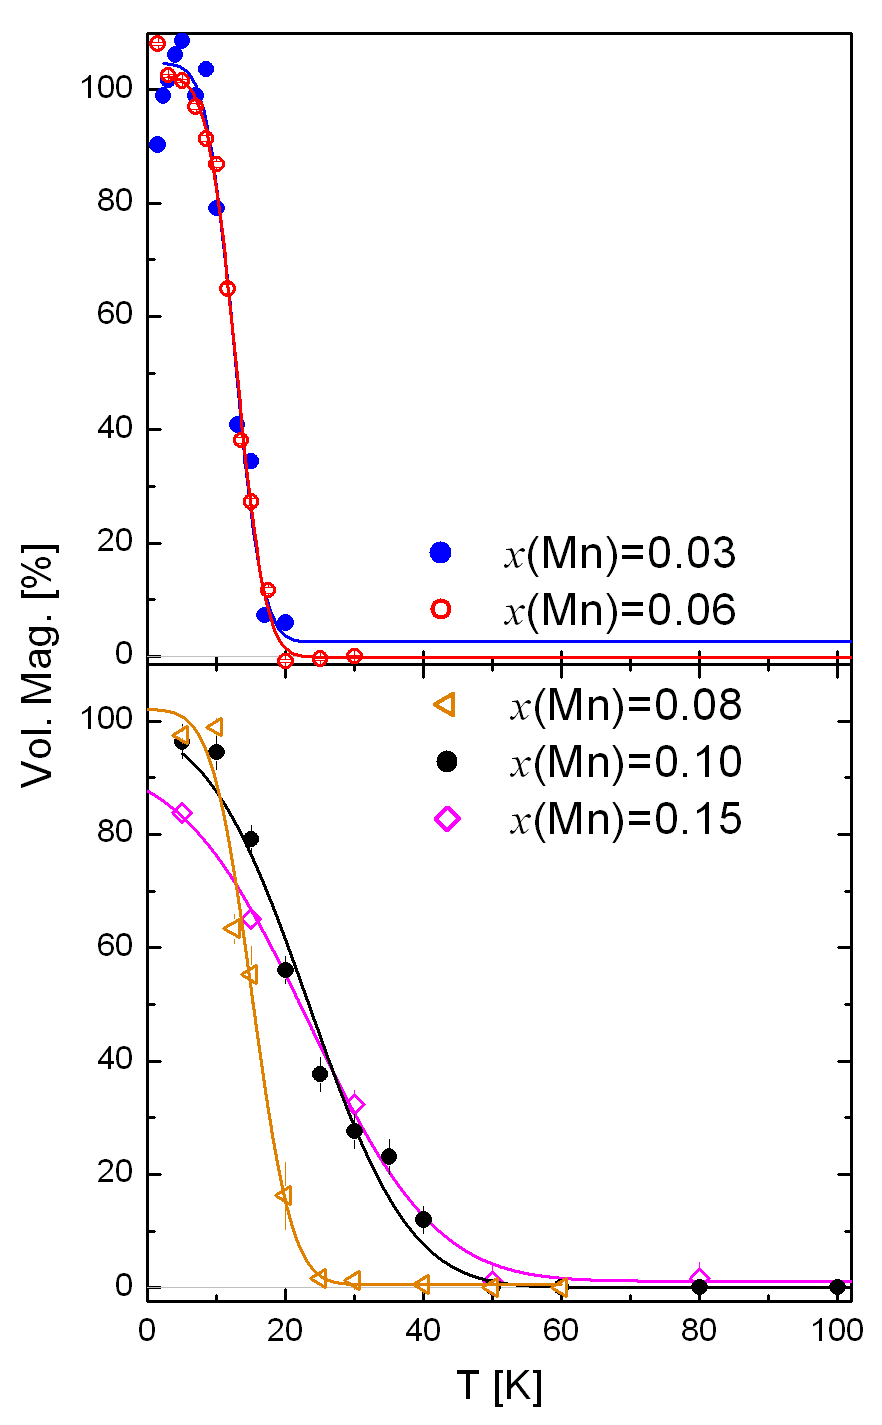
In Table 1 we summarize the internal magnetic field widths at 5 K, as determined from the Gaussian decay of the transverse component. Figure 11, instead, shows the temperature dependence of the magnetic volume fraction of the magnetically-ordered phase, calculated from the total longitudinal component using .111In magnetically ordered polycrystalline samples with domains distributed isotropically overall solid angles, 1/3 of the implanted muons probe a local field parallel to their initial polarization, whereas for 2/3 the initial polarization is orthogonal to it. In Table 1 we report the magnetic transition temperatures and their widths, as obtained by a phenomenological erf-like fit of data. All the samples with share the following features: (i) they are fully magnetically ordered at low temperature; (ii) both the magnetic transition width and the average Néel temperatures increase with increasing Mn content. Interestingly, the increased broadening of the magnetic transition mimics the behavior evidenced in 122 systems: for Mn concentrations above a critical threshold a new magnetic component (under the form of a long tail), persisting well beyond , appears in the magnetically ordered phaseKim et al. (2010); Inosov et al. (2013). This component was ascribed to the magnetic coupling of Mn ions by conduction electrons via the RKKY interactionGastiasoro and Andersen (2014).
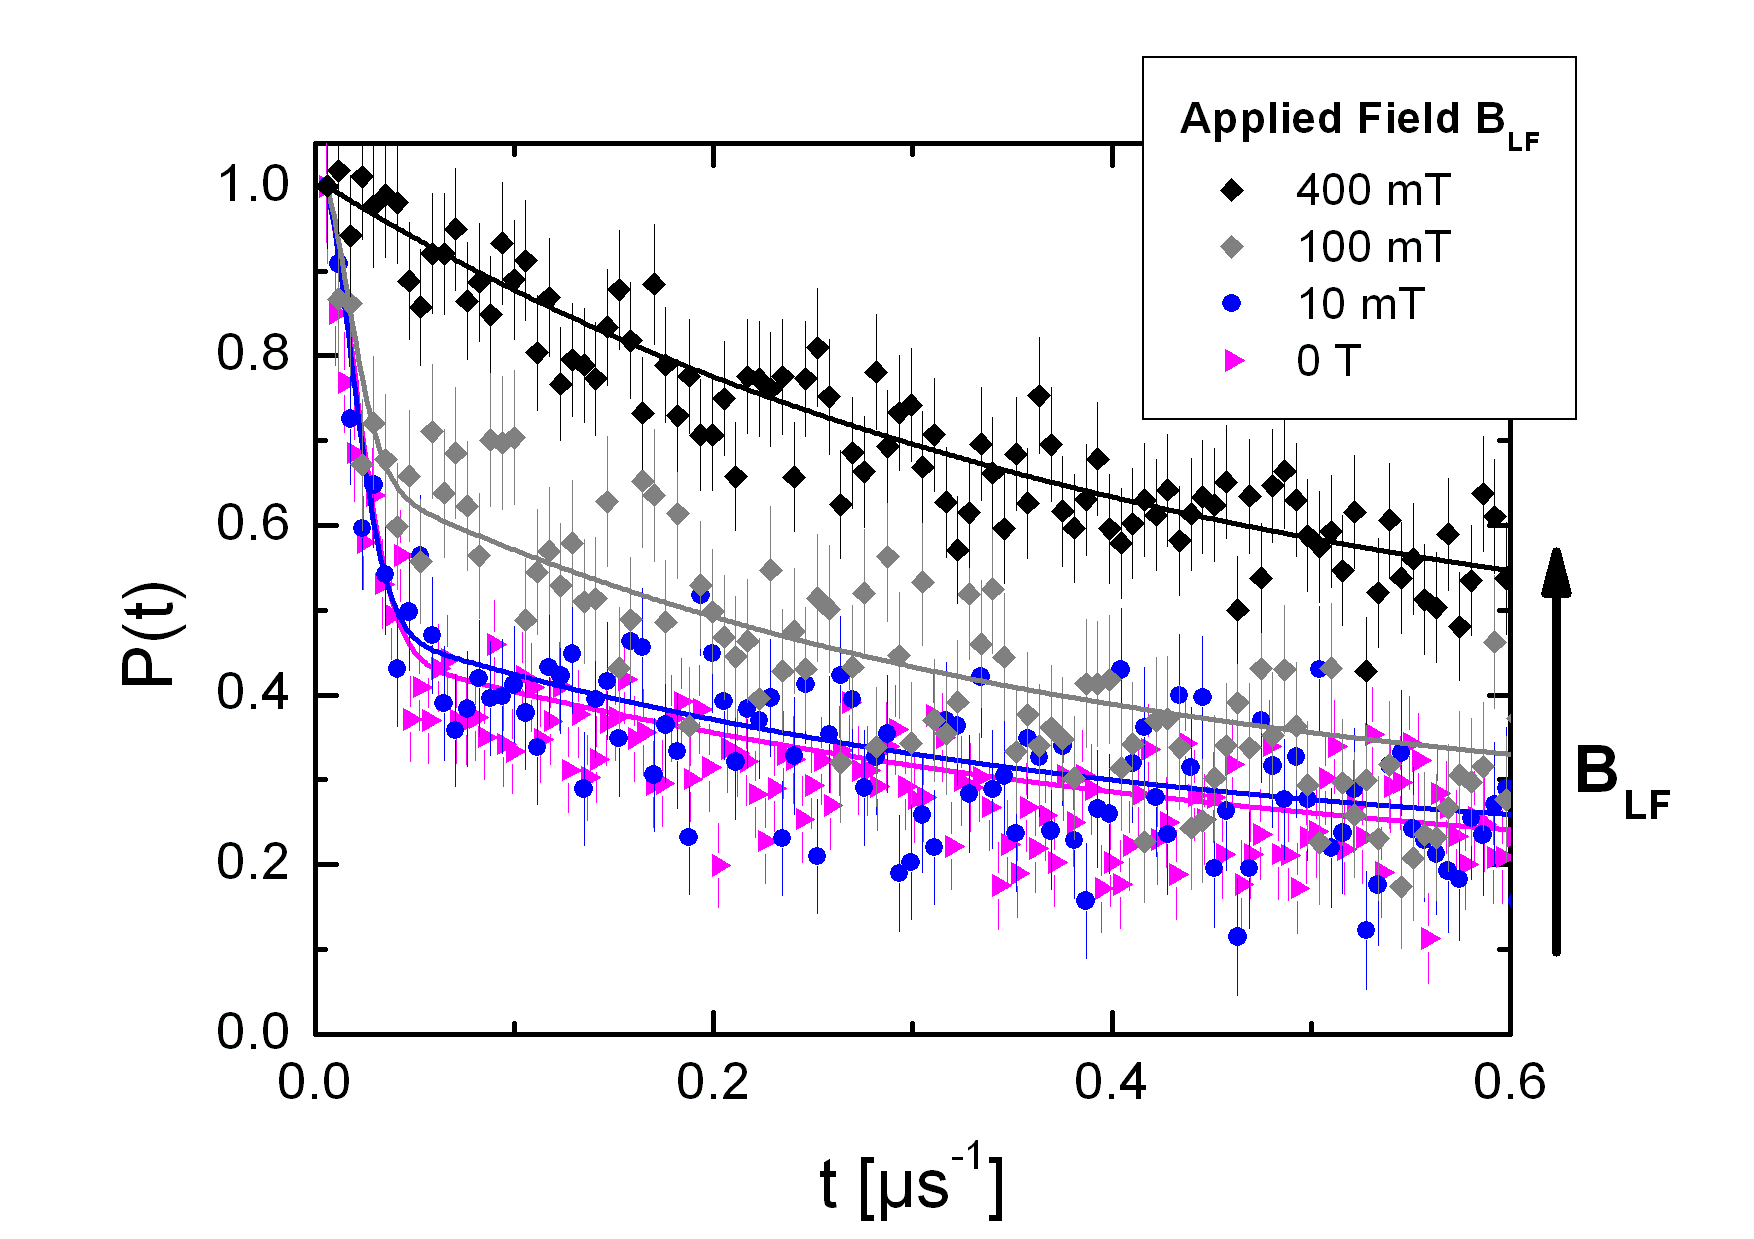
In principle, the absence of a coherent muon precession could be due either to a wide distribution of static fields, or to strongly fluctuating (i.e., dynamic) magnetic moments. To check if the magnetically ordered phase evidenced by ZF-SR is static in nature (on the SR time-scale), we carried out an LF-decoupling experiment (LF-SR ) in the representative case. In LF-SR experiments an external magnetic field is applied along the initial muon-spin direction. Contrary to what is expected for fluctuating magnetism, a clear recovery of the full polarization value for mT (see Fig. 12) confirms the static nature of the magnetically ordered phase. The order of magnitude of the locking field (hundreds of mT) is typical of the static internal fields normally found in pnictides.
| (Mn) | (K) | (K) | (K) | (mT) | |
|---|---|---|---|---|---|
| 0 | 0 | – | 48(1) | – | |
| 0.01 | 0 | – | 37(1) | – | |
| 0.03 | 12.5(4) | 3.1(7) | 21(1) | 24.9(7) | |
| 0.06 | 12.8(2) | 3.3(2) | 11(1) | 50(2) | |
| 0.08 | 13.5(3) | 3.0(4) | – | 45(5) | |
| 0.10 | 23.3(3) | 12(1) | – | 62(6) | |
| 0.15 | 23(2) | 15(2) | – | 56(4) |
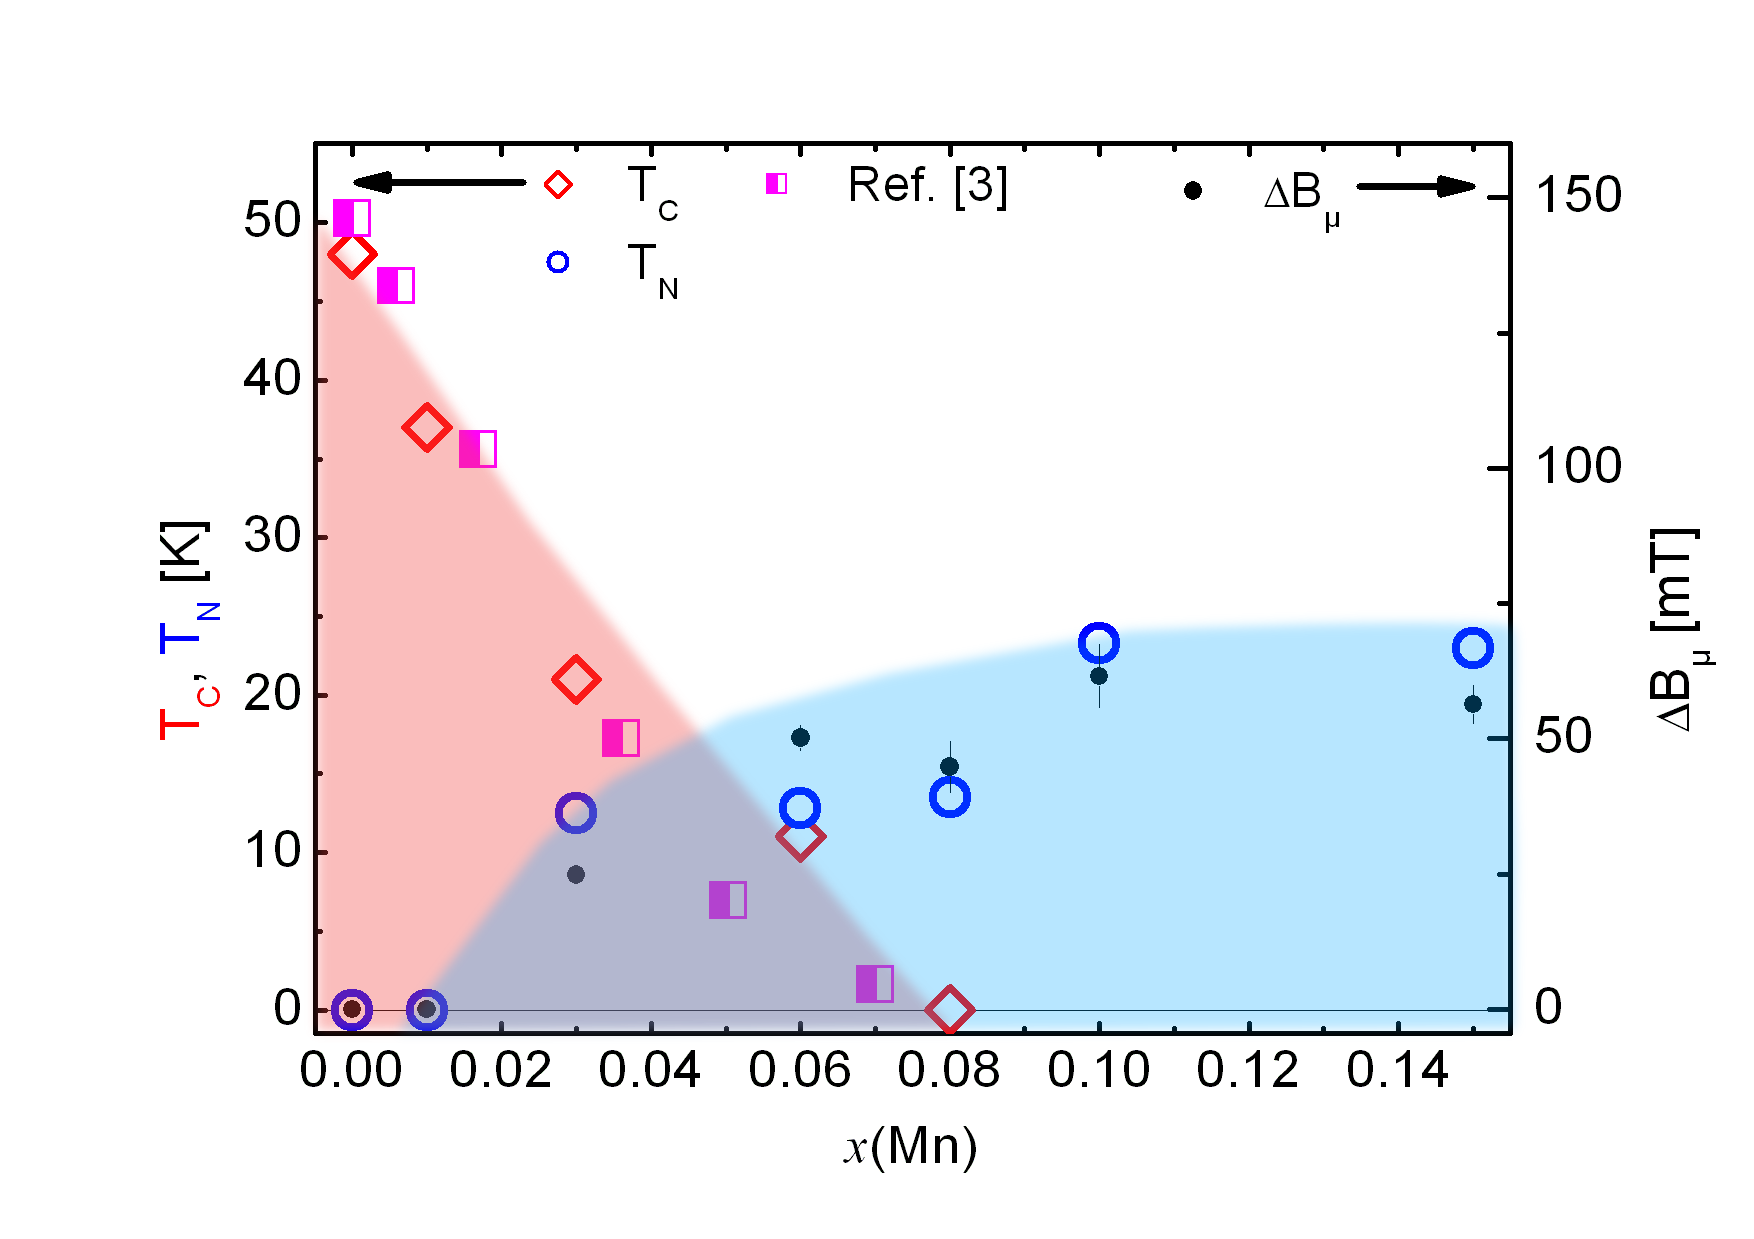
By considering the and values inferred from the dc-magnetization and SR data, we can draw a tentative phase diagram that describes the evolution of both the SC and M phases as a function of Mn content. As shown in Fig. 13, the main feature of the phase diagram is the presence of a narrow region, where both bulk superconductivity and FeAs magnetic order coexist over the whole sample volume. As established also for other members of the 1111 family (Sm-1111,Sanna et al. (2009a) Ce-1111,Sanna et al. (2010); Shiroka et al. (2011), La-1111,Lamura et al. (2014) and Nd-1111Lamura et al. (2015)), the simultaneous presence of M and SC bulk phenomena is compatible with their coexistence at a nanometer length scale. In Fig. 13 we report also the internal field width , as determined from the decay of the transverse component of ZF-SR data at 5 K [see Eq. (7)]. not only is of the same order of magnitude as the field widths already reported for other 1111 compounds but, most importantly, its magnitude (proportional to the magnetic order parameter) scales almost regularly with Mn content. This fact strongly suggests that the magnetic Mn ions induce and stabilize the magnetically ordered phase.
Finally, regarding the exchange interactions among the Mn ions in the Sm-1111 case we note that: (i) Transport measurements show a residual resistivity that scales with Mn content, with the overall behavior denoting a decrease in electronic correlation when compared with the La case.Sato et al. (2010) (ii) The critical temperature vanishes at , with a decreasing rate which is in good agreement with the theoretical predictions (squares in Fig. 13).Gastiasoro et al. (2016) (iii) The magnetically-ordered phase shows systematically lower values than that of La-1111 compounds, yet of the same order of magnitude as in the La-Y system.Moroni et al. (2016) All these features agree with the theoretical model reported in Ref. Gastiasoro et al., 2016, where the rate of suppression of and the type of magnetic order in the Mn-doped 1111 compounds were calculated starting from a multiband superconductor with an gap symmetry. For the case of magnetic disorder, the suppression rate is not dependent of the assumption of symmetry, but rather set by the strength of the scatterers and the electronic correlations in the bulk which can enhance the RKKY exchange interactions between Mn ions. In particular, in the Sm-1111 case, the exchange coupling between Mn moments and the conduction electrons is approximately 25% lower than in the La-1111 system, hence justifying a higher critical impurity concentration of about 8%.Gastiasoro et al. (2016) The weaker coupling could reflect the smaller ionic size of Sm with respect to La, which implies a smaller unit cell. That is responsible for a lower hopping parameter t and therefore for lower electronic correlation effects. Consequently, the Sm-1111 case mimics that of La-Y compounds, where the superconductivity is suppressed at a tenfold value of Mn doping with respect to the pure La-1111 case. Furthermore, a lower magnetic-exchange coupling among the Mn ions implies a lower magnetic ordering temperature (at the same Mn concentration) with respect to the La-1111 system: this is the case of both La-Y-1111 and Sm-1111, whose values are of the same order of magnitude.
IV Conclusion
We considered the role of magnetic Mn-for-Fe substitutions in the optimally-doped superconducting compound SmFeAsO0.88F0.12, a well known member of the 1111 class of iron-based superconductors. By means of magnetometry and SR measurements we could determine the critical superconducting temperature and the magnetic ordering temperature , respectively, in samples ranging in Mn content from 0 to 0.15. This allowed us to construct the phase diagram of the SmFe1-xMnxAsO0.88F0.12 family and to follow the evolution of the superconductivity from its optimum, achieved at , to its extinction at , and beyond.
Although superconductivity is suppressed only at , a concomitant AF phase appears already at , first coexisting at the nanoscale level with SC, then as an increasingly dominant phase, to become the only one above . While at low Mn substitution rates we observe mostly a depression of the superconductivity, at higher Mn values the cooperative effects among Mn ions reinforce the tendency towards antiferromangetic order. The above mentioned findings are fully compatible with a model superconducting system having an or gap-symmetry and moderate electron correlations.Gastiasoro et al. (2016)
Acknowledgements.
This work was performed at the Swiss Muon Source SS, Paul Scherrer Institut (PSI, Switzerland) and was in part supported by the Schweizerische Nationalfonds zur Förderung der Wissenschaftlichen Forschung (SNF) and the NCCR research pool MaNEP of SNF. G.L. and M.P. thank M. Lucaccini and G. Tavilla for their valuable technical support and C. Robustelli for the supply of cryogenic liquids. We acknowledge financial support by FP7-EU project SUPER-IRON (No. 283204) -M.P. and G. L., by MIUR project FIRB2012 - HybridNanoDev (Grant No. RBFR1236VV) -G.L., and by MIUR project PRIN2012 (Grant No. 2012X3YFZ2) -M.P. , G. L., S. S., M. M., P.C., R.D.R. and S.B.References
- Hirschfeld et al. (2011) P. J. Hirschfeld, M. M. Korshunov, and I. I. Mazin, “Gap symmetry and structure of Fe-based superconductors,” Rep. Prog. Phys. 74, 124508 (2011).
- Wang et al. (2013) Y. Wang, A. Kreisel, P. J. Hirschfeld, and V. Mishra, “Using controlled disorder to distinguish and gap structure in Fe-based superconductors,” Phys. Rev. B 87, 094504 (2013).
- Gastiasoro et al. (2016) M. N. Gastiasoro, F. Bernardini, and B. M. Andersen, “Unconventional disorder effects in correlated superconductors,” ArXiv1606.09495 (2016).
- Tropeano et al. (2010) M. Tropeano, M. R. Cimberle, C. Ferdeghini, G. Lamura, A. Martinelli, A. Palenzona, I. Pallecchi, A. Sala, I. Sheikin, F. Bernardini, M. Monni, S. Massidda, and M. Putti, “Isoelectronic Ru substitution at the iron site in SmFe1-xRuxAsO0.85F0.15 and its effects on structural, superconducting, and normal-state properties,” Phys. Rev. B 81, 184504 (2010).
- Sato and Kobayashi (2012) M. Sato and Y. Kobayashi, “On the superconducting pairing mechanism of Fe-based systems: Is it new or well-known?” Solid State Comm. 152, 688 (2012).
- Singh et al. (2013) S. J. Singh, J. Shimoyama, A. Yamamoto, H. Ogino, and K. Kishio, “Effects of Mn and Ni doping on the superconductivity of SmFeAs(O,F),” Physica C 494, 57–61 (2013).
- Prando et al. (2013) G. Prando, O. Vakaliuk, S. Sanna, G. Lamura, T. Shiroka, P. Bonfà, P. Carretta, R. De Renzi, H.-H. Klauss, C. G. F. Blum, S. Wurmehl, C. Hess, and B. Büchner, “Role of in-plane and out-of-plane dilution in CeFeAsO: Charge doping versus disorder,” Phys. Rev. B 87, 174519 (2013).
- Texier et al. (2012) Y. Texier, Y. Laplace, P. Mendels, J. T. Park, G. Friemel, D. L. Sun, D. S. Inosov, C. T. Lin, and J. Bobroff, “Mn local moments prevent superconductivity in iron pnictides Ba(Fe1-xMnx)2As2,” Europhys. Lett. 99, 17002 (2012).
- Suzuki et al. (2013) H. Suzuki, T. Yoshida, S. Ideta, G. Shibata, K. Ishigami, T. Kadono, A. Fujimori, M. Hashimoto, D. H. Lu, Z.-X. Shen, K. Ono, E. Sakai, H. Kumigashira, M. Matsuo, and T. Sasagawa, “Absence of superconductivity in the hole-doped Fe pnictide Ba(Fe1-xMnx)2As2: Photoemission and x-ray absorption spectroscopy studies,” Phys. Rev. B 88, 100501(R) (2013).
- Kim et al. (2010) M. G. Kim, A. Kreyssig, A. Thaler, D. K. Pratt, W. Tian, J. L. Zarestky, M. A. Green, S. L. Bud’ko, P. C. Canfield, R. J. McQueeney, and A. I. Goldman, “Antiferromagnetic ordering in the absence of structural distortion in Ba(Fe1-xMnx)2As2,” Phys. Rev. B 82, 220503(R) (2010).
- Tucker et al. (2012) G. S. Tucker, D. K. Pratt, M. G. Kim, S. Ran, A. Thaler, G. E. Granroth, K. Marty, W. Tian, J. L. Zarestky, M. D. Lumsden, S. L. Bud’ko, P. C. Canfield, A. Kreyssig, A. I. Goldman, and R. J. Mc Queeney, “Competition between stripe and checkerboard magnetic instabilities in Mn-doped BaFe2As2,” Phys. Rev. B 86, 020503(R) (2012).
- Inosov et al. (2013) D. S. Inosov, G. Friemel, J. T. Park, A. C. Walters, Y. Texier, Y. Laplace, J. Bobroff, V. Hinkov, D. L. Sun, Y. Liu, R. Khasanov, K. Sedlak, Ph. Bourges, Y. Sidis, A. Ivanov, C. T. Lin, T. Keller, and B. Keimer, “Possible realization of an antiferromagnetic Griffiths phase in Ba(Fe1-xMnx)2As2,” Phys. Rev. B 87, 224425 (2013).
- Gastiasoro and Andersen (2014) M. N. Gastiasoro and B. M. Andersen, “Enhancement of magnetic stripe order in iron-pnictide superconductors from the interaction between conduction electrons and magnetic impurities,” Phys. Rev. Lett. 113, 067002 (2014).
- Hammerath et al. (2014) F. Hammerath, P. Bonfà, S. Sanna, G. Prando, R. De Renzi, Y. Kobayashi, M. Sato, and P. Carretta, “Poisoning effect of Mn in LaFe1-xMnxAsO0.89F0.11: Unveiling a quantum critical point in the phase diagram of iron-based superconductors,” Phys. Rev. B 89, 134503 (2014).
- Hammerath et al. (2015) F. Hammerath, M. Moroni, L. Bossoni, S. Sanna, R. Kappenberger, S. Wurmehl, A. U. B. Wolter, M. A. Afrassa, Y. Kobayashi, M. Sato, B. Büchner, and P. Carretta, “Enhancement of low-frequency fluctuations and superconductivity breakdown in Mn-doped La1-yYyFeAsO0.89F0.11 superconductors,” Phys. Rev. B 92, 020505(R) (2015).
- Moroni et al. (2016) M. Moroni, S. Sanna, G. Lamura, T. Shiroka, R. De Renzi, R. Kappenberger, M. A. Afrassa, S. Wurmehl, A. U. B. Wolter, B. Büchner, and P. Carretta, “Competing effects of Mn and Y doping on the low-energy excitations and phase diagram of La1-yYyFeAsO0.89F0.11 iron-based superconductors,” Phys. Rev. B 94, 054508 (2016).
- Tarantini et al. (2010) C. Tarantini, M. Putti, A. Gurevich, Y. Shen, R. K. Singh, J. M. Rowell, N. Newman, D. C. Larbalestier, Peng Cheng, Ying Jia, and Hai-Hu Wen, “Suppression of the critical temperature of superconducting NdFeAs(OF) single crystals by Kondo-like defect sites induced by -particle irradiation,” Phys. Rev. Lett. 104, 087002 (2010).
- Sato et al. (2010) M. Sato, Y. Kobayashi, S. C. Lee, H. Takahashi, E. Satomi, and Y. Miura, “Studies on effects of impurity doping and NMR measurements of La 1111 and/or Nd 1111 Fe-pnictide superconductors,” J. Phys. Soc. Jpn. 79, 014710 (2010).
- Frankovsky et al. (2013) R. Frankovsky, H. Luetkens, F. Tambornino, A. Marchuk, G. Pascua, A. Amato, H.-H. Klauss, and D. Johrendt, “Short-range magnetic order and effective suppression of superconductivity by manganese doping in LaFe1-xMnxAsO1-yFy,” Phys. Rev. B 87, 174515 (2013).
- Khasanov et al. (2008) R. Khasanov, H. Luetkens, A. Amato, H.-H. Klauss, Z.-A. Ren, J. Yang, W. Lu, and Z.-X. Zhao, “Muon spin rotation studies of SmFeAsO0.85 and NdFeAsO0.85 superconductors,” Phys. Rev. B 78, 092506 (2008).
- Shiroka et al. (2011) T. Shiroka, G. Lamura, S. Sanna, G. Prando, R. De Renzi, M. Tropeano, M. R. Cimberle, A. Martinelli, C. Bernini, A. Palenzona, R. Fittipaldi, A. Vecchione, P. Carretta, A. S. Siri, C. Ferdeghini, and M. Putti, “Long- to short-range magnetic order in fluorine-doped CeFeAsO,” Phys. Rev. B 84, 195123 (2011).
- Yaouanc and Dalmas de Réotier (2011) Alain Yaouanc and Pierre Dalmas de Réotier, Muon Spin Rotation, Relaxation, and Resonance: Applications to Condensed Matter (Oxford University Press, Oxford, 2011).
- Drew et al. (2008) A. J. Drew, F. L. Pratt, T. Lancaster, S. J. Blundell, P. J. Baker, R. H. Liu, G. Wu, X. H. Chen, I. Watanabe, V. K. Malik, A. Dubroka, K. W. Kim, M. Rossle, and C. Bernhard, “Coexistence of magnetic fluctuations and superconductivity in the pnictide high temperature superconductor SmFeAsO1-xFx measured by muon spin rotation,” Phys. Rev. Lett. 101, 097010 (2008).
- Sanna et al. (2009a) S. Sanna, R. De Renzi, G. Lamura, C. Ferdeghini, A. Palenzona, M. Putti, M. Tropeano, and T. Shiroka, “Magnetic-superconducting phase boundary of SmFeAsO1-xFx studied via muon spin rotation: Unified behavior in a pnictide family,” Phys. Rev. B 80, 052503 (2009a).
- Renzi et al. (2012) R. De Renzi, P. Bonfà, M. Mazzani, S. Sanna, G. Prando, P. Carretta, R. Khasanov, A. Amato, H. Luetkens, M. Bendele, F. Bernardini, S. Massidda, A. Palenzona, M. Tropeano, and M. Vignolo, “Effect of external pressure on the magnetic properties of lnfeaso (ln = la, ce, pr, sm),” Superconductor Science and Technology 25, 084009 (2012).
- Möller et al. (2013) J. S. Möller, P. Bonfà, D. Ceresoli, F. Bernardini, S. J. Blundell, T. Lancaster, R. De Renzi, N. Marzari, I. Watanabe, S. Sulaiman, and M. I. Mohamed-Ibrahim, “Playing quantum hide-and-seek with the muon: localizing muon stopping sites,” Physica Scripta 88, 068510 (2013).
- Prando et al. (2015) G. Prando, G. Profeta, A. Continenza, R. Khasanov, A. Pal, V. P. S. Awana, B. Büchner, and S. Sanna, “Common effect of chemical and external pressures on the magnetic properties of . ii.” Phys. Rev. B 92, 144414 (2015).
- Branzoli et al. (2009) F. Branzoli, M. Filibian, P. Carretta, and S. Klyatskayaand M. Ruben, “Isoelectronic Ru substitution at the iron site in SmFe1-xRuxAsO0.85F0.15 and its effects on structural, superconducting, and normal-state properties,” Phys. Rev. B 79, 1220404(R) (2009).
- Cimberle et al. (2009) M. R. Cimberle, F. Canepa, M. Ferretti, A. Martinelli, A. Palenzona, A. S. Siri, C. Tarantini, M. Tropeano, and C. Ferdeghini, “Magnetic characterization of undoped and 15%F-doped LaFeAsO and SmFeAsO compounds,” J. Magn. Magn. Mater. 321, 3024–3030 (2009).
- Maeter et al. (2009) H. Maeter, H. Luetkens, "Yu". G. Pashkevich, A. Kwadrin, R. Khasanov, A. Amato, A. A. Gusev, K. V. Lamonova, D. A. Chervinskii, R. Klingeler, C. Hess, G. Behr, B. Büchner, and H.-H. Klauss, Phys. Rev. B 80, 094524 (2009).
- Brandt (1988) E. H. Brandt, “Flux distribution and penetration depth measured by muon spin rotation in high- superconductors,” Phys. Rev. B 37, 2349–2352 (1988).
- Fesenko et al. (1991) V. I. Fesenko, V. N. Gorbunov, and V. P. Smilga, “Analytical properties of muon polarization spectra in type-ii superconductors and experimental data interpretation for mono- and polycrystalline htscs,” Physica C 176, 551 (1991).
- Drew et al. (2009) A. J. Drew, Ch. Niedermayer, P. J. Baker, F. L. Pratt, S. J. Blundell, T. Lancaster, R. H. Liu, G. Wu, X. H. Chen, I. Watanabe, V. K. Malik, A. Dubroka, M. Rossle, K. W. Kim, C. Baines, and C. Bernhard, “Coexistence of static magnetism and superconductivity in SmFeAsO1-xFx as revealed by muon spin rotation,” Nature Materials 8, 310 (2009).
- Sanna et al. (2009b) S. Sanna, R. De Renzi, G. Lamura, C. Ferdeghini, A. Martinelli, A. Palenzona, M. Putti, M. Tropeano, and T. Shiroka, “Intrinsic ferromagnetic impurity phases in SmFeAsO1-xFx detected by SR,” J. Supercond. Nov. Magn. 22, 585–588 (2009b).
- Lamura et al. (2014) G. Lamura, T. Shiroka, P. Bonfà, S. Sanna, R. De Renzi, F. Caglieris, M. R. Cimberle, S. Iimura, H. Hosono, and M. Putti, “Crossover between magnetism and superconductivity in LaFeAsO with low H-doping level,” J. Phys.: Condens. Matter 26, 295701 (2014).
- Note (1) In magnetically ordered polycrystalline samples with domains distributed isotropically overall solid angles, 1/3 of the implanted muons probe a local field parallel to their initial polarization, whereas for 2/3 the initial polarization is orthogonal to it.
- Sanna et al. (2010) S. Sanna, R. De Renzi, T. Shiroka, G. Lamura, G. Prando, P. Carretta, M. Putti, A. Martinelli, M. R. Cimberle, M. Tropeano, and A. Palenzona, “Nanoscopic coexistence of magnetic and superconducting states within the FeAs layers of CeFeAsO1-xFx,” Phys. Rev. B 82, 060508 (2010).
- Lamura et al. (2015) G. Lamura, T. Shiroka, P. Bonfà, S. Sanna, R. De Renzi, M. Putti, N. D. Zhigadlo, S. Katrych, R. Khasanov, and J. Karpinski, “Slow magnetic fluctuations and superconductivity in fluorine-doped NdFeAsO,” Phys. Rev. B 91, 024513 (2015).