Fast recovery of the stripe magnetic order by Mn/Fe
substitution
in F-doped LaFeAsO superconductors
Abstract
75As Nuclear Magnetic (NMR) and Quadrupolar (NQR) Resonance were used, together with Mössbauer spectroscopy, to investigate the magnetic state induced by Mn for Fe substitutions in F-doped LaFe1-xMnxAsO superconductors. The results show that % of Mn doping is enough to suppress the superconducting transition temperature from 27 K to zero and to recover the magnetic structure observed in the parent undoped LaFeAsO. Also the tetragonal to orthorhombic transition of the parent compound is recovered by introducing Mn, as evidenced by a sharp drop of the NQR frequency. The NQR spectra also show that a charge localization process is at play in the system. Theoretical calculations using a realistic five-band model show that correlation-enhanced RKKY exchange interactions between nearby Mn ions stabilize the observed stripe magnetic order. These results give compelling evidence that F-doped LaFeAsO is a strongly correlated electron system at the verge of an electronic instability.
pacs:
74.70.Xa, 76.60.-k, 76.75.+i, 74.40.Kb, 74.20.MnThe interplay between impurity induced disorder and electronic correlations often gives rise to complex phase diagrams in condensed matter miranda2005 ; lee1985 . The electronic correlations drive a system towards a quantum phase transition, as it is typically found in the fullerides capone2015 and in heavy-fermion compounds curro2014 ; curro2016 , with an enhancement of the local susceptibility and, hence, a small perturbation, as the one associated with a tiny amount of impurities, can significantly affect the electronic ground-state Alloul2009 ; sato2012 ; sanna2013 ; prando2015 . In the cuprates and in the electron-doped iron-based superconductors (IBS) the strength of the electronic correlations can be tuned either by charge doping or by applying an external or a chemical pressure.luetkens2009 ; sanna2009 ; shiroka2011 ; prando2013 ; khasanov2011 In particular, upon increasing the charge doping, the strength of the electronic correlations tend to decrease Capone2002 ; hess2009 ; Qazilbash2009 ; Ikeda2010 ; Dai2012 ; Yu2013 ; Medici2014 ; Lee2010 and a metallic Fermi liquid (FL) ground state is usually restored mazin2008 ; tropeano2010 ; giovannetti2011 ; benfatto2011 ; gastiasoro2016 . However significant electronic correlations may still be present even close to the charge doping levels yielding the maximum superconducting transition temperature and a convenient method to test their magnitude is to perturb the system with impurities.
The introduction of Mn impurities at the Fe sites was reported to strongly suppress in several IBS, both of the BaFe2As2 cheng2010 ; li2012 ; leboeuf2013 and of the LnFeAsO (Ln1111, Ln=Lanthanides) sato2010 families. Within the Ln1111 family the effect of impurities is particularly significant in La1111 gastiasoro2016 ; Hammerath2014 . In fact, while in most the IBS compounds the Tc suppression rate (ddx) is well below 10 K/% Mn, in LaFeAsO0.89F0.11 just 0.2 - 0.3% of Mn impurities suppress superconductivity from the optimal T K (ddx 110 K/% Mn) and then, at higher Mn doping levels, a magnetic order develops (see Fig. 1b) Hammerath2014 ; hammerath2015 ; moroni2016 . The understanding of why such a dramatic effect is present, what type of magnetic order is developing and how to describe these materials at the microscopic level are presently subject of debate fernandes2013 ; tucker2012 ; gastiasoro2015 . Here we show, by means of zero-field (ZF) NMR, nuclear quadrupole resonance (NQR) and Mössbauer spectroscopy that the introduction of 0.5 % of Mn in LaFeAsO0.89F0.11 induces the recovery of the magnetic order and of the tetragonal to orthorhombic (T-O) structural transitions observed in LaFeAsO, the parent compound of La1111 superconductors. Moreover the decrease of the charge transfer integral and the enhanced electron correlations lead to the electron localization and to a local charge distribution similar to that found in LaFeAsO. We also present theoretical calculations showing that correlation-enhanced RKKY exchange couplings between neighboring Mn ions stabilize the magnetic order characterized by and domains.
The LaFe1-xMnxAsO0.89F0.11 polycrystalline samples under investigation are the same ones studied in Ref. Hammerath2014, . Further details on the sample preparation and characterization can be found in the Suppl. Materials suppmat .
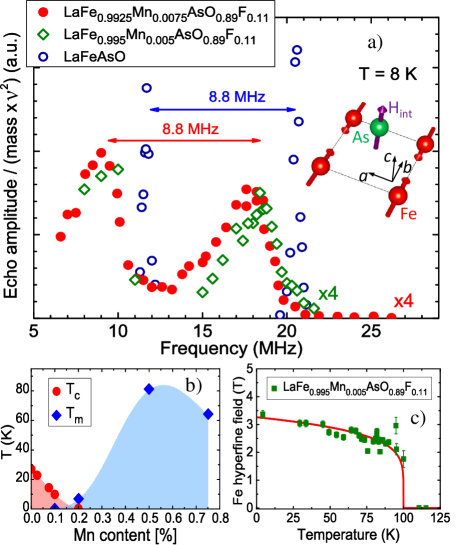
75As zero-field (ZF) NMR spectra were obtained by recording the echo amplitude as a function of the irradiating frequency in the 6-26 MHz range for K (see Fig. 1a). Both the spectra of the LaFeAsO parent compound and of the x=0.75% sample are characterized by two peaks, which in the latter compound are rigidly shifted to lower frequencies and broadened. The peaks are associated with the and transitions, with the component of the nuclear spin along the quantization axis, which in the case of a stripe magnetic order (magnetic wave vector or ), as it is the case for LaFeAsO, is along the axis. The frequency shift between the two peaks is given by the nuclear quadrupole frequency determined by the local charge distribution, which at 8 K is MHz both for LaFeAsO and for the % sample.
The position of the low-frequency peak (), associated with the transition, is determined by the magnitude of the hyperfine field at 75As, and one can write that , with the 75As gyromagnetic ratio, the hyperfine coupling tensor and the average electron spin, corresponding to the magnetic phase order parameter. Accordingly, the low-frequency shift of the two peaks in the sample with % would indicate a reduction of the order parameter to about 80% of the value found for LaFeAsO. The sample with % displays a very similar behavior with a slight increase in the low-temperature order parameter, following its slightly higher magnetic transition temperature (Tm) Hammerath2014 . From the magnetic point of view the two samples % and 0.75 % are almost equivalent, as already shown from previous muon spin relaxation experiments Hammerath2014 .
In order to further study the magnetic order parameter we measured the temperature dependence of Mössbauer spectra for the % sample. Fig. 1c shows that in the low temperature limit the internal field at the Fe site is of about 3.5 T, i.e. the magnitude of the order parameter is reduced to about 70% of the value found in pure LaFeAsO klauss2008 ; kitao2008 ; mcguire2008 , in reasonable agreement with what we derived above from ZF-NMR.
Now, one has first to consider if magnetic orders different from the stripe one could give rise to a similar ZF-NMR spectrum, taking into account the reduction in the Fe moment to about 80% of the value found in LaFeAsO. The other low-energy magnetic orders which could develop in this compound are the Néel () and the Orthomagnetic type, with a rotation of the adjacent spins giovannetti2011 . Calculations of the hyperfine magnetic field kitagawa2008 ; kitagawa2010 at the As site (Suppl. Materials suppmat ) show that both these magnetic orders would give rise to ZF-NMR lines significantly shifted from the ones reported in Fig. 1a, thus confirming that the order is stripe-type. On the other hand, one could argue that the stripe order could coexist with other types of order developing close to Mn impurities and that we are actually detecting the signal from a fraction of 75As nuclei only. Thus, we have performed a quantitative estimate of the amount of nuclei contributing to the % sample ZF-NMR spectrum in Fig. 1a by comparing its integrated intensity with that of the LaFeAsO sample, where 100 % of the sample is in the stripe collinear phase. We found that % of the % sample is in the stripe order.
In order to further check if there is a small ( %) fraction of 75As nuclei that we are missing, we performed 75As NMR measurements in a 8 T magnetic field. In Fig. 2 the powder NMR spectrum displays a large fraction of nuclei with a spectrum broadened riedi1989 by the internal field developing in the stripe phase (cyan diamonds) as well as a small fraction of about % of 75As nuclei with a significant NMR shift towards higher frequencies (yellow circles). These latter nuclei are likely the ones close to Mn impurities where a large hyperfine field is expected. For % there are 2% of As nuclei which are nearest neighbors of a Mn impurities, a value very similar to the one we found. Hence, the introduction of Mn suppresses superconductivity and leads to the recovery of the stripe magnetic order found in the parent LaFeAsO compound. Any incommensurate magnetic order, if present, should have a magnetic wave-vector very close to the stripe one (see Suppl. Material suppmat ). This aspect could be clarified by future neutron diffraction experiments.
The nuclear quadrupole frequency (Fig. 3) shows a jump on passing from just above Tm (75As NQR) to below Tm (75As ZF-NMR) which is very similar to the one detected fu2012 in LaFeAsO. This abrupt change in is associated with the T-O distortion. Therefore, the observation of a similar change in for the % compound indicates that when the stripe magnetic order is recovered by Mn doping also the T-O structural transition is recovered, confirming that this transition is closely related to the onset of large stripe magnetic correlations. We further remark that the T-O transition causes also a change in the electric field gradient probed by Fe nuclei, as detected by Mössbauer spectroscopy (see Suppl. Materials).
Another relevant aspect can be grasped by looking at the 75As NQR spectra which can give detailed informations about the electronic environment surrounding the As nuclei lang2016 ; lang2010 ; kobayashi2010 . The spectra in Fig. 4, measured at K for % and at K (above Tm) for show a clear shift of the NQR spectrum towards lower frequency with increasing Mn content (see Fig. 4b) and a rapid change in the intensity of the low-frequency peak for %. It is worth to note that for % the frequency of the dominant low frequency peak perfectly matches that of the paramagnetic phase of LaFeAsO (see Fig. 3 and 4b), indicating a similar electronic ground state. According to Lang et al. lang2010 , the low and high-frequency NQR peaks should be associated with nanoscopically segregated regions with different electron doping levels. In particular, the low-frequency peak should be associated with a lower electronic concentration of weakly itinerant electrons. Hence, the increase in the magnitude of the low-frequency peak above % indicates a tendency towards electron localization. This finding is also corroborated by the rapid increase of the electric resistivity as a function of Mn content previously observed sato2010 ; berardan2009 across the metal-insulator crossover taking place around %. A similar rise in resistivity was also observed hess2009 in LaFeAsO1-xFx with decreasing F content. One would expect that since LaFeAsO1-xFx is characterized by Fermi pockets, a scattering center as Mn would induce in any way charge localization. However, this can occur only if the response function of the bare system is strongly enhanced, as it is the case for La1111 but not for Sm1111. We add here that the increase of the resistivity and the slight increase of the lattice constant follow the suppression of the superconductivity (see Fig. 12 of Ref. sato2010 for details). In fact, the axis value appears to correlate with the Tc value, irrespective of the microscopic mechanism of suppression.
In order to further clarify the origin of the dramatic effect of Mn doping in LaFeAsO0.89F0.11, we carried out real space theoretical calculations using a realistic five band Hamiltonian ikeda2010 ; gastiasoro2016 (see Supplementary Material suppmat ). In Ref. gastiasoro2016 it was demonstrated that in this framework the enhanced spin correlations developing around Mn severely speed up the reduction of driven by the magnetic disorder, and may quench the entire superconducting phase already at Mn concentrations below 1 %. The Mn moments, while substituting random Fe positions, orient their moments favorably to generate a long-range ordered SDW phase which minimizes the total free energy of systems at the brink of a SDW instability.andersen2007 ; gastiasoro2014
In Fig. 5(a) we show the total magnetization for a collection of 0.55% Mn ions randomly placed in the square Fe lattice. This concentration of Mn is able to fully suppress and spin polarize all Fe sites (which were all non-magnetic without Mn impurity ions). The Mn-induced magnetic order existing in the inter-impurity regions is long-ranged as reproduced by the sharp peaks in Fig. 5(b), which are absent in the Mn free compound. A small fraction of the sites, roughly corresponding to the Mn sites and to their nearest-neighbors (amounting to of the lattice) exhibits a significantly larger moment, in overall agreement with the above discussion of the 75As NMR data (see Fig. 2).
The magnetic order generated by Mn doping is efficiently stabilized due to correlation-enhanced RKKY exchange couplings between neighboring Mn ions. The structure of the induced order is thus dictated by the susceptibility of the bulk itinerant system which, in the present case, is peaked at and regions. In Fig. 5(c) we provide a real-space map of the dominant momentum structure by utilizing a filtered Fourier transform illustrated in Fig. 5(d) and the associated caption. As seen, the system breaks up into regions of single-Q domains, i.e. either - or -dominated regions, and does not exhibit substantial volume fraction of double-Q order.gastiasoro2015 This is consistent with the presence of a (reduced) orthorhombic transition associated with the Mn-induced magnetic order, as found by 75As NQR (see Fig. 3). All these theoretical results match with the experimental outcomes.
Overall the above scenario is a clear indication that in LaFeAsO0.89F0.11 superconductivity emerges from a strongly correlated electron system close to a metal-insulator transition. The electron correlations are so strong that, owing to the enhanced spin susceptibility at , the effect of a tiny amount of impurities extends over many lattice sites, giving rise to a sizable RKKY coupling among them able to abruptly destroy superconductivity and to restore the stripe magnetic order. The onset of the magnetic order is intimately related with the charge localization sato2010 and hence to the Tc suppression. This situation is reminiscent of the phenomenology observed in heavy fermion (HF) compounds doniach77 ; weng-rev2016 where the FL phase vanishes and a magnetic order arises in correspondence of a QCP when the RKKY interaction overcomes the Kondo coupling. For example, in CeCoIn5, a HF compound, it was shown that a tiny amount of Cd doping restores the long range antiferromagnetic (AF) order curro2014 ; curro2016 ; pham2006 and suppresses the superconducting dome developing around the quantum critical point separating the FL from the AF phase. In LaFe1-xMnxAsO0.89F0.11 the Kondo coupling would involve itinerant and more localized 3 electrons wu2016 ; haul2009 ; dai2012 playing a role analogous to the electrons in the HF. When these latter electrons finally localize the RKKY coupling among Mn impurities leads to the recovery of magnetism and the suppression of the metallic superconducting state.
The abrupt suppression of the superconducting phase and the recovery of the magnetic order and of the structural T-O transition give compelling evidence that the optimally F doped LaFeAsO is at the verge of an electronic instability, close to a QCP Hammerath2014 . Previous experimental results have shown that this system can be driven away from the QCP via the total substitution of La with Nd or by the partial substitution with Y hammerath2015 ; moroni2016 , which shrink the structure and cause a reduction of the electronic correlations gastiasoro2016 . Hence, the Ln1111 compound can be considered as a formidable example of how the electronic properties of strongly correlated systems can be significantly affected by fine-tuning the correlation strength with impurities and chemical pressure.
Acknowledgements.
B. Büchner is thanked for useful discussions. This work was supported by MIUR-PRIN2012 Project No. 2012X3YFZ2. M.N.G. and B.M.A acknowledge support from Lundbeckfond fellowship (grant A9318).References
- (1) E. Miranda and V. Dobrosavljevic, Rep. Prog. Phys. 68, 2337 (2005).
- (2) P. A. Lee and T. V. Ramakrishnan, Disordered electronic systems, Rev. Mod. Phys. 57, 287 (1985).
- (3) Y. Nomura, S. Sakai, M. Capone and R. Arita, Science Advances, Vol. 1, no. 7, e1500568 (2015).
- (4) S. Seo, Xin Lu, J-X. Zhu, R. R. Urbano, N. Curro, E. D. Bauer, V. A. Sidorov, L. D. Pham, Tuson Park, Z. Fisk and J. D. Thompson, Nature Physics 10, 120-125 (2014).
- (5) A. Benali, Z. J. Bai, N. J. Curro, and R. T. Scalettar, Phys. Rev. B 94, 085132 (2016).
- (6) H. Alloul, J. Bobroff, M. Gabay and P.J. Hirschfeld, Rev. Mod. Phys. 81, 45 (2009).
- (7) M. Sato, Y. Kobayashi, S. Satomi, T, Kawamata, M. Itoh, Journal of Physics: Conference Series 400, (2012) 022104
- (8) S. Sanna, P. Carretta, R. De Renzi, G. Prando, P. Bonfà, M. Mazzani, G. Lamura, T. Shiroka, Y. Kobayashi, M. Sato, Phys. Rev. B 87, 134518 (2013)
- (9) G. Prando, Th. Hartmann, W. Schottenhamel, Z. Guguchia, S. Sanna, F. Ahn, I. Nekrasov, C. G. F. Blum, A. U. B. Wolter, S. Wurmehl, R. Khasanov, I. Eremin, and B. Büchner Phys. Rev. Lett. 114, 247004 (2015)
- (10) H. Luetkens, H.-H. Klauss, R. Khasanov, A. Amato, R. Klingeler, I. Hellmann, N. Leps, A. Kondrat, C. Hess, A. Kohler, G. Behr, J. Werner, and B. Büchner, Nature Mater. 8, 305 (2009).
- (11) S. Sanna, R. De Renzi, G. Lamura, C. Ferdeghini, A. Palenzona, M. Putti, M. Tropeano, and T. Shiroka, Phys. Rev. B 80, 052503 (2009).
- (12) T. Shiroka, G. Lamura, S. Sanna, G. Prando, R. De Renzi, M. Tropeano, M. R. Cimberle, A. Martinelli, C. Bernini, A. Palenzona, R. Fittipaldi, A. Vecchione, P. Carretta, A. S. Siri, C. Ferdeghini, and M. Putti, Phys. Rev. B 84, 195123 (2011).
- (13) G. Prando, O. Vakaliuk, S. Sanna, G. Lamura, T. Shiroka, P. Bonfà, P. Carretta, R. De Renzi, H.-H. Klauss, C. G. F. Blum, S. Wurmehl, C. Hess, and B. Büchner Phys. Rev. B 87, 174519 (2013)
- (14) R. Khasanov, S. Sanna, G. Prando, Z. Shermadini, M. Bendele, A. Amato, P. Carretta, R. De Renzi, J. Karpinski, S. Katrych, H. Luetkens, and N. D. Zhigadlo, Phys. Rev. B 84, 100501 (2011).
- (15) M. Capone, M. Fabrizio, C. Castellani, E. Tosatti, Science 296, 2364 (2002)
- (16) C. Hess, A. Kondrat, A. Narduzzo, J. E. Hamann-Borrero, R. Klingeler, J. Werner, G. Behr, and B. Büchner, Europhys. Lett. 87, 17005 (2009).
- (17) M. M. Qazilbash, J. J. Hamlin, R. E. Baumbach, L. Zhang, D. J. Singh, M. B. Maple D. N. Basov Nature Physics 5, 647 (2009)
- (18) H. Ikeda, R. Arita, J. Kunes, Phys. Rev. B 82, 024508 (2010)
- (19) P. Dai, J. Hu, E. Dagotto, Nature Physics 8, 709 (2012)
- (20) R. Yu, Q. Si, P. Goswami, E. Abrahams, J. Phys.: Conf. Ser. 449, 012025 (2013)
- (21) L. de Medici, G. Giovannetti, M. Capone, Phys. Rev. Lett. 112, 177001 (2014)
- (22) H. Lee, Y-Z. Zhang, H.O. Jeschke, R. Valenti, Phys. Rev. B 81, 220506 (2010)
- (23) I. I. Mazin, D. J. Singh, M. D. Johannes, M. H. Du, Phys. Rev. Lett. 101, 057003 (2008)
- (24) M. Tropeano, M. R. Cimberle, C. Ferdeghini, G. Lamura, A. Martinelli, A. Palenzona, I. Pallecchi, A. Sala, I. Sheikin, F. Bernardini, M. Monni, S. Massidda, and M. Putti, Phys. Rev. B 81, 184504 (2010)
- (25) G. Giovannetti, C. Ortix, M. Marsman, M. Capone, J. van den Brink, and J. Lorenzana, Nat. Commun. 2, 398 (2011).
- (26) L. Benfatto, E. Cappelluti, L. Ortenzi, L. Boeri, Phys. Rev. B 83, 224514 (2011)
- (27) M. N. Gastiasoro, F. Bernardini, B. M. Andersen, Phys. Rev. Lett. 117, 257002 (2016).
- (28) P. Cheng, B. Shen, J. Hu, and H.-H. Wen, Phys. Rev. B 81, 174529 (2010).
- (29) J. Li, Y. F. Guo, S. B. Zhang, J. Yuan, Y. Tsujimoto, X. Wang, C. I. Sathish, Y. Sun, S. Yu, W. Yi, K. Yamaura, E. Takayama-Muromachiu, Y. Shirako, M. Akaogi, and H. Kontani, Phys. Rev. B 85, 214509 (2012).
- (30) D. LeBoeuf, Y. Texier, M. Boselli, A. Forget, D. Colson, and J. Bobroff, Phys. Rev. B 89, 035114 (2014).
- (31) M. Sato, Y. Kobayashi, S. C. Lee, H. Takahashi, E. Satomi, Y. Miura, J. Phys. Soc. Jpn. 79 014710 (2010).
- (32) F. Hammerath, P. Bonfá, S. Sanna, G. Prando, R. De Renzi, Y. Kobayashi, M. Sato, and P. Carretta, Phys. Rev. B 89, 134503 (2014).
- (33) F. Hammerath, M. Moroni, L. Bossoni, S. Sanna, R. Kappenberger, S. Wurmehl, A. U. B. Wolter, M. A. Afrassa, Y. Kobayashi, M. Sato, B. Büchner, and P. Carretta, Phys. Rev. B 92, 020505(R) (2015).
- (34) M. Moroni, S. Sanna, G. Lamura, T. Shiroka, R. De Renzi, R. Kappenberger, M. A. Afrassa, S. Wurmehl, A. U. B. Wolter, B. Büchner, P. Carretta, Phys. Rev. B 94, 054508 (2016).
- (35) R. M. Fernandes and A. J. Millis, Phys. Rev. Lett. 110, 117004
- (36) G. S. Tucker, D. K. Pratt, M. G. Kim, S. Ran, A. Thaler, G. E. Granroth, K. Marty, W. Tian, J. L. Zarestky, M. D. Lumsden, S. L. Bud’ko, P. C. Canfield, A. Kreyssig, A. I. Goldman, and R. J. McQueeney, Phys. Rev. B 86, 020503(R)
- (37) M. N. Gastiasoro and B. M. Andersen, Phys. Rev. B 92, 140506(R) (2015).
- (38) See Supplemental Material at [URL will be inserted by publisher] for details about the composition of the samples, the Mössbauer measurements, NQR and NMR spectra, and the theoretical methods used in the paper.
- (39) H.-H. Klauss, H. Luetkens, R. Klingeler, C. Hess, F. J. Litterst, M. Kraken, M. M. Korshunov, I. Eremin, S.-L. Drechsler, R. Khasanov, A. Amato, J. Hamann-Borrero, N. Leps, A. Kondrat, G. Behr, J. Werner, and B. Büchner, Phys. Rev. Lett. 101, 077005 (2008).
- (40) S. Kitao, Y. Kobayashi, S. Higashitaniguchi, M. Saito, Y. Kamihara, M. Hirano, T. Mitsui, H. Hosono, M. Seto, J. Phys. Soc. Japan 77, 103706 (2008)
- (41) M. A. McGuire, A. D. Christianson, A. S. Sefat, B. C. Sales, M. D. Lumsden, R. Jin, E. A. Payzant, D. Mandrus, Y. Luan, V. Keppens, V. Varadarajan, J. W. Brill, R. P. Hermann, M. T. Sougrati, F. Grandjean, and G. J. Long, Phys. Rev. B 78, 094517 (2008).
- (42) K. Kitagawa, N. Katayama, K. Ohgushi, M. Yoshida, M. Takigawa, J. Phys. Soc. Jpn. 77, 114709 (2008).
- (43) S. Kitagawa, Y. Nakai, T. Iye, K. Ishida, Y. Kamihara, M. Hirano, H. Hosono, Phys. Rev. B, 81, 212502 (2010).
- (44) P. C. Riedi, Hyperfine Interact. 49, 335 (1989).
- (45) M.Fu, D. A. Torchetti, T. Imai, F. L. Ning, J.-Q. Yan, and A. S. Sefat, Phys. Rev. Lett. 109, 247001 (2012).
- (46) G. Lang, L. Veyrat, U. Gräfe, F. Hammerath, D. Paar, G. Behr, S. Wurmehl, and H.-J. Grafe, Phys. Rev. B 94, 014514
- (47) G. Lang, H.-J. Grafe, D. Paar, F. Hammerath, K. Manthey, G. Behr, J. Werner, and B. Büchner, Phys. Rev. Lett. 104, 097001 (2010).
- (48) Y. Kobayashi, E Satomi, S. C. Lee and M. Sato, J. Phys. Soc. Jpn. 79, 093709 (2010).
- (49) D. Bérardan, L. Pinsard-Gaudart, N. Dragoe, Journal of Alloys and Compounds, Volume 481, Issues 1-2, 29 July 2009, Pages 470-472
- (50) H. Ikeda, R. Arita, and J. Kunes, Phys. Rev. B 81,054502 (2010).
- (51) B. M. Andersen, P. J. Hirschfeld, A. P. Kampf, and M. Schmid, Phys. Rev. Lett. 99, 147002 (2007).
- (52) M. N. Gastiasoro and B. M. Andersen, Phys. Rev. Lett. 113, 067002 (2014).
- (53) S. Doniach, Physica B+C, Vol. 91, July 1977, Pages 231-234.
- (54) ZF Weng, M Smidman, L Jiao, Xin Lu, and H Q Yuan, Reports on Progress in Physics, Vol. 79, Num. 9.
- (55) L. D. Pham, Tuson Park, S. Maquilon, J. D. Thompson, and Z. Fisk, Phys. Rev. Lett. 97, 056404 (2006).
- (56) Y. P. Wu, D. Zhao, A. F. Wang, N. Z. Wang, Z. J. Xiang, X. G. Luo, T. Wu and X. H. Chen, Phys. Rev. Lett. 116, 147001 (2016).
- (57) K. Haule and G. Kotliar, New J. Phys. 11, 025021 (2009).
- (58) P. C. Dai, J. P. Hu, and E. Dagotto, Nat. Phys. 8, 709 (2012).
I Supplementary Material for:
Fast recovery of the stripe magnetic order by Mn/Fe
substitution in F-doped LaFeAsO superconductors
II I. Sample preparation and characterization.
In the present study we have presented data for two series of samples (say, #A and #B) among many series showing a very similar trend of Tc with Mn doping. The samples with the Mn concentration x = 0.5% and 0.75% belong to #A, and x=0.075% and 0.2% belong to #B. The x=0 sample displays an almost optimum value of Tc=27 K by SQUID magnetometry and muon spin rotation measurements, as reported in Ref.Hammerath2014s . Despite this fact, Fig. 4a shows that its high temperature NQR spectrum is characterized by a double peak structure, typically observed in the underdoped compounds lang2010s ; kobayashi2010s where charge-poor and charge-rich environments coexist at the nanoscale. Hence, following Ref. lang2010s , the NQR results show that the whole set of samples displays intrinsic electronic inhomogeneity, as pointed out for =0-0.2 in Ref.Hammerath2014s . The intensity of the 19F NMR signal measured at room temperature shows that the fluorine content is constant throughout all the samples within an accuracy of = 2%.
III II. Mössbauer measurements
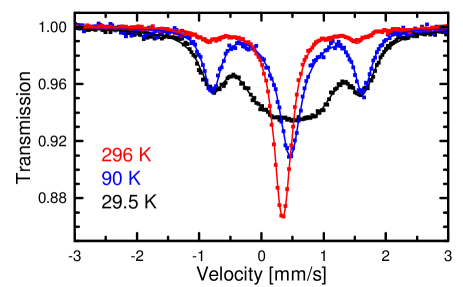
The Mössbauer measurements were performed in transmission geometry in the 2.3 K - 300 K temperature range using a CryoVac Konti IT cryostat on the LaFe1-xMnxAsO0.89F0.11 for x=0.5%. As the source, a 57Co in rhodium matrix was used. We used Ferrocen powder to measure the influence of the experiment on the line width. The data was analyzed using the transmission integral. Mössbauer data for representative temperatures above and below Tm are shown in Fig. 6. At all investigated temperatures a three peak structure is observed. The two outer peaks at - 0.80 and 1.65 mm/s correspond to the Ferrocen reference absorber while the inner peak is identified with the LaFe1-xMnxAsO0.89F0.11. At 296 K a non-resolved doublet structure is observed due to the interaction of the nucleus with an electric field gradient (EFG). In the principal-axis system, the EFG is fully determined by its z component and the asymmetry parameter . We obtained a center shift of 0.451(1) mm/s and a value of = 4.5 V/Å2. was found to be zero at all temperatures. The center shift increases upon cooling due to the temperature-dependent second-order Doppler effect to a value of 0.586(8) mm/s at 4.2 K. increases with decreasing temperature to a value of 8.6 V/Å2 at 82 K. At the magnetic phase transition increases to 12(2) V/Å2 and remains constant within error bars down to lowest temperatures. This change of the the electric field gradient probed by Fe around the magnetic transition reflects the structural T-O transition in agreement with the one probed by As in the NQR measurements discussed in the main text. Below a broad peak is observed which is identified with a non-resolved sextet structure due to a field distribution. This magnetic field distribution was modeled using a Gaussian distribution. The temperature dependence of the first moment is shown in Fig. 1c of the main part of the paper.
IV III. NQR and NMR Spectra
In order to carry out the NMR experiments the polycrystalline LaFe1-xMnxAsO0.89F0.11 samples were crushed to a fine powder to improve radio frequency penetration. Since 75As is a spin I = 3/2 nucleus, above Tm, the NQR spectrum is characterized by a single line at a frequency
| (1) |
with the electric quadrupole moment of the 75As nucleus, the main component of the electric field gradient (EFG) tensor at the As site generated by the surrounding charge distribution and its asymmetry. Since LaFeAsO is tetragonal and is the quantization axis. Thus, the broadening of the line is mainly due to the disorder present in the system since the EFG strongly depends on the local charge distribution. The two peak in the NQR spectra (Fig.4, main article) are due to an intrinsic electronic inhomogeneity (due to F doping) already present without Mn in superconducting samples where the whole volume is superconducting (see Ref. lang2010s, ).
Below Tm, in case of a stripe magnetic order, an internal field H is present at the As nuclei and we can perform standard NMR experiments with the only difference that the magnetic field is not provided by an external magnet but by the magnetic ordering of the Fe moments (see also the main part of the paper). Even if below Tm the unit cell is orthorhombic the asymmetry is still small () as reported in Ref. fu2012s .
75As NQR and ZF-NMR spectra were derived by recording the integral of the echo signal after a pulse sequence as a function of the irradiation frequency. All the ZF-NMR spectra were measured with exactly the same set-up and coil filling factor in order to compare the relative intensity of the lines. It must also be noted that the length of the pulses was optimized for the line and kept constant for the whole spectrum. However the resulting distortion in the spectrum amplitude is not sample dependent and does not modify the position of the lines.
The resulting spectra both for undoped LaFeAsO and for LaFe1-xMnxAsO0.89F0.11 samples are reported in Fig. 1a of the main part of the paper. Since, the stripe magnetic order is also present in LaFe1-xMnxAsO0.89F0.11 (see next section) we can derive the intensity of the hyperfine field at the As site from the frequency of the low-frequency line corresponding to the transition (see main part). The results are reported in Fig. 7.
The 75As NMR experiments were performed by a homemade NMR spectrometer and a home-assembled probehead placed in the variable-temperature insert of a field-sweeping cold-bore cryomagnet. The large capacitance span of the variable capacitor in the probehead (approx. 2-100 pF) provides a tuning range of more than two octaves. This allowed us to cover the entire spectral range of the 75As and 139La resonances at 8 T with a single coil. The usage of the same coil for all the resonances, along with a careful calibration of the frequency response of the spectrometer, ensures a reliable quantitative comparison of the amplitudes from different spectral features.
The spectra were recorded by tuning the probehead at discrete frequency steps by means of a software-controlled servomechanism featured by the spectrometer itself, and exciting a spin echo. The spin-echo sequence was a standard one, with equal rf pulses of duration and intensity suitably adjusted to optimize the signal. The delays was kept as short as possible with respect to the dead time of the resonant probehead (20-35s depending on the working frequency).
The fraction of nuclei participating in the majority and minority 75As signals, respectively, was estimated from the integral of the the normalized spectral amplitude (i.e. the amplitude divided by the frequency dependent sensitivity ). In the case of the minority signal, characterized by a hyperfine field estimated in the order of 8-10 T from the NMR spectra in lower external fields (not shown), a further correction factor is given by the rf enhancement originating from the hyperfine coupling between electronic and nuclear spins. Such a coupling, on one hand, amplifies the driving rf field at the nucleus, so that the resonance can be excited by a rf field reduced by ; on the other, it enhances the e.m.f. induced in the pick-up by the same factor. In a strong external field as in the present case, a factor of the order of (a formula strictly valid for a uniaxial ferromagnet, indeed), where is the effective field at the nucleus, is expected, riedi89 hence . A similar value of is obtained by comparing the excitation conditions for the two signals, as the minority signal was optimally excited with 6dB extra-attenuation. After correcting (i.e. dividing) the minority signal amplitude by , we obtained our estimate for the volume fraction of the minority estimate 75As nuclei in the order of 3% of total.
Figure 8 shows that the As spectrum of the magnetic ordered state in x=0.5% Mn doped LaFeAsO0.89F0.11, appearing also in Fig. 2 (main part), is extremely similar to that of the parent compound LaFeAsO, without F doping. This observation provides further evidence that the magnetic orders present in the two compounds is indeed the same.
V IV. Internal field calculations
In order to interpret the ZF-NMR results we performed simulations of the internal field at the As site for different types of long range magnetic order and for various Mn concentrations. Both the long range dipolar interaction and the short range transferred hyperfine interaction between the As nucleus and magnetic moments on the four nearest neighbor Fe ions (see Fig. 1) have been considered in the calculations. The internal field can be written as the sum of the contributions from each one of the Fe sites:
| (2) |
where is the ordered electron moment at the i-th Fe site and is the nuclear-electron coupling tensor between the As nucleus and i-th Fe site. We considered only the contributions due to the Fe sites in the same plane of the As nucleus since the contribution to the internal field from the other Fe-As layers is vanishingly small due to the scaling of the dipolar coupling. The diagonal components of the symmetric transferred hyperfine interaction tensor for the four nearest neighbor Fe sites (Fig. 10) was derived from Knight shift measurements while two of the three off diagonal components can be derived from the strength of the internal field in the stripe order configuration, as reported in Ref. kitagawa2008s, .
Since we are only interested in understanding which types of order give rise to spectra in qualitative agreement with the measured ones, we used the values of the transferred hyperfine tensor components reported in Ref. skitagawa2010s, and chose for the Fe magnetic moment and for the Mn magnetic moment. The third off-diagonal component of the transferred hyperfine coupling is relevant only in case of Neel order and was chosen equal to the stripe one. The distribution of the internal fields for each type of magnetic order was calculated by randomly substituting Mn (for %) on the Fe site in a 24 24 size mesh and repeating the calculation times. The spectra were then obtained by diagonalizing the Zeeman-Quadrupole Hamiltonian:
| (3) | ||||
for each value of the magnetic field and applying magnetic dipole selection rules. The results for orthomagnetic and stripe order are reported in Fig. 9. For the orthomagnetic order we found . This value is incompatible with the resonance frequency measured by 75 ZF-NMR for x=0.5 % and 0.75 % (main part Fig. 1a), which displays a sizable internal field with about 80 % of the value found for pure LaFeAsO. In case of Néel order the internal field is found to be H T. However in this magnetic structure the field is parallel to and the splitting between the NQR lines is expected to be half of the observed one. Another possible type of magnetic structure is the spin-charge order giovannetti2011s which should give rise to two inequivalent iron sites. But this is in contrast with the Mössbauer measurements which reveal only one iron site. Therefore, the only magnetic structure compatible with the observed experimental results is the (,0) or (0,) stripe ordering. In addition, one must notice that the linewidth induced by the magnetic disorder is three orders of magnitude smaller than the one measured. This prediction is in good agreement with the observation that no significant change is induced in the line width by increasing the Mn content from 0.5 % to 0.75%. Conversely as can be seen in the NQR spectra (see Ref. lang2010s ) fluorine doping has a strong effect on the line width. This implies that the line broadening of LaFe1-xMnxAsO0.89F0.11 (x=0.5 % and 0.75 %) with respect to LaFeAsO is mostly due to the disorder induced by F doping and possibly by the magnetic disorder related to the formation of (0,) and (,0) magnetic domains that get pinned by the Mn impurities (see Fig. 5 in the main part). Finally it must be noted that we cannot completely rule out the presence of an incommensurate magnetic order with magnetic wave vector very close to the stripe one. In fact the incommensurability leads to a broadening of the ZF-NMR line, which, in this case, would be impossible to observe since it can be much smaller than the line broadening due to fluorine doping.
VI V. Model
A proper modelling of LaFe1-xMnxAsO0.89F0.11 includes both a realistic (five-orbital) model of the kinetic energy
| (4) |
with tight-binding parameters determined in Ref. ikeda10s, , and inclusion of electronic interactions given by the multi-orbital Hubbard Hamiltonian
| (5) | ||||
Here are orbital indexes, denotes lattice sites, and is the spin. The interaction includes intraorbital (interorbital) repulsion (), the Hund’s coupling , and the pair hopping energy . We assume , , and choose . Superconductivity is included by a BCS-like term
| (6) |
with being the superconducting order parameter, and denoting the effective pairing strength between sites (orbitals) and (, , and ). In agreement with a general pairing state, we include next-nearest neighbor (NNN) intra-orbital pairing, . Magnetic disorder modeling the Mn moments is included by , where is magnetic moment in orbital at the disorder sites given by the set coupled to the spin density of the itinerant electrons.
After a mean-field decoupling of the interacting Hamiltonian we solve the Bogoliubov-de Gennes equations,
| (7) |
where
| (8) | ||||
The five-orbital BdG equations are solved on lattices with stable solutions found through iterations of the following self-consistency equations
| (9) | ||||
where denotes summation over all eigenstates and denotes the Fermi function. We stress that the solutions are fully unrestricted and allowed to vary on all lattice sites and orbitals. Finally the relative signs of the individual impurity spins are obtained by minimizing the total free energy of the system. We operate in the regime of interactions where the impurity-free system is paramagnetic ( eV). For the results in Fig. 5, we have used eV, eV, eV. A comprehensive description of the band structure and all details of the self-consistent solutions of the mean-field decoupled Hamiltonian in real-space can be found in Ref. gastiasoro2016s, and its associated Supp. Material.
Finally we would like to remark that the results clearly show that there is a critical concentration of Mn above which the system leaves the SC phase and is back to the stripe phase which also characterize the undoped LaFeAsO. The critical concentration inferred from the calculation is in good agreement with the experimental one. While the mean distance between Mn impurities is clearly an essential parameter it should be remarked that the recovery of magnetism is a collective and non-local effect so the number of Mn ions is a particular region of the system (e.g. magnetic domains) is not so important (see Fig. 5, main article). For small Mn concentrations no FM/AFM alternation is predicted and anyway such a property is usually not observed in disordered alloys.
References
- (1) F. Hammerath, P. Bonfá, S. Sanna, G. Prando, R. De Renzi, Y. Kobayashi, M. Sato, and P. Carretta, Phys. Rev. B 89, 134503 (2014).
- (2) G. Lang et al., Phys. Rev. Lett. 104, 097001 (2010).
- (3) Y. Kobayashi, E. Satomi, S. C. Lee, M. Sato, J. Phys. Soc. Japan 79, 093709 (2010).
- (4) M.Fu et al., Phys. Rev. Lett. 109, 247001 (2012).
- (5) P. C. Riedi, Hyperfine Interact. 49, 335 (1989)
- (6) S. Kitagawa, Y. Nakai, T. Iye, K. Ishida, Y. Kamihara, M. Hirano, H. Hosono, Phys. Rev. B, 81, 212502 (2010).
- (7) K. Kitagawa, N. Katayama, K. Ohgushi, M. Yoshida, M. Takigawa, J. Phys. Soc. Jpn. 77, 114709 (2008).
- (8) G. Giovannetti, C. Ortix, M. Marsman, M. Capone, J. van den Brink, and J. Lorenzana, Nat. Commun. 2, 398 (2011).
- (9) H. Ikeda, R. Arita, and J. Kunes, Phys. Rev. B 81, 054502 (2010).
- (10) M. N. Gastiasoro, F. Bernardini, B. M. Andersen, Phys. Rev. Lett. 117, 257002 (2016).