Realization of high- bichromatic photonic crystal cavities
defined by an effective Aubry-André-Harper potential
Abstract
We report on the design, fabrication and optical characterization of bichromatic photonic crystal cavities in thin silicon membranes, with resonances around m wavelength. The cavity designs are based on a recently proposed photonic crystal implementation of the Aubry-André-Harper bichromatic potential, which relies on the superposition of two one-dimensional lattices with non-integer ratio between the periodicity constants. In photonic crystal nanocavities, this confinement mechanism is such that optimized figures of merit can be straightforwardly achieved, in particular an ultra-high-Q factor and diffraction-limited mode volume. Several silicon membrane photonic crystal nanocavities with Q-factors in the 1 million range have been realized, as evidenced by resonant scattering. The generality of these designs and their easy implementation and scalability make these results particularly interesting for realizing highly performing photonic nanocavities on different materials platforms and operational wavelengths.
The increasing demand for enhanced optical sensitivity in integrated photonic devices has triggered great progress in the design and realization of photonic crystal (PC) nanocavities, where unprecedented figures of merit have been achieved, such as ultra-high quality factor () and diffraction-limited confinement volumes () in the telecom band Notomi2010 . In these nanostructured systems, light-matter interaction can be orders of magnitude larger than in the corresponding bulk medium, making it possible to reach the realm of cavity quantum electrodynamics Hennessy2007 ; Faraon2008 ; Reinhard2012 , with potential applications in prospective quantum photonic technologies OBrien2009 . With further improvement, nonlinear interactions at the single or few photons level can be expected not only for a strong resonant enhancement of the nonlinearity, i.e. in the presence of a single quantum emitter, but also exploiting the intrinsic higher order material response Gerace2009 ; Ferretti2012 ; Majumdar2013 . More generally, high PC cavities have potential applications in integrated nonlinear photonics Notomi2005 ; Combrie2008 , light emission Strauf2006 ; Nomura2010 ; Ellis2011 ; Shakoor2013 and sensing Kwon2008 ; Jagerska2010 .
The strategies for designing high- PC slab cavities have strongly benefited from inspirational analogies with condensed matter systems. Following the pioneering demonstration of high- point defect cavities in a silicon membrane Akahane2003 , remarkable values have been achieved by local modulation of a one-dimensional defect through a shallow trapping potential Song2005 ; Kuramochi2006 . More recently, a new paradigm in PC cavity engineering has been put forward by means of inverse-design approaches, such as global optimization via genetic algorithmsMinkov2014 ; Lai2014 .
Here we report on the design, realization, and optical measurements of high localized modes in silicon membrane PC cavities, with operational wavelength around m. These modes originate from the realization of an effective bichromatic potential in a line-defect PC waveguide, which relies on the superposition of two one-dimensional lattices with non-integer ratio between their lattice constants, quantified by the lattice mismatch parameter , as recently proposed in Ref. Alpeggiani2015, . This model was originally studied for the Schrödinger equation in the context of localization of massive particles in quasi-periodic lattices, and it is commonly known as the Aubry-André-Harper (AAH) model Harper1955 ; Aubry1980 . The AAH bichromatic potential is known to display a quantum phase transition from extended to localized states as a function of the parameter Modugno2009 ; Albert2010 . In particular, for approaching an irrational value, a clear transition between gaussian (also named extended in the literature) to exponentially localized states is predicted, which bears similarities with the Anderson localization in purely disordered systems. Such a transition was first realized in a cold atomic gas Roati2008 , and later in a photonic lattice of one-dimensional ridge waveguides Lahini2009 . In the present work, we show for a selected set of rational values that such an effective bichromatic potential can be realized in a PC scenario. Remarkably, since we are not in the exponential localization regime of the model, our effective AAH potential naturally leads to a gaussian envelope of the localized modes that is spread over a few lattice sites, which is crucial to achieve ultra-high- in PC cavities Akahane2003 ; Englund2005 . In fact, we have experimentally measured Q-factors exceeding 1 million in our bichromatic silicon membrane PC cavities, essentially limited by fabrication imperfections since the best theoretically predicted values exceed 1 billion. The theoretical mode volume for these localized modes is estimated in the order of from exact numerical simulations, pushing the values of these cavities among the highest demonstrated so far.
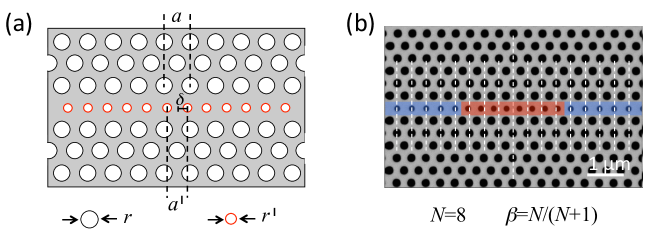
The effective bichromatic potential of AAH is realized in the present context by starting from a PC line-defect in a triangular lattice of air holes with lattice constant , the so called W1 waveguide Joannopoulos_book . Along the axis of this waveguide, a row of air holes with periodicity different from is introduced, as schematically represented in Fig. 1(a). The radius of these air holes is reduced with respect to the radius of the background photonic crystal lattice, which increases the fraction of high-index material. Moreover, the one-dimensional line of reduced air holes is shifted by with respect to the original triangular lattice, and a PC point-defect is thus formed.
As detailed in Ref. Alpeggiani2015, , the steady state Maxwell equation for the magnetic field in the PC structure,
| (1) |
can be approximately recast in a linear eigenvalue problem by expanding the field on a basis of localized states on each site, , where is an integer labelling the high-index interstitial site along the line-defect with periodicity, i.e. corresponding to the positions with . With this site labelling, corresponds to the center of the point-defect that will constitute the bichromatic cavity. For this one-dimensional quasi-periodic lattice, Eq. 1 can be approximately expressed as
| (2) |
where is the on-site frequency of the unperturbed lattice, is the tunnel coupling arising from the overlap of basis functions localized in neighboring interstitial sites (to be meant in a sort of tight-binding approximation, as in Ref. Modugno2009, ), and is the on-site amplitude of the modulation potential. The latter can be approximately recovered graphically, i.e. by comparing the dispersion vs. for two W1 waveguides filled by a row of air holes with reduced radius , either placed in the original positions of the underlying triangular lattice or shifted by with respect to it Alpeggiani2015 . With this identification of parameters, Eq. 2 exactly corresponds to the AAH model Modugno2009 ; Albert2010 ; Roati2008 ; Lahini2009 , for which a quantum phase transition from gaussian to exponential localization regimes is predicted on varying , and depending on the degree of commensurability of footnote . The phase transitions exactly occurs at the critical ratio for irrational , and at larger for most rational values of AnnMath1999 , such as the ones considered in the rest of this work.
For the realization of the bichromatic PC cavities, we have chosen to avoid the formation of replicas in the one-dimensional AAH potential. This is achieved by modifying the periodicity of an even number () of defect holes within the one-dimensional waveguide channel, which allows to keep the cavity symmetric with respect to the center of the defect. The modified lattice constant for the holes is chosen to be , such that the lattice points located at positions simulateneously belong to both lattices, ensuring a smooth transition between the cavity defect and the one-dimensional waveguide. The cavity is thus formed by (even number) defect holes of reduced radius spaced by , and then continued by holes with radius at positions along the W1 waveguide channel (for every integer ). As an example, a scanning electron microscope (SEM) top-view image of an implemented cavity with is shown in Fig. 1(b). The lattice constant of the device shown is nm, and the defect lattice is given by the periodicity nm, while nm, and nm. We have realized several devices on the same chip, with ranging from to (only even values), corresponding to an effective AAH model realized for a selected set of (rational) lattice mismatch values, , ranging from to .
The fabrication of the bichromatic PC cavities was performed on standard silicon-on-insulator (SOI) wafers commercially available from SOITEC, with a 220 nm-thick Si core layer and 2 m of SiO2 buried oxide. Photonic patterns are defined on exposure fields by electron-beam lithography using an AR-P679.04 PMMA resist and an AR 600-56 developer, both obtained from “Allresist”. The pattern was transferred into the Si layer using a SF6/O2 based cryo-process in a Oxford P100 inductive coupled plasma reactive ion etcher. Subsequently, the buried SiO2 layer was removed by immersing the sample for 2 minutes into a 40% HF solution, resulting in suspended PC membranes. During the HF etch, the membrane top surface was protected by the PMMA resist mask to prevent roughening of the Si surface. Finally, the PMMA mask was removed in a O2 plasma etcher and the sample was rinsed in acetone and methanol prior to a final 10-second dip in a 2% HF solution. In the following, we will concentrate on the results obtained for the set of devices with lattice constant nm, and nominal nm, nm. Based on our SEM data, we estimate and to agree within with the nominal parameters.
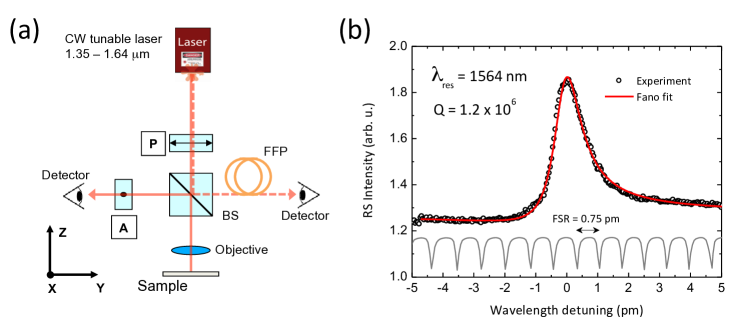
The fabricated bichromatic PC cavities were experimentally tested by a cross-polarized resonant scattering technique Galli2009 . This technique is particularly suited for measuring PC cavities with ultra-high -factors, since it does not rely on evanescent coupling (such as, e.g., through an integrated photonic crystal waveguide or an external fiber taper) Meccuccio2005 , thus avoiding any loading effect that may reduce the intrinsic value of the measured . A scheme of the optical setup is illustrated in Fig. 2(a). Here, the linearly polarized light from a tunable laser with a MHz linewidth is used to resonantly excite the PC cavity mode from the top through a NA=0.8 microscope objective. The back-scattered light from the cavity is then collected by the same objective and sent to the analyzer. A careful calibration of the laser detuning wavelength is of utmost importance to achieve an accurate estimation of the ultra-high , which was obtained by the simultaneous measurement of a reference spectrum from a 2 meters long fiber-Fabry-Pérot (FFP) interferometer with a 0.75 pm free spectral range. In Fig. 2(b) we also show a typical spectral response detected from one of our highest bichromatic cavities, displaying a remarkable experimental at the resonant wavelength m.
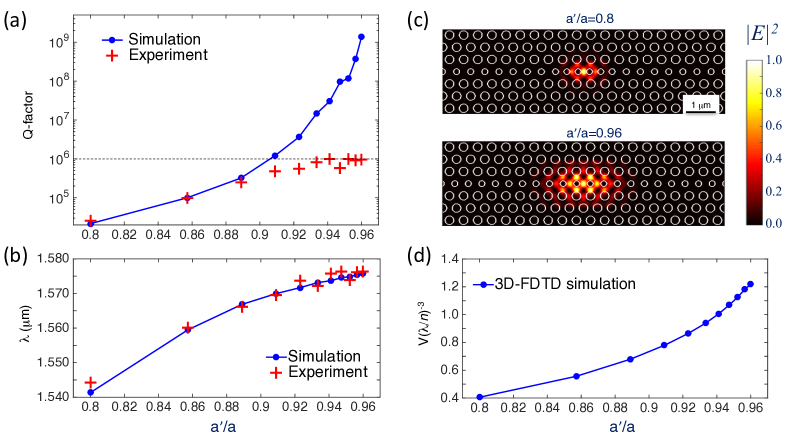
The experimental Q-factors and cavity mode wavelengths are extracted from the resonant scattering spectra and shown in Fig. 3(a-b) for a series of bichromatic PC cavities as a function of . The experimental data are compared to full three-dimensional finite difference time domain (3D-FDTD) simulations lumerical of the measured devices, where all the nominal fabrication parameters have been assumed, and is taken as the dispersionless refractive index of silicon in the wavelength range of interest. Very good agreement is found up to (i.e., ), both in terms of Q-factor and resonant wavelength. Then, while the measured wavelengths are very well matched by numerical simulations, Q-factors start to deviate and roughly saturate to values on the order of . The theoretical values increase up to values well exceeding at (), as already reported Alpeggiani2015 . The extremely large -values can be understood by fitting the AAH model parameters suitable for the present devices, which we have determined as and , respectively. Hence, the value automatically yields a gaussian localization regime for , the critical value for the transition to exponential localization of the field being at least Modugno2009 ; Aubry1980 ; Albert2010 ; AnnMath1999 . As it is accepted in the PC cavity literature, a perfectly gaussian envelope is a favorable condition to achieve ultra-high Q-factors in PC slab cavities Akahane2003 ; Englund2005 . In the bichromatic PC cavity designs such ultra-high condition is met quite straightforwardly, depending on a single design parameter (), and without the need for extensive numerical simulations. Regarding the deviation of the measured Q-factors from the theoretical ones that appears for , this is mainly attributed to the role of fabrication imperfections: the experimental values can be expressed as , where is the Q-factor determined by extrinsic losses introduced in the fabrication process, such as disorder and roughness of the lower PC membrane surface exposed to the 40% HF etch during SiO2 removal as well as material absorption Gerace2005 ; Portalupi2011 . In the present samples, it can be inferred that the limiting Q-factor induced by extrinsic losses is on the order of , which makes saturate at such values even when is orders of magnitude larger. A detailed study on the role of disorder in these bichromatic PC cavities would certainly be interesting but it is beyond the scope of the present manuscript.
The mode volume of PC cavities can be directly calculated from the steady state electric field profile of the localized modes simulated by 3D-FDTD. As examples, we explicitly show in Fig. 3(c) the mode profiles for the smallest (, or ) and the largest (, or ) bichromatic cavity considered in this work, respectively. Clearly, the spatial extension of the mode increases with . To give a quantitative estimate, we calculate the mode volume according to the usual cavity quantum electrodynamics definition
| (3) |
which is relevant for a single dipole emitter located at the electric field intensity maximum (i.e., in the cavity center in this case) Notomi2010 . The mode volumes calculated for the whole series of experimentally characterized cavities presented in Figs. 3(a-b) are shown in Fig. 3(d), normalized to the corresponding , where is the resonant wavelength of each bichromatic PC cavity and is the Si refractive index assumed in the simulations. As it can be seen, the mode volume remains of the order of the diffraction limit, , even for the largest bichromatic PC cavities. In particular, for the cavity the theoretical ratio is among the largest reported for 2D PC slab cavities and can be even larger Alpeggiani2015 , competing in particular with the highest design of an index-modulated cavity in a PC waveguide Notomi2008 . If we relate the theoretical mode volumes to the measured Q-factors saturating at due to surface roughening and disorder-induced losses, we see that the best compromise is obtained for the devices corresponding to () and (), which display a remarkable , i.e. among the largest ever reported for PC slab cavities Lai2014 .
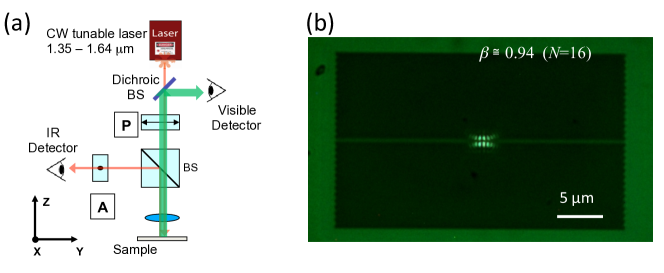
Finally, we report in Fig. 4 the results of a nonlinear optical experiment performed on a slightly modified setup, schematically illustrated in Fig. 4(a), which allows to record the higher-order harmonic emission from the sample. The selected PC cavity device is resonantly excited with a continuous wave laser at the localized mode wavelength, and nonlinear light emission is collected and imaged with a detector in the visible range (in this case, a commercially available Nikon camera). As an example, we show in Fig. 4(b) the green light emission from a () cavity, excited at a resonant wavelength of nm, and thus emitting in the third harmonic at nm, which gives the green signal. We notice that the third harmonic is generated by the bulk susceptibility of silicon, which is strongly enhanced by the confinement of the cavity mode in a effective volume, and it thus allows to detect the nonlinear signal even under cw excitation, as already shown previously Galli2010 . To the purposes of the present work, this image gives a direct evidence of the gaussian localization of the resonant modes in the bichromatic PC cavities.
In summary, we have shown the first realization of a novel type of photonic crystal slab cavities, based on the analogy with the Aubry-André-Harper model in condensed matter physics. The gaussian confined modes arise from the lattice mismatch between a linear photonic crystal waveguide and a defect row of reduced radius holes inserted within the waveguide channel. The experimentally measured -factor values are among the largest reported for photonic crystal slab cavities, only limited to values in the 1 million range by fabrication imperfections. The corresponding theoretical Q-factors can easily exceed 1 billion, thus potentially making these cavities the ones with the largest ratio ever designed. Since they do not require any sophisticated design strategy or time-consuming numerical simulations, but the tuning of a single parameter like the lattice mismatch, these devices are particularly promising for a fast realization of highly performing photonic crystal cavities for a number of applications in integrated photonics, nonlinear optics, light emission, and sensing.
References
- (1) M. Notomi, Rep. Prog. Phys. 73, 096501 (2010).
- (2) K. Hennessy, A. Badolato, M. Winger, D. Gerace, M. Atatüre, S. Gulde, S. Fält, E. Hu, and A. Imamoǧlu, Nature (London) 445, 896 (2007).
- (3) A. Faraon, I. Fushman, D. Englund, N. Stoltz, P. Petroff, and J. Vučković, Nat. Physics 4, 859 (2008).
- (4) A. Reinhard, T. Volz, M. Winger, A. Badolato, K. J. Hennessy, E. L. Hu, and A. Imamoǧlu, Nature Photonics 6, 93 (2012).
- (5) J. L. O’Brien, A. Furusawa, and J. Vučković, Nat. Photonics 3, 687 (2009).
- (6) D. Gerace, H. E. Türeci, A. Imamoǧlu, V. Giovannetti, and R. Fazio, Nat. Physics 5, 281 (2009).
- (7) S. Ferretti and D. Gerace, Phys. Rev. B 85, 033303 (2012).
- (8) A. Majumdar and D. Gerace, Phys. Rev. B 87 235319 (2013).
- (9) M. Notomi, A. Shinya, S. Mitsugi, G. Kira, E. Kuramochi, and T. Tanabe, Opt. Express 13, 2678 (2005).
- (10) S. Combrié, A. De Rossi, Q. V. Tran, and H. Benisty, Opt. Lett. 33, 1908 (2008).
- (11) S. Strauf, K. Hennessy, M. T. Rakher, Y.-S. Choi, A. Badolato, L. C. Andreani, E. L. Hu, P. M. Petroff, and D. Bouwmeester, Phys. Rev. Lett. 96, 127404 (2006).
- (12) M. Nomura, N. Kumagai, S. Iwamoto, Y. Ota, and Y. Arakawa, Nat. Physics 6, 1518 (2010).
- (13) B. Ellis, M. A. Mayer, G. Shambat, T. Sarmiento, J. Harris, E. E. Haller, and J. Vučković, Nat. Photonics 5, 297 (2011).
- (14) A. Shakoor, R. Lo Savio, P. Cardile, S. L. Portalupi, D. Gerace, K. Welna, S. Boninelli, G. Franzò, F. Priolo, T. F. Krauss, M. Galli, and L. O’Faolain, Laser Phot. Rev. 7, 114 (2013).
- (15) S.-H. Kwon, T. Sünner, M. Kamp, and A. Forchel, Opt. Express 16, 11709 (2008).
- (16) J. Jágerská, H. Zhang, Z. Diao, N. Le Thomas, and R. Houdré, Opt. Lett. 35, 2523 (2010).
- (17) Y. Akahane, T. Asano, B.-S. Song, and S. Noda, Nature (London) 425, 944 (2003).
- (18) B.-S. Song, S. Noda, T. Asano, and Y. Akahane, Nat. Materials 4, 207 (2005).
- (19) E. Kuramochi, M. Notomi, S. Mitsugi, A. Shinya, T. Tanabe, and T. Watanabe, Appl. Phys. Lett. 88, 041112 (2006).
- (20) M. Minkov and V. Savona, Sci. Rep. 4, 5124 (2014).
- (21) Y. Lai, S. Pirotta, G. Urbinati, D. Gerace, M. Minkov, V. Savona, A. Badolato, and M. Galli, Appl. Phys. Lett. 104, 241101 (2014).
- (22) F. Alpeggiani, L. C. Andreani, and D. Gerace, Appl. Phys. Lett. 107, 261110 (2015).
- (23) P. G. Harper, Proc. Phys. Soc. A 68, 874 (1955).
- (24) S. Aubry and G. André, Ann. Isr. Phys. Soc. 3, 133 (1980).
- (25) M. Modugno, New J. Phys. 11, 033023 (2009).
- (26) M. Albert and P. Leboeuf, Phys. Rev. A 81, 013614 (2010).
- (27) G. Roati, C. D’Errico, L. Fallani, M. Fattori, C. Fort, M. Zaccanti, G. Modugno, M. Modugno, and M. Inguscio, Nature (London) 453, 895 (2008).
- (28) Y. Lahini, R. Pugatch, F. Pozzi, M. Sorel, R. Morandotti, N. Davidson, and Y. Silberberg, Phys. Rev. Lett. 103, 013901 (2009).
- (29) D. Englund, I. Fushman, and J. Vuçković, Opt. Express 13, 5961 (2005).
- (30) J. D. Joannopoulos, S. G. Johnson, J. N. Winn, and R. D. Meade, Photonic Crystals: Molding the flow of light (Kluwer Academic, Boston, 2008).
- (31) In comparing the photonic AAH model to the original one, notice that the solutions of the eigenvalue equation derived from Eq. 1 are frequencies squared, and not the eigenenergies. Hence, in Eq. 2 also and have dimensions of .
- (32) S. Y. Jitomirskaya, Ann. Math. 150, 1159 (1999).
- (33) M. Galli, S. L. Portalupi, M. Belotti, L.C. Andreani, L. O’Faolain, and T. F. Krauss, Appl. Phys. Lett. 94, 071101 (2009).
- (34) M. McCutcheon, G. W. Rieger, I. W. Cheung, J. F. Young, D. Dalacu, S. Frédéric, P. J. Poole, G. C. Aers, and R. Williams, Appl. Phys. Lett. 87, 221110 (2009).
- (35) We employed a commercial software from Lumerical Solutions, http://www.lumerical.com/tcad-products/fdtd/. For the simulations shown in the present work, Q-factors are determined to within a percent error; for , the reported values might be a lower bound, limited by finite size effects and discretization errors introduced by the FDTD simulation.
- (36) D. Gerace and L. C. Andreani, Photon. Nanostruct. Fundam. Appl. 3, 120 (2005).
- (37) S. L. Portalupi, M. Galli, M. Belotti, L. C. Andreani, T. F. Krauss, and L. O’Faolain, Phys. Rev. B 84, 045423 (2011).
- (38) M. Notomi and H. Taniyama Opt. Express 16, 18657 (2008).
- (39) M. Galli, D. Gerace, K. Welna, T. F. Krauss, L. O’Faolain, G. Guizzetti, and L.C. Andreani, Opt. Express 18, 26613 (2010).