The ultraluminous X-ray source HoII X-1: kinematic evidence of its escape from the cluster.
Abstract
We analyse the structure and kinematics of ionized gas in the vicinity of the ultraluminous X-ray source (ULX) HoII X-1 in the Holmberg II galaxy using observational data obtained with a scanning Fabry–Perot interferometer in the H, [S ii] and [O iii] emission lines at the Russian 6-m telescope. Decomposition of the line profiles allows us to identify the broad component of emission lines caused by the ULX action. We found evidence of an expanding superbubble around the young star cluster located in the studied region. We conclude that the blue-shifted ‘arc’ around the ULX observed in the line-of-sight velocity field may correspond to a bow shock caused by the ULX movement from that nearby young star cluster. If this interpretation is correct, it will be the first kinematic evidence of ULX’s escape from their parent star clusters.
keywords:
galaxies: individual: Holmberg II – X-rays: individual: HoII X-1 – galaxies: stellar content – ISM: kinematics and dynamics1 Introduction
Ultraluminous X-ray sources (ULXs) are unique off-nucleus point-like objects, which luminosities () exceed the Eddington limit. Their nature is under debates over twenty years. These objects are often considered as the intermediate mass black hole (IMBH) candidates (e.g., Colbert & Mushotzky, 1999; Miller et al., 2003), while the recent studies support an idea of the supercritical accretion discs around the stellar mass black holes as the source of anisotropic X-ray radiation of ULXs (e.g., Begelman, 2002; Fabrika et al., 2015; Roberts et al., 2016).
Studies of extragalactic ULXs revealed their association with young star clusters (Zezas et al., 2002; Abolmasov et al., 2007; Swartz, Tennat & Soria, 2009). Poutanen et al. (2013) showed that all bright X-ray sources (including 6 ULXs) in Antennae galaxies are significantly associated with young clusters, but they are located outside these clusters. Together with similar findings by Kaaret et al. (2004b) for X-ray binaries of lower luminosities, this result allows one to assume that the offset from star clusters is a common property of both ULXs and less bright X-ray binaries. Poutanen et al. concluded that large displacements (up to 300 pc) are most probably caused by their fast () ejection from clusters due to close encounters (e.g., Mapelli et al., 2011; Goswami, Kiel & Rasio, 2014). Despite the fact that observations reveal displacement of ULXs, no direct evidence of their motion outward from star clusters has been found so far.
Only small part of known ULXs reveal surrounding optical nebulae (Pakull & Mirioni, 2002). Among such objects, HoII X-1 in the Holmberg II galaxy – one of the most luminous ULXs known ( according to Berghea et al. 2010a). It is located in the eastern part of the H ii region HSK 70 (according to the catalogue by Hodge, Strobel & Kennicutt 1994), also known as ‘foot nebula’ owing to its geometry (see Fig. 1). The shape of the ‘foot nebula’ is most probably caused by the influence of the young star cluster (its age is Myr, according to Stewart et al. 2000) located to the west from the ULX.
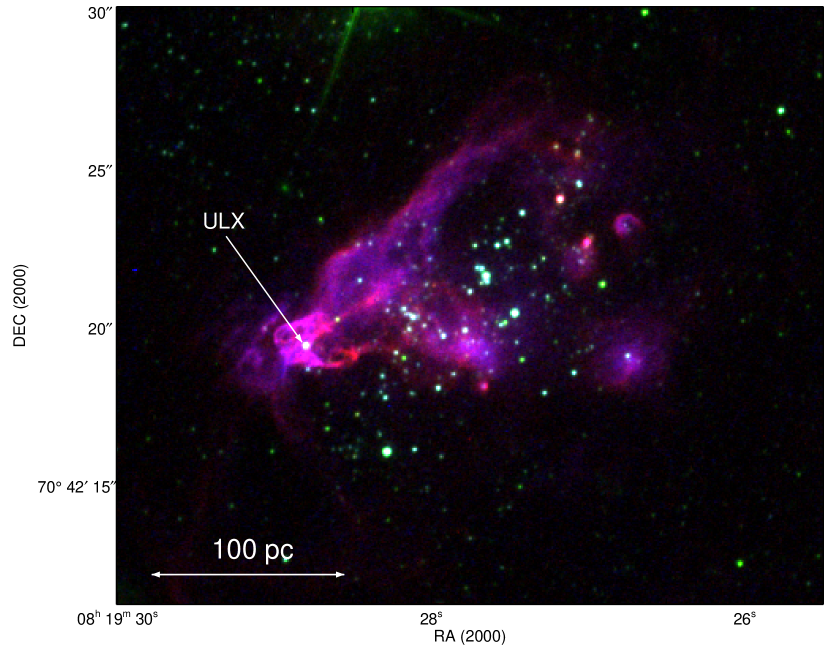
A nebula with a size of about pc bright in the He ii 4686 Å emission line surrounds the ULX HoII X-1 in the small eastern part (‘heel’) of the ‘foot nebula’ (Pakull & Mirioni, 2002; Kaaret, Ward & Zezas, 2004a; Lehmann et al., 2005). Moon et al. (2011) revealed that the He ii nebula is more extended and have a size of pc. Our long-slit observations presented in Egorov, Lozinskaya & Moiseev (2013) also revealed the He ii emission at such distance from the ULX. These studies support the photoionization mechanism of the He ii line excitation by reprocessing of HoII X-1 X-ray emission.
Lehmann et al. (2005) performed the integral-field unit (IFU) spectral observations of the nebula and investigated ionization conditions and gas kinematics in the ‘heel’ of the ‘foot nebula’. They found that the velocity dispersion in the H emission line is two times higher at the position of ULX as compared to the HSK 70 nebula as well as significant radial velocity variations inside the He ii region. The authors explained complex gas kinematics by the influence of the ULX which dynamically perturbs the surrounding ISM via jets or the accretion disc wind.
The extended synchrotron radio source surrounds the ULX (Miller, Mushotzky & Neff, 2005) and coincides with the He ii emission line nebula in the ‘heel’ (Cseh et al., 2012). Cseh et al. (2014, 2015) discovered a collimated jet structure responsible for the inflation of the surrounding radio bubble. Their results suggest that Ho II X-1 is powered by a black hole of a mass in the range of accreting at a high Eddington rate with intermittent radio activity.
Berghea et al. (2010a, b) have detected the [O iv] 25.89 emission in the ‘heel’ and concluded that the photoionization by the soft X-ray and far ultraviolet (FUV) radiation from the ULX is responsible for the [O iv] emission, while the shocks likely contribute very little. Heida et al. (2014) discovered the near-infrared (NIR) counterpart; its NIR luminosity far exceeds the expected jet contribution. The authors related the NIR excess to a red supergiant companion or to the nebula surrounding the ULX.
The data mentioned above suggest the influence of both the ULX and nearby young star cluster on the surrounding ISM. The accurate separation of the ULX contribution from the totality of processes regulating the morphology and dynamics of the ‘foot nebula’ is necessary.
In our recent paper (Egorov et al., 2017, hereafter Paper I) we report the results of ionized gas structure and kinematics investigations of the star formation complexes in Holmberg II galaxy. In this paper, we present the detailed study of the ULX vicinity using the data described in Paper I and some additional data sets.
2 Observations and data reduction
| Data set | Date of obs | , s | , ′′ | , Å | , Å |
|---|---|---|---|---|---|
| H #1 | 26/27 Apr 11 | 1.4 | 8.7 | 0.48 | |
| H #2 | 16/17 Dec 14 | 1.4 | 8.7 | 0.48 | |
| [S ii] | 30/31 Oct 11 | 1.1 | 9.2 | 0.48 | |
| [O iii] | 27/28 Feb 09 | 1.5 | 7.6 | 0.81 |
Observations were made at the prime focus of the 6-m telescope of SAO RAS using a scanning Fabry–Perot interferometer (FPI) IFP751 mounted inside the SCORPIO-2 multi-mode focal reducer (Afanasiev & Moiseev, 2011). A detailed description of the observations performed and data reduction are presented in our Paper I. All the data cubes have a field of view of arcmin, where each pixel of 0.71 arcsec in size contains a 36- or 40-channel spectrum of a small region around the desired emission line. Table 1 summarizes the properties of the observed data: name of data set, date of observations, exposure time, final spatial resolution (), spectral range (), and spectral resolution ( – FWHM of the instrumental profile).
In addition to the mosaic of two observed data cubes in the H line used in Paper I, we also analyse the data cubes in the [S ii] 6717 Å and [O iii] 5007 Å emission lines reduced in the same way as the H data cube. The [S ii] data cube was obtained with the same SCORPIO-2 device, while [O iii] observations taken from the SAO RAS archive were performed for a program by P. Abolmasov with the focal reducer SCORPIO (Afanasiev & Moiseev, 2005) and FPI having twice lower spectral resolution (see Table 1). The original [O iii] data set was completed only by 75 per cent on 36 scanning channels because of bad weather conditions. Fortunately, our new wavelength calibration algorithms (Moiseev, 2015) allows us to restore emission-line spectra in the region around the HSK 70 nebulae.
Before analysing, we have subtracted a circular rotation model for Holmberg II from the data cubes (the procedure is described in Paper I). It allowed us to analyse the local ionized gas motions, not related to the regular rotation of the galaxy disc. Due to that, the velocity scale in all Figures is shown to be relative to the mean velocity.
Because of the lower signal-to-noise ratio for the [S ii] and [O iii] data cubes in comparison with the H one, we used them only for additional control of the results obtained from the H line. We fitted the line profiles in each pixel of the reduced data cubes with one- or two-component Voigt function (a convolution of the Lorentzian and Gaussian functions corresponding to the FPI instrumental profile and to the broadening of the observed emission lines, respectively) to get information about ionized gas kinematics in the regions (the procedure is described in Moiseev & Egorov 2008).
3 Results and Discussion
3.1 Ionized gas kinematics of the ‘foot nebula’
As we noted above, Lehmann et al. (2005) performed the IFU observations of the nebula around HoII X-1 and revealed a complexity of the ‘foot nebula’ kinematics. While their observations provide much larger spectral range, our data has 3–15 times better spectral resolution and slightly better spatial resolution and sampling. It allows us to decompose a line profile in the regions, where it shows asymmetry or significant broadening.
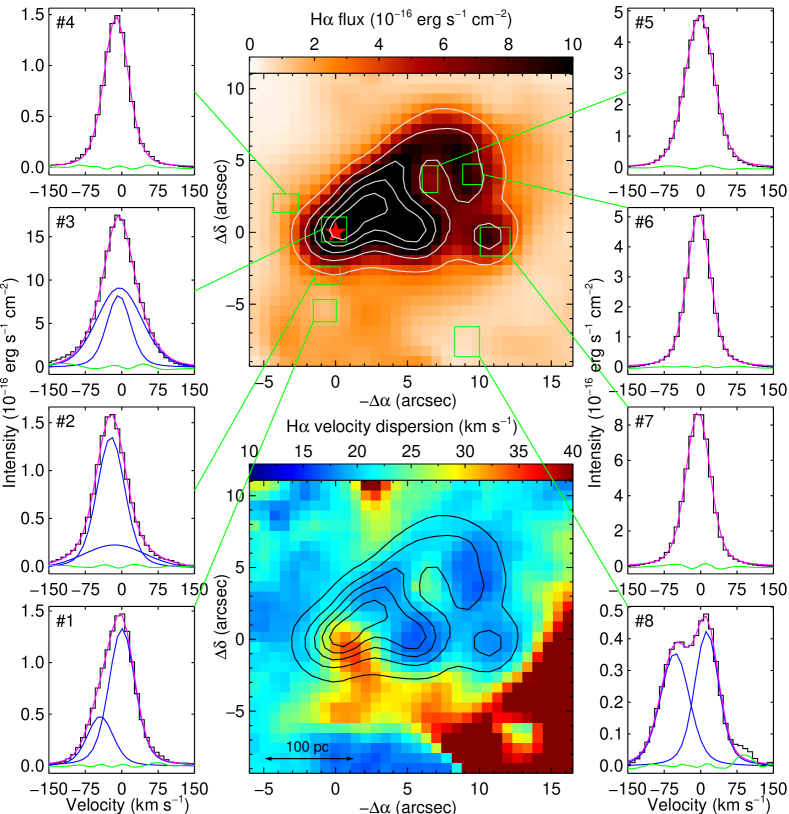
Figure 2 shows several examples of the H line profile which correspond to different parts of the ‘foot nebula’ and the results of their decomposition. The top image in this Figure corresponds to the H intensity distribution in the nebula according to our FPI data, the bottom image shows the line-of-sight velocity dispersion () map, free from instrumental broadening.
The H line profile could be fitted by a single narrow component () in the most part of HSK 70 nebula. Our data show two regions with peaks of velocity dispersion consistent with Lehmann et al. (2005). One of them corresponds to the ULX vicinity, while another one is located in the north-western part of the nebula.
The line-of-sight velocity dispersion is two times larger near the ULX, that agrees with the estimates by Lehmann et al. Broadening of the line profiles probably caused by the contribution of the broad component from the ULX to the observed line-of-sight spectrum. Indeed, the H line profiles there could be fitted by narrow and broad () components (profiles #2, 3 in Fig. 2).
The region of significant contribution of the broad component to the emission line profile surrounds the ULX. It coincides with the northern part of the area of elevated velocity dispersion around the ULX (in the bright part of the HSK 70 nebula), while two resolved narrow components are presented in the southern part of this area (see profiles #1, 8). The H line profile broadening there, as well as its clear separation in two components, is caused by the interaction of HSK 70 with the ionized supershell south-westward of it, which origin is not related to the ‘foot nebula’ (see Paper I).
The H line profiles of the second region of the increased velocity dispersion inside the HSK 70 nebula (profile #5 in Fig. 2) might be represented by a single component with up to 24 . The H image reveals a shell-like structure in this area. Its comparison with the stars location in Fig. 1 allows us to conclude that there we observe an expanding shell around a young star cluster, but our resolution is insufficient to clearly separate the individual components corresponding to its approaching and receding sides.
Therefore, the ‘foot nebula’ is located at the north-eastern edge of the kinematicaly active star formation complex and is regulated by the influence of the young star cluster (which blew up the ionized superbubble around it) and of the ULX. The presence of the broad component in emission line profiles points to the significant influence of the ULX to the surrounding ISM.
3.2 Bow-shock around the ULX?
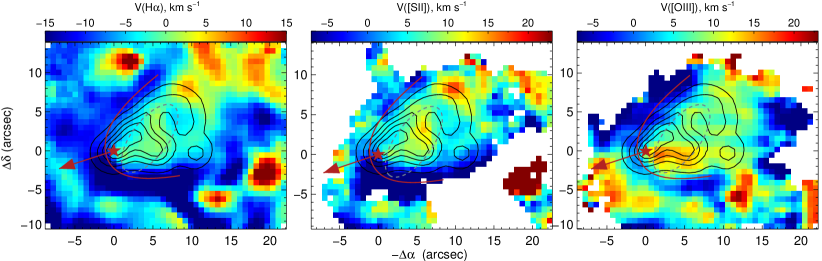
We found an intriguing structure in the ionized gas line-of-sight velocity distribution constructed by the pixel-by-pixel fitting of the data cubes with single-component Voigt function. Figure 3 shows velocity fields for the HSK 70 nebula and its surrounding in the H, [S ii], and [O iii] emission lines. These maps reveal blue-shifted ‘arc’ surrounding the ‘foot nebula’ from the east of the ULX. This ‘arc’ is better seen in the H but is also detected in both [S ii] and [O iii] lines. Its line-of-sight velocities are shifted by -10 – -15 from the mean velocity in the nebula. Here we are trying to explain this observed feature.
The ‘arc’ is located at the edge of the bright HSK 70 nebula and corresponds to faint emission of the ionized gas. Its mean brightness in H line is about ( and in the faint north-east and bright east parts respectively). For comparison, the mean brightness of the HSK 70 nebula is . Due to this fact, one may suggest that we observe some sort of the edge effects at the border of the bright H ii region and background or foreground diffuse emission. However, in this case it is straightforward to expect such features at the borders of other bright nebulae in the galaxy, but only HSK 70 reveals it. Moreover, the reasonable question arises – why is this feature not homogeneous or randomly distributed but has a shape that clearly matches the shape of the nebula? Even if the ‘arc’ is indeed a diffuse emission, it most probably should be regulated by something tied with the ‘foot nebula’, and the most obvious source is the ULX.
Note that the ‘blue filament’ at connected to the ‘arc’ (see H velocity field in Fig. 3) has a different origin. Contrary to what observed in the ‘arc’, the H line profile there is clearly decomposed by two components (see profile #8 in Fig. 2 as an example), that is the reason why this structure is blue-shifted in the velocity fields constructed by a fitting with a single Voigt component. The complex kinematics of the ionized gas in this region located to the south of the ULX is discussed in our Paper I.
Both the ‘arc’ shape, as well as the ‘heel’ shape of the ‘foot nebula’ look like a bow shock. We propose that it may be indeed a bow shock caused by the ULX motion. Let us check now, whether the ULX escaping from the nearby young star cluster might create such a large bow shock having the shape of the observed ‘arc’.
According to the analytical solution for the shape of a stellar wind bow shock in the thin-shell limit as derived in Wilkin (1996):
| (1) |
where is the distance from the source at which a bow shock front is observed in direction of an azimuthal angle . The stand-off radius can be expressed as (Baranov et al., 1971):
| (2) |
where is the wind mass-loss rate; is the terminal wind velocity; is the velocity of the ULX; and is the ambient gas density. According to Paper I, the ambient volume density in the area is ; that corresponds to , if helium contribution in total gas mass is taken into account.
We estimate the velocity of HoII X-1 from the following considerations. The borders of the young cluster associated with the HSK 70 nebula are shown in Fig. 3. Most probably the ULX was ejected from that cluster. Stewart et al. (2000) have found the age of this cluster is Myr. For the estimation, we assume that the ULX started to move from the cluster’s centre in direction of its current position Myr ago. In that case, the length of HoII X-1 path in galactic plane is pc (for accepted disc inclination according to Oh et al., 2011) that gives . This value agrees with the typical velocities of ULXs in the Antennae galaxy () according to Poutanen et al. (2013).
Unfortunately, there are no HoII X-1 wind parameters known, but we still may estimate using the following suggestions. Fabrika et al. (2015) showed that the nature of the well known Galactic X-ray source SS 433 is most probably the same as of the extragalactic ULXs. Hence, in our analysis we may use the values of (Begelman, King & Pringle, 2006) and (Fabrika, 2004) adopted for SS 433. On the other hand, Pinto et al. (2016) discovered the very high outflow velocities from two ULXs. Due to the fact that the supersonic wind power of ULXs is often comparable to their X-ray luminosity, for HoII X-1. Both estimates give almost the same value of .
Using parameters estimated above, we found pc from Equation (2) and the bow shock shape in galactic plane computed from Equation (1). Red curves in Fig. 3 correspond to the shape of a bow shock after projection to the sky plane using the parameters of Holmberg II galactic disc orientation from Oh et al. (2011). These curves well coincide with the ‘arcs’ of negative line-of-sight velocities in all three emission lines. Note that variations of galaxy inclination and ULX velocity would change these curves insignificantly. Therefore, we suppose that the observed features in the velocity field indeed could be treated as a sign of a bow shock from the moving ULX HoII X-1.
The presented results suppose that HoII X-1 was ejected from the cluster in the galactic plane, or at least with the small angle to that. We performed several calculations proposing the larger angle and found that our adopted parameters give the best agreement with the observations.
The shape of the observed ‘arc’ is consistent with the calculated model of bow shock from the moving ULX. But it is still desirable to find some another pointing on the bow shock origin of the ‘arc’. Unfortunately, relatively low spatial resolution and strong contamination by the bright H ii region makes the comparison with the existent models (e.g., Meyer et al., 2016) of the emission from bow shocks unreliable. Optical spectroscopy might provide an additional clue, but as it follows from Fig. 3, we deal with the slow shocks, whose contribution to the emission is negligible – according to the Allen et al. (2008), the significant influence of the shocks to the spectrum starts from the velocities of about . But we still may observe the local high velocity filaments in the bow shock having the elevated ratio of the sensitive to the collisional excitation lines. We indeed see the increase of the I([S ii])/I(H) ratio at the positions of the ‘arc’ in the spectra published in Egorov et al. (2013) (and much better in the archival spectra of HoII X-1 obtained by Fabrika et al. 2015 at the SUBARU telescope), yet its values are still too low to be interpreted as sign of a shock excitation. It may be explained by such high velocity filaments, or by the lower ionization state at the border of H ii region. In the first case it might be revealed, for example, by the high-resolution narrow band imaging with HST. Unfortunately, Holmberg II has never been observed by HST in the [S ii] emission line.
Summing up, the ‘arc’ indeed could be a bow shock caused by the ULX moving from the star cluster in HSK 70, yet the additional confirmation is desirable. In that case it is the first kinematic evidence of ULX’s escape from its parental star clusters. Our conclusion agrees with the results obtained by Kaaret et al. (2004b); Poutanen et al. (2013), who showed that the majority of ULXs are associated with young ( Myr) star clusters, yet reside outside them.
4 Summary
The HSK 70 nebula (‘foot nebula’) related with the ULX HoII X-1 was observed in the H, [S ii], and [O iii] emission lines with a scanning Fabry–Perot interferometer. Using these data we obtained the following results:
-
•
Two regions of the increased line-of-sight velocity dispersion are observed inside the nebula. Relatively high velocity dispersion in one of them most probably corresponds to the expanding ionized superbubble around the young star cluster, while the second one clearly reveals the presence of a broad component caused by the ULX influence on the ISM.
-
•
The velocity fields reveal a blue-shifted ‘arc’, which shape looks like a bow shock. The comparison with the analytical solution by Wilkin (1996) for the shape of a stellar wind bow shock in the thin-shell limit shows that this structure indeed could be a bow shock created by the ULX moving from the central part of the star cluster in HSK 70.
The most important result is that we found kinematic evidence of a bow shock around the ULX which in our view strongly suggests its escape from the parental star cluster. Up to now all the conclusions about ULXs’ escape were based only on their location outside the cluster.
5 Acknowledgements
Authors are grateful to the anonymous referee for constructive comments and suggestions and also to S. I. Blinnikov and S. N. Fabrika for useful discussions. The work is based on observations obtained with the SAO RAS 6-m telescope carried out with the financial support of the Ministry of Education and Science of the Russian Federation (agreement No. 14.619.21.0004, project ID RFMEFI61914X0004). Figure 1 in this article is based on the observations made with the NASA/ESA Hubble Space Telescope and obtained from the Hubble Legacy Archive which is a collaboration between the Space Telescope Science Institute (STScI/NASA), the European Space Agency (ST-ECF/ESAC/ESA), and the Canadian Astronomy Data Centre (CADC/NRC/CSA). The study was supported by the RFBR, project 14-02-00027. AVM and OVE are also grateful for the financial support (grant MD3623.2015.2) from the President of the Russian Federation.
References
- Abolmasov et al. (2007) Abolmasov P., Fabrika S., Sholukhova O., Afanasiev V., 2007, Astrophysical Bulletin, 62, 36
- Afanasiev & Moiseev (2005) Afanasiev V.L., Moiseev, A.V., 2005, Astron. Letters, 31, 194
- Afanasiev & Moiseev (2011) Afanasiev V.L., Moiseev A.V., 2011, Baltic Astronomy, 20, 363
- Allen et al. (2008) Allen M.G., Groves B.A., Dopita M.A., Sutherland R.S., Kewley L.J., 2008, APJS, 178, 20
- Baranov et al. (1971) Baranov V. B., Krasnobaev K. V., Kulikovskii A. G., 1971, Sov. Phys. Dokl., 15, 791
- Begelman (2002) Begelman M.C., 2002, ApJ, 568, L97
- Begelman et al. (2006) Begelman M.C., King A.R., Pringle J.E., 2006, MNRAS, 370, 399
- Berghea et al. (2010a) Berghea C.T., Dudik R.P., Weaver K.A., Kallman T.R., 2010, ApJ, 708, 354
- Berghea et al. (2010b) Berghea C.T., Dudik R.P., Weaver K.A., Kallman T.R., 2010, ApJ, 708, 364
- Colbert & Mushotzky (1999) Colbert E. J. M., Mushotzky R. F., 1999, ApJ, 519, 89
- Cseh et al. (2012) Cseh D. et al., 2012, ApJ, 749, 17
- Cseh et al. (2014) Cseh D. et al., 2014, MNRAS, 439, 1
- Cseh et al. (2015) Cseh D. et al., 2015, MNRAS, 452, 24
- Egorov et al. (2013) Egorov O.V., Lozinskaya T.A., Moiseev A.V., 2013, MNRAS, 429, 1450
- Egorov et al. (2017) Egorov O.V., Lozinskaya T.A., Moiseev A.V., Shchekinov Yu. A., 2017, MNRAS, 464, 1833
- Fabrika (2004) Fabrika S., 2004, Astrophys. Space Phys. Rev., 12, 1
- Fabrika et al. (2015) Fabrika S., Ueda Y., Vinokurov A., Sholukhova O., Shidatsu M., 2015, Nature Phys., 11, 551
- Goswami et al. (2014) Goswami S., Kiel P., Rasio F.A., 2014, ApJ, 781, 81
- Heida et al. (2014) Heida M. et al., 2014, MNRAS, 442, 1054
- Hodge et al. (1994) Hodge P., Strobel N.V., Kennicutt R.C., PASP, 1994, 106, 309
- Hong et al. (2013) Hong S., Calzetti D., Gallagher J.S., Martin C.L., Conselice C.J., Pellerin A., 2013, ApJ, 777, 63
- Kaaret et al. (2004a) Kaaret P., Ward M.J., Zezas A., 2004a, MNRAS, 351, L83
- Kaaret et al. (2004b) Kaaret P., Alonso-Herrero A., Gallagher J.S., Fabbiano G., Zezas A., Rieke M.J., 2004b, MNRAS, 348, L28
- Lehmann et al. (2005) Lehmann I., Becker, T., Fabrika, S. et al. 2005, A&A, 431, 847
- Mapelli et al. (2011) Mapelli M., Ripamonti E., Zampieri L., Colpi M., 2011, MNRAS, 416, 1756
- Meyer et al. (2016) Meyer D. M.-A, van Marle A.-J., Kuiper R., Kley W., 2016, MNRAS, 416, 1756
- Miller et al. (2003) Miller J. M., Fabbiano G., Miller M. C., Fabian A. C., 2003, ApJ, 585, L37
- Miller et al. (2005) Miller N.A., Mushotzky R.F., Neff S.G., 2005, ApJ, 623, 109
- Moiseev & Egorov (2008) Moiseev A.V., Egorov O.V., 2008, Astrophysical Bulletin, 63, 181
- Moiseev (2015) Moiseev A.V., 2015, Astrophysical Bulletin, 70, 494
- Moon et al. (2011) Moon D.-S., Harrison F.A., Cenko S.B., Shariff J.A., 2011, ApJ, 731, 32
- Oh et al. (2011) Oh S.-H., de Blok W. J. G., Brinks E., Walter F., Kennicutt R. C. Jr., 2011, AJ, 141, 193
- Pakull & Mirioni (2002) Pakull M.W., Mirioni L., 2002, preprint (arXiv:astro-ph/0202488)
- Pinto et al. (2016) Pinto C., Middleton M.J, Fabian A.C., 2016, Nature, 533, 64
- Poutanen et al. (2013) Poutanen J., Fabrika S., Valeev A.F., Sholukhova O., Greiner J., 2013, MNRAS, 432, 506
- Roberts et al. (2016) Roberts T. P., Middleton M. J., Sutton A. D., Mezcua M., Walton D. J., Heil L. M., 2016, Astron.Nachr., 337, 534
- Stewart et al. (2000) Stewart S.G. et al., 2000, ApJ, 529, 201
- Swartz et al. (2009) Swartz D.A., Tennant A. F., Soria R., 2009, ApJ, 703, 159
- Wilkin (1996) Wilkin F.P., 1996, ApJL, 459, L31
- Zezas et al. (2002) Zezas A., Fabbiano G., Rots A. H., Murray S. S., 2002, ApJS, 142, 239