Extremely metal-poor galaxy DDO 68: the LBV, H shells and the most luminous stars
Abstract
The paper presents new results of the ongoing study of the unusual Lynx-Cancer void galaxy DDO 68 with record-low-metallicity regions (12+(O/H)7.14) of the current star formation (SF). They include: a) a new spectrum and photometry with the 6-m SAO RAS telescope (BTA) for the Luminous Blue Variable (LBV = DDO68-V1). Photometric data sets are complemented with those based on the Sloan Digital Sky Survey (SDSS) and the Hubble Space Telescope (HST) archive images; b) the analysis of the DDO 68 supergiant shell (SGS) and the prominent smaller H arcs/shells visible at the HST image coupled with kinematics maps in H obtained with the Fabry-Perot interferometer (FPI) at the BTA; c) the list of identified at the HST images of about 50 most luminous stars ( mag) related to star-forming regions with the known extremely low O/H. This is intended to pave the path for the actual science with the next generation of giant telescopes. We confirm the earlier hints on significant variations of the LBV optical light deriving its amplitude of 3.7 mag for the first time. New data suggest that in 2008–2010 the LBV reached = –10.5 and probably underwent a giant eruption. We argue that the structure of star-forming complexes along the SGS (‘Northern Ring’) perimeter provides evidence for the sequential induced SF episodes caused by the shell gas instabilities and gravitational collapse. The variability of some DDO 68 luminous extremely metal-poor stars can be monitored with medium-size telescopes at sites with superb seeing.
keywords:
stars: massive – stars: variables: general – stars: individual (DDO68-V1) – galaxies: interactions – galaxies: individual: DDO 68 (UGC 5340) – ISM: bubbles1 INTRODUCTION
The dwarf irregular galaxy DDO 68 (UGC 5340, VV 542) resides in the nearby Lynx-Cancer void (Pustilnik, Tepliakova, 2011). It shows a peculiar, disturbed morphology and hosts several prominent young star-forming (SF) regions with the record-low metallicity (12+(O/H)=7.14). Most of SF regions are found at the periphery, mainly in the ‘Northern ring’ and the ‘Southern tail’ (see Pustilnik, Kniazev, & Pramskij (2005), hereafter PKP05, Izotov & Thuan (2007)). In the repeated observations of DDO 68, the unique Luminous Blue Variable star (LBV) was discovered in one of the most metal-poor Hii regions in the local Universe (Pustilnik et al., 2008b; Izotov & Thuan, 2009).
The GMRT (Giant Meterwave Radio Telescope) Hi-mapping study of DDO 68 revealed its complex structure and a velocity field consisting of two arms winded asymmetrically around the main bright part of the galaxy’s optical body. Their properties do not contradict the assumption that the arms are of tidal origin formed as a result of the recent gas-rich merger (Ekta et al., 2008). Recent VLA (Very Large Array) and GBT (Green Bank Telescope) deep Hi maps revealed a faint companion (DDO 68C) at a projected distance of 42 kpc from DDO 68. Its baryonic mass is 35 times smaller than that of the main galaxy (Cannon et al., 2014). There is a subtle Hi bridge pulled-off of DDO 68C. However, due to a very large difference in mass and a large distance, the reverse dynamical effect of DDO 68C to DDO 68 should be rather small (Annibali et al., 2016).
In line with earlier results, the authors of the recent ‘qualitative’ analysis of DDO 68 based on the HST deep images in the broad filters F606W and F814W (Tikhonov, Galazutdinova, Lebedev, 2014) distinguish two very different spatial components in the resolved stellar population with medium (⊙/5) and very low (⊙/20) stellar metallicities. The first relates to the ‘main, central’ component, while the second one – to the ‘secondary, peripheric’ component. They have also found that the ‘secondary’ component (winded from the Northern periphery of the main body through the Eastern edge to the Southern tail) has only a small fraction of old stars which is not the case of the ‘main’ component. In addition to this, very deep imaging by Annibali et al. (2016) reveals a much fainter low-surface arc and a thin elongated fragment adjacent the main body, which the authors assign to mini satellites being accreted to the ‘main’ component.
The issue of nature of the secondary component remains unsettled. In the recent paper by Makarov et al. (2016, MNRAS, in press), we show that the small fraction of the secondary component’s old population mentioned above can be naturally explained for the ‘Northern ring’ region by the contribution of stars from the outer parts of the main, central component. The latter fact implies that the small fraction of old stars in this region does not belong to the ‘secondary’ component of the assumed minor merger, with a measured gas metallicity in its star-forming regions of ⊙/35. Hence, it can be really a very young object that formed its main stellar population not earlier than 1–2 Gyr ago. Several similar type very gas-rich ‘unevolved’ dwarfs were already found among the Lynx-Cancer void least massive galaxies (Pustilnik et al., 2010, 2011; Chengalur, Pustilnik, 2013; Chengalur et al., 2016).
For a deeper study of DDO 68, in this paper we analyse and combine several new observations of this galaxy. They include the BTA long-slit spectroscopy and photometry of the star-forming region Knot 3 containing the LBV, the BTA FPI H data on the ionized gas kinematics in the ‘Northern ring’ (supergiant shell) of DDO 68 in conjunction with the HST H images of giant shells. To follow the LBV variability, we also use the photometry of Knot 3 in archive HST and SDSS images.
Evolution and death of extremely metal-poor massive stars are among the principal issues for modelling galaxy formation and evolution during the first 1 Gyr after the Big Bang (e.g., Barkana & Loeb (2001)). While the state-of-art stellar evolution models including those with fast rotation have significantly advanced over the past decade (e.g., Szecsi et al (2015); Chen et al. (2015) and references therein), there is still no direct comparison between the model predictions and properties of true extremely metal-poor massive stars. The main reason for this is the lack of such stars in the local Universe accessible for sufficiently detailed studies. One needs to wait for the qualitative progress in new instruments and methods at the extremely large next generation of optical telescopes coming into operation in the 2020s. To pave the path for the next generation telescope studies of the lowest-metallicity massive stars, we present the list of the DDO 68 most luminous stars related to six record-low metallicity regions of the current/recent SF.
The layout of the paper is as follows. In Sec. 2, we present all the observational data used and briefly describe their reduction. In Sec. 3, main results on the photometry of Knot 3 and the LBV (DDO68-V1) and separation of the LBV light from that of the underlying Hii-region are presented. Sec. 4 presents spectral data on the LBV and its variations. In Sec. 5, main results on H shells and the Giant Super Shell are summarized. Sec. 6 presents the list of the most luminous stars within the Northern Ring situated in the regions of extremely low gas metallicity. Sec. 7 is devoted to the discussion of new results, their comparison with the previously available data and understanding them in a wider context. In Sec. 8 we summarize the new results and draw the main conclusions of this DDO 68 study. The distance to DDO 68 is adopted according to the TRGB-based estimate from Makarov et al. (2016, in press) of 12.75 kpc (or = 30.53 mag). The latter distance is very close to those from Cannon et al. (2014); Sacchi et al. (2016). The respective scale is 62 pc in 1 arcsec.
2 OBSERVATIONAL DATA AND REDUCTION
2.1 HST data
DDO 68 was observed with the HST using the Advanced Camera for Surveys () (GO 11578, PI A. Aloisi). Deep exposures were acquired with the filters (7644 s, 2010.05.02) and (7644 s, 2010.04.27). A deep image of the galaxy was also obtained in the F658N narrow-band filter, centred on the H line, for a total integration time of 2388 s on May 2, 2010. For brevity, hereinafter we call these three bands as , , and H.
We use the module of the DOLPHOT software package by A. Dolphin111http://americano.dolphinsim.com/dolphot to obtain the photometry of the resolved stars as well as to run artificial star tests to characterize the completeness and uncertainty in the measurements. The data quality images were used to mask bad pixels. The stars with high-quality photometry only were used in the analysis. We have selected the stars with a signal-to-noise (S/N) ratio of at least five in both broad filters and . The detailed analysis of data, photometry, and resulting colour magnitude diagram are given in our previous paper (Makarov et al., 2016, MNRAS, in press).
We had already noticed in PKP05 that star-forming regions along the ‘Northern ring’ visible well in the BTA H image can actually be a manifestation of the induced SF in front of a supershell. The most detailed H images obtained at the HST uncover fine arc-like and shell structures in the ‘Northern ring’ SF regions. This provides an opportunity for a better understanding of ionized gas shells and their relation to youngest massive stars including the DDO 68 LBV.
2.2 BTA data
Spectral and photometric data at the BTA (SAO RAS 6-m telescope) were obtained at the prime focus with the multimode device SCORPIO (Afanasiev, Moiseev, 2005). The parameters of observations are shown in the Journal (Table 1) and, for dates prior to January 2009, they are presented in our papers PKP05; Pustilnik et al. (2008b) in more detail. For the fresh spectrum obtained in January 2009, the slit width was of 1.0 arcsec. During the night, we observed the spectrophotometric standard Feige 34. Spectral resolution for the grisms VPHG550G and VPHG1200G was FWHM 12 Å and 5.5 Å respectively. The photometry of the DDO 68 Hii region Knot 3 in 2009, 2015, and 2016 as well as in January 2005 is based on the local standards – several sufficiently bright stars in the SDSS images of DDO 68. Their magnitudes were transformed to the Johnson-Cousins magnitudes according to the relations by Lupton et al. (2005).
Spectral and photometric observations of DDO 68 Knot 3 in November 2004 and January 2005, when the LBV features were below the detection level, allowed us to define the level of the underlying Hii region light. The latter is the basic parameter in disentangling the fraction of the LBV light, when we register the integrated light of both the Hii region and the LBV with ground-based telescopes.
We follow the standard processing of 2D spectra, which include debiasing, flat-fielding, wavelength and flux calibration, similar to that described in detail in PKP05. From the prepared 2D spectra, we extracted the fragment with a full length of 5 arcsec which included all the visible light of the Hii region Knot 3 falling within the long slit. We convolved these spectra with the and/or passbands to use them in the analysis of the Knot 3 variability. Appropriate corrections for the lost part of light were performed according to the procedures described in Sec. 3.2.
The observations of DDO 68 ionized gas kinematics in the H emission line were conducted with the same SCORPIO device in the scanning FPI mode as described in Moiseev et al. (2010) and Moiseev (2014). The reduced data were combined into the data cube, where each 07 pixel in the 61 field of view contains a 36-channel spectrum sampled with 0.37 Å (17 km s-1) per channel. Spectral resolution was km s-1 which corresponds to the velocity dispersion km s-1. Moiseev (2014) presented the study of the large-scale disc rotation based on the velocity field derived from the FPI data; Moiseev, Tikhonov & Klypin (2015) have published the maps of the ionized gas velocity dispersion. Here we consider only the data set obtained with the best weather conditions. The final angular resolution corresponds to a seeing of 18 in comparison to Moiseev (2014) and Moiseev et al. (2015) with deeper data but with a worse 27 resolution.
| Date | Grism | Expos. | PA | ″ | Air |
|---|---|---|---|---|---|
| or band | time, s | mass | |||
| (1) | (2) | (3) | (4) | (5) | (6) |
| 2004.11.09 | VPHG550G | 1900 | -57 | 0.8 | 1.08 |
| 2005.01.12 | 3600 | 1.7 | 1.07 | ||
| 2005.01.12 | 3600 | 1.9 | 1.20 | ||
| 2005.01.13 | VPHG550G | 3900 | -57 | 1.2 | 1.09 |
| 2006.12.30 | FPI H | 36120 | 1.8 | 1.04 | |
| 2008.01.11 | VPHG550G | 5900 | -26 | 1.2 | 1.20 |
| 2008.02.04 | VPHG1200G | 5900 | -26 | 1.3 | 1.13 |
| 2009.01.21 | 1300 | 1.3 | 1.19 | ||
| 2009.01.21 | VPHG1200G | 61200 | -26 | 1.3 | 1.12 |
| 2015.01.14 | 2150 | 2.1 | 1.05 | ||
| 2015.01.14 | 2180 | 2.1 | 1.05 | ||
| 2015.01.14 | 2180 | 2.1 | 1.05 | ||
| 2016.01.15 | 5180 | 2.2 | 1.10 | ||
| 2016.01.15 | 5180 | 2.2 | 1.14 | ||
| 2016.01.15 | 5180 | 2.2 | 1.07 |
2.3 SDSS data
SDSS images of DDO 68 in the filters were obtained at the epoch 2004.04.16. Since the images presented in the SDSS database are fully reduced, we only need to measure the underlying background before we perform photometry in round apertures. This requires special care since the object of interest (Knot 3 with the LBV) is situated near other regions of recent and current star formation. Therefore, we measure the background with small apertures in many adjacent regions, which exclude any contribution of neighbouring diffuse or stellar objects.
3 LIGHTCURVE OF THE LBV
3.1 Determination of the Hii knot contribution from the HST data
High-angular-resolution HST images of this region give us a unique opportunity to disentangle the fluxes of the underlying Hii region and the star-like object, to which the major light contribution comes from the LBV. This allows, on the one hand, to get the direct estimate of the LBV luminosity at that epoch and, on the other hand, gives us the integrated and magnitudes of the star-forming region Knot 3 without the LBV contribution. They are assumed to correspond to the minima of the Knot 3 lightcurve.
Since the LBV (together with the expected young star cluster, to which it belongs) is a star-like in the ACS images, we have measured its individual total magnitudes in the HST and filters and transformed them to the Johnson-Cousins and bands according to the relations suggested in Sirianni et al. (2005). In the HST images, we also performed the aperture photometry similar to our ground-based photometry, that is integrated photometry for the LBV together with all the light of the underlying SF region Knot 3 (the sum of compact ionizing star cluster and the extended Hii region along with many fainter star-like objects within this region, see Fig. 9). For the latter estimate, the radius of the round aperture centred on the LBV was taken equal to 25, very close to that of our photometry of Knot 3 in the BTA and SDSS images. The background was adopted as the average of the light in many small apertures (to avoid the background stars) around the measured region.
In the standard system, we obtain the following magnitudes: 20.050.08, 19.930.03 for the LBV itself. The Milky Way extinction is not applied to the apparent magnitudes across the paper including those in Table 5. For the integrated magnitudes of this region, we obtain: 19.260.08 and 19.160.03. The rms uncertainties, 0.08m and 0.03m, come from the related errors in the transformation formulae by Sirianni et al. (2005). The respective absolute magnitude of the LBV at this epoch was –10.53.
3.2 BTA photometry and algorithm to recover the intrinsic LBV magnitudes
We performed the photometry of DDO 68 Knot 3 containing the LBV in the images obtained in the BTA observations on 2005.01.12 (, ), 2009.01.21 () and 2015.01.14, and 2016.01.15 (, , and ). The primary processing of images was carried out with the standard pipeline with the use of both IRAF and MIDAS. It included the removal of cosmic ray hits, bias, and flat correction. The background was determined as an average for several small regions around Knot 3 within a distance of 5 arcsec and then was subtracted from the image before measuring the Knot 3 instrumental magnitudes. The last were transformed to the magnitudes via average zero-points obtained on four local standards – stars with in the range of 17.5m to 18.8m selected in this region based on the SDSS images. Their magnitudes were measured in the filters and transformed to with the corresponding formulae from Lupton et al. (2005). The related uncertainties in the average zero-points of these filters are 0.014m, 0.020m, and 0.024m. In each case, to obtain the total magnitude of Knot 3, we used the round aperture with 25.
To extend the photometric time series, we also used the convolution of the BTA extracted 1D spectra of Knot 3 with the respective passbands of the and filters for spectra with the grism VPHG550G (the range 3600–7000 Å) and filter for the grism VPHG1200G (the range 3600–5700 Å). Due to a rather small width of the long slit (1 arcsec), the substantial part of the light was lost. Therefore, to obtain the total Knot 3 magnitudes from those acquired with the spectra convolution of its part, one needs to make correction for the light loss. This requires an adequate model of the complex light distribution and additional calculations.
We calculated all necessary corrections for each of the used spectrum convolutions taking the value of seeing () as the input parameter during the respective observation. For this we used the original HST image of Knot 3 with a FWHM of 01 and performed its Gaussian smoothing to reproduce seeings for the respective spectra for the range from 08 to 18. For each of such smoothed images, we overlaid the rectangle of the slit of 1″ 5″. Separately for the underlying Hii region and the star-like LBV, we integrated their light within the slit and derived the lost light fraction with respect to the total light. The derived correction factors (i.e., multiplicators to estimate the full flux from that appeared in the slit) vary from 1.36 to 2.07 for between 08 and 18 for a star-like object, and respectively, from 2.33 to 2.85 for this concrete underlying Hii region. To estimate corrections of the Knot 3 magnitudes derived via the convolution of spectra from Izotov & Thuan (2009), we used their respective slit size of 15 by 35 for 0802.
In the following algorithm, we use the ‘known’ total magnitude of the underlying Hii region as estimated from the deconvolution of the HST image ((Hii)=20.12m). This number was also supported by the independent BTA photometry of Knot 3 on 2005.01.12 at the epoch, when no tracers of the LBV light were seen in its spectrum (obtained in the next night). From the spectra convolution with the respective filter passbands (), using the algorithm below, we recover (at a first approximation) the total magnitudes of Knot 3 in and separately the magnitude for the LBV.
The algorithm includes the following steps. We start, for example, from the magnitude of the convolved spectrum obtained on 2008.01.11 under =12, for which we derive (conv)=20.830.02. The respective factors of loss on the slit are 1.53 for a star-like object and 2.5 for the Knot 3 Hii region. From the known magnitude (Hii)=20.12m, applying the respective correction, we estimate its contribution to (conv) on the level of (Hii)(conv) = 21.12m. The difference in light between (conv)=20.83m and (Hii)(conv) = 21.12m is assigned to the light of the LBV within the slit. From simple calculations, it corresponds to (LBV)(conv) = 22.40m. Then, after the appropriate correction for the slit light loss, we derive the true (LBV)=21.94m. Finally, summing up the fluxes for (Hii)=20.12 and that for the LBV, we derive the integrated light for Knot 3: (Kn.3)=19.93m.
Different calculations are applied, when we directly measure the total light of Knot 3 via the aperture photometry and estimate the light of the LBV. We again use the basic parameter (Hii)=20.12m and assign all extra light to that of the LBV.
3.3 SDSS results
The results of the SDSS total magnitude measurements of Knot 3 in a round aperture with 25 on 2004.04.16 are as follows: = 19.850.02, = 19.830.02. According to the transformation formula from Lupton et al. (2005), they translate into = 20.080.03, = 19.840.03, and = 19.730.03.
3.4 DDO 68 LBV light variability
Turning to DDO68 LBV (also DDO68-V1), it is worth remembering the other most studied low-metallicity extragalactic LBVs considered to be caught in the phase of giant eruption. One of them is NGC 2363-V1 (in the Hii region with 12+(O/H)=7.9) (Drissen, Roy & Robert, 1997; Drissen et al., 2001; Petit, Drissen & Crowther, 2006). The other one is the LBV in PHL293B residing in the Hii region with 12+(O/H)=7.71 (Izotov & Thuan, 2009; Izotov et al., 2011). The former object was well observed with the HST during the period of its maximal light when it brightened by 3.5 mag and had reached –10.5. The latter LBV was found in the very bright phase, with –12, close to the maximum known for LBV luminosities.
In the context of the LBV study, their giant eruptions with the maximum mass-loss rates are especially interesting. It is tempting to check whether DDO68-V1 approached this phase during the studied time interval. The whole dataset on the DDO 68 LBV variability is very limited. With the only exception of the HST images, all other measurements deal with the integrated light of the star-like LBV itself and the extended light of the underlying star-forming region Knot 3 obtained at typical seeings of 1″– 2″. Fortunately, as shown in Section 3.2, we have its emission as that of a separate object well measured in the HST images (Subsection 3.1). Therefore, one can disentangle the total measured fluxes into two components and derive the contribution of the LBV light with the acceptable accuracy.
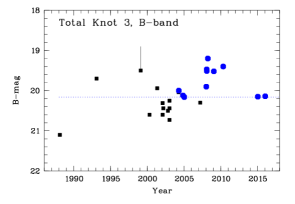
Very few magnitude estimates of Knot 3 in DDO 68 have been known during about the last 60 years. Most of them are presented by Bomans & Weis (2011a, b) in the and Johnson-Cousins bands. These estimates encompass the period from 1955 [two measurements from the Digitized Sky Survey (DSS) - digitized ‘Palomar Observatory Sky Survey One’ – POSS1 photoplates] to 2007. During the period of 1988–2007, most of the data were obtained via CCD measurements. They also include the flux estimates derived from the ‘convolution’ of the spectra by Izotov & Thuan (2009) in February and March 2008. The maximum light of the Knot 3 region, as shown on Bomans & Weis (2011b) lightcurve, was as high as 18.9 (February 1999). However, the ‘error-bar’ of this point drawn in their Figure 2 (with no comment on its meaning) assumes that in fact it can be as faint as 19.5.
Due to the absence of any information on seeings, used apertures and the background subtraction, this dataset is difficult to use for examination of the range of light variations of the LBV itself. Their total range of the observed luminosity variations of Knot 3 is (Kn.3) 2m, if one adopts the brightest state of 19.1 (POSS1 photoplate magnitude from 1955) and the lowest state with 21.1 in 1988. Both these extreme points are very important in further analysis. However, their reliability, especially for the minimum, can be questioned in view of our measurement of the minimal light of Knot 3 at the level of 20.12m (see below).
| Date | (LBV) | (LBV) | Ref. Notes | ||||||
| 040416 | 20.00 | 0.05 | 19.85 | 0.02 | 19.83 | 0.03 | 21.41 | 0.13 | SDSS phot |
| 041109 | 20.12 | 0.06 | 20.08 | 0.04 | 20.11 | 0.05 | 22.12 | 3 up.lim. | BTAcv |
| 050113 | (20.16) | 0.05 | 20.11 | 0.05 | 20.12 | 0.02 | 23.23 | 3 up.lim. | BTA phot+cv |
| 080111 | 19.90 | 0.03 | 19.91 | 0.03 | 19.93 | 0.02 | 21.92 | 0.13 | BTA cv |
| 080202 | (19.47) | 19.50 | 0.05 | 20.40 | 0.12 | APO IT09 cv | |||
| 080204 | 19.51 | 0.07 | 19.55 | 0.05 | 19.55 | 0.05 | 20.52 | 0.13 | BTA cv |
| 080328 | (19.20) | 0.10 | 19.30 | 0.10 | 19.99 | 0.20 | MMT IT09 cv | ||
| 090121 | 19.52 | 0.02 | (19.53) | 19.51 | 0.01 | 20.43 | 0.03 | BTA phot+cv | |
| 100502 | (19.40) | 0.08 | 19.33 | 0.08 | 20.05 | 0.08 | HST phot | ||
| 150114 | 20.25 | 0.01 | (20.09) | 20.09 | 0.01 | 24.00 | 0.32 | BTA phot | |
| 160115 | 20.14 | 0.02 | 20.01 | 0.03 | 22.55 | 0.32 | BTA phot | ||
| cv – estimates via spectrum convolution with the filter passband and the respective on-slit loss correction. | |||||||||
| (): expected values based on the other bands and the measured colours; IT09 - Izotov & Thuan, 2009. | |||||||||
We perform a more detailed analysis of the available photometric estimates of Knot 3 using our photometry at the BTA, the SDSS image database, and HST/ACS images in the and filters. For the subsequent analysis of the lightcurve, we aim to have the HST measurements to be consistent within the adopted uncertainties with the BTA measurement of =20.120.02 on 2005.01.12. At this epoch, the LBV was too faint and did not show up in the spectrum of Knot 3. Hence, the and magnitudes measured at this epoch should be treated as a good approximation for that of the underlying Hii region. To make the HST and BTA values agree, we adopt the integrated HST magnitude 19.33. The latter value is within 1 uncertainty from the nominal value 19.260.08.
To constrain the light of the LBV in the nights of January 12-13, 2005, we used the following approach. Taking the cited uncertainty of the aperture photometry 0.02m, we adopt that the light contribution of the LBV at that epoch with high confidence does not exceed the 3 level, that is 6 % of the ‘basic’ -band luminosity of Knot 3, corresponding to =20.12m. Hence, the related upper limit corresponds to 23.23m.
In this ‘faint’ state, in the HST image in Fig. 9, the LBV would look like star no. 9 in its nearest neighbourhood, or fainter. The brightest directly observed state of the LBV, as derived from the HST image photometry, corresponds to (LBV) = 20.05m. This implies that during the period of about 5 years (2005-2010, see Table 2) the LBV has brightened by more than 3.1m.
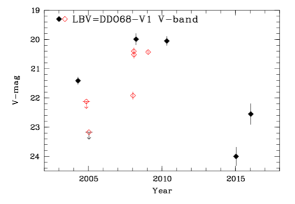
Our BTA measurement of the total light of Knot 3 and the LBV on 2015.01.14 ( = 20.090.01) corresponds to the luminosity which is 3 above its ‘basic’ level. The derived contribution of the LBV corresponds to 24.00.32. This implies that between May 2010 and January 2015 the LBV -band luminosity decreased by a factor of 40, or faded by 4.00.32m. Accounting for its rather large uncertainty, the more robust estimate is 3.7m.
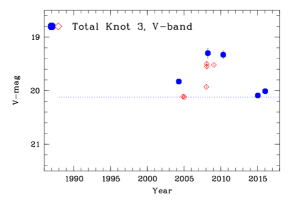
For better understanding of the character of the lightcurve of Knot 3 and the LBV during the last decade, we have analysed all available data including own imaging with the BTA, images from the SDSS and HST databases and the BTA spectra convolution. We also convolved the spectra from Izotov & Thuan (2009) obtained on February 2 and March 28, 2008, when the LBV was in its bright phase. We employed the approach described and illustrated above at the end of Section 3.2. No information is available on the seeing () for observations of the Knot 3 spectra by Izotov & Thuan (2009). We adopted the median value of 08 typical of the Apache Point Observatory (APO) 3.5-m and MMT telescopes. Its r.m.s. 02 results in a relatively small additional scatter in the derived magnitudes of Knot 3. This is included in our final errors. All the derived estimates are presented in Table 2 along with other data and shown in Fig. 1.
As one can see, the LBV approached its maximum observed brightness already at the beginning of 2008. During next two years, there were only two additional points, in January 2009 (BTA) and in May 2010 (HST), which suggested that its light varied close to that maximum level corresponding to (LBV) of about –10.5m. It appears that there are no published images of Knot 3 and/or its light measurement between May 2010 and January 2015.
Table 2 summarizes all our photometric data on the integrated magnitudes of Knot 3 and those related to the LBV. In column 1, the date of observation is given. In columns 2 and 3 – the total magnitude and its adopted uncertainty . The part of the data in parentheses are the estimates recalculated from the magnitudes in the same night, either directly from the of convolution or indirectly via the typical object colours for the similar brightness. In Columns 4 and 5, the similar values are presented for filter. Columns 6 and 7 show the adopted integrated -magnitudes and . Columns 8 and 9 give the LBV magnitudes and their errors. In Column 10, we give info on the telescope and the origin of parameters in the previous columns.
The amplitude of the DDO 68 LBV variability, found in the course of this study, from –6.95 to –10.58, is very large. This indicates that during the period of roughly two to five-six years (certainly during the years 2008-2010 and probably longer) it experienced a giant eruption. If the maxima in the Bomans & Weis (2011a) -band lightcurve of Knot 3 in 1955 (19.1) and 1999 (18.9, see Fig. 1) are realistic, then such events could have repeated two or three times over the last 60 years.
By the way, it is worth noting that some of Bomans & Weis (2011a) data seem to contradict our band lightcurve. Indeed, the faintest total magnitude of the SF region Knot 3 = 20.12 corresponds to the lowest LBV luminosities when it was below the detection level. Since the colour for the Hii region is rather blue (say, 0.25 mag), one does not expect its magnitudes to be fainter than 20.4. In fact, in the Bomans & Weis (2011a) -band lightcurve, several such points are drawn, including the absolute minimum point in 1988 at 21.1. Since the authors do not present details of their photometry, one could think that the faintest values of their lightcurve are related to either systematical difference due to their photometry in smaller than our apertures or to some other unknown reasons, which only the authors can determine.
4 LBV spectrum
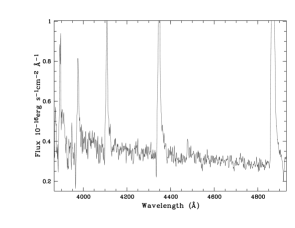
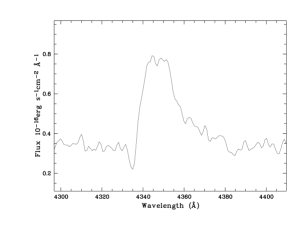
Due to the volume limits, we do not show here the spectra of Knot 3 obtained in 2005 and 2008, which can be found in the discovery paper on DDO 68 LBV (Pustilnik et al., 2008b). In Fig. 2 (left panel), we show the unpublished spectrum of Knot 3 obtained with the grism VPHG1200G on 2009.01.15. Again, as in the BTA 2008 spectra, in difference to other known LBVs only Hydrogen and Helium broad components of the LBV spectra are seen. The only exception, similar in this respect to DDO 68 LBV, is the LBV in PHL 293B with 12+(O/H) = 7.72 (Izotov & Thuan, 2009). Also, the P-Cyg absorption in blue wings of Balmer lines is seen. The latter is illustrated in the zoomed part of the object spectrum centred at H (Fig. 2, right panel). Here the narrow ’instrumental’ width component related to emission of the underlying Hii region, was subtracted out. This was performed with the standard MIDAS procedure ’blendfit’ to fit Balmer lines with two Gaussian profiles. The instrumental width (FWHM) of the narrow component (5.5 Å or 370 km s-1 at H) was adopted from the measured linewidths of the strong symmetrical emission lines [Oiii]4959,5007 attributed to the underlying Hii region. This instrumental width is about three times smaller than that of the broad lines related to the LBV.
For epoch 2009.01.15, the LBV was in the high state, roughly 0.5m fainter than the firmly registered maximum for the total amplitude of more than 3.6 mag (see Sect. 3.4). Therefore its line fluxes are suitable to combine with other measurements to follow their behavior with the LBV variability. Below, we perform their analysis, combining them with the only additional published spectral data from Izotov & Thuan (2009).
| Name lines | FWHM | |||
| Å | Å | km/s | km/s | |
| (1) | (2) | (3) | (4) | (5) |
| H | 4869.36 | 4856.31 | 1079 | 806 |
| H | 4347.48 | 4336.53 | 1160 | 757 |
| H | 4108.20 | 4098.65 | 1123 | 699 |
To date, there are four published spectra of Hii region Knot 3 during phases when the LBV made the substantial contribution to its integrated spectrum. They have all been obtained in the period from Jan.11 to Mar.28, 2008 (see Table 4). Only the LBV discovery spectrum on 2008.01.11 corresponds to its intermediate phase, with –8.6, when it was almost two magnitudes fainter than in the maximum (see Table 2). Three other spectra are obtained at the LBV ’maximum’ light, or at 0.4m-0.5m fainter, within 50 days prior to the maximum. Despite the fact that it was acquired about 300 days after the maximum, the new spectrum added here on 2009.01.21 corresponds to the LBV brightness of only 0.44m fainter than in the maximum. Therefore, apart from the very modest amount of the LBV spectral data, they are also biased to the brighter quartile of the LBV band light variations.
The only lines visible in these spectra are broad (FWHM 1000 km s-1) emissions of Hydrogen and Helium. No apparent emission lines of heavy elements are detectable. Since we know of no other LBVs, except the aforementioned next lowest metallicity LBV in PHL239B, whose spectra lacks the heavy elements, we suggest that this is related to the very low metallicity of its the main sequence progenitor. P-Cyg line profiles clearly seen in the strong emission lines indicate the expanding wind/shell with the terminal velocity of 800 km s-1 noticed earlier by Izotov & Thuan (2009).
Due to the very limited range of the LBV luminosity for spectral data and very scarce time coverage, it is difficult to follow more or less gradual changes of line fluxes. In such a situation one can only try to catch some trends and to confront them with known similar objects. We present the LBV line fluxes in Table 4 along with its adopted magnitudes.
| Date | (HeI4471) | (HeI5876) | (H) | (H) | (H) | ||||||
| 041109 | 22.12 | 1.4 | 1.2 | 0.5 | 1.0 | 0.5 | 0.5 | 0.27 | 0.5 | 0.25 | |
| 050113 | 23.17 | 0.5 | 0.6 | 0.3 | 6.0 | 1.8 | 2.3 | 0.7 | 1.3 | 0.45 | |
| 080111 | 21.92 | 5.3 | 0.4 | 10.2 | 0.6 | 48.7 | 9.0 | 22.2 | 4.6 | 19.2 | 4.6 |
| 080202 | 20.40 | 21.6 | 0.5 | 10.9 | 0.6 | ||||||
| 080204 | 20.52 | 0.7 | 0.2 | – | 12.1 | 1.0 | 6.0 | 0.8 | |||
| 080328 | 19.99 | 0.4 | 0.2 | 21.0 | 0.3 | 11.7 | 0.5 | ||||
| 090121 | 20.43 | 0.6 | 0.3 | 1.3 | 0.2 | 32.9 | 1.6 | 12.7 | 1.8 | ||
| Line fluxes are in units 10-16 erg cm-2 s-1. Upper limits at 2 level. Fluxes of Balmer emission lines | |||||||||||
| are for broad components with FWHM1000 km s-1. APO data; MMT data. Both are from Izotov & Thuan (2009). | |||||||||||
Hei emission line fluxes of 4471 and 5876 (the only lines for which we have sufficiently good detections) appear the strongest at the LBV discovery epoch (2008.01.11), when the LBV was 2 magnitudes fainter with respect of its maximum on 2008.03.28. Only line Hei(4471) was within this ’maximal phase’ spectrum range (see Izotov & Thuan (2009)). Its flux was an order of magnitude lower than in the LBV discovery spectrum. For somewhat fainter LBV level in two other dates, Hei(4471) flux was also low, but probably a factor of 1.5 higher than in the maximum. For Hei(5876) line, there are only two spectra with the apparent LBV contribution. So, the only firm statement we can make is that the flux of Hei(5876) line is down by a factor of 82 between epochs 2008.01.11 and 2009.01.21, while the LBV -band luminosity is up by a factor of four. This, at first look, is consistent with the run of Hei(4471) line flux.
The presence of emission Heii(4686) line is an indicator of the hot LBV state characteristic of minimums in LBV lightcurves, when a star approaches WR-type parameters (e.g. Sholukhova et al. (2011)). In this state, the EW(Heii 4686) can reach 10 Å. We did not detect Heii(4686) line in any of our spectra, and there were no traces of this line in Izotov & Thuan (2009) spectra. The common upper limit (2) on the line flux corrected for the loss on slit on our spectra is 0.2 10-16 erg cm-2 s-1. Since the contribution of the LBV continuum in our spectra during years 2004–2005 to the light of the underlying Hii region was less than several percent, this line should be below the detection level.
The variations of the LBV Hydrogen Balmer line intensities are not easy to follow since they require deblending of the composite line profiles (Hii region plus LBV) and extraction of their broad components. They also need to correct for the loss of the LBV light on the slit. Both their width and the wind terminal velocities estimated from P-Cyg profile remain the same within the measurement uncertainties.
Unfortunately, for H we have only two spectra with the interval of three weeks (2008.01.11 at BTA and 2008.02.02 from Izotov & Thuan (2009)). But during this time the LBV -band luminosity had increased by a factor of four. The flux of H dropped by factor of 2.20.5. The similar drop of H flux was registered. However, the subsequent variations of H flux appeared to be less predictable. In particular, in the maximum LBV phase (2008.03.28), F(H) was close to that of the LBV discovery date, when the LBV was fainter. In 10 months after the maximum, when the LBV band luminosity dropped by 40 %, F(H) increased by a factor of 1.5. Surprisingly, in comparison to the similar LBV level on 2008.02.02-04, F(H) became 2.5 times higher. The estimates of fluxes of H line are of smaller S-to-N, but in general agree with variations of H flux.
5 H shells and the super giant shell
5.1 The Super Giant Shell
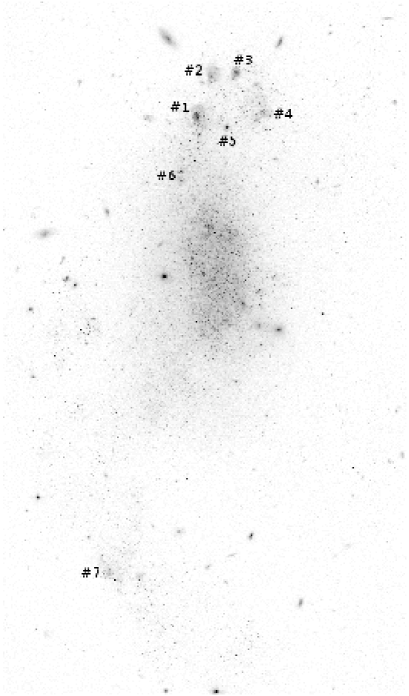
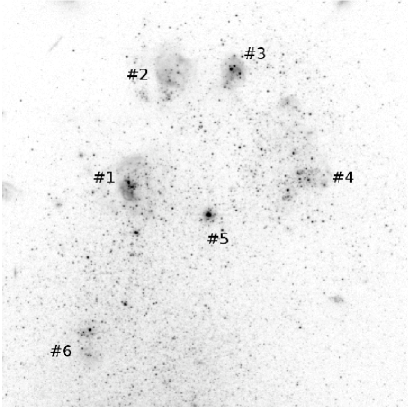
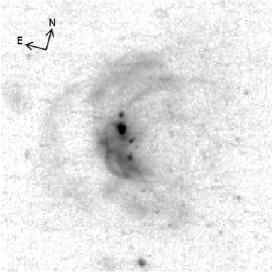
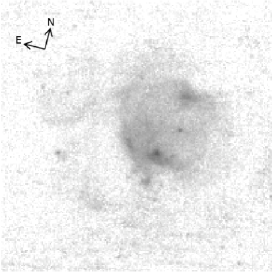
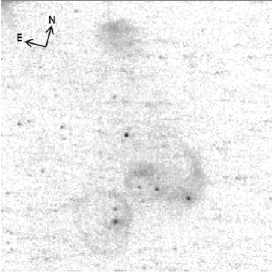
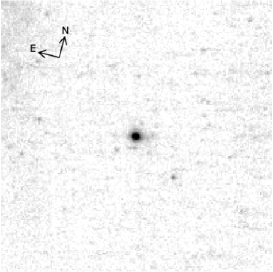
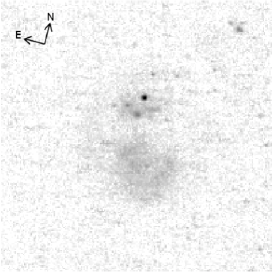
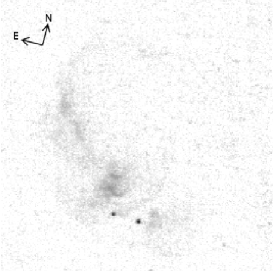
The most prominent H emission in DDO 68 is related to the outer region at the northern edge, named in PKP05 the ‘Northern ring’. It consists of at least five SF regions with the range of H luminosities and ages of 3–7 Myr as inferred from the comparison of their (H) with predictions of temporal behaviour of this parameter in the Starburst99 models (Leitherer et al., 1999). The total H flux from DDO 68, as found in PKP05, is 1.7310-13 erg s-1 cm-2 which corresponds to the luminosity (H) = 3.381039 erg s-1. The major part of this luminosity ( 80%) originates in the ’Northern Ring’ (see Fig. 1, right panel. Continuum is not subtracted.) In PKP05, these SF regions appeared barely resolved and were called ’Knots’ with the respective numbers. In the HST image they all are extended and well resolved. Therefore it will be more suitable to call them Star-Forming (SF) regions, keeping the same numbers.
In fact, these five SF regions, well visible in the H image, are complemented by the 6-th object, the compact young stellar cluster (YSC) (age of 22 Myr, PKP05), which is seen in the HST H and broad band images as an almost star-like source (FWHM()=014, compared to FWHM=010 for the ACS Point Spread Function (PSF)). Thus, the intrinsic FWHM(YSC) 010, or 6 pc. The compact core of the YSC is surrounded by a diffuse halo of lower contrast and with the full extent of 03. The overall size of the ’Northern ring’ is 15″18″ that corresponds to the linear ’diameter’ of 1.1 kpc.
Similar large structures, Super Giant Shells (SGS) and rings have been known for a long time both in our Galaxy and in other nearby galaxies. They are well identified in particular in the suitable angular and velocity resolution Hi maps of nearby galaxies through the prominent ‘holes’ in the gas distribution and its expansion in the compressed walls around the holes. They are produced, most probably, by the cumulative action of multiple supernovae (SNe) and of massive star winds in the intense SF episodes (see e.g. review by Elmegreen (1998)).
The ambient gas compressed by such shells and their shock fronts can, at certain conditions, appear unstable and collapse, leading to the sequential induced SF episodes. In particular, SGSs with the maximum sizes of 1–1.5 kpc are found in several galaxies. Well-studied objects are IC 2754 (e.g., Egorov et al. (2014) and references therein) and Holmberg II (Puche et al., 1992), both from the nearby group M81. Expansion velocities of such SGSs vary across a rather wide range. For example, in Holmberg II, according to Puche et al. (1992), are of the order of 10 km s-1 and their estimated characteristic expansion times (0.6 ) are of 35–60 Myr. For the SGS in IC 2754, with the overall size of 0.8 kpc, Egorov et al. (2014) find 25 km s-1 and the expansion time of 10 Myr.
5.2 SGS expansion velocity
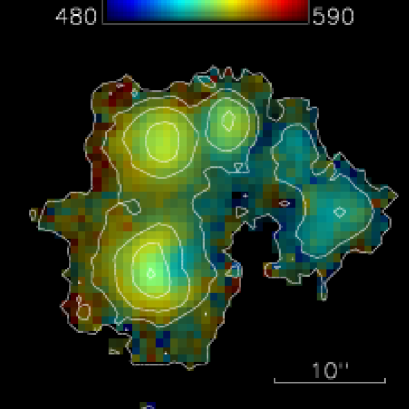
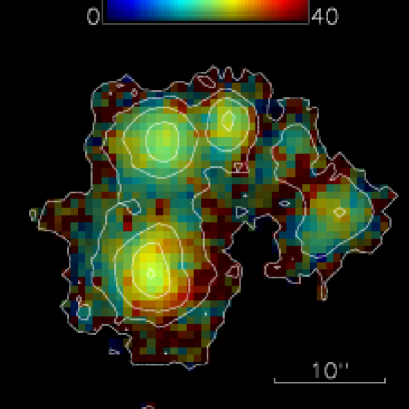
In Fig. 3, we show the ionized gas velocity and velocity dispersion maps derived from fitting of the H profiles in the FPI data cube. The velocity field reveals a significant gradient of the line-of-sight velocities at the East–West direction, i.e. roughly perpendicular to the galaxy disc major axis. We accept the disc orientation parameters (inclination and the line-of-nodes position angle ) adopted from the comparison of Hi, Hii, and photometric data (Moiseev, 2014). According to this paper, both H and Hi rotation curves have a flat shape at the radial distances corresponding to the location of the SGS. Therefore variations of the line-of-sight velocity related to the disc rotation should be negligible. A possible explanation of the observed velocity gradient is a radial expansion of the SGS.
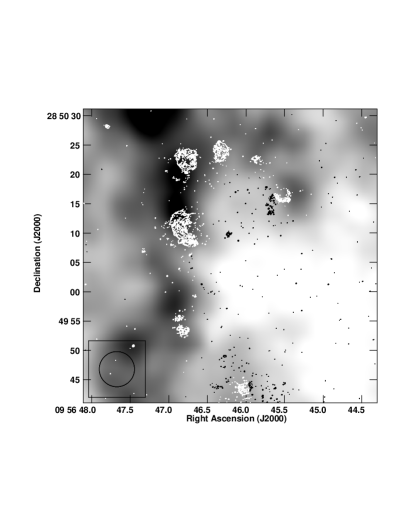
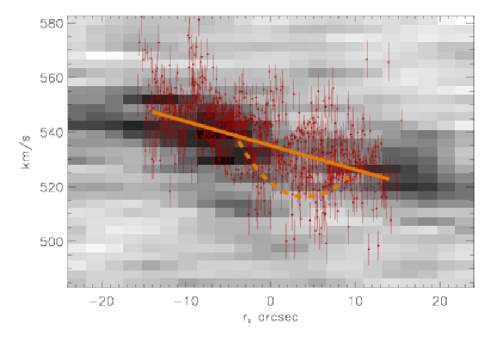
We estimated using the neutral and ionized gas velocity distribution along the broad cross-section including all Hii regions in the SGS with that is parallel to the disc minor axis. The respective P–V diagrams of both Hi (grey scale) and H velocity fields across the region of the SGS and its surroundings are shown in the right panel of Fig. 4. As one can see, despite the large scatter of H data, they match each other rather well. In regions near the major axis of a regular rotating flat disc, we expect a zero gradient of the line-of-sight velocities across the direction parallel to the minor axis of a galaxy. Therefore, the apparent gradient in this P–V diagram with the total velocity range of 30 km s-1 looks unexpected and implies disturbance of the regular disc rotation.
The centre of this P–V feature coincides with the position of the SGS and Hi hole, giving us an additional argument in favour of the hypothesis that the observed velocity gradient is caused by an expanding shell. The resulting values for the line-of-sight projection of the expansion velocity at the SGS borders ( 14 arcsec) fall in the range of km s-1 that corresponds to km s-1 with the uncertainty of 2.5 km s-1.
An alternative explanation of the velocity gradient in Figs. 3 and 4 lies in the tidally-induced streaming motions caused by the recent merger. However, we can present at least two arguments against its tidal origin:
-
1.
Indeed, the kinematical major axis derived from the galaxy velocity field is twisted with position angle deviated from . In the region of the SGS the kinematic position angle (see the velocity field in Fig. 2 by Cannon et al., 2014). However, when we construct the P–V diagram along the direction orthogonal to this ‘local’ major axis direction (i.e. along ), the linear velocity gradient across the SGS is still detected, while it falls to near zero value outside the SGS region ( arcsec). This fact indicates the local origin of the Hi velocity deviations in this region, seemingly related to the radial expansion in the galaxy disc.
-
2.
According to Fig. 4, the H velocities coincide very well with the linear fit to the P–V diagram on the borders of the SGS, while a blue excess is observed in the SGS centre up to 10–20 km s-1Ṫhe most reasonable interpretation of this feature is associated with the approaching part of the ionized gas expanding shell, a half of the classical ‘velocity ellipse’ (e.g. Figs. 6 and 10 in Egorov et al., 2014). The dashed curve in Fig. 4 fits this feature with 15 km s-1. Moreover, some pixels in Hi P–V diagram in this region appear to trace both the approaching and receding sides of the shell, but, unfortunately, the signal-to-noise is too low to make unambiguous conclusion. The most of Hi gas in this region is expected to be ionized and/or swept out.
Summarizing, we see that the two independent estimations: the first one based on the velocity gradient itself (the radial expansions in the disc) and the second one derived from the Hii velocities (expansion in the ’vertical’ direction) give the close values of the .
5.3 SGS expansion time
Adopting the current radius as 0.55 kpc and 13.51.5 km s-1, we derive the characteristic expansion time of 0.6 / Myr. This value indicates how long ago did the multiple SN explosions begin in the process of the intense SF episode in the central part of SGS, which provided the thermal and mechanical energy for the Hi shell expansion. If we add 3.5 Myr needed for an instantaneous star formation episode to explode its first SNe, we derive that the time since the SF began in the center of the SGS is 27.5 Myr.
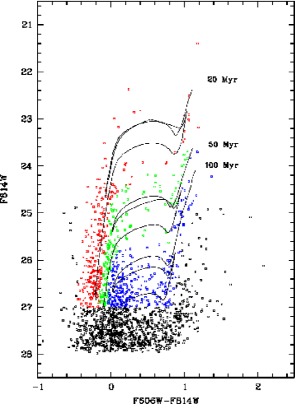
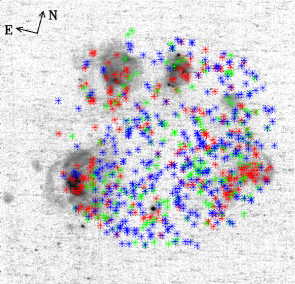
An independent indication for the delay between the SF episode near the central part of the SGS and on its perimeter regions is shown in Fig. 5. In the left panel, the CMD with the overlayed isochrones shows with red, green and blue colour, the stars respectively with the ages less than 20 Myr, and in the ranges 30–50 Myr and 50–100 Myr. In the right panel we show the spatial distribution of these age groups with respect to the SGS geometry as traced by the star-forming regions in the HST H image (in grey scale). The ‘young’ population (red asterisks) is highly concentrated along the SGS perimeter, grouping to the SF ‘Knots’ mentioned earlier. The stars with larger ages are distributed more evenly, which probably indicates a more homogeneous star formation on the time scale of 50–100 Myr and overlapping of different layers due to projection effects. Also, this does not exclude their origin near the SGS centre, since due to velocity dispersion of 10 km s-1 they are expected to travel during the lifetime to distances of several hundred parsec.
In the context of similarity of this SGS to other known objects, the SGS in DDO 68 has the size and expansion velocity well comparable with those in galaxy Holmberg II. As Egorov et al. (2014) show in their Fig. 1 for the SGS in IC 2754 in the H HST image, there are several clearly visible SF regions along the SGS borders. Moreover, they are related to the secondary H arcs/shells tracing the recent induced SF episodes on the SGS wall. These shells have sizes of 50 to 300 pc and characteristic expansion times of 1–4 Myr.
5.4 SGS morphology
Distribution of star-forming regions along the walls of a SGS described in the previous section hints at induced star formation related to the gas instability in the compressed shell and to collapse of matter swept by the expanding shell of the previous powerful starburst and related multiple supernova (SN) explosions (e.g., review by Elmegreen, 1998).
The ‘Northern ring’ delineates a supershell with the large Hi hole. This is clearly seen in the Hi-map of Fig.3 (right) of Ekta et al. (2008). In Fig. 4 (left) we present a fragment of the GMRT Hi-map with the beamwidth FWHM=55 superimposed on the HST H image of the SGS and its surroundings. One can see the strong decrease of Hi density in the interior of the SGS with respect to that at its periphery where the regions of current and recent SF shine.
Unfortunately, the available Hi data have rather low spatial resolution. Thus, using only Hi density and velocity distributions, we can not conclude unambiguously whether the observed neutral gas features are ‘local’ (that is directly related to the stellar feedback in the SGS region), or the Hi hole is a part of larger-scale Hi-structures related to a strong tidal disturbance. However, the whole set of the observed features (the Hi hole, the radial expansion of neutral and ionized gas, a relation between our estimates of the expansion time and stars ages, etc.) is very similar to those for SGSs observed with a higher spatial resolution in some of the aforementioned nearby galaxies. This allows us to believe that our main suppositions are true.
5.5 H shells and their properties
In the BTA H image of this region in PKP05 (their Fig. 1, seeing 17) most of Hii regions are only barely resolved and their structure is difficult to assess. The HST H image, with 20 times higher angular resolution and the higher dynamic range, allows one to distinguish multiple ionized gas arcs/rings with the typical sizes of 1″ to 4″, corresponding to linear diameters of 60 to 250 pc related to the regions of current or recent star formation. The larger the size, the lower the surface brightness (SB) of an arc/ring. The similar H morphology was observed in many nearby galaxies, including, e.g., the Local group late spiral M33 (Courtes et al., 1987) with the range of ring diameters of 40 to 280 pc.
One can see the large diversity in parameters of the second generation SF episodes and their descendants – from a rather loose complex related to Knot 4 through more powerful ones with the dominant luminous compact ‘knots/stars’ (Knots 1 and 3) to the very compact star complex identified as the ‘Young Stellar Cluster’ (Knot 5). One of the reasons for this broad diversity is probably related to the ambient gas inhomogeneity and lumpiness. The most compact newly formed stellar aggregate, YSC, had formed on the southern part of SGS front, bordering the region of very low gas density as seen in Fig. 4.
The brightest SF region Knot 1 appears as a collection of fragments of seven H arcs with the SB (surface brightness) decreasing with the arc/ring radius. The two brightest and smallest arcs/rings with the characteristic radii of 08 (48 pc) and 10 (60 pc) look like they are crossing (in projection?) each other (with the separation between their centers of 1″) and appear close to the group of at least 15 bright compact SF subregions either unresolved (01, or 6 pc) or with the typical sizes of 6–12 pc. At least a half of them ’stick’ to the arcs or appear rather close to them. Five other lower SB arcs with radii of 2″ (120 pc) to 4″ (250 pc) encompass this region. Their centres of expansion are displaced each from other up to several arc seconds (or more than 100–150 pc in projection).
Unfortunately, our FPI data (the final seeing 18) barely resolve the spatial structure of this region. Nevertheless, the H kinematics maps reveal some interesting details in Knot 1 (Fig. 3). Namely, there is a difference of the line-of-sight velocities up to 20–22 km s-1 from the centre to the region border as well as an increase of the ionized gas velocity dispersion on the border of Knot 1 where the low SB arcs appear on the HST image (see above). The mean velocity dispersion in these regions is about 29 km s-1 which corresponds to km s-1 after correction for the natural width of the emission line and its thermal broadening (see eq. (1) in Moiseev & Lozinskaya, 2012). If we accept 27 km s-1 and 5″ (310 pc), then the dynamical age of Knot 1 emission shell is about 7 Myr.
As the estimates of the possible shell ages, presented above, imply, this picture indicates the continuing active SF on the time scale of a few Myr at least in seven different sites within the region of the characteristic size of 100 pc. While this sequence of SF events was apparently triggered by the gas instabilities in the compressed supershell, we also see the secondary triggered SF knots situated along the brightest H arcs.
SF region Knot 2 is much fainter in H. There are two brighter compact SF subregions and several fainter ones in this region. Most of them are either close to or ’stuck’ to the arcs of 2 shells with radii of 2″. There is a hint of a very low SB arc separated at 4″ to the E.
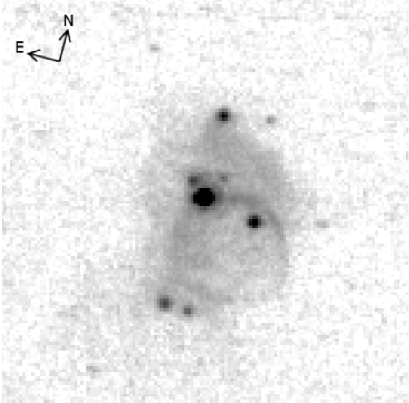
SF region Knot 3 displays one almost round shell with the size of 19 by 17. Several compact subregions with sizes of 02 are situated close to the shell or to the adjacent arc to the N. The brightest one sits right on the shell. This subregion contains the LBV (DDO68-V1). In fact, as its light profile shows, it is well fit by the PSF. So, the star-like LBV with its expected parsec-scale shell (0015 at the distance of DDO 68) dominates the light of this subregion.
There are two faint arcs related to SF region Knot 4 which encompass four compact SF subregions. Their diameters are 3″ and 17. One more faint H nebulosity with the size of 17 is apparent along the same Northern supershell between SF Knots 3 and 4. But no compact subregions are detected within this nebulocity. The FPI ionized gas velocity dispersion map demonstrates a peak of velocity dispersion in the center of this SF region, which is to be expected in the case of a simple expanding shell (Muñoz-Tuñón et al., 1996; Moiseev & Lozinskaya, 2012). Using the same techniques as above for Knot 1, we estimated the corrected velocity dispersion km s-1 and the respective dynamical age of Knot 4 of 4 Myr for the region radius 25 (155 pc).
SF region Knot 5 is a ’closing unit’ of the chain, forming the perimeter of the SGS. It is related to the young stellar cluster with the estimated age of 22 Myr (see PKP05). It has an almost unresolved core (02) and the surrounding halo with the overall size of 06. This is, probably, evidence to the remnant of the related Hii region of low excitation. It is curious that region Knot 5 is the only one where no traces of H arcs are visible. This either hints at a much lower density of the ambient gas with respect to the other regions, or at their premature formation and dissolving, or both.
All this complex morphology seen as a combination of arcs from the expanding shells and compact bright objects with the linear sizes of 15 to 50 pc, situated preferably very close to the arcs brightest edges, apparently indicates to the induced hierarchical star formation over the course of the last 30 Myr.
| N | Hii-reg. | |||||
|---|---|---|---|---|---|---|
| px | px | mag | mag | mag | Numb. | |
| 1 | 3455.8 | 622.9 | 20.05 | –0.10 | –10.52 | 3, LBV |
| 2 | 2933.4 | 925.2 | 21.47 | 0.33 | –9.11 | 6 |
| 3 | 3447.8 | 605.9 | 22.72 | 0.30 | –7.86 | 3 |
| 4 | 3076.0 | 923.8 | 22.93 | 0.15 | –7.65 | 6: |
| 5 | 3295.5 | 504.4 | 23.00 | 1.56 | –7.58 | 4 |
| 6 | 3222.6 | 518.3 | 23.10 | 0.06 | –7.49 | 4 |
| 7 | 3139.7 | 651.2 | 23.30 | 0.40 | –7.28 | 5 |
| 8 | 3243.8 | 476.5 | 23.35 | 0.13 | –7.24 | 4 |
| 9 | 3461.8 | 615.7 | 23.38 | 0.50 | –7.20 | 3 |
| 10 | 2986.9 | 852.1 | 23.41 | –0.11 | –7.17 | 6 |
| 11 | 2927.5 | 938.2 | 23.42 | -0.16 | –7.16 | 6 |
| 12 | 3245.1 | 493.5 | 23.47 | –0.10 | –7.11 | 4 |
| 13 | 3213.6 | 825.5 | 23.81 | -0.09 | –6.77 | 1 |
| 14 | 3243.9 | 475.6 | 23.95 | –0.13 | –6.63 | 4 |
| 15 | 3302.7 | 611.3 | 23.96 | 1.41 | –6.62 | 4: |
| 16 | 3301.0 | 568.9 | 23.98 | –0.07 | –6.60 | 4: |
| 17 | 2985.9 | 850.1 | 24.09 | 0.21 | –6.49 | 6 |
| 18 | 3236.4 | 836.2 | 24.13 | –0.36 | –6.45 | 1 |
| 19 | 3393.2 | 749.1 | 24.13 | –0.21 | –6.45 | 2 |
| 20 | 3255.3 | 493.9 | 24.15 | –0.18 | –6.43 | 4 |
| 21 | 3158.5 | 693.0 | 24.22 | 0.25 | –6.36 | 5 |
| 22 | 3372.9 | 468.4 | 24.26 | 0.24 | –6.32 | 4 |
| 23 | 3256.2 | 497.2 | 24.27 | -0.22 | -6.31 | 4 |
| 24 | 3480.9 | 599.8 | 24.30 | 1.32 | -6.28 | 3 |
| 25 | 3223.5 | 798.4 | 24.32 | -0.09 | -6.26 | 1 |
| 26 | 3205.6 | 830.8 | 24.35 | -0.70 | -6.24 | 1 |
| 27 | 3286.0 | 468.3 | 24.35 | -0.16 | -6.23 | 4 |
| 28 | 3179.5 | 622.7 | 24.30 | 0.22 | -6.23 | 5 |
| 29 | 3444.8 | 728.7 | 24.36 | 1.41 | -6.22 | 2 |
| 30 | 3179.6 | 846.4 | 24.36 | -0.15 | -6.22 | 1 |
| 31 | 3481.9 | 614.8 | 24.39 | -0.54 | -6.19 | 3 |
| 32 | 3251.1 | 521.6 | 24.40 | -0.11 | -6.18 | 4 |
| 33 | 3210.2 | 518.4 | 24.40 | -0.52 | -6.18 | 4 |
| 34 | 3166.2 | 811.7 | 24.41 | 0.24 | -6.17 | 1 |
| 35 | 3439.9 | 605.8 | 24.43 | -0.18 | -6.15 | 3 |
| 36 | 3213.8 | 837.4 | 24.46 | -0.37 | -6.12 | 1 |
| 37 | 2883.0 | 925.1 | 24.47 | -0.28 | -6.11 | 6 |
| 38 | 3348.9 | 687.8 | 24.48 | 0.03 | -6.10 | 2: |
| 39 | 3404.2 | 744.0 | 24.49 | -0.20 | -6.09 | 2 |
| 40 | 3181.3 | 821.8 | 24.49 | 1.41 | -6.09 | 1 |
| 41 | 3174.5 | 828.4 | 24.49 | -0.07 | -6.09 | 1 |
| 42 | 3156.2 | 669.4 | 24.50 | -0.02 | -6.08 | 5 |
| 43 | 2917.5 | 909.3 | 24.50 | 0.08 | -6.08 | 6 |
| 44 | 3256.3 | 741.8 | 24.52 | 0.55 | -6.06 | 1 |
| 45 | 2951.0 | 918.2 | 24.53 | 1.44 | -6.05 | 6 |
| 46 | 2883.1 | 930.4 | 24.53 | -0.16 | -6.05 | 6 |
| 47 | 3218.5 | 822.2 | 24.54 | -0.22 | -6.04 | 1 |
| 48 | 3385.0 | 496.4 | 24.55 | 0.07 | -6.03 | 4 |
| 49 | 3449.6 | 742.4 | 24.56 | -0.30 | -6.02 | 2 |
| 50 | 2909.9 | 949.5 | 24.56 | -0.23 | -6.02 | 6 |
6 The list of the most luminous extremely metal-poor star in DDO68
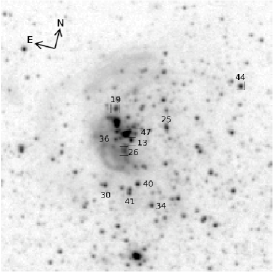
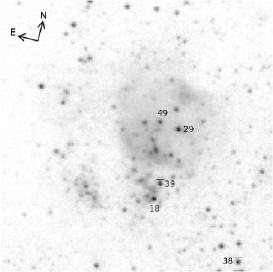
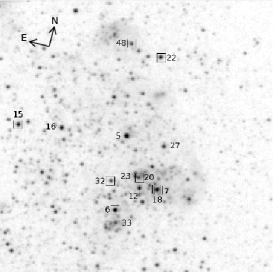
We have selected a number of the brightest stars from the colour-magnitude diagram. The absolute magnitudes of this subsample stars are limited by –6.0 mag. In addition, the list is limited only by the stars whose positions correspond to the regions of current or recent star formation with the measured Hii region record low O/H (Z⊙/35). These regions are well seen in the HST/ACS H image as ring/arc plus compact source complexes. This additional selection criterion is applied in order to pick out only the most metal-poor massive stars. This is necessary, since in contrast to the most dwarf galaxies with small metallicity variations, in DDO 68, as mentioned in the Introduction, stars show very large range of metallicities. This is presumably due to the merger of two dwarfs with very different .
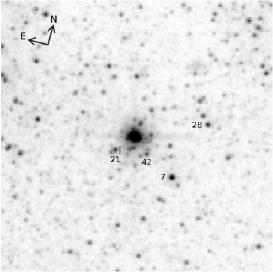
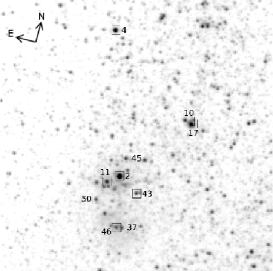
The resulting list of such luminous stars is presented in Table 5. It includes coordinates of the stars in the ACS/WFC2 frame, their uncorrected magnitudes and colours corrected for the Galaxy foreground extinction ( = 0.02m according to Schlafly, Finkbeiner (2011)), their absolute magnitudes and the number of the SF region which this star is supposed to be associated to. We also provide the finding charts of all the selected stars arranged on their parent SF region (see Fig. 9, 10, 12). The amount of stars and the limiting luminosity had been adopted in a rather arbitrary manner. The main criterion was to pick up a reasonable number of the most luminous extremely metal-poor stars accessible for spectral investigation with the next generation giant optical telescopes and to make sure this list is not too large.

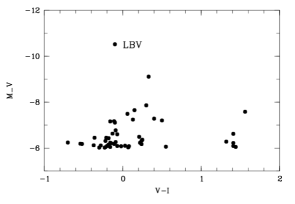
The sample appears to be rather diverse with colours in the range from –0.5 to +1.4 (see Fig. 6). Massive O-type stars from the main sequence to supergiants, with and B-type giants and supergiants (with ) comprise about a half of the most luminous stars. A-supergiants (with ) and F-supergiants (with ) each comprise 20 %. Finally, K and early M supergiants with with comprise 12 %.
Since there are many types of variable stars among supergiants, one can hope to discover such objects with the HST, similar to the detection of Cepheids in IZw18 (Aloisi et al., 2007). In fact, many of them can already be monitored to search for optical variability with the medium-size telescopes installed at the sites with superb visibility. Therefore, to avoid the future confusions in case of discovery of new variables in DDO68, we suggest the alternative name for the DDO68 LBV as DDO68-V1 according to the common nomenclature for extragalactic resolved variables.
The catalogs of the most luminous stars in the nearby galaxies based on the HST images are very important and popular among the researchers studying properties of massive stars. They include both galaxies in the Local Group (LMC and SMC, M 31, M 33) and more distant representatives of the Local Volume (e.g., M 101 Grammer & Humphreys (2013), IC 2574). In this paper we are interested in the most luminous and young stars related to the lowest metallicity regions in the nearby Universe. They deserve a more detailed study in order to get insights into the evolution and feedback effects of massive stars in the early Universe.

Images of the individual SF regions (Knots 1–7) in both and H, shown in Fig. 10 and subsequent ones, allow one to identify the most luminous stars in these most metal-poor environments as the attractive targets for stellar studies with the next generation ELTs. Besides, careful examination of these images allows one to separate a subsample of luminous stars, which are substantially isolated, so that the images with large- and medium-class ground-based telescopes under the seeing of 03 (such as CFHT, Keck, Gemini North) can be used for regular monitoring and discovery of massive variables of WR or LBV types with the record low metallicity.
It is worth mentioning that there exist two closer SF dwarf galaxies with very low metallicities. One is the dIrr galaxy with the gas metallicity of ⊙/24 (12+(O/H)=7.30), residing much closer than DDO 68. This is UGCA 292 at the distance of 3.6 Mpc, with = –11.8. Its SF activity occurs in two main Hii regions and the available HST data allow one to identify about ten the most luminous stars with of –6.3 to –8.3 (= 21.5 to 19.5) (e.g. Bomans & Weis (2011b)). These luminous very low-metallicity stars also deserve further detailed studies, but in the context of better understanding of the most metal-poor star evolution, the DDO 68 representatives look at least equally attractive.
Another interesting very small galaxy Leo P with ⊙/32 (12+(O/H)=7.17) was recently discovered in the close surrounding of the Local Group, at D=1.62 Mpc (McQuinn et al. (2015) and references therein). Its integrated absolute magnitude = –9.3. Its most luminous star, which ionizes the only Hii region in this galaxy, has –4.4 and is probably a binary of O7 stars. The fainter ones of its most luminous stars are B2–B3 class.
Of somewhat more distant dwarfs in the nearby Universe with the record low gas metallicity and numerous young massive stellar population, the most prominent is, of course, the blue compact dwarf IZw18 (12+(O/H)=7.17) with a range of distance estimates of 14–15 (Izotov & Thuan, 2004) to 19 Mpc (Aloisi et al., 2007; Contreras Ramos et al., 2011).
We also mention two new Lynx-Cancer void extremely gas-rich LSB dwarfs. One is SDSS J070623.43+302051.3 (a companion of UGC 3672) at the comparable distance of 17 Mpc, with the tentative record-low oxygen abundance of 12+(O/H)=7.03 (Pustilnik, Perepelitsyna, Kniazev, 2016; Chengalur et al., 2016). Its star-forming region is much less prominent than those in IZw18. However, it is comparable or brighter than the SF regions of DDO 68 and with the estimated age of a starburst of 8 Myr should host late O and early B stars.
The second galaxy is also a very gas-rich and record-low metallicity (12+(O/H)=7.02) dwarf known as SDSS J094332.35+332657.6 (Hirschauer et al., 2016). It was found as an optical counterpart of a new Hi source AGC198691 from the blind Hi ALFALFA survey (Haynes et al., 2011). For its kinematic distance of 10.8 Mpc (assumed to be the same as for its probable companion UGC 5186), its absolute magnitude is . While its HST CMD is not yet published, the derived H luminosity (H) (1–2) erg s-1 (based on the data from Hirschauer et al. (2016)) implies that the galaxy can have several stars of O7V class.
It is also worth mentioning two other extremely metal-poor dwarfs in the Lynx-Cancer void: SDSS J0926+3343 with 12+(O/H)=7.12 (Pustilnik et al., 2010) and SDSS J0812+4836 with 12+(O/H)=7.26 (Izotov & Thuan, 2007) at the estimated distances of 10.6 and 11.1 Mpc and with absolute magnitudes of –12.91 and –13.08 (Pustilnik, Tepliakova, 2011; Perepelitsyna, Pustilnik, Kniazev, 2014), respectively. They are currently somewhat less active, with the ages of their starbursts of 7 Myr and 11 Myr, respectively (as derived on their EW(H) via comparison with the Starburst99 package models (Leitherer et al., 1999)). However, the search for their luminous young stars can also reveal interesting targets for the next generation of giant telescopes.

7 DISCUSSION
7.1 The LBV variability in the context
The typical LBV variability includes variations of 0.1m–0.2m on short (1 day – weeks) timescale and the irregular variations of up to amplitude on a timescale of years (called also ’normal eruptions’). During these variations, occurring at ’constant’ bolometric luminosity, their spectral type usually varies from early B supergiant at minimums to late B or early A near maxima (e.g., Humphreys & Davidson (1994); Drissen, Roy & Robert (1997); Drissen et al. (2001); Crowther (2004); Massey et al. (2007); Walborn et al. (2011)). The largest light variations, with brightening by more than 3m, are related to ’giant eruptions’, in which the mass-loss rate increases by orders of magnitude and bolometric luminosity increases as well. Such events are extremely rare among known LBVs. In our Galaxy, they are registered only for two classic LBVs: Car and P Cyg. Among LBVs in nearby galaxies only a handful of giant eruptions were discovered.
Despite the fact that the amount of photometric and spectroscopic data for DDO68-V1 is very modest, it is useful to make the preliminary comparison with other well studied LBVs with giant eruptions. One of them is NGC2363-V1 at 3.4 Mpc, for which the giant eruption had taken place since the end of 1993. Starting from –6.5 mag, it reached the maximum of lightcurve at –10.5 mag at the end of 1997 and then gradually faded by 0.3 mag during the next 7 years (Drissen, Roy & Robert, 1997; Drissen et al., 2001; Petit, Drissen & Crowther, 2006). In course of this fading in , its UV flux was growing by about 0.6m, so its bolometric luminosity had increased during this period.
The behaviour of DDO68-V1 (Fig. 1, bottom) shows substantial differences with respect of the lightcurve of NGC2363-V1. The whole range of light variations 3.6m (–6.95 –10.58) is quite similar to that of NGC2363-V1. However, while for NGC2363-V1 we see more or less monotonic luminosity increase during 5 years, for DDO68-V1 the pre-eruption activity was rather strong. In particular, before the ’deep’ minimum at the end of 2004 and the beginning of 2005, in April 2004 (SDSS image), the LBV was in an intermediate phase, 1.5m fainter than for the eruption peak -magnitude. It also was in an intermediate phase and near the maximum, according to Knot 3 light photometry in by Bomans & Weis (2011b), in the period between 1993 and 2001. It is probable that DDO68-V1 was close to the maximum optical light in 1955 (also as measured by Bomans & Weis (2011b), based on the POSS photoplates).
Due to the poorly documented, but seemingly rather erratic (unpredictable) and strong variability of DDO68-V1, it can be a fainter analog of an unusual (’persistent’) extragalactic LBV known as UGC 2773-OT (Smith et al., 2016). While this is a very tempting option, it would be crucial to conduct its regular multiband monitoring to have a more certain classification of LBV DDO68-V1.
As Smith & Owocki (2006) discuss, the series of such giant eruptions in LBVs, which form several expanding shells, can precede their SN explosions on a rather short time scale. The most recent example of such an event is presented in Vinko et al. (2015); Richardson, Artigau (2015) and references therein, where the LBV/SN impostor in galaxy NGC 2770 exploded as SNII within a period of just three months after its giant eruption. Thus, if the erratic variability of this LBV will be confirmed, DDO68-V1 can be a good candidate to study progenitors of SN with the lowest metallicity in the nearby Universe.
The only issue that remains open in qualifying the recent DDO68-V1 large amplitude variations as giant eruptions is its unique low metallicity. The constant bolometric luminosity, characteristic of variations with 2m (’normal eruptions’) is the empiric fact derived from the studies of much more metal-rich LBVs. Since this is not yet well understood and based on models, in principle one can suggest that for the most metal-poor LBV representatives, like DDO68-V1, the range of large -band variations with the constant bolometric luminosity can be wider. Therefore, to firmly confirm DDO68-V1 giant eruption(s), it is crucial to extend the monitoring of this LBV to the wider wavelength range to see how its spectral energy distribution (SED) and bolometric luminosity vary during the large visual brightening.
7.2 DDO 68-V1 spectral variations in comparison to the known LBVs
The described relation of Hei(4471) flux with the LBV -band luminosity differs from that found in the systematic study of LBV V532 in the Local Group galaxy Messier 33 (Sholukhova et al., 2011; Fabrika et al., 2005). They found that during eleven years variations, (Hei 4471) and (Hei 5876) correlated with V532 optical luminosity variations for the total amplitude of 1.6m. The total range of light variations in this LBV is known to be 2.5m, with the minimum level of –6.1.
On the other hand, the fluxes of Hei lines in DDO68-V1 show the behaviour somewhat similar to that of the well-studied LBV NGC 2363-V1 (Petit, Drissen & Crowther, 2006). Due to the complicated environment, the spectra of this LBV was possible to observe only with the HST. The collection of its UV-optical spectra was obtained during seven years, starting from the maximum of the ’giant eruption’ in 1997. band flux after 1 year fluctuations dropped gradually during this period by 0.3m while the UV continuum varied in the counterphase and increased by 0.6m. Fluxes of Hei lines (and in particular, Hei 4471 and Hei 5876) varied in the opposite sense with respect of band changes. They were faint (Hei 5876) or in absorption (Hei 4471) near the maximum of the lightcurve. Then they were strongly rising to the epoch of the conditional (local) ’minimum’: Hei 5876 flux increased by factor 5–6, while Hei 4471 as well as other faint Hei lines became well detected in emission. At the same time, the fluxes of Balmer lines gradually decreased during this LBV evolution, with F(H) drop by a factor of 4. Without more details, we can summarize that in this LBV the fluxes of Hei lines grow several-fold when the LBV gets dimmer in -band after the giant eruption, while the fluxes of Balmer emission lines drop by comparable amount.
The comparison of Balmer and Hei line flux variations in DDO68-V1 with the well-studied LBVs described above leads one to the following conclusions. For its current rather small statistics, fluxes of Hei lines in DDO68-V1 changed more or less similar to those of NGC 2363-V1 near its maximum light phase. For DDO68-V1 Balmer line flux variations, the situation is somewhat unusual. While for H we have only two estimates, we use in the following only data for the flux of H. This appeared about the same (and about the average over the whole set) for dates separated by 76 days, when the LBV was in the maximum and in the phase of 2m fainter. Furthermore, in 10 months after the maximum when the LBV -band luminosity dropped by 50 %, the flux F(H) had increased by the same 50 %.
It is difficult to find an evident cause of such Balmer line behaviour. One of the possible reasons could be the aforementioned unusual erratic activity of DDO68-V1 during several last decades, which forms the sequential (interacting?) shells/winds. In this case the simple correlations visible in NGC 2363-V1 giant eruption phase may not work.
8 Summary
We summarize the presented results and the discussion above and draw the following conclusions:
-
1.
One of the brightest stars on the HST images of the void galaxy DDO 68 is identified with the DDO 68 Luminous Blue Variable (LBV) discovered in January 2008 (also DDO68-V1). We present the new BTA photometry of Hii region Knot 3 (containing the LBV) complemented with the photometry from the resolved HST images and from the SDSS image archive. The HST images allow one to measure separately the light from the LBV and the underlying Hii region and to use the latter in the analysis of the ground-based data of this complex. Along with the analysis of new and old spectra of this region at several epochs, this data, for the first time, allows one to determine the reliable amplitude of the LBV lightcurve. All available data suggest that the LBV magnitude varied during the last decade in the range of 20.0 to fainter than 23.6 mag. This corresponds to range of fainter than –6.95 to –10.58. If one combines our lightcurve since 2004 with the earlier estimates of Knot 3 magnitudes from Bomans & Weis (2011b) since 1955, the high LBV state assumed to relate to giant eruptions, was also reached in 1955 and in 1999. If photometric behaviour of the most metal-poor LBVs is similar to more typical LBVs, the DDO68-V1 light variations during the last 20 (60) years suggest that it probably underwent the giant eruptions. Multiwavelngth monitoring would be useful to prove the substantial increase of the LBV bolometric luminosity.
-
2.
To the spectra of the LBV obtained in January, February and March 2008, we added one more obtained at BTA in January 2009. Despite the very modest amounts of spectral data, we try to compare them with known LBVs in the giant eruption phase. All spectra of DDO68-V1 are analyzed together to establish some common or atypical features, which are important in the context of very low metallicity of the LBV progenitor. We confirm the P-Cyg profiles in the Balmer hydrogen lines and the terminal wind velocity of 800 km s-1. We find a substantial decrease of line fluxes of Hei4471 and 5876 Å while the LBV -band luminosity increased by , in general consistent with Hei line flux changes in giant eruption phase in other LBVs. However, fluxes of Balmer emission lines do not show clear correlation with the LBV luminosity. This hints to an unusual LBV type. However, due to the small volume of statistical data, the results of additional spectral observations of DDO68-V1 will be crucial.
-
3.
The prominent DDO 68 ’Northern ring’ of SF regions is examined using the HST data, the BTA FPI H data and the GMRT Hi-maps. All combined data are consistent with the scenario of the powerful SF episode near the ’Northern ring’ center lasting for tens Myr since 30 Myr ago. Cumulated action of multiple SNe resulted in a supergiant shell (SGS) with the observed diameter of 1.1 kpc. The instabilities in the SGS gas layer have induced the second generation Star Forming complexes seen on the ground-based images as six regions along the SGS perimeter. On the HST images, these SF regions show complex substructure including multiple luminous stars and multiple arc and ring structures with radii of 50 to 200 pc. They are related with SF episodes in these complexes. With 20 km s-1, their kinematical ages fall in the range of 1–7 Myr. Accounting for the delay of SN explosions of 3.5 Myr since the SF onset, they are consistent with the independent estimates of young SF region ages (3–7 Myr). For majority of these secondary SF complexes, in the vicinity of the brightest (youngest) arcs, one finds compact SF knots with sizes close to the resolution limit (12 pc). They may represent the next generation of the induced SF in the ’Northern ring’. The LBV DDO68-V1 looks to belong to this generation since it is situated very close to the related H arc.
-
4.
Using the HST archive F606W and F814W images of DDO 68, we compile the list of the most luminous stars in the regions of the latest active SF, in which the measured ionized gas metallicity is at the level of ⊙/35. The total number of such stars brighter than () is about half a hundred. These massive diverse young stars (from O to M supergiants), by their origin in the aforementioned star-forming regions, are the most metal-poor massive stars in the nearby Universe. They will be accessible for the detailed studies with the next generation of giant ground-based (like E-ELT and TMT) and space telescopes (JWST). Therefore, they are among the best candidates for comparison with predictions of the modern models of massive star evolution at very low metallicities. As preparation for detailed studies, a fraction of these stars can be monitored for optical variability with the existing medium-size ground-based telescopes located in the sites with the superb visibility.
Acknowledgements
The results for the LBV, H shells and sequential induced episodes of star formation are obtained with the support from RSCF grant No. 14-50-0043 to SAP and YAP. AVM is grateful for the financial support via the grant MD3623.2015.2 from the President of the Russian Federation. We thank the anonymous referee for many useful advises, questions and suggestions which allowed us to improve the paper. SAP thanks Y.I. Izotov for stimulating conversations during the very early stages of this work. We are pleased to thank J. Chengalur and E. Egorova for help with GMRT high resolution Hi-map and S. Fabrika and O. Sholukhova for consultation on spectral variability of LBVs. Observations at the 6-m telescope BTA are supported by funding from the Russian Federation Ministry of Education and Science (agreement No 14.619.21.0004, project identification RFMEFI61914X0004). Some of the results in this article are based on observations made with the NASA/ESA Hubble Space Telescope, and obtained from the Hubble Legacy Archive, which is a collaboration between the Space Telescope Science Institute (STScI/NASA), the European Space Agency (ST-ECF/ESAC/ESA) and the Canadian Astronomy Data Centre (CADC/NRC/CSA). The HST observations presented in this work are associated with program 11578 (PI A.Aloisi). We acknowledge the use of the SDSS DR7 database. Funding for the Sloan Digital Sky Survey (SDSS) has been provided by the Alfred P. Sloan Foundation, the Participating Institutions, the National Aeronautics and Space Administration, the National Science Foundation, the U.S. Department of Energy, the Japanese Monbukagakusho, and the Max Planck Society. The SDSS Web site is http://www.sdss.org/. The SDSS is managed by the Astrophysical Research Consortium (ARC) for the Participating Institutions.
References
- Abazajian et al. (2009) Abazajian K.N., Adelman-McCarthy J.K., Agüeros M.A. et al., 2009, ApJS, 182, 543
- Afanasiev, Moiseev (2005) Afanasiev V.L., & Moiseev A.V., 2005, Astron. Lett. 31, 193
- Aloisi et al. (2007) Aloisi A., Clementini G., Tosi M., et al., 2007, ApJ Lett., 667, 151
- Annibali et al. (2016) Annibali F., Nipoti C., Ciotti L., Tosi M., Aloisi A., et al., 2016, accepted to ApJ Lett. (arXiv:1607.02628)
- Barkana & Loeb (2001) Barkana R. & Loeb A., 2001, Phys. Reports, 349, 125 (arXiv:astro-ph/0010468)
- Bomans & Weis (2011a) Bomans D.J., and Weis K., 2011, Bulletin de la Societe Royale des Sciences de Liége, 80, 341
- Bomans & Weis (2011b) Bomans D.J., and Weis K., in Proc. IAU, Active OB stars: structure, evolution, mass loss and critical limits, G. Neiner, G.Wade, G.Meynet & G.Peters, eds. 2011, v.272, pp. 255-270
- Cannon et al. (2014) Cannon J.M., Johnson M., McQuinn K.B.W., et al., 2014, ApJ Lett., 787, 1
- Chen et al. (2015) Chen Y., Bressan A., Girardi L., Marigo P., Kong X., Lanza A., 2015, MNRAS, 452, 1068
- Chengalur, Pustilnik (2013) Chengalur J.N., Pustilnik S.A., 2013, MNRAS, 428, 1579
- Chengalur et al. (2016) Chengalur J.N., Pustilnik S.A., Egorova E.S., 2016, MNRAS, in press (arXiv:1611.01271), DOI: 10.1093/mnras/stw2841
- Contreras Ramos et al. (2011) Contreras Ramos R., Annibali F., Fiorentino G., et al., 2011, ApJ, 739, 74
- Courtes et al. (1987) Courtes G., Petit H., Sivan J.-P., Dodonov S., Petit M., 1987, A&A, 174, 28
- Crowther (2004) Crowther P., 2004, in Evolution of Massive Stars, Mass Loss and Winds, ed. M.Heydary-Malayeri, Ph.Stee & J.-P. Zahn, EAS Publications Series, v.13, 119
- Drissen, Roy & Robert (1997) Drissen L., Roy J.-R., Robert C., 1997, ApJ, 474, 138
- Drissen et al. (2001) Drissen L., Crowther P.A., Smith L.J., Robert C., Roy J.-R., Hillier D.J., 2001, ApJ, 546, 481
- Egorov et al. (2014) Egorov O.V., Lozinskaya T.A., Moiseev A.V., Smirnov-Pinchukov G.V., 2014, MNRAS, 444, 376
- Ekta et al. ( 2008) Ekta, Chengalur J.N., Pustilnik S.A., 2008, MNRAS, 391, 881
- Elmegreen (1998) Elmegreen B.G., 1998, ORIGINS, ASP Conference Series, 148, 150 C.E. Woodward, J.M. Shull, and H.A. Thronson, eds.
- Fabrika et al. (2005) Fabrika S., Sholukhova O., Becker T., Afanasiev V., Roth M., Sanchez S.F., 2005, A&A, 437, 217
- Grammer & Humphreys (2013) Grammer S., Humphreys R.M., 2013, AJ, 146, A114
- Haynes et al. (2011) Haynes M.P., Giovanelli R., Martin A.M., et al. 2011, AJ, 142, 170
- Hirschauer et al. (2016) Hirschauer A.S., Salzer J.J., Skillman E.D., et al. 2016, ApJ, 822, 108
- Humphreys & Davidson (1994) Humphreys R.M., & Davidson K., 1994, PASP, 106, 1025
- Izotov & Thuan (2004) Izotov Y.I., Thuan T.X., 2004, ApJ, 616, 768
- Izotov & Thuan (2007) Izotov Y.I., Thuan T.X., 2007, ApJ, 665, 1115
- Izotov & Thuan (2009) Izotov Y.I., Thuan T.X., 2009, ApJ, 690, 1797
- Izotov et al. (2011) Izotov Y.I., Guseva N.G., Fricke K.J., Henkel C., 2011, A&A, 533, A25
- Kniazev, Pustilnik (2006) Kniazev A.Y., Pustilnik S.A., in Whitelock P., Dennefeld M., Leibundgut B. eds. The Scientific Requirements for Extremely Large Telescopes, Proc. of IAU Symp. 232, Cambridge, Cambridge University Press, 2006, pp.306-307
- Leitherer et al. (1999) Leitherer C., Schaerer D., Goldader J.D., et al., 1999, ApJS, 123, 3
-
Lupton et al. (2005)
Lupton R., et al. 2005,
http://www.sdss.org/dr5/algorithms
/sdssUBVRITransform.html#Lupton2005 - Mac Low & McCray (1988) Mac Low M.M., & McCray R., 1988, ApJ, 324, 776
- Makarov et al. (2016) Makarov D.I., Makarova L.N., Pustilnik S.A., Borisov S.B., 2016, MNRAS, in press
- Massey et al. (2007) Massey P., McNeill R.T., Olsen R.A.G., Hodge P.W., Blaha C., Jacoby G.H., Smith R.C., Strong S.B., 2007, AJ, 134, 2474
- McQuinn et al. (2015) McQuinn K.B.W., Skillman E.D., Dolphin A., et al., 2015, ApJ, 815, L17
- Moiseev (2014) Moiseev A.V., 2014, Astrophys. Bull., 69, 1
- Moiseev et al. (2010) Moiseev A.V., Pustilnik S.A., Kniazev A.Y., 2010, MNRAS, 405, 2453
- Moiseev & Lozinskaya (2012) Moiseev A.V., Lozinskaya T.A., 2012, MNRAS, 423, 1831
- Moiseev et al. (2015) Moiseev A.V., Tikhonov A.V., Klypin A., 2015, MNRAS, 449, 3568
- Muñoz-Tuñón et al. (1996) Muñoz-Tuñón C., Tenorio-Tagle G., Castañeda H.O., Terlevich R., 1996, AJ, 112, 1636
- Perepelitsyna, Pustilnik, Kniazev (2014) Perepelitsyna Y.A., Pustilnik S.A., Kniazev A.Y., 2014, Astrophys.Bull., 69, 247 (arXiv:1408.0613)
- Petit, Drissen & Crowther (2006) Petit V., Drissen L., Crowther P.A., 2006, AJ, 132, 1756
- Puche et al. (1992) Puche D., Westpfahl D., Brinks E., Roy J.-R., 1992, AJ, 103, 1841.
- Pustilnik, Tepliakova (2011) Pustilnik S.A., Tepliakova A.L., 2011, MNRAS, 415, 1188
- Pustilnik, Kniazev, & Pramskij (2005) Pustilnik S.A., Kniazev A.Y., Pramskij A.G. 2005, A&A, 443, 91 (PKP05)
- (46) Pustilnik S.A., Tepliakova A.L., Kniazev A.Y., 2008, Astron.Lett., 34, 457 (arXiv:astro-ph/0712.4007)
- Pustilnik et al. (2008b) Pustilnik S.A., Tepliakova A.L., Kniazev A.Y., Burenkov A.N., 2008, MNRAS Lett., 388, L24
- Pustilnik et al. (2010) Pustilnik S.A., Tepliakova A.L., Kniazev A.Y., Martin J.-M., Burenkov A.N., 2010, MNRAS, 401, 333
- Pustilnik et al. (2011) Pustilnik S.A., Martin J.-M., Tepliakova A.L., Kniazev A.Y., 2011, MNRAS, 417, 1335
- Pustilnik, Perepelitsyna, Kniazev (2016) Pustilnik S.A., Perepelitsyna Y.A., Kniazev A.Y., 2016, MNRAS, 463, 670
- Richardson, Artigau (2015) Richardson N, Artigau E., 2015, ATel, #7541
- Sacchi et al. (2016) Sacchi E., Annibali F., Cignoni M., Aloisi A. et al., 2016, ApJ, 830, 3
- Schlafly, Finkbeiner (2011) Schlafly E.F., & Finkbeiner D.P., 2011, ApJ, 737, article id. 103
- Sholukhova et al. (2011) Sholukhova O.N., Fabrika S.N., Zharova A.V., Valeev A.F., Goransky V.P., 2011, Astrophys.Bull. 66, 123 (arXiv/1105.0123)
- Sirianni et al. (2005) Sirianni M., Jee M.J., Benitez N., et al., 2005, PASP, 117, 1049
- Smith (2014) Smith N., 2014, ARAA, 52, 487
- Smith & Owocki (2006) Smith N., & Owocki S.P., 2006, ApJ, 645, L45
- Smith et al. (2016) Smith N., Andrews J.E., Mauerhan J.C., Zheng W.K., Filippenko A.V., Graham M.L., Milne P., 2016, MNRAS, 455, 3546
- Szecsi et al (2015) Szesci D., Langer N., Yoon S.-C., Debashis S., de Mink S., Evans C.J., Dermine T., 2015, A&A, 581, A15
- Tikhonov, Galazutdinova, Lebedev (2014) Tikhonov N.A., Galazutdinova O.A., Lebedev V.S., 2014, Ast.Lett., 40, 1
- Tully et al. (2008) Tully R.B., Shaya E.J., Karachentsev I.D., Courtois H.M., Kocevski D.D., Rizzi L., Peel A., 2008, ApJ, 676, 184
- Vinko et al. (2015) Vinko J., Sarneczky K., Vida K., 2015, ATel, #7541
- Walborn et al. (2011) Walborn N., Stahl O., Carmen R., et al., 2008, ApJ, 683, L33
- Warren et al. (2011) Warren S.R., Weisz D.R., Skillman E.D., et al., 2011, ApJ, 738:10
- Weaver et al. (1977) Weaver R., McCray R., Castor J., Shapiro P., Moore R. 1977, ApJ, 218, 377