22Ne and 23Na ejecta from
intermediate-mass stars:
The impact of the new LUNA rate for 22NeNa
Abstract
We investigate the impact of the new LUNA rate for the nuclear reaction 22NeNa on the chemical ejecta of intermediate-mass stars, with particular focus on the thermally-pulsing asymptotic giant branch (TP-AGB) stars that experience hot-bottom burning. To this aim we use the PARSEC and COLIBRI codes to compute the complete evolution, from the pre-main sequence up to the termination of the TP-AGB phase, of a set of stellar models with initial masses in the range , and metallicities , , and . We find that the new LUNA measures have much reduced the nuclear uncertainties of the 22Ne and 23Na AGB ejecta, which drop from factors of to only a factor of few for the lowest metallicity models. Relying on the most recent estimations for the destruction rate of 23Na, the uncertainties that still affect the 22Ne and 23Na AGB ejecta are mainly dominated by evolutionary aspects (efficiency of mass-loss, third dredge-up, convection). Finally, we discuss how the LUNA results impact on the hypothesis that invokes massive AGB stars as the main agents of the observed O-Na anti-correlation in Galactic globular clusters. We derive quantitative indications on the efficiencies of key physical processes (mass loss, third dredge-up, sodium destruction) in order to simultaneously reproduce both the Na-rich, O-poor extreme of the anti-correlation, and the observational constraints on the CNO abundance. Results for the corresponding chemical ejecta are made publicly available.
keywords:
stars: evolution – stars: AGB and post-AGB – stars: carbon – stars: abundances – stars: mass loss – Physical Data and Processes: nuclear reactions, nucleosynthesis, abundances1 Introduction
Low- and intermediate-mass stars (with initial masses up to 6-8 M⊙) play a key role in the chemical evolution of the Universe. During their lives they experience a rich nucleosynthesis and various mixing episodes, eventually ejecting significant amounts of newly synthesized elements into the interstellar medium. Quantifying their chemical contribution is of key relevance to understand the chemical enrichment of galaxies and several theoretical studies were carried out to this purpose (Cristallo et al., 2015; Doherty et al., 2014a, b; Cristallo et al., 2011; Siess, 2010; Ventura et al., 2013; Karakas & Lattanzio, 2014; Ventura & Marigo, 2010; Marigo, 2001; Forestini & Charbonnel, 1997).
Despite the valuable efforts, large uncertainties still affect the yields of various elements, due to the uncertainties of the physical processes (i.e., mass loss, convection, mixing, nuclear reactions) that characterize the advanced evolutionary stages, in particular the thermally-pulsing asymptotic giant branch (TP-AGB).
In this study we will focus on the nucleosynthesis of 22Ne and 23Na and their ejecta produced by stars massive enough to experience the process of hot-bottom burning (hereinafter also HBB) during the AGB phase (Mi > 3-4 M⊙). When, during the quiescent AGB evolution, the temperature at the base of convective envelope exceeds , the CNO, NeNa and MgAl cycles are efficiently activated (Forestini & Charbonnel, 1997), with the effect of significantly altering the abundances of the catalysts involved in the proton-capture reactions. The NeNa cycle is responsible for affecting the abundances of isotopes between and . The current uncertainties of the 22Ne and 23Na ejecta are dramatically high, up to factors of , given the large uncertainties that affect a few reaction rates involved in the NeNa cycle (e.g., Karakas, 2010; Izzard et al., 2007; Ventura & D’Antona, 2005b). The poor knowledge of resonances in and is critical (Hale et al., 2004). The rate of the NeNa cycle is determined by the slowest reaction of the chain, the (Rolfs & Rodney, 1988), and most uncertainties are caused by the reaction. In fact, the systematic analysis carried out by Izzard et al. (2007) has shown that the ejecta of 23Na is dominated by the uncertainties in the rate, with the destruction rates of and playing a lesser role.
The contribution of resonances to the rate is still uncertain because of the large number of levels of , the complexity of direct measurements and the interpretation of indirect data. This is particularly true for resonances at energies corresponding to the typical temperatures of hot-bottom burning in AGB stars, i.e. (e.g., Marigo et al., 2013; Boothroyd et al., 1995).
In this paper we analyze the impact on 22Ne and 23Na ejecta of the new rate for that has been recently revised following accurate measurements at LUNA (Cavanna et al., 2015). We computed a large set of evolutionary models for stars that experience HBB and the third dredge-up during the AGB phase. The results are compared to those obtained with other versions of the rate in the literature, and also by varying other parameters that are critical for the evolution of AGB stars. The final aim is to re-evaluate the uncertainties that affect the 22Ne and 23Na ejecta, as well as to explore the implications we may draw on the hypothesis that metal-poor AGB stars are promising candidates to explain the O-Na anti-correlation exhibited by Galactic globular clusters’ stars (e.g., D’Antona et al., 2016; D’Ercole et al., 2012; Ventura & D’Antona, 2009).
The structure of the paper is organized as follows. In Section 2 we recall the main results and improvements obtained with recent LUNA data for the S-factor of the 22Ne(p,Na reaction. In Section 3 we outline the most relevant characteristics and input physics of the stellar evolutionary models. In Section 4 we discuss the evolution of the surface abundance of neon, sodium and magnesium isotopes in stars that experience HBB and the third dredge-up during the TP-AGB phase. A quantitative comparison of the 22Ne and 23Na ejecta as a function of the initial stellar mass and metallicity is provided in Section 5. In the context of the origin of the O-Na anti-correlation in Galactic globular clusters (GGCs), Section 6 analyzes the impact of the new LUNA rate on the AGB star hypothesis. Section 7 closes the paper providing a summary and a few final remarks.
2 The new LUNA rate for 22Ne(p,Na
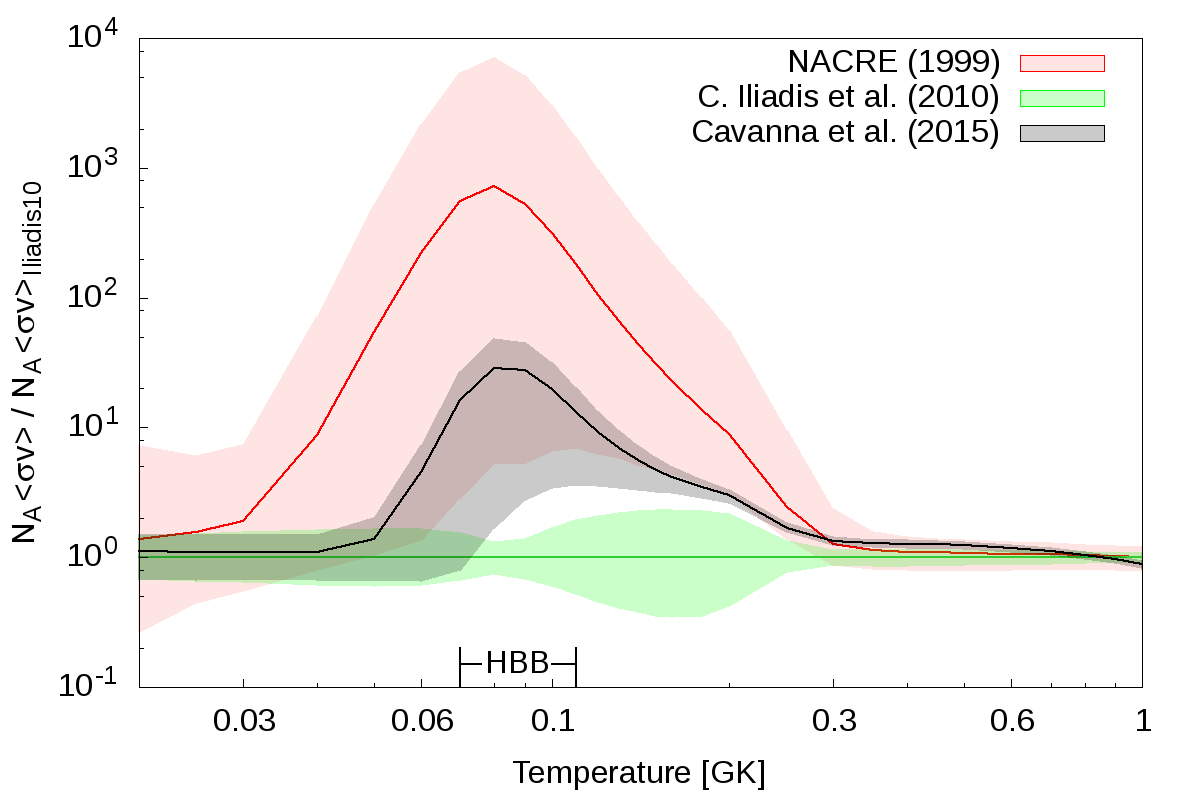
In stellar models the 22NeNa reaction has usually been described according to one of the two popular rate compilations quoted in Table 1. They collect direct and indirect data on resonance strengths, namely: Angulo et al. (1999, hereinafter NACRE); Iliadis et al. (2010a, b, hereinafter IL10). The latter was recently updated by the STARLIB group including new indirect data (Sallaska et al., 2013). It differs from the previous version by less than in the range of temperatures explored in this paper and we will still refer to IL10. Because of the uncertainties that affect some resonance strengths and the different treatment of other debated resonances (Cavanna et al., 2015, and references therein), the discrepancy between the NACRE and the IL10 total reaction rate is up to a factor of 1000 at GK, well inside the range that is relevant for HBB (see figure 1).
This situation was recently improved by direct measurements performed at LUNA in the underground facility of the Gran Sasso National Laboratory, where the low-background environment (Broggini et al., 2010; Costantini et al., 2009) and the available setup (Cavanna et al., 2014) offer the possibility to investigate nuclear reactions down to very low energies (Cavanna et al., 2015).
In Cavanna et al. (2015) three new resonances were observed for the first time, at and laboratory energy. In addition, more precise excitation energies corresponding to the new resonances were found, except for the resonance. For other three resonances, at , and , new upper limits to the strengths were obtained.
In order to estimate the new total reaction rate a Monte Carlo method was used (see for more details Cavanna et al., 2015). The new data were combined with previous direct measurement results for higher energy resonances (Depalo et al., 2015) and with literature resonant and non-resonant contributions (Iliadis et al., 2010a, b).
The new central value of the reaction rate lies between those of NACRE and IL10, see Fig. 1. The more precise excitation energies found for the and resonances are responsible for the increase of the reaction rate by a factor of with respect to IL10 at temperatures . For the lower limit of the new reaction rate is above the upper limit calculated by IL10. Another effect of the direct observation of three new resonances in the range of temperatures is the reduction of the error bars of the total reaction rate, in comparison to NACRE and IL10. Nevertheless the new reaction rate has still larger uncertainties than IL10 for . This is because of the different treatment of the resonances, for which further investigation is necessary. As a matter of fact, in the range of temperatures of HBB in TP-AGB stars, see Fig. 1, the new reaction rate is higher than IL10 by about a factor of 20, which will significantly impact on model predictions.
3 Stellar evolutionary models
Stellar evolutionary models for intermediate-mass stars were calculated with the PARSEC and COLIBRI codes (Bressan et al., 2012; Marigo et al., 2013). The PARSEC tracks cover the evolution from the pre-main sequence up to the initial stages of the thermally-pulsing asymptotic giant branch (TP-AGB) phase. Starting from the first thermal pulse computed with PARSEC, the subsequent evolution up to the almost complete ejection of the envelope is followed with the COLIBRI code. The reader should refer to the aforementioned papers for all details about the two codes.
We shortly recall the prescriptions for the adopted input physics which are mostly relevant for this work, common to both PARSEC and COLIBRI. Stellar convection is described by means of the classical mixing length theory (Böhm-Vitense, 1958). The mixing length is assumed to scale linearly with the pressure scale height, , according to setting the proportionality factor , following our recent calibration of the solar model (Bressan et al., 2012).
Overshoot is applied to the borders of convective cores as well as at the base of the convective envelope, and is described through the parameter which sets its extension in units of . In the range of intermediate stellar masses under consideration our default choice is for convective core overshoot (across the classical Schwarzschild border) and for envelope overshoot.
The network of nuclear reaction rates includes the proton-proton chains, the CNO tri-cycle, the NeNa and MgAl cycles, and the most important -capture reactions, together with few -n reactions. In the burning regions, at each time step, the network is integrated to derive the abundances of 26 chemical species: 1H, D, 3He, 4He,7Li, 8Be, 4He, 12C, 13C, 14N, 15N, 16N, 17N, 18O, 19F, 20Ne, 21Ne, 22Ne, 23Na, 24Mg, 25Mg, 26Mg, 26Alm, 26Alg, 27Al, 28Si. Our initial reference set of nuclear reaction rates is taken from the JINA reaclib database (Cyburt et al., 2010), from which we also take the -value of each reaction. In total we consider reaction rates (for the complete list and references see Table 1 of Marigo et al., 2013). No neutron-capture reactions are included.
We computed the evolution of intermediate-mass stars with initial masses in the range between 3.0 and (in incremental steps of ), the upper limit being the maximum mass for a star to develop a carbon-oxygen degenerate core at the end of the core helium burning phase. With the adopted input physics and prescriptions (e.g. the extension of convective core overshoot) we find that for the metallicity range under consideration. As for the chemical composition we consider three choices of the initial metallicity and helium content , namely: . For each the corresponding is derived assuming a linear relation with a helium-to-metals enrichment ratio , a primordial helium abundance , a Sun’s metallicity at its birth , and a present-day Sun’s metallicity (more details can be found in Bressan et al., 2012). The initial distribution of metals is assumed to follow a scaled-solar pattern (Caffau et al., 2011) for 0.006, 0.014, while we adopt an -enhanced mixture with [/Fe]=0.4 for . This latter is suitable to describe the chemical pattern of low-metallicity Halo stars and first-generation stars in Galactic globular clusters. Considering that the initial metallicity includes the abundances of all elements heavier than helium (hence also the -elements), the iron content of our -enhanced mixture corresponds to [Fe/H] (see also Section 6). The assumed chemical composition of the evolutionary models is summarized in Table 1.
Major effects on the NeNa nucleosynthesis show up during the TP-AGB phase of stars with hot-bottom burning. Therefore it is worth recalling the main features of the COLIBRI code, and our reference set of prescriptions according to Marigo et al. (2013, hereinafter also ). Other model assumptions, summarized in Table 2, will be tested and discussed later in the paper (Sects. 5.1 and 6).
The evolution of the models presented in this work is followed at constant mass until the onset of the TP-AGB phase. To compute the mass-loss rate along the TP-AGB we first adopt the semi-empirical relation by Schröder & Cuntz (2005), modified according to Rosenfield et al. (2014), and then, as the star enters the dust-driven wind regime, we adopt an exponential form , as a function of stellar mass and radius (see for more details Bedijn, 1988; Girardi et al., 2010; Rosenfield et al., 2014). The latter was calibrated on a sample of Galactic long-period variables with measured mass-loss rates, pulsation periods, masses, effective temperatures, and radii. We emphasize that the combination of the two mass-loss laws was calibrated through observations of resolved AGB stars in a large sample nearby galaxies of low metallicities and various star-formation histories, observed with the HST/ACS Nearby Galaxy Survey Treasury (Rosenfield et al., 2016, 2014; Dalcanton et al., 2009), leading to a satisfactory reproduction of the measured star counts and luminosity functions.
In COLIBRI we account for the changes in the surface chemical composition caused by the occurrence of the third dredge-up and hot-bottom burning. As for the third dredge-up we adopt a hybrid approach that involves detailed physics as well as free parameters. We perform numerical integrations of the envelope structure at the stage of the post-flash luminosity peak to determine if and when the third dredge-up is expected to take place according to a temperature criterion (Marigo & Girardi, 2007). The chemical composition of the pulse-driven convection zone is predicted by solving a nuclear network that includes the main -capture reactions. The efficiency of the third dredge-up as a function of stellar mass and metallicity is computed with an analytic formalism based on full stellar models (Karakas et al., 2002). It includes adjustable parameters which are suitably modified in order to reproduce basic observables of AGB stars, such as carbon star luminosity functions, M-C transition luminosities, surface C/O ratios (e.g., Marigo, 2015; Rosenfield et al., 2014; Marigo et al., 2013; Girardi et al., 2010; Marigo et al., 2008; Marigo & Girardi, 2007; Marigo et al., 2003).
The process of hot-bottom burning experienced by massive AGB stars (with initial masses , depending on metallicity and model details) is consistently taken into account in terms of energetics and nucleosynthesis.The nucleosynthesis of all species is coupled in time and in space with a diffusive description of convection.
A key characteristic of the COLIBRI code is that the equation of state for atomic and molecular species, and the Rosseland mean of the gas opacities across the atmosphere and the deep envelope are computed on-the-fly, ensuring a full consistency with the changing abundances of all involved chemical elements (Marigo & Aringer, 2009).
As for the nuclear reaction 22NeNa we mainly investigated three different experimental rates, namely: LUNA, IL10, and NACRE (see Table 1). Each selected option is adopted throughout the evolutionary calculations, from the main sequence to the end of the TP-AGB phase. For comparison, we also tested the theoretical rate from Cyburt et al. (2010), which was calculated with the version 5.0w of the NON-SMOKERWEB code (Rauscher & Thielemann, 2000). We note that in the temperature range of interest for HBB, GK, the theoretical CYB10 rate is larger than IL10 by factors of .
| Stellar parameters | ||||
|---|---|---|---|---|
| initial partition | range | |||
| of metals | (in steps of ) | |||
| 0.0005 | 0.249 | =0.4 | 3.0-5.0 | |
| 0.006 | 0.259 | scaled-solar | 3.0-5.4 | |
| 0.014 | 0.273 | scaled-solar | 3.0-5.6 | |
| Rate for 22NeNa | ||||
| Reference | type | acronym | ||
| Iliadis et al. (2010a) | experimental | IL10 | 1.00e00 | |
| Cavanna et al. (2015) | experimental | LUNA | 1.80e01 | |
| Angulo et al. (1999) | experimental | NACRE | 3.13e02 | |
| Cyburt et al. (2010) | theoretical | CYB10 | 4.35e03 | |
| model | notes | ||||
| class | |||||
| 1.74 | reference set a | \rdelim}52mm[ very efficient third dredge-up ] | |||
| 1.74 | VW93 | popular mass-loss law | |||
| 1.74 | B95 | efficient mass loss | |||
| with | |||||
| 2.00 | efficient HBB | ||||
| 1.74 | no third dredge-up | ||||
| 2.00 | 0.5 | efficient HBB | |||
| moderate third dredge-up | |||||
| 23NaNa reduced by 5 | |||||
| 1.74 | B95 | efficient mass loss | |||
| with | |||||
| no third dredge-up | |||||
| 23NaNa reduced by 3 | |||||
| a Input prescriptions as in Marigo et al. (2013) | |||||
4 Changes in the surface 22Ne and 23Na abundances
4.1 Prior to the TP-AGB: the second dredge-up
We will briefly discuss here the predicted changes in the surface Ne-Na abundances that may take place before the development of thermal pulses in intermediate masses, with . We focus on the first and second dredge-up processes in the context of classical models, i.e. neglecting the possible contribution of extra-mixing events.
The first dredge-up takes place at the base of the red giant branch (RGB) when material that was processed through partial hydrogen burning via the CNO cycle and p-p chains is brought up to the surface. Models predict an increase of surface nitrogen, and a reduction of the isotopic ratio 12C/13C. As for the Ne-Na isotopes minor changes are expected, and their abundances remain essentially those of the initial chemical composition.
The situation is different when the second dredge-up occurs during the early-AGB (hereinafter also E-AGB) of stars with initial masses (depending on metallicity and other model details). In these stars the base of the convective envelope deepens into the layers previously processed by the temporarily extinguished H-burning shell. The surface is enriched with material containing the products of complete H-burning. Significant variations in the surface concentrations of the Ne-Na isotopes are expected, as illustrated in Fig. 3 for a set of models with initial metal-poor composition. We see that 23Na increases by a factor of 5-10 (larger for higher stellar masses), while 22Ne is correspondingly reduced. These trends agree with the predictions of other stellar models in the literature (Karakas & Lattanzio, 2014; Ventura & D’Antona, 2006; Smiljanic et al., 2009; Mowlavi, 1999b; Forestini & Charbonnel, 1997).


The effects of different 22NeNa rates on the final Ne-Na abundances after the second dredge-up is minor. Comparing the results obtained with the rates quoted in Table 1, we find that the relative differences with respect to the NACRE rate span a range for 23Na and to for 22Ne. This means that the Ne-Na surface concentrations after the second dredge-up are mainly controlled by the depth of the envelope penetration (e.g. through the mixing length, and/or the overshoot parameter). Conversely, the nuclear rates have a dramatic impact during the TP-AGB phase, when intermediate-mass stars are affected by the third dredge-up and hot-bottom burning. This aspect is discussed next, in Section 4.2.
4.2 During the TP-AGB: HBB nucleosynthesis and the third dredge-up
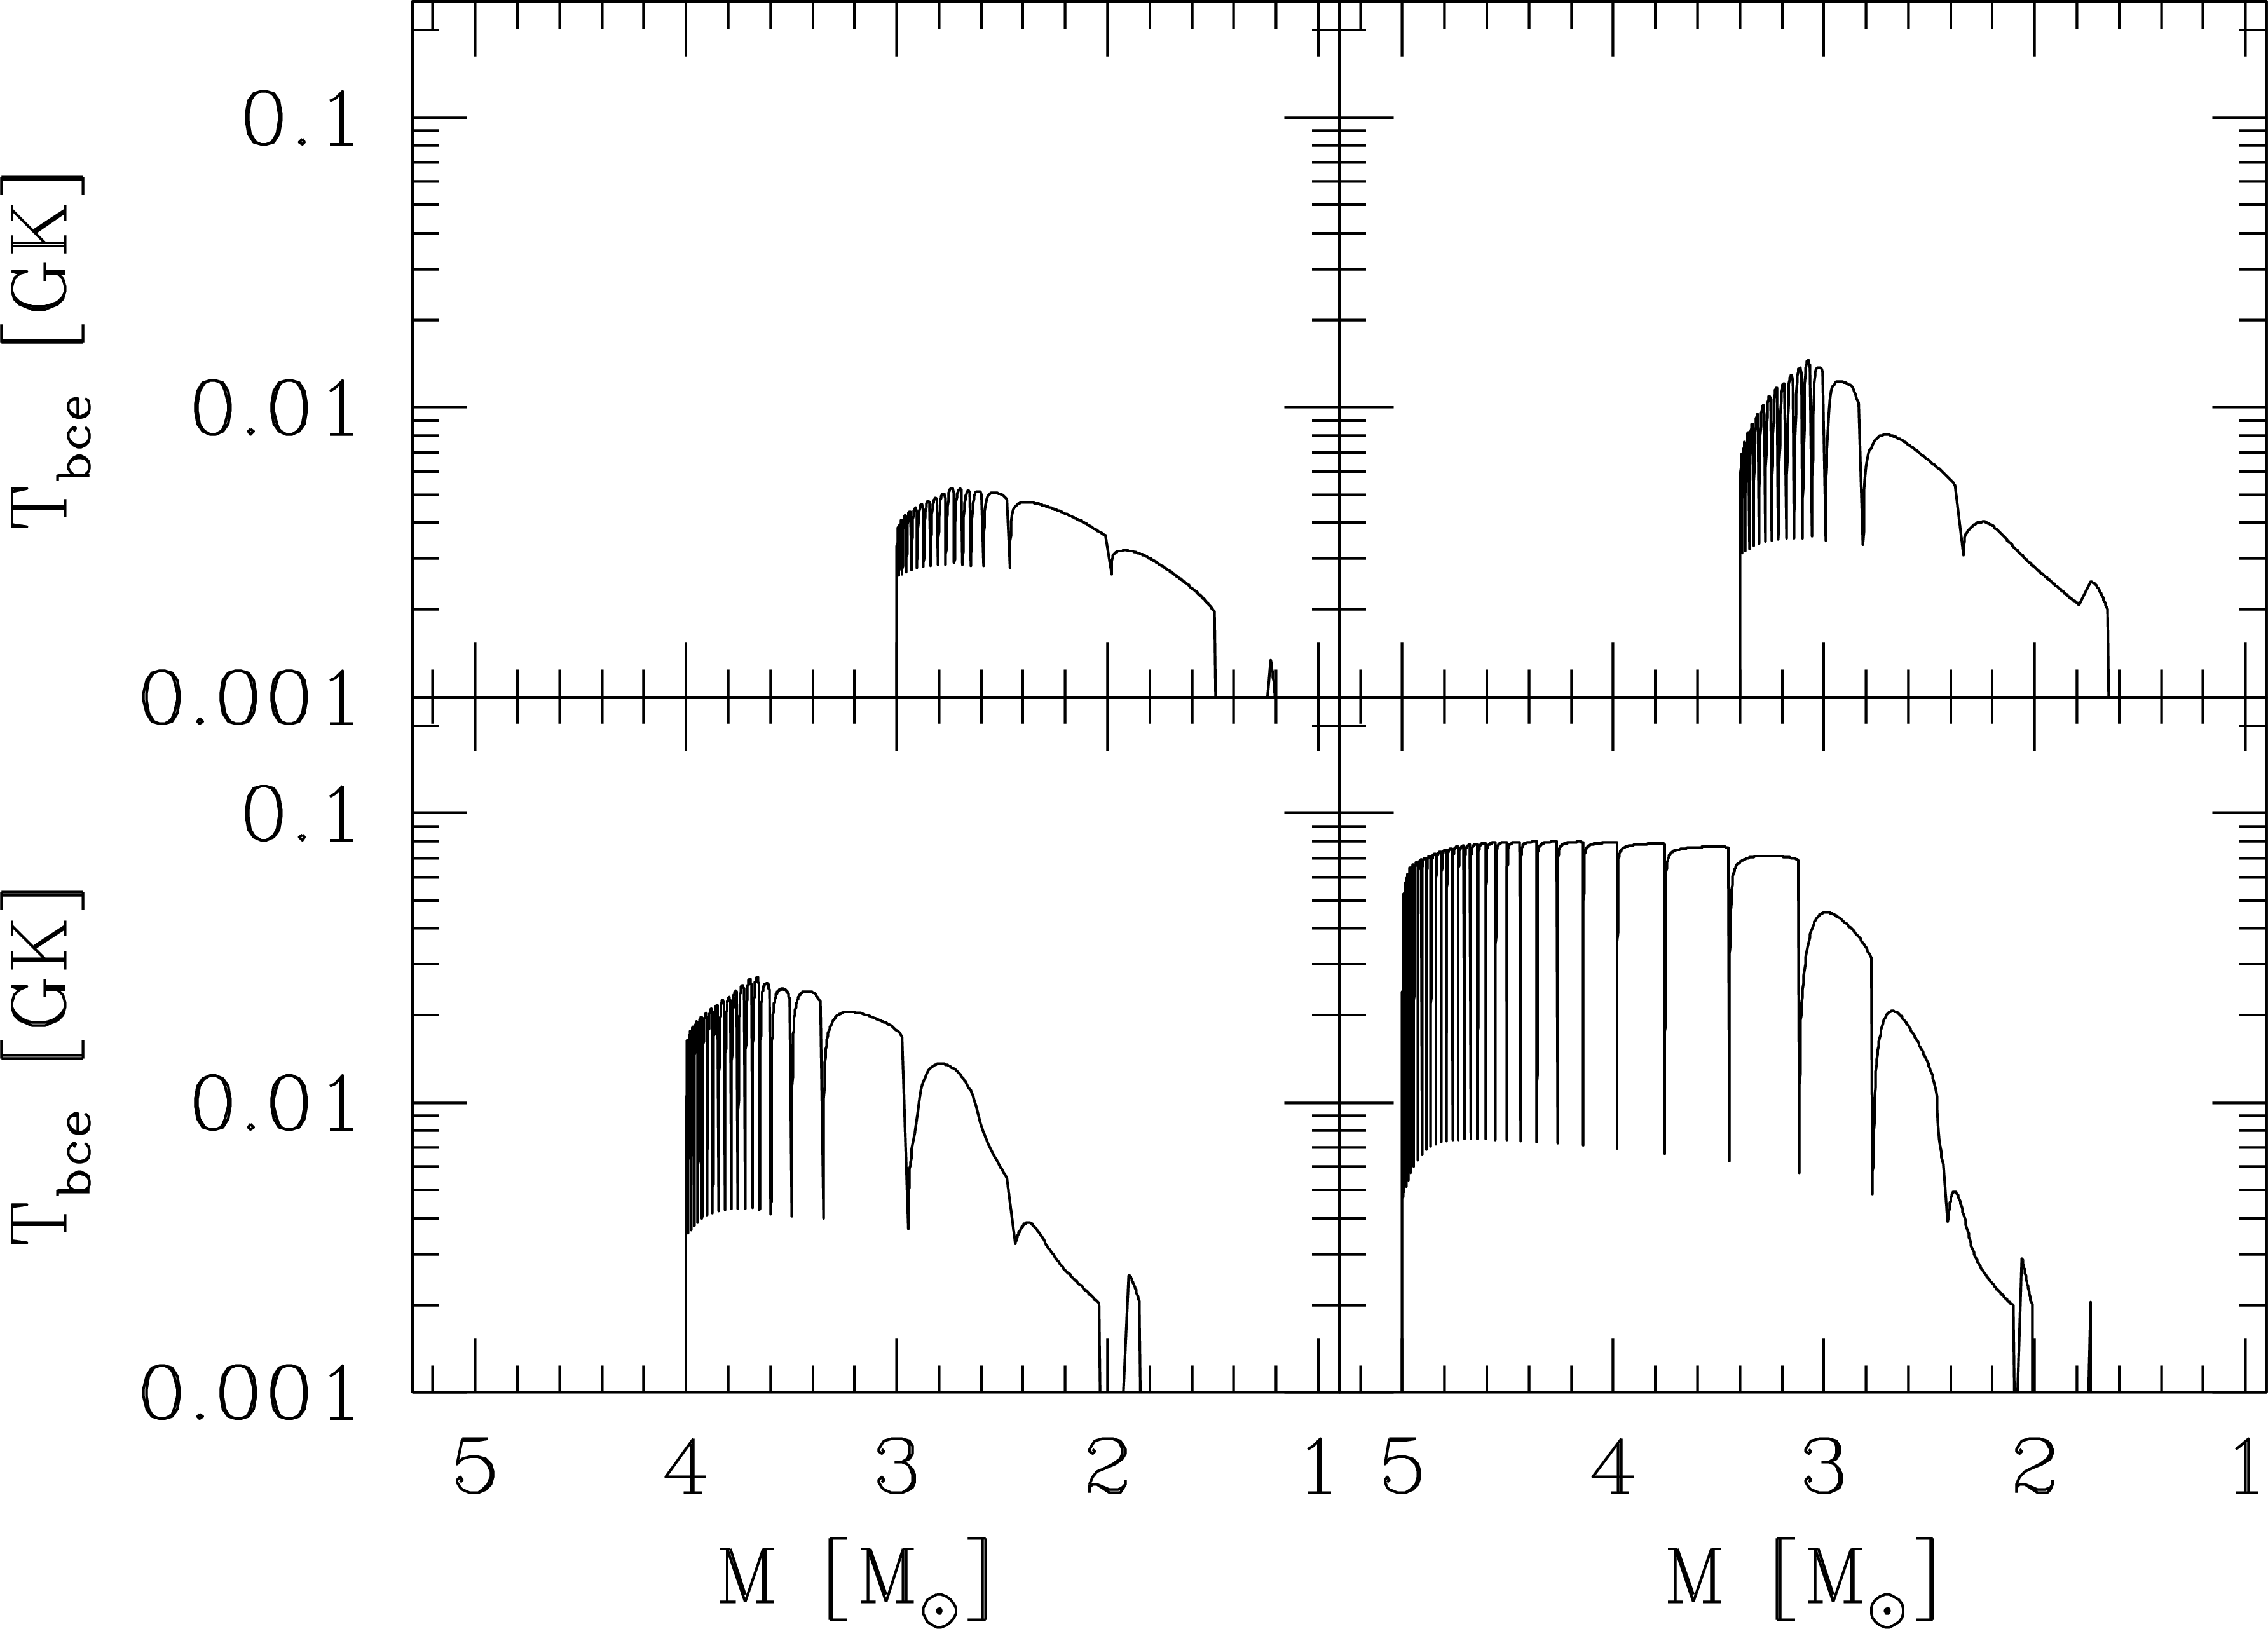
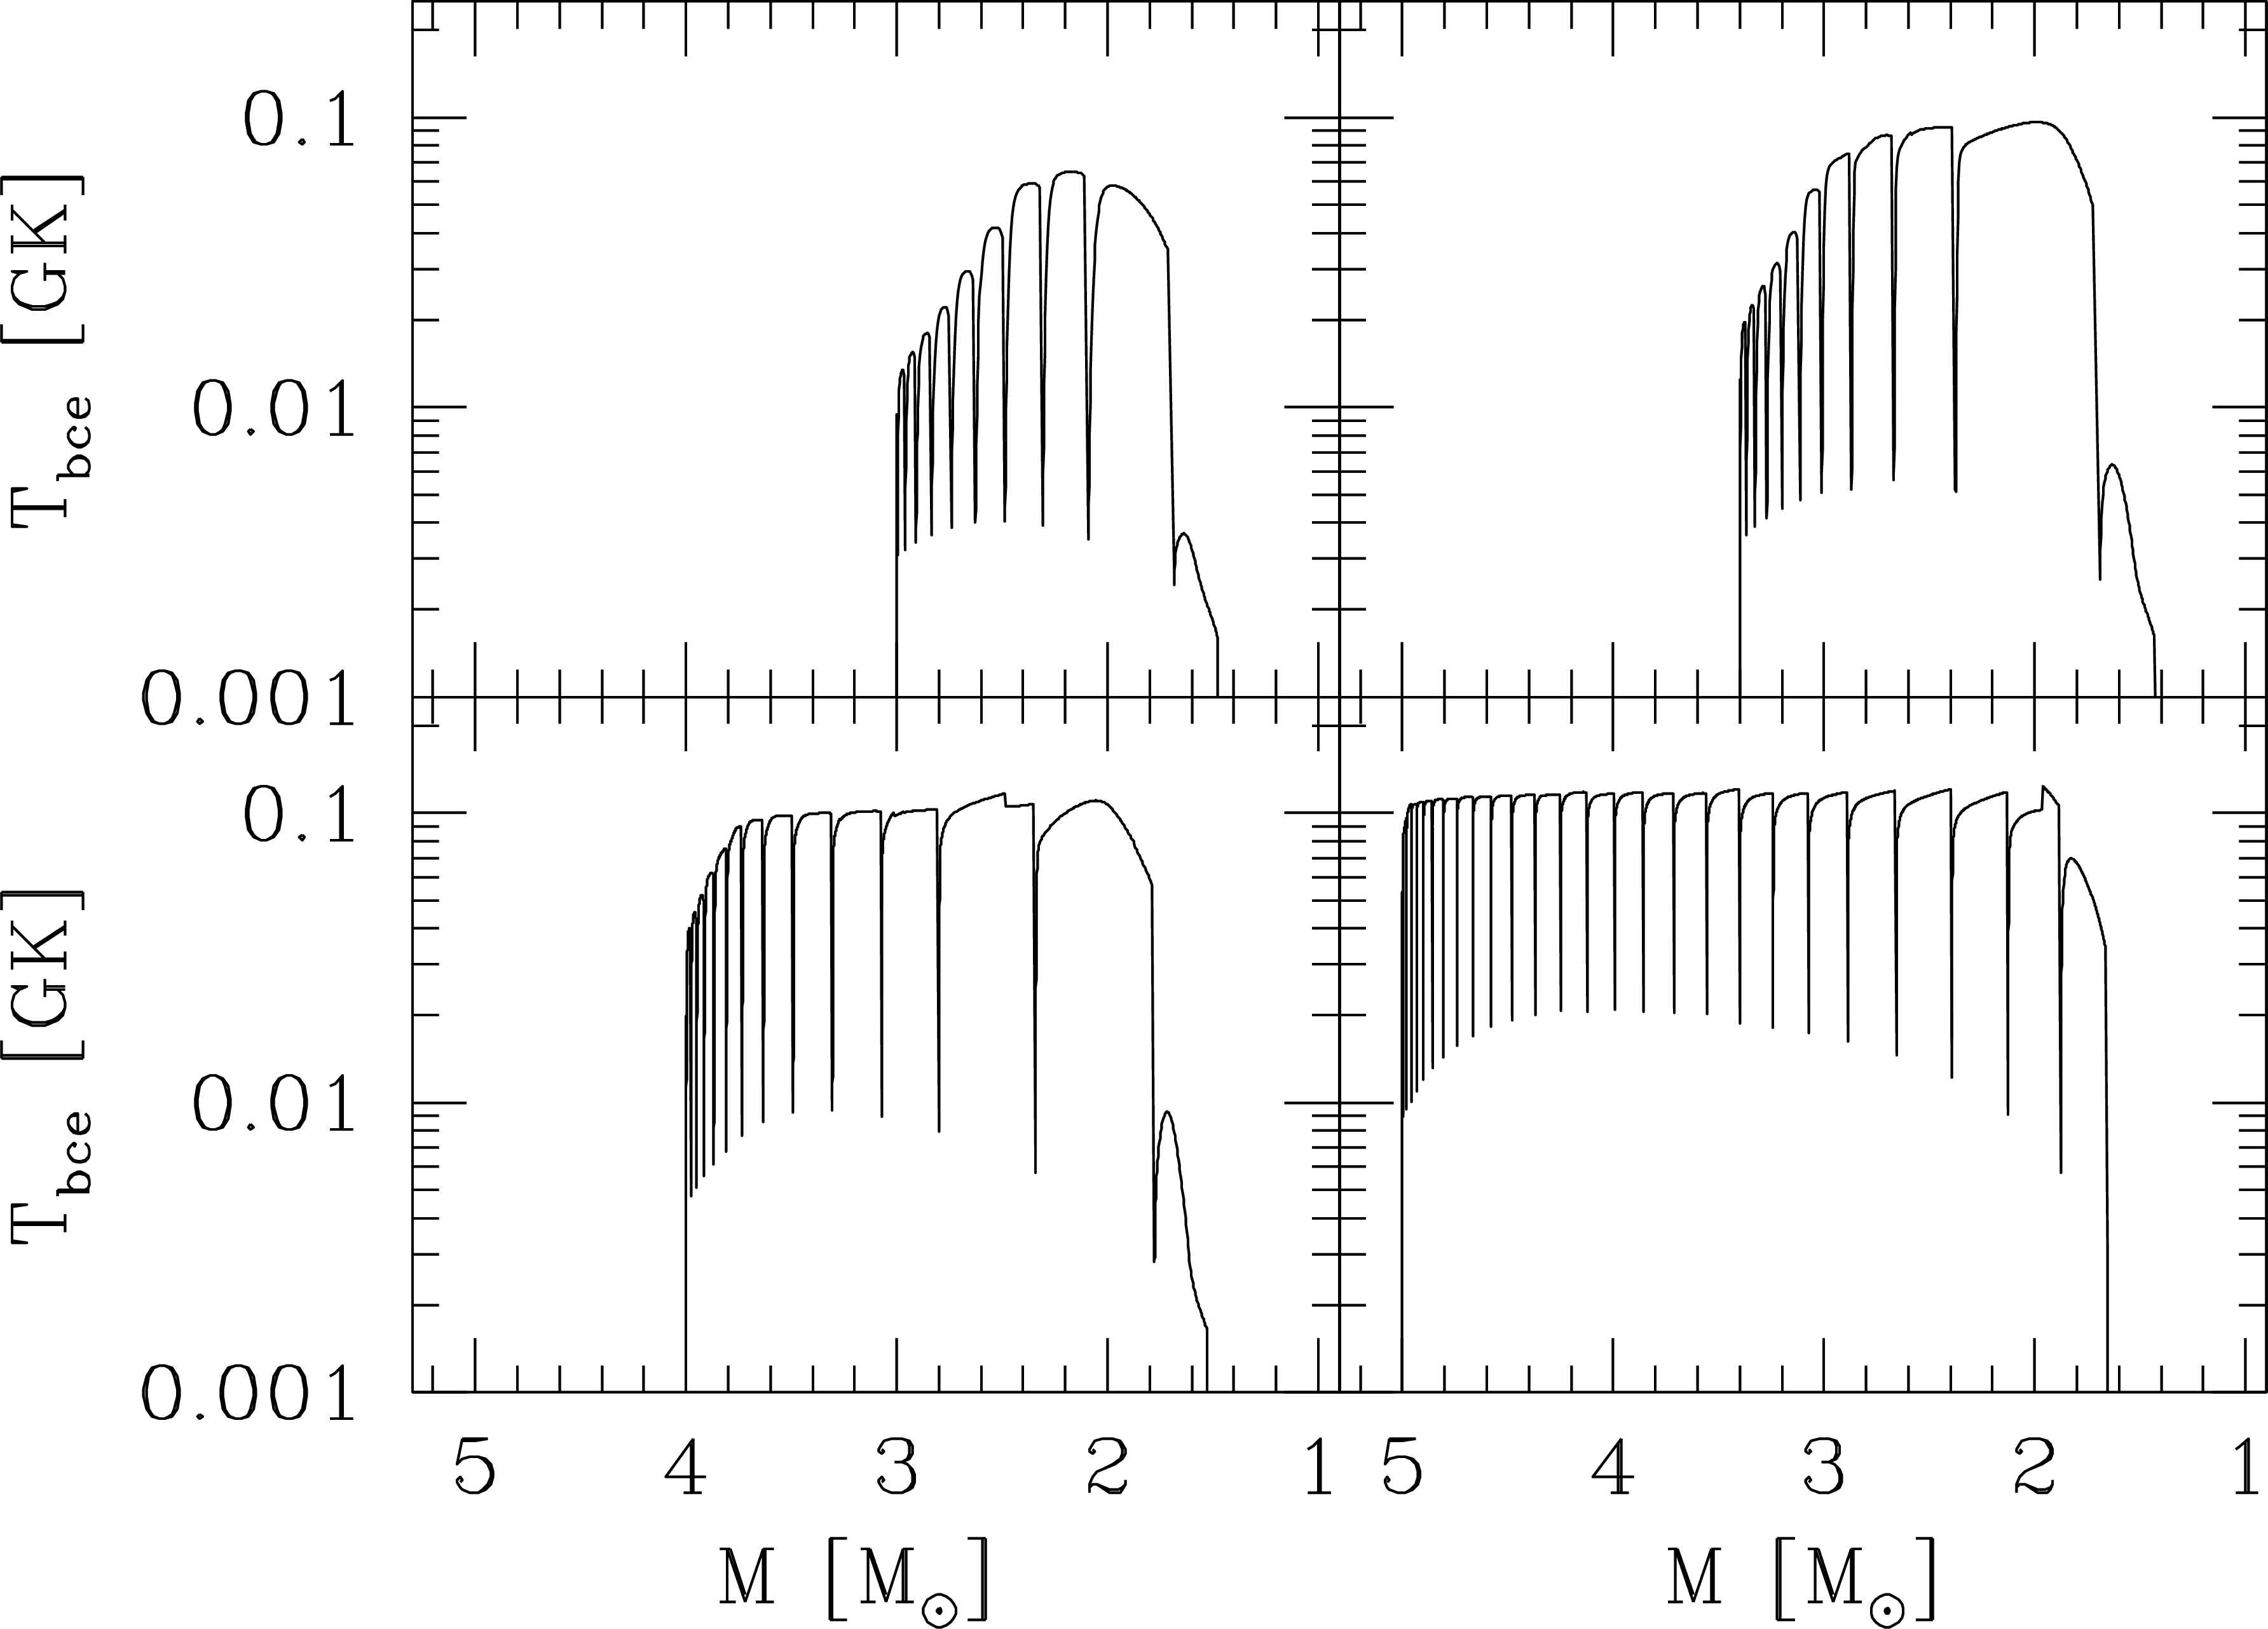
Evolutionary calculations of the TP-AGB phase indicate that the activation of the NeNa cycle at the base of the convective envelope requires relatively high temperatures, GK, which can be attained in luminous and massive AGB and super-AGB stars, preferably at low metallicity (e.g., Doherty et al., 2014b; Marigo et al., 2013; Karakas & Lattanzio, 2007; Forestini & Charbonnel, 1997). Figure 2 compares the predicted temperatures at the base of the convective envelope, , in TP-AGB models of various initial masses and two choices of the metallicity. Higher temperatures are reached by stars of larger mass and lower metallicity. The model with and attains the highest temperatures, up to K. In all models the final drop in temperature is caused by the reduction of the envelope mass by stellar winds, which eventually extinguishes HBB.
Provided that the NeNa cycle operates for sufficiently long time, the main result is the synthesis of 23Na at the expenses of the Ne isotopes. In general, the competition between production (through the reaction 22NeNa) and destruction (through the reactions 23NaNe and 23NaMg) depends on the temperature of the burning zone and the duration of the process.
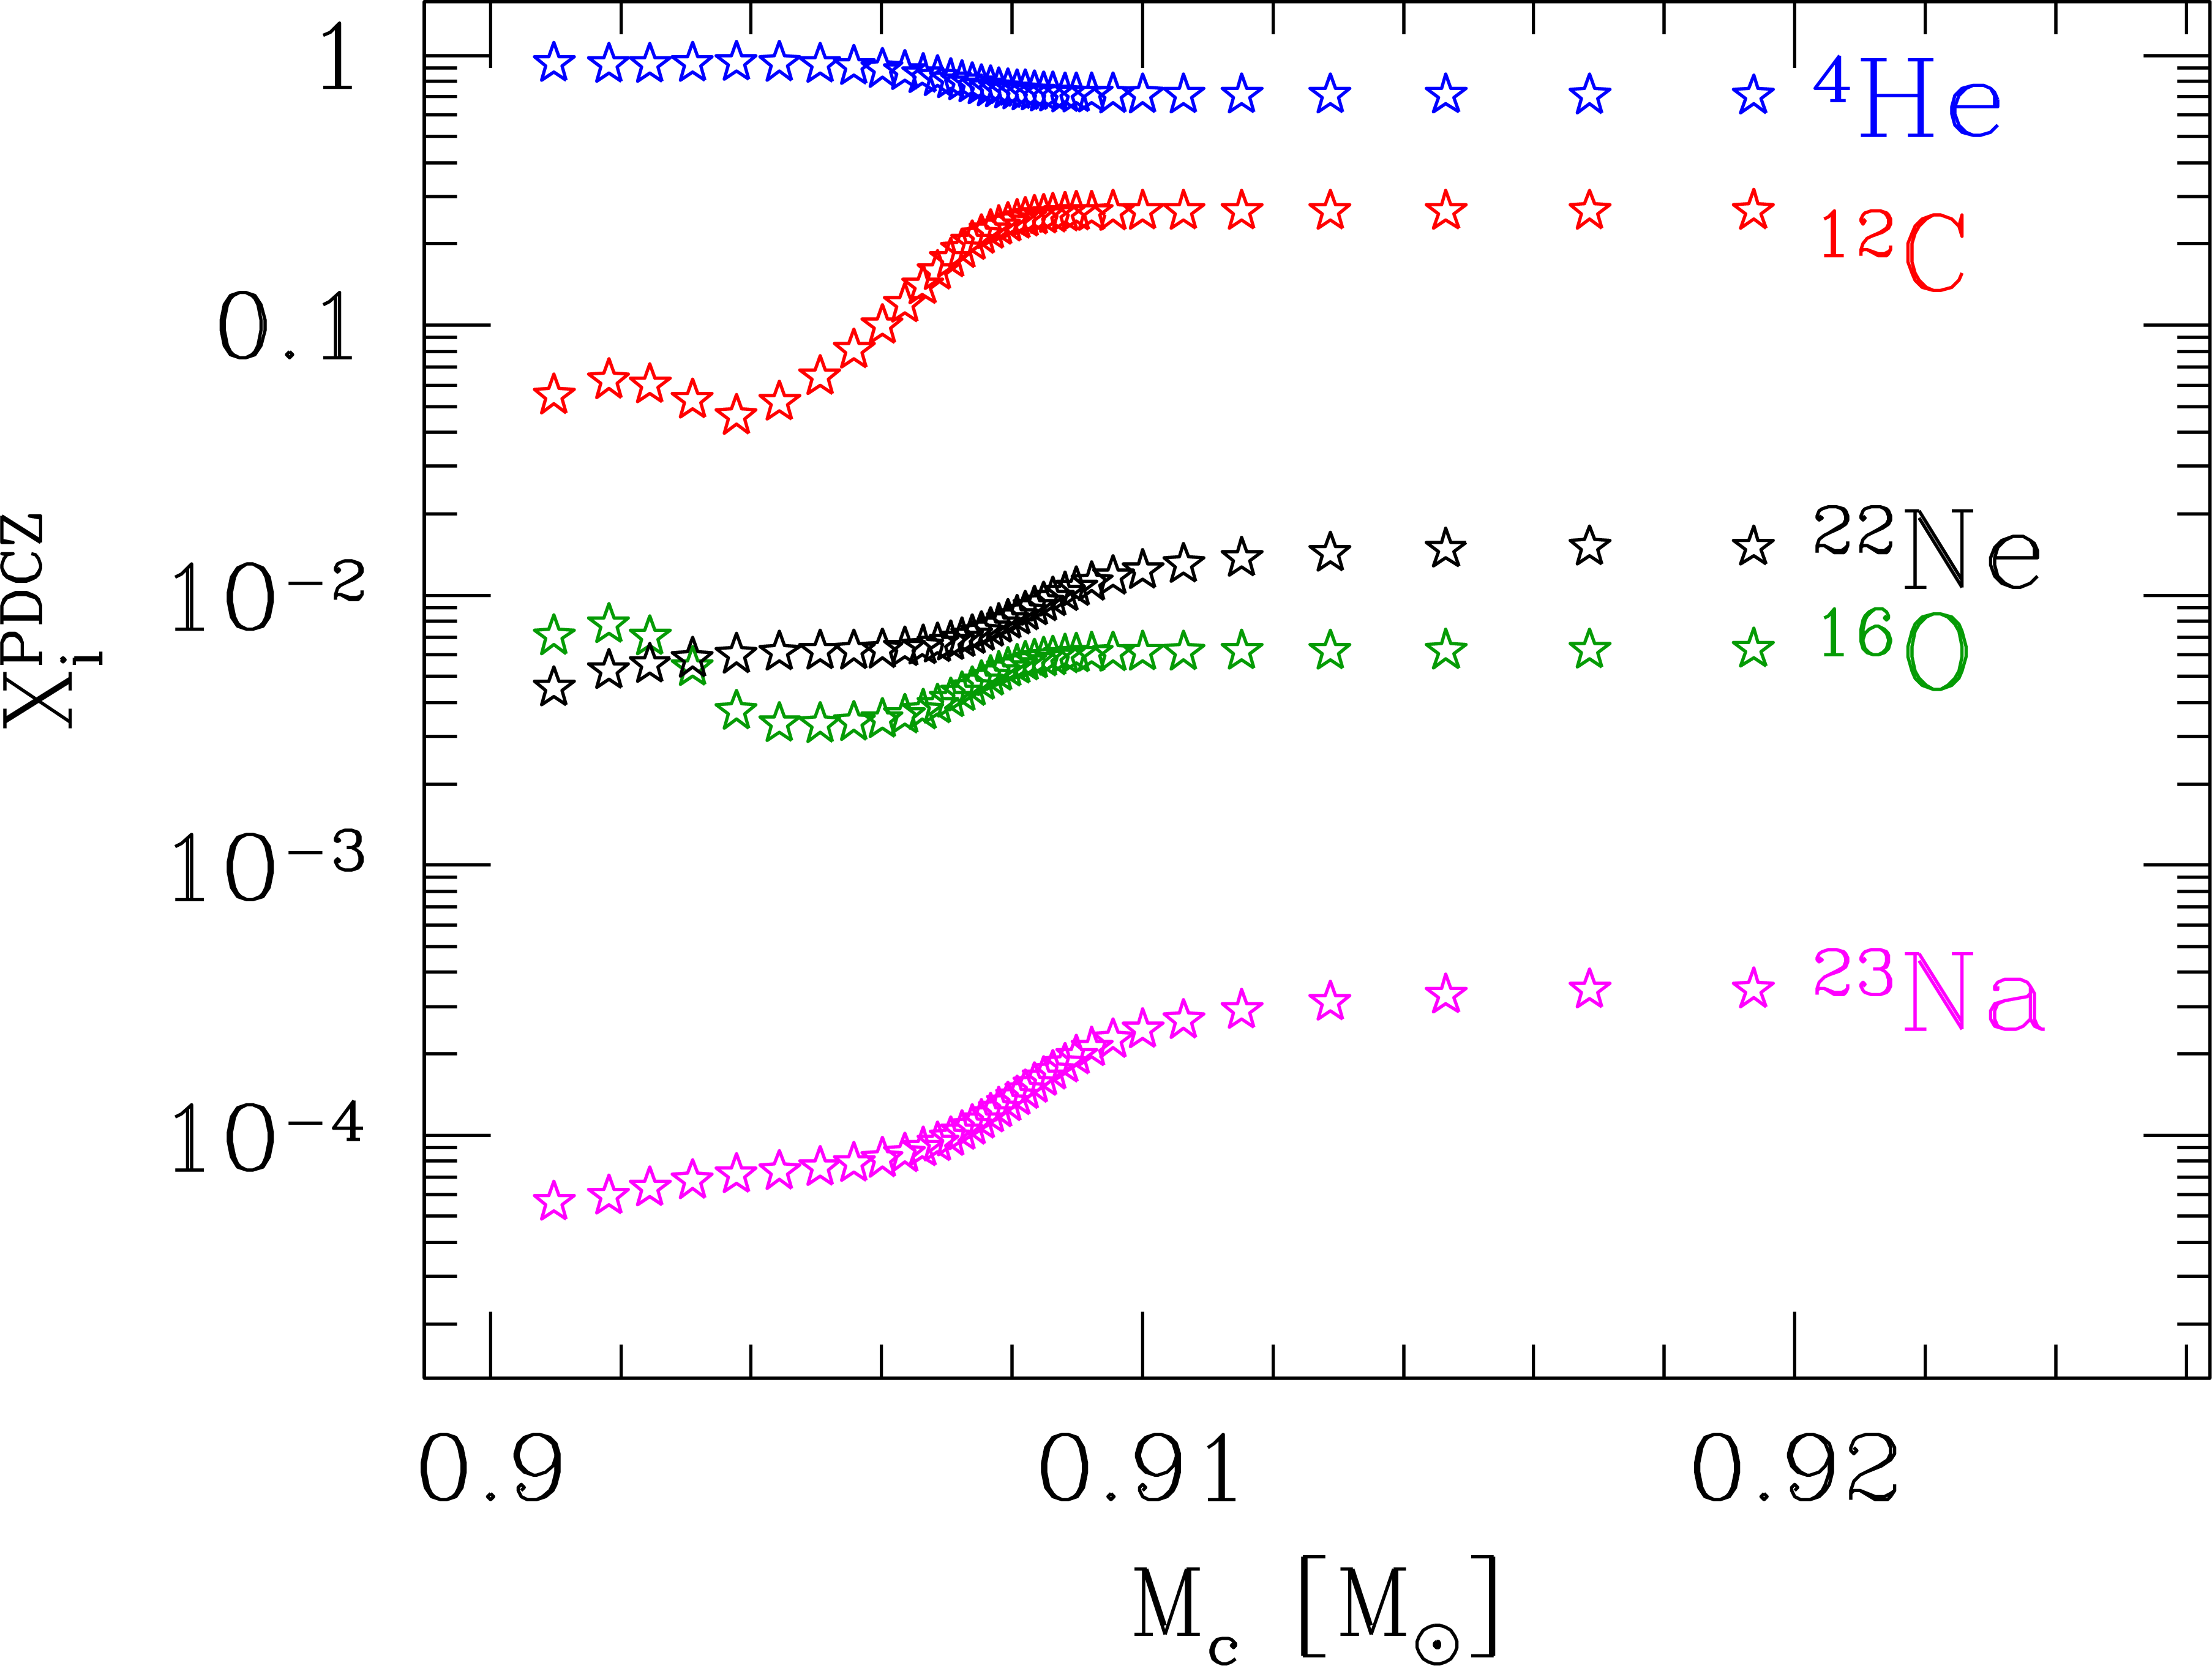
The picture above becomes more complex if, in addition to HBB, the star experiences also the third dredge-up. During the power-down phase of a thermal pulse the base of the convective envelope may reach the region that was previously affected by the pulse-driven convective zone (hereafter PDCZ), which causes a rapid change in the surface chemical composition. The standard chemical composition of the PDCZ mainly consists of 12C (), 16O (), 22Ne (), with 4He practically comprising all the rest (Boothroyd & Sackmann, 1988; Mowlavi, 1999b), almost regardless of metallicity and core mass.
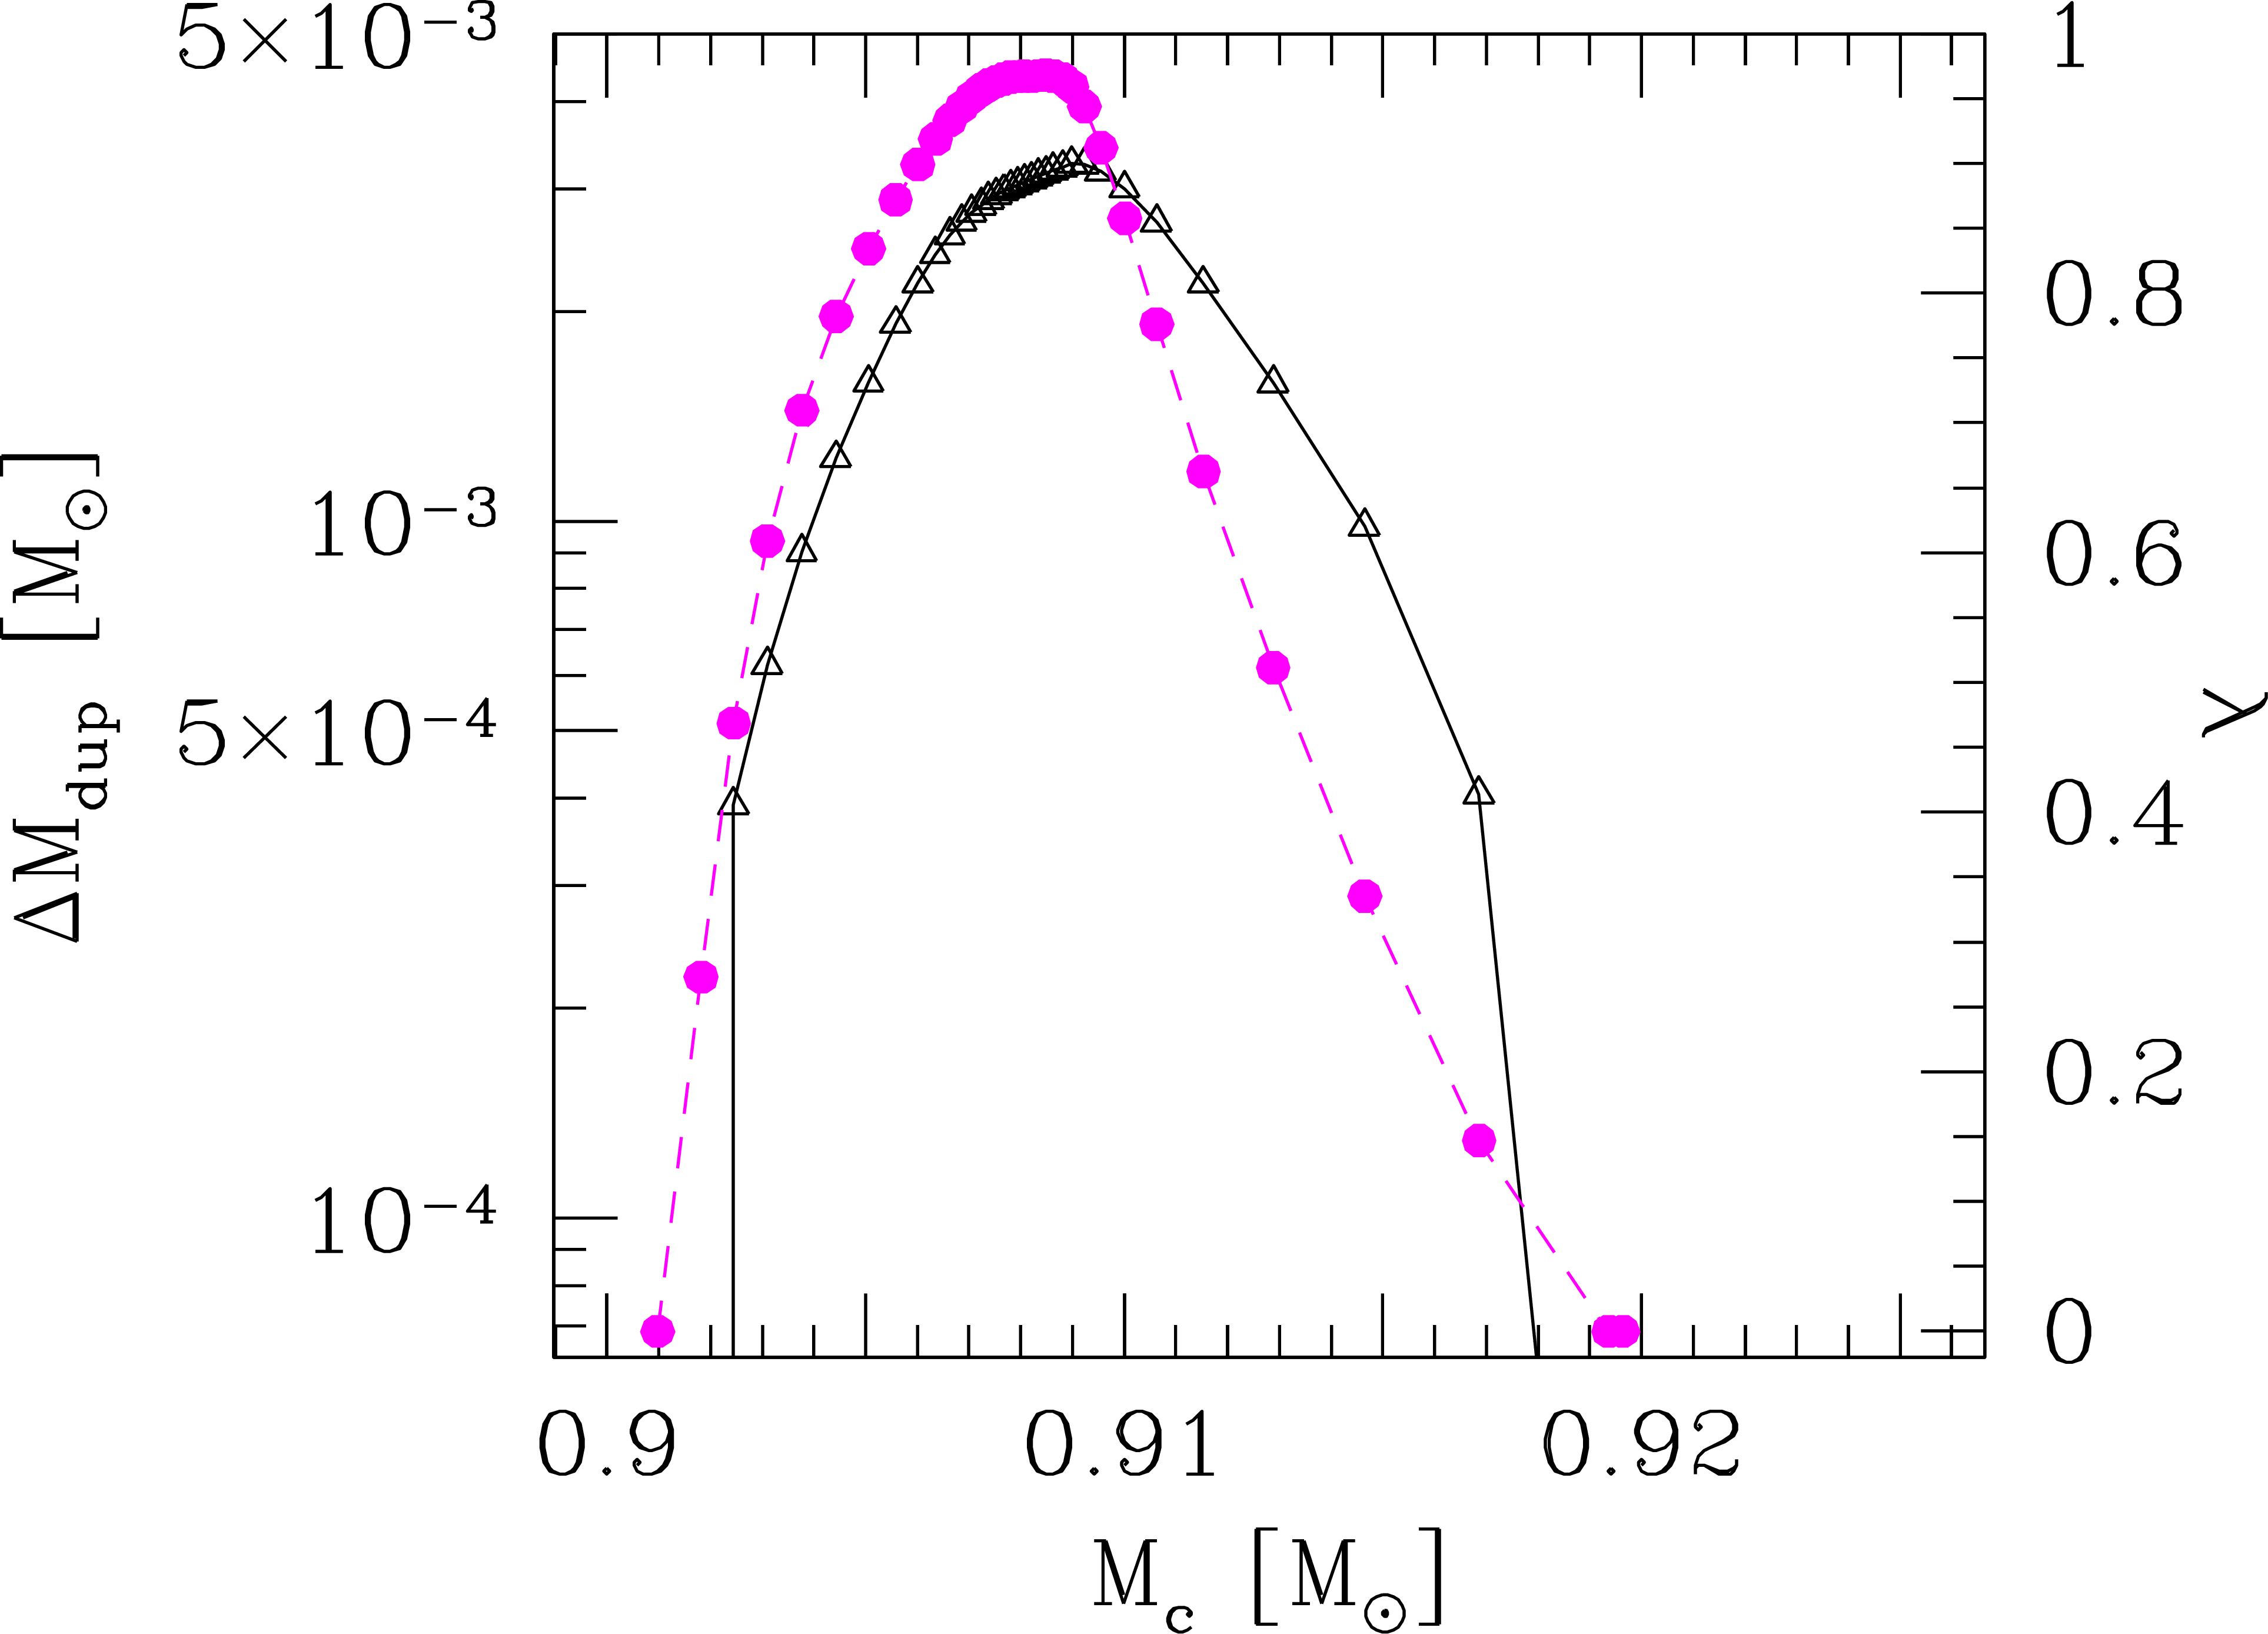
Figure 4 (left panel) shows the predicted abundances in the PDCZ developing at each thermal pulse in TP-AGB stars with initial mass and initial metallicity , computed with the COLIBRI code. We note that 4He, 12C, and 16O achieve the typical concentrations that characterize the classical PDCZ composition. The amount of mass dredged-up at each thermal pulse and the corresponding efficiency 111According to a standard notation the efficiency of the third dredge-up is expressed with , which is the fraction of the core mass increment over an inter-pulse period that is dredged-up to the surface at the next thermal pulse. are also illustrated in Fig. 4 (right panel). Similar results apply to the other metallicities here considered. In all models with the the third dredge-up is predicted to become quite deep as thermal pulses develop, reaching a maximum around . These trends are obtained following the predictions of full stellar AGB calculations of Karakas et al. (2002), which are characterized by very efficient third dredge-up. Different prescriptions, i.e. lower values of , are adopted in additional sets of AGB models, which are discussed in Sections 5.1.2 and 6. The rapid decrease of takes place over the last stages, when the envelope mass is dramatically reduced by stellar winds.
In the context of this study it is interesting to analyze the abundances of 22Ne and 23Na in the PDCZ, and the effect of the envelope chemical composition on them. The 22Ne isotope is relatively abundant in the PDCZ, increasing up to nearly in mass fraction in the models, while it reaches up to in the models, where it exceeds the 16O abundance. In the PDCZ 22Ne is the product of the chain of -capture reactions that starts from the , left over by the H-burning shell at the end of the inter-pulse period, i.e. . Therefore, at each thermal pulse the abundance 22Ne in the PDCZ depends on the current CNO content in the envelope, and positively correlates with the efficiency of the third dredge-up. In fact, the injection of primary 12C into the envelope by the third dredge-up increases the CNO abundance available to the H-burning shell, which will be mainly converted into during the quiescent inter-pulse periods.
Conversely, the abundance of 23Na in the PDCZ is largely unaffected by He-burning nucleosynthesis during the thermal pulse (Forestini & Charbonnel, 1997), while it is essentially determined by the shell H-burning during the previous inter-pulse period. In fact, when a thermal pulse develops, the associated PDCZ can reach the inter-shell region where some unburnt 23Na survived against proton captures. Then, this secondary 23Na is mixed out in the PDCZ and eventually injected into the envelope during the third dredge-up (see Mowlavi, 1999b, for a thorough analysis). More recently, Cristallo et al. (2009) discussed the formation of a 23Na-pocket in the transition region between the core and the envelope, which may provide an additional source of sodium. However, those results apply to low-mass stars and should not affect the ejecta of sodium from more massive AGB stars considered here.
In view of the above, it is clear that the third dredge-up and HBB nucleosynthesis are closely coupled and affect the surface abundances of 22Ne and 23Na, (see, e.g., Ventura & D’Antona, 2006; Karakas & Lattanzio, 2003; Mowlavi, 1999a; Forestini & Charbonnel, 1997, for similar results discussed in the past literature). Each time a third dredge-up event takes place, some amounts of 22Ne and 23Na are injected into the convective envelope where they will be subsequently involved in the NeNa cycle when HBB is re-activated during the quiescent inter-pulse periods.
This is exemplified in Fig. 5, which shows the evolution of the surface abundances in low-metallicity stars that undergo both HBB during the quiescent inter-pulse periods and recurrent third dredge-up episodes at thermal pulses. The spikes of 22Ne correspond to the quasi-periodic enrichment caused by the third dredge-up, while the subsequent decrease (particularly evident in the bottom-left panel) shows the destruction due to 22NeNa when HBB is reignited.
Comparing the four panels of Fig. 5, each corresponding to a different choice of the rate for 22NeNa, it is also evident that the abundance trends of 22Ne, 23Na, and 24Mg are critically affected by this reaction. Note, for instance, how much the amplitude of the saw-teeth trend for 22Ne is reduced when passing from CYB10 to LUNA. This simply reflects the fact that with the new LUNA rate proton captures on 22Ne nuclei are much less frequent than predicted by CYB10 when HBB is active.


Besides the evolution of the surface abundances, it is particularly relevant to quantify the amount of the processed material AGB stars expel via stellar winds. Therefore, in the next section we will analyze the ejecta of 22Ne and 23Na and their uncertainties, with particular focus on the impact of the new LUNA rate.
5 AGB ejecta of 22Ne and 23Na
Figure 6 illustrates the ejecta of 22Ne and 23Na produced by all stellar models in our reference grid Marigo et al. (2013, , see also Table 2), for three choices of the initial composition and three choices of the 22NeNa rate. We do not present the results for 24Mg since, contrarily to the evolution of the abundance, the time-integrated ejecta are found to be little affected by the adopted rate. This is due to two reasons. In stars of relatively low mass or high metallicity the temperature at the base of the convective envelope may not reach the values necessary to activate the Mg-Al cycle. In more massive and metal-poor stars, that attain the suitable temperature conditions, the main contribution to the time-integrated 24Mg ejecta comes from the very initial stages when the abundance of this isotope starts to be quickly reduced by proton captures (see the initial steep decrease of 24Mg in all panels of Fig. 5). The initial drop of the 24Mg abundance is practically independent of the assumed rate for the 22NeNa reaction. Then, when the abundance evolution of 24Mg becomes affected by the 23Na production rate (as the 24Mg curve reaches a minimum and starts to increase), the 24Mg concentration has already decreased by orders of magnitude, and the contribution to the ejecta remains small. For instance, the differences in the final 24Mg ejecta are within for the models in Fig. 5.
We see that the LUNA results are intermediate between those predicted with NACRE and IL10. At a given initial stellar mass, the LUNA ejecta for 23Na are lower than NACRE, but somewhat larger than IL10. The opposite is true for 22Ne. The differences become prominent towards higher initial stellar masses and lower metallicities, conditions that favor the development of HBB.
In this respect the bar diagrams also show the minimum mass for the activation of HBB, in particular the NeNa cycle, in AGB stars as a function of the metallicity. We adopt an empirical definition, looking for the stellar mass above which the chemical yields of 22Ne and 23Na, calculated with different rates for the 22NeNa reaction, start to differ in the bar diagram of Fig. 6. At lower masses the yields are essentially the same because the nuclear rate remain too low during the TP-AGB phase. We see that this mass limit is at , at , and at .
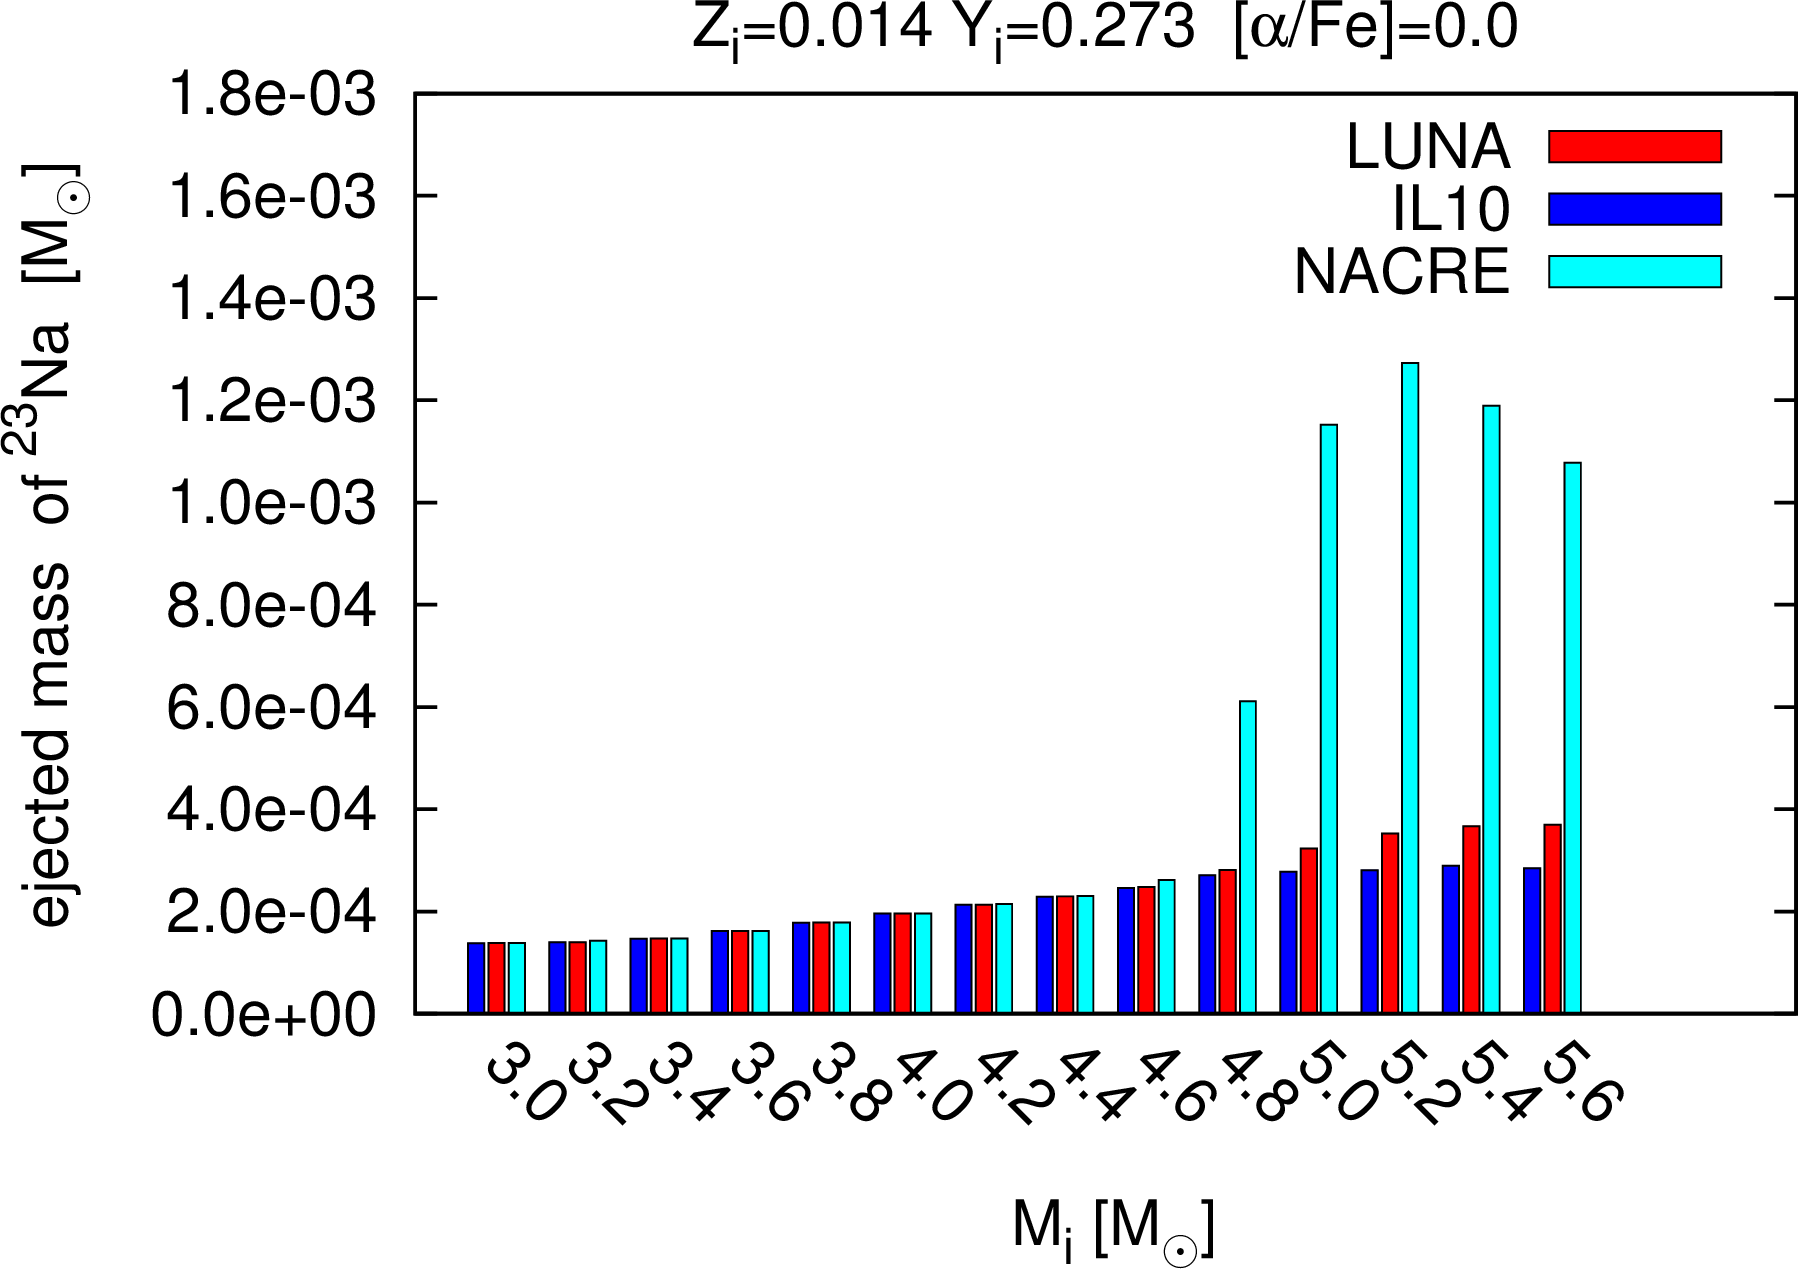
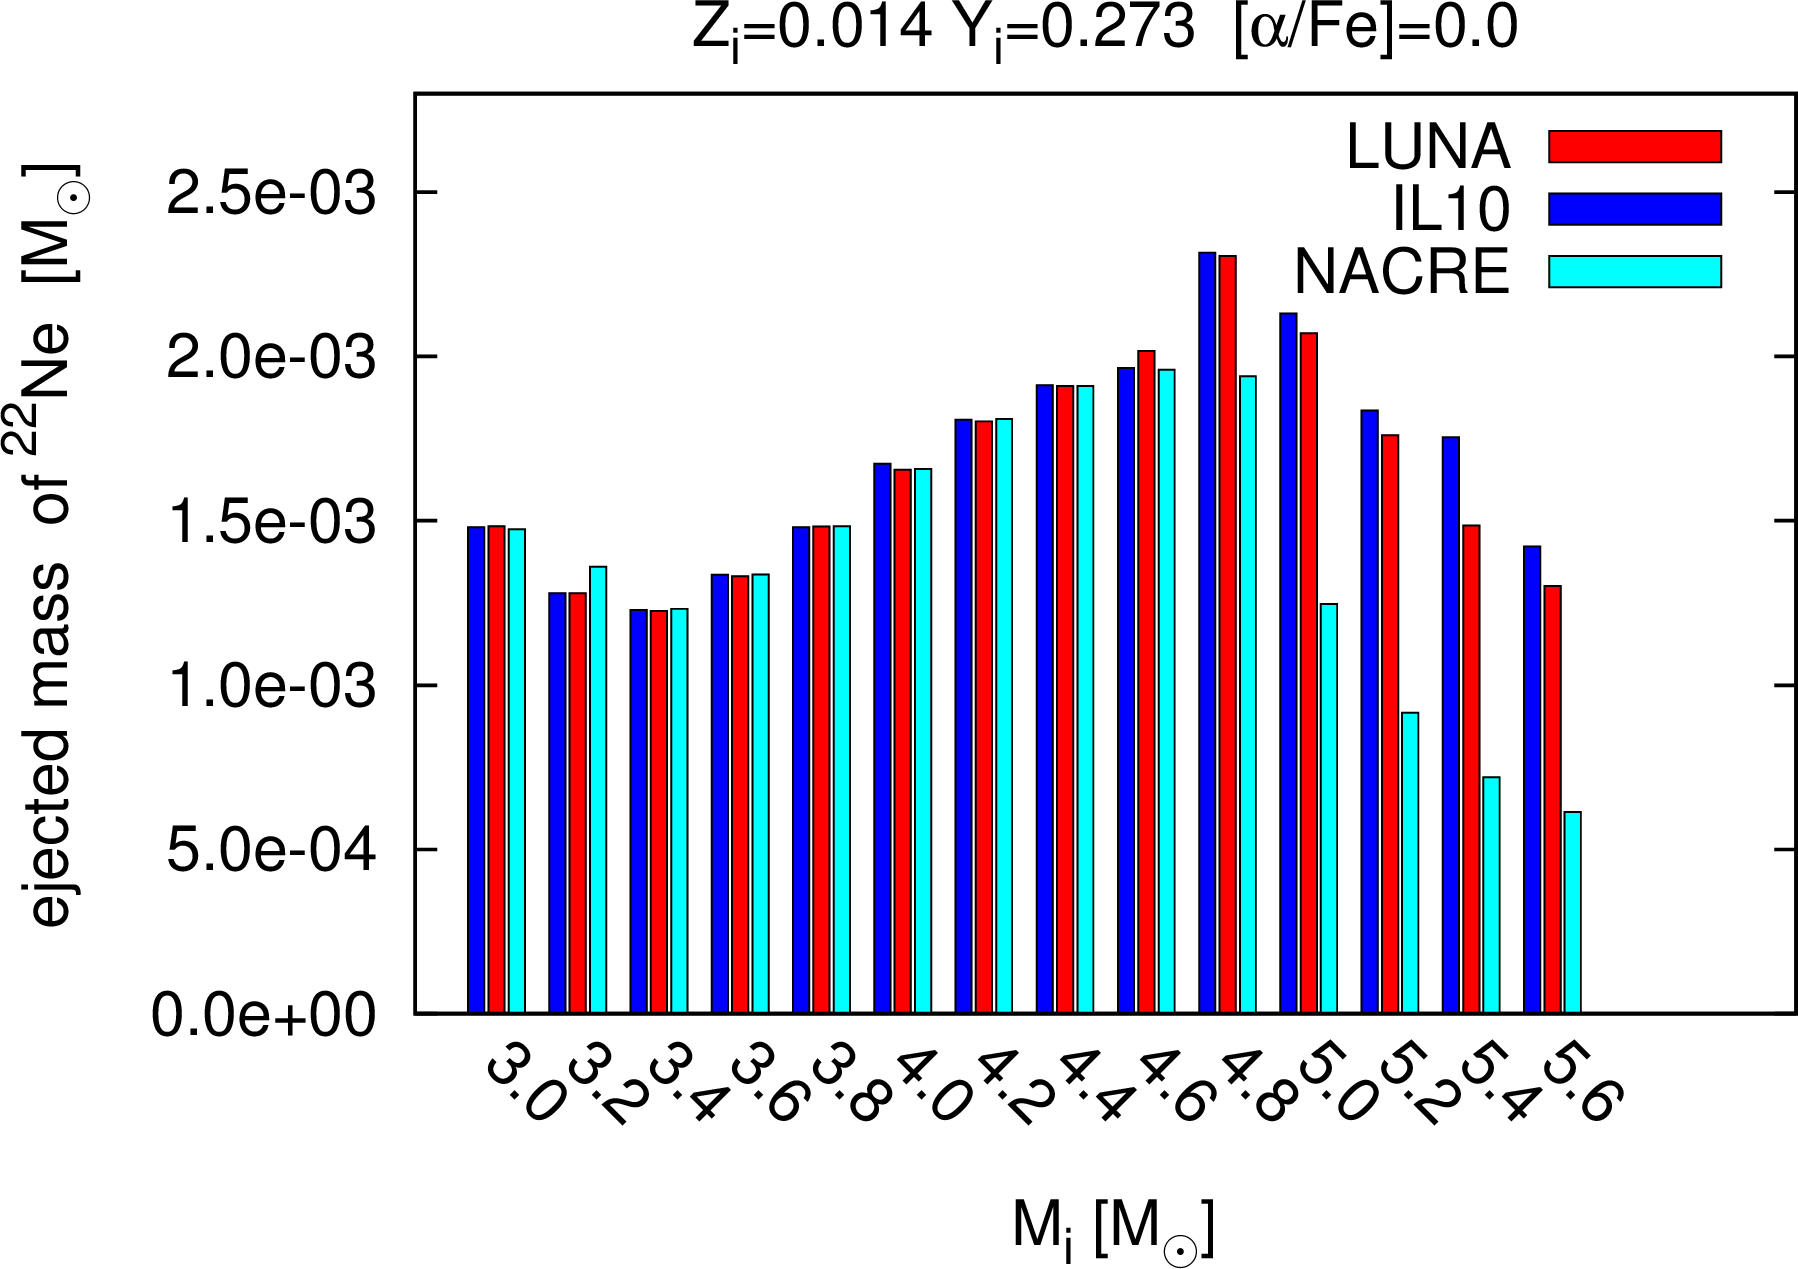
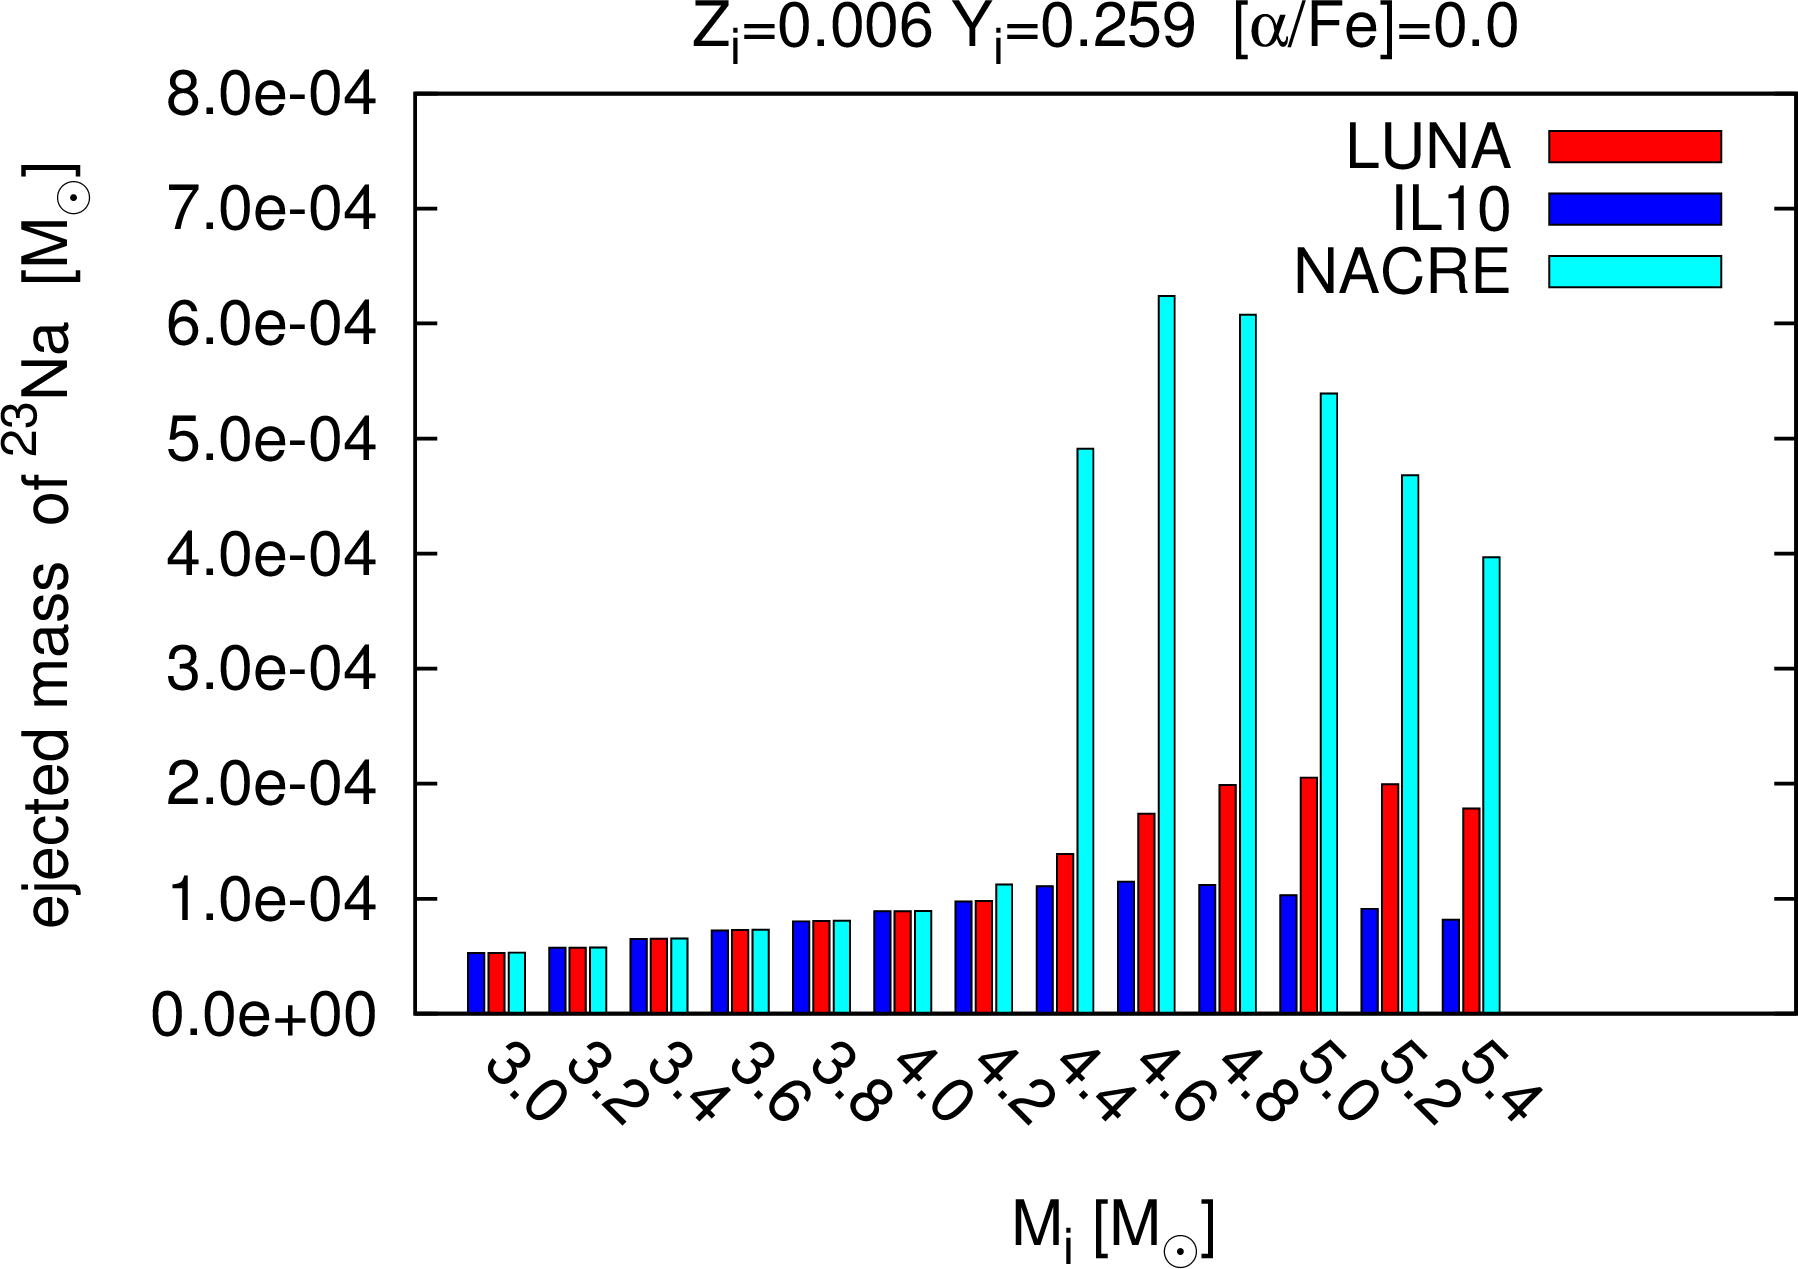
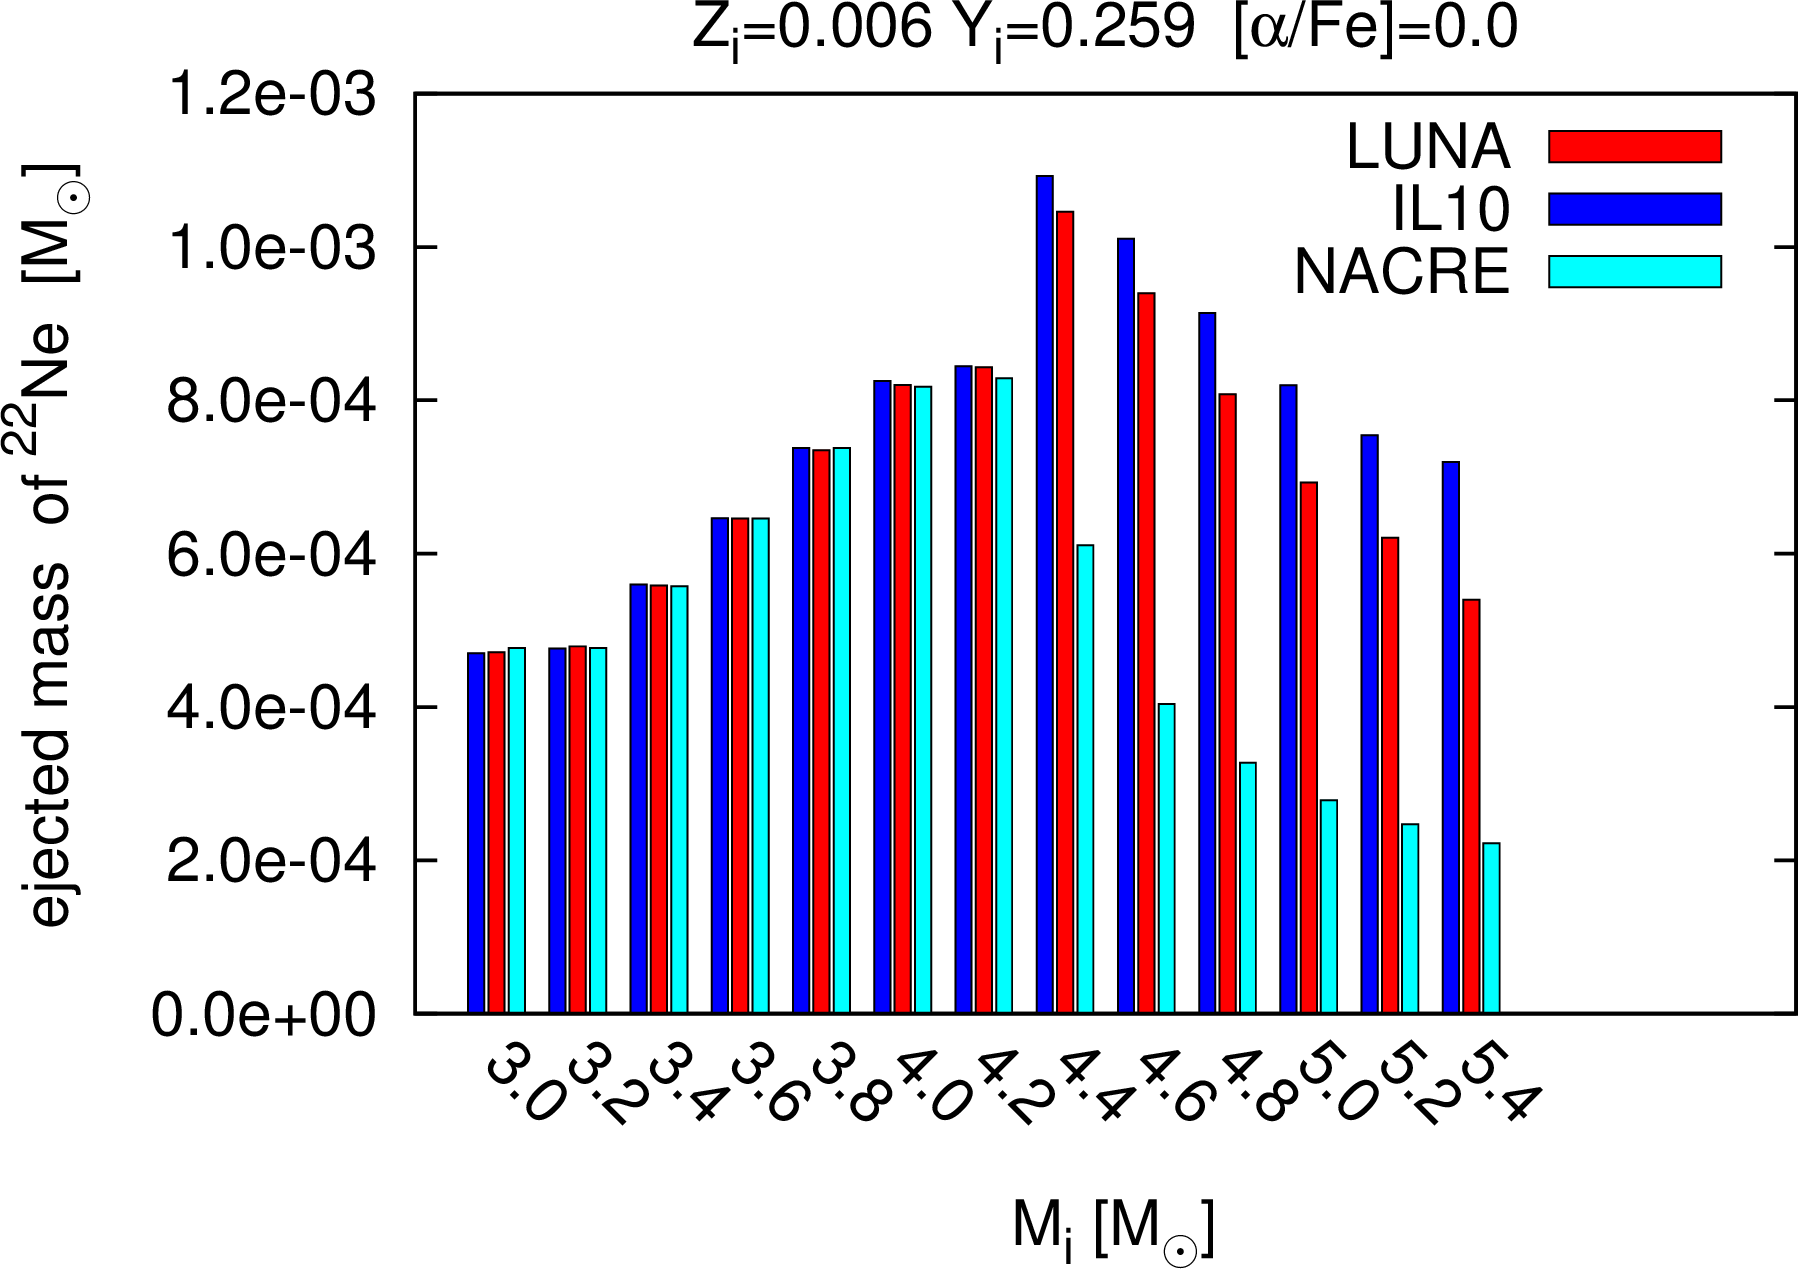
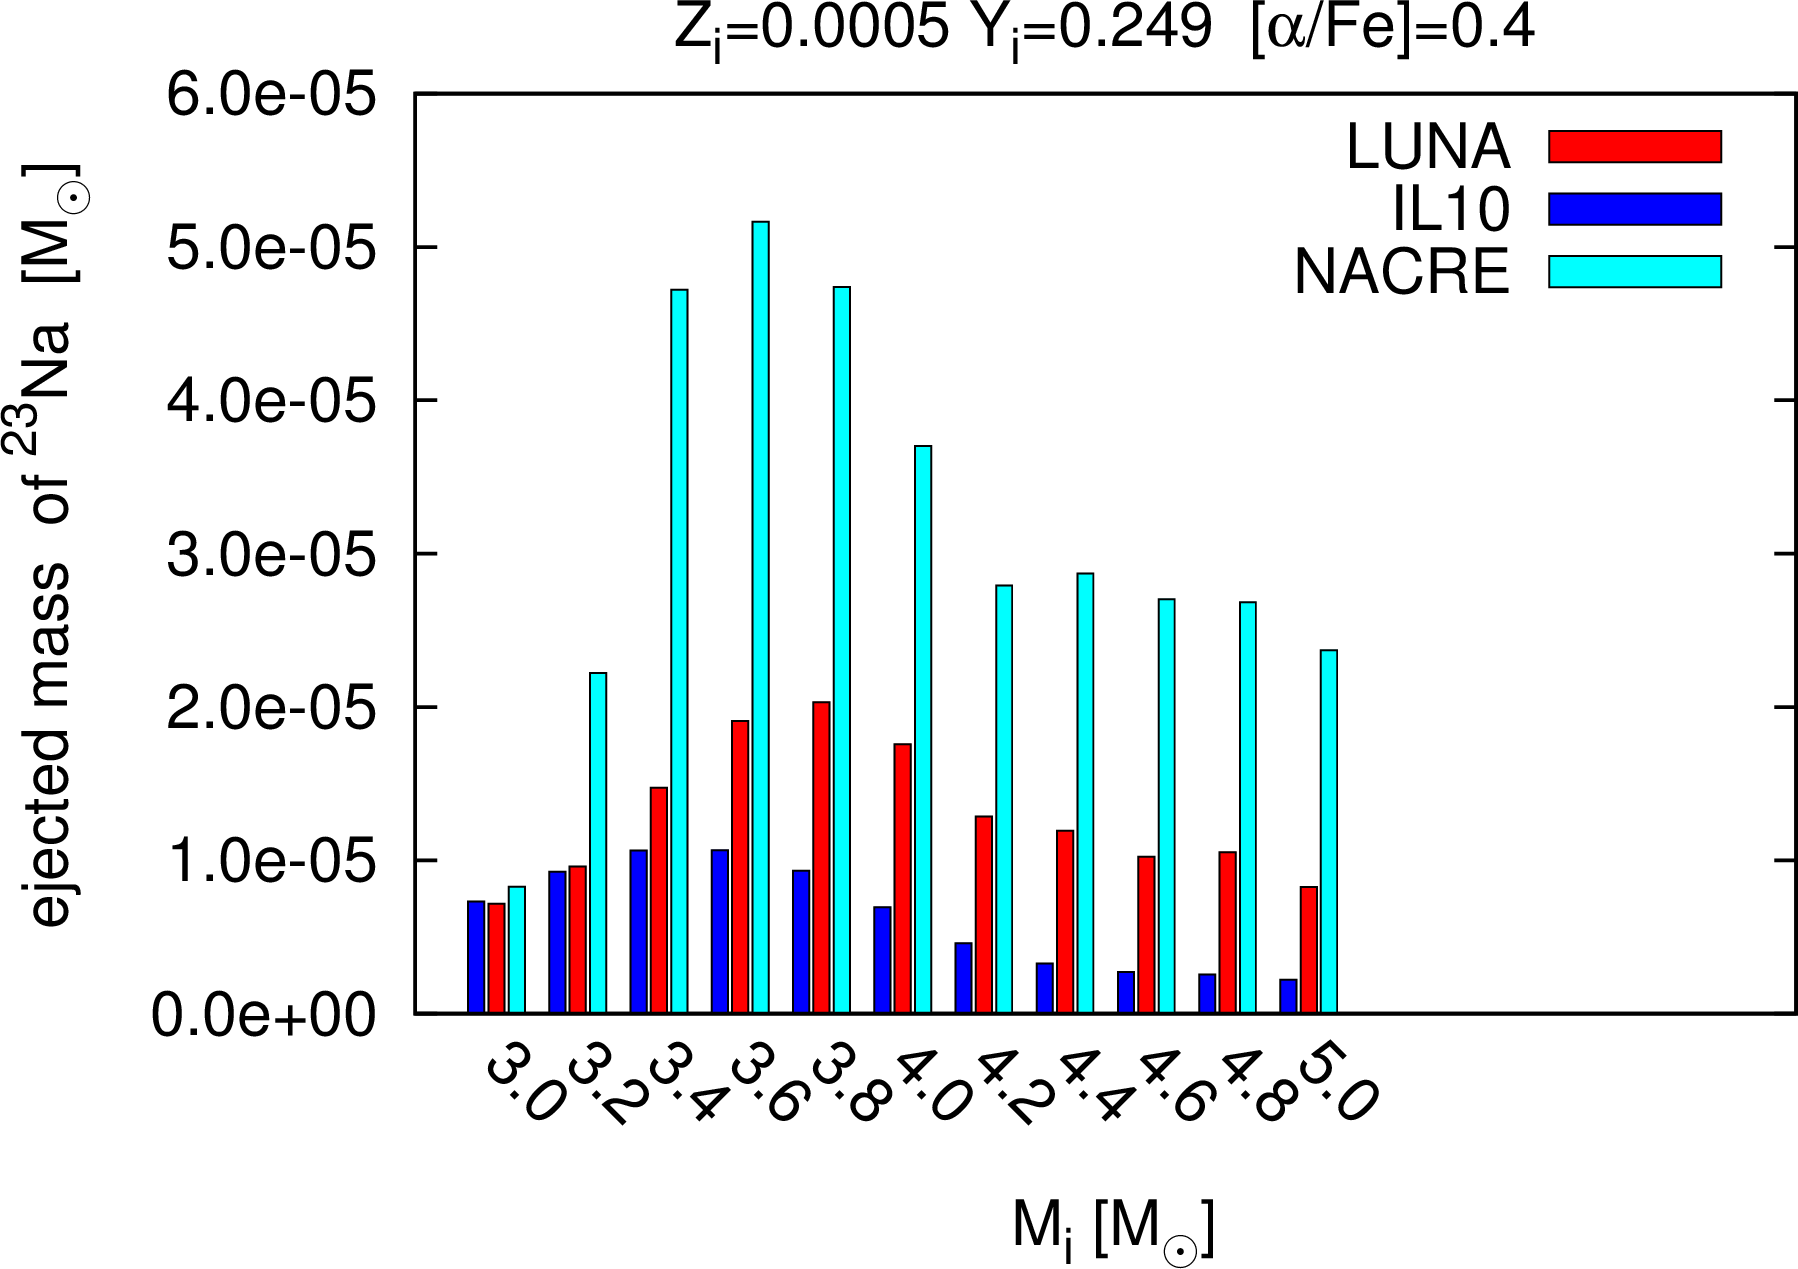
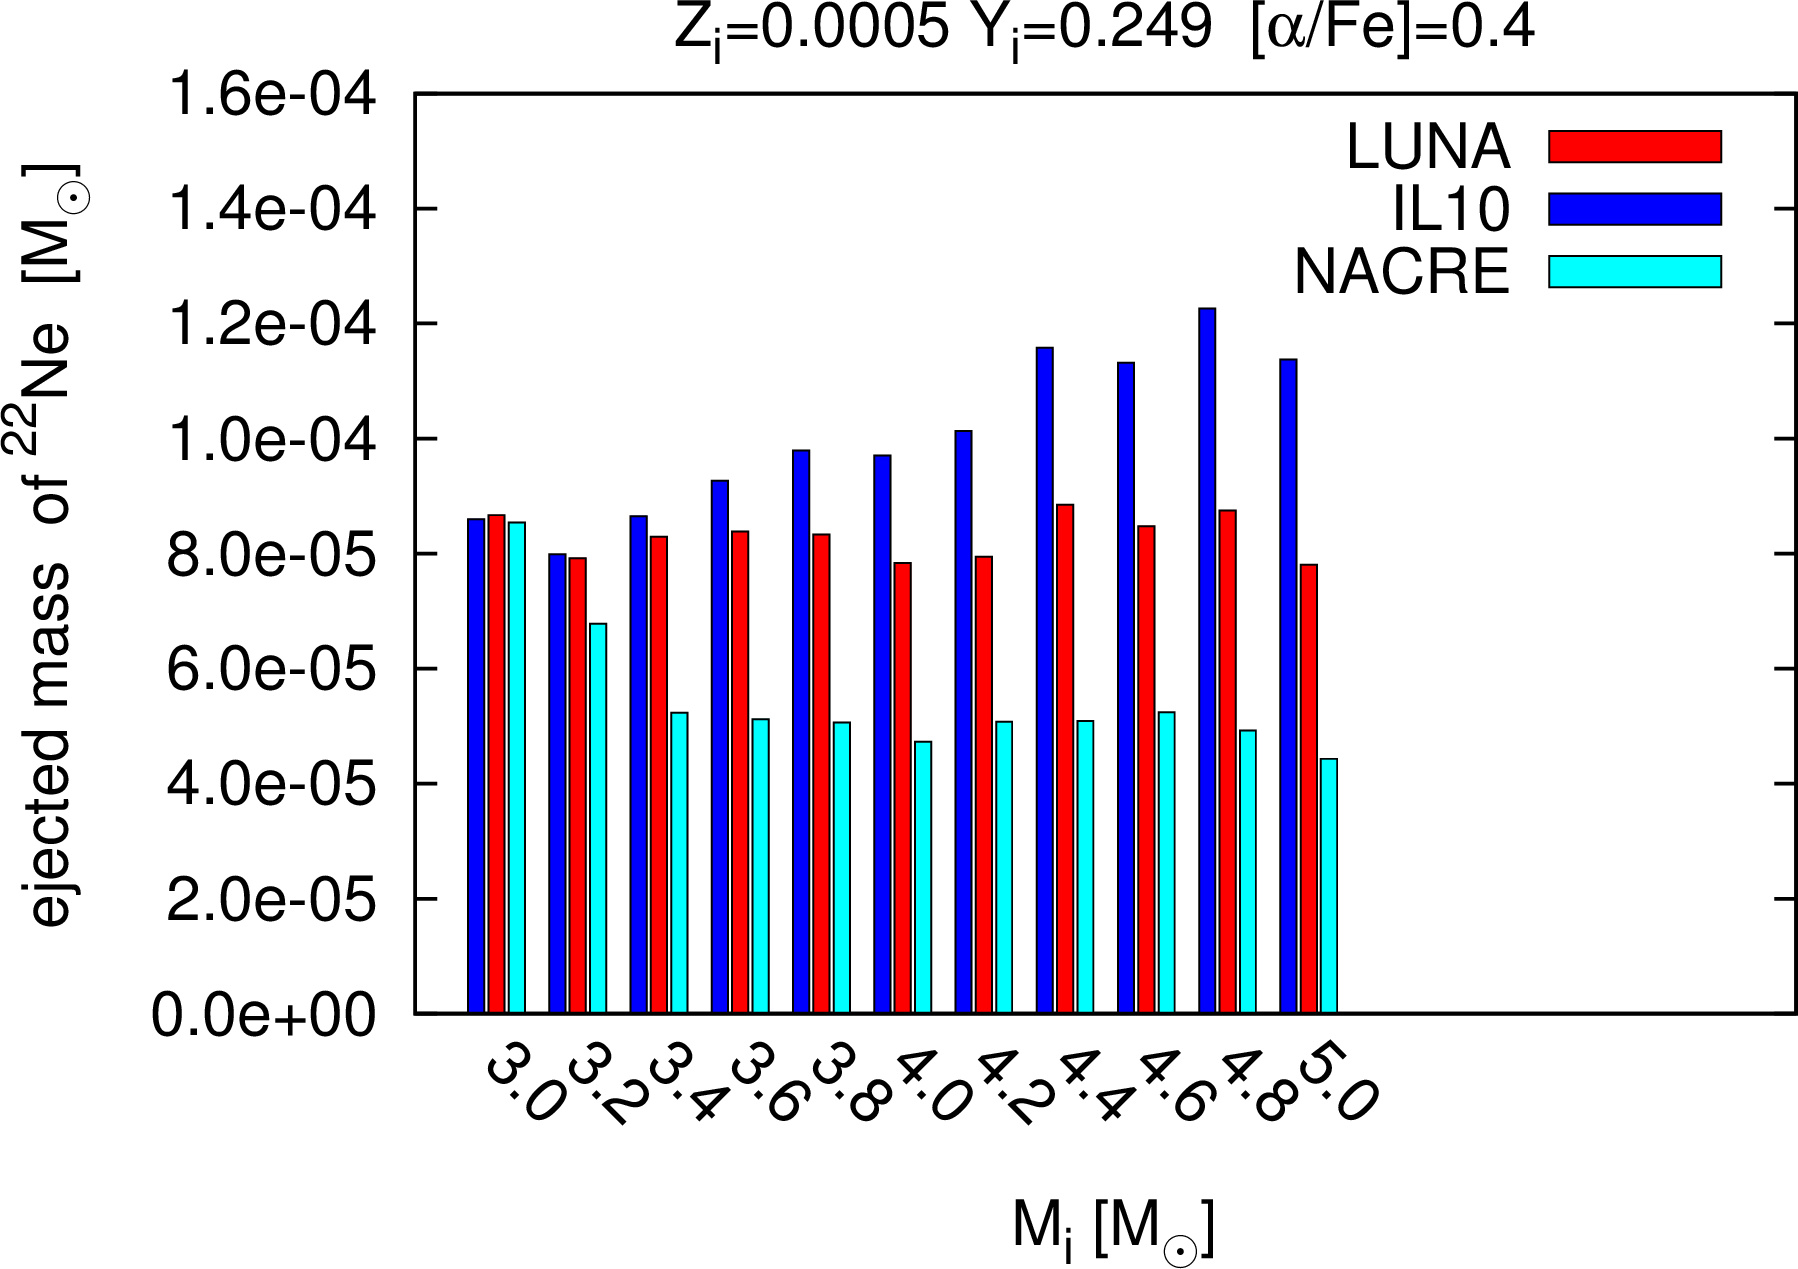
We also see that the trend of the 22Ne and 23Na ejecta with the stellar mass is not monotonic. At increasing stellar mass, the ejecta initially increase, reach a maximum, and then decrease again. The maximum 22Ne and 23Na ejecta do not occur at the same initial mass, but a lower mass for 22Ne, both decreasing with the metallicity.
These behaviors are the combined result of the strength of HBB, the efficiency of the third dredge-up, the TP-AGB lifetime, and their dependencies on stellar mass and metallicity.
5.1 Nuclear versus stellar model uncertainties
We discuss here the impact of the uncertainties associated to the nuclear rate cross sections, as well as those produced by evolutionary aspects that characterize the AGB evolution. As to super-AGB stars, the reader may refer to the studies of Doherty et al. (2014a, b).
5.1.1 Nuclear uncertainties
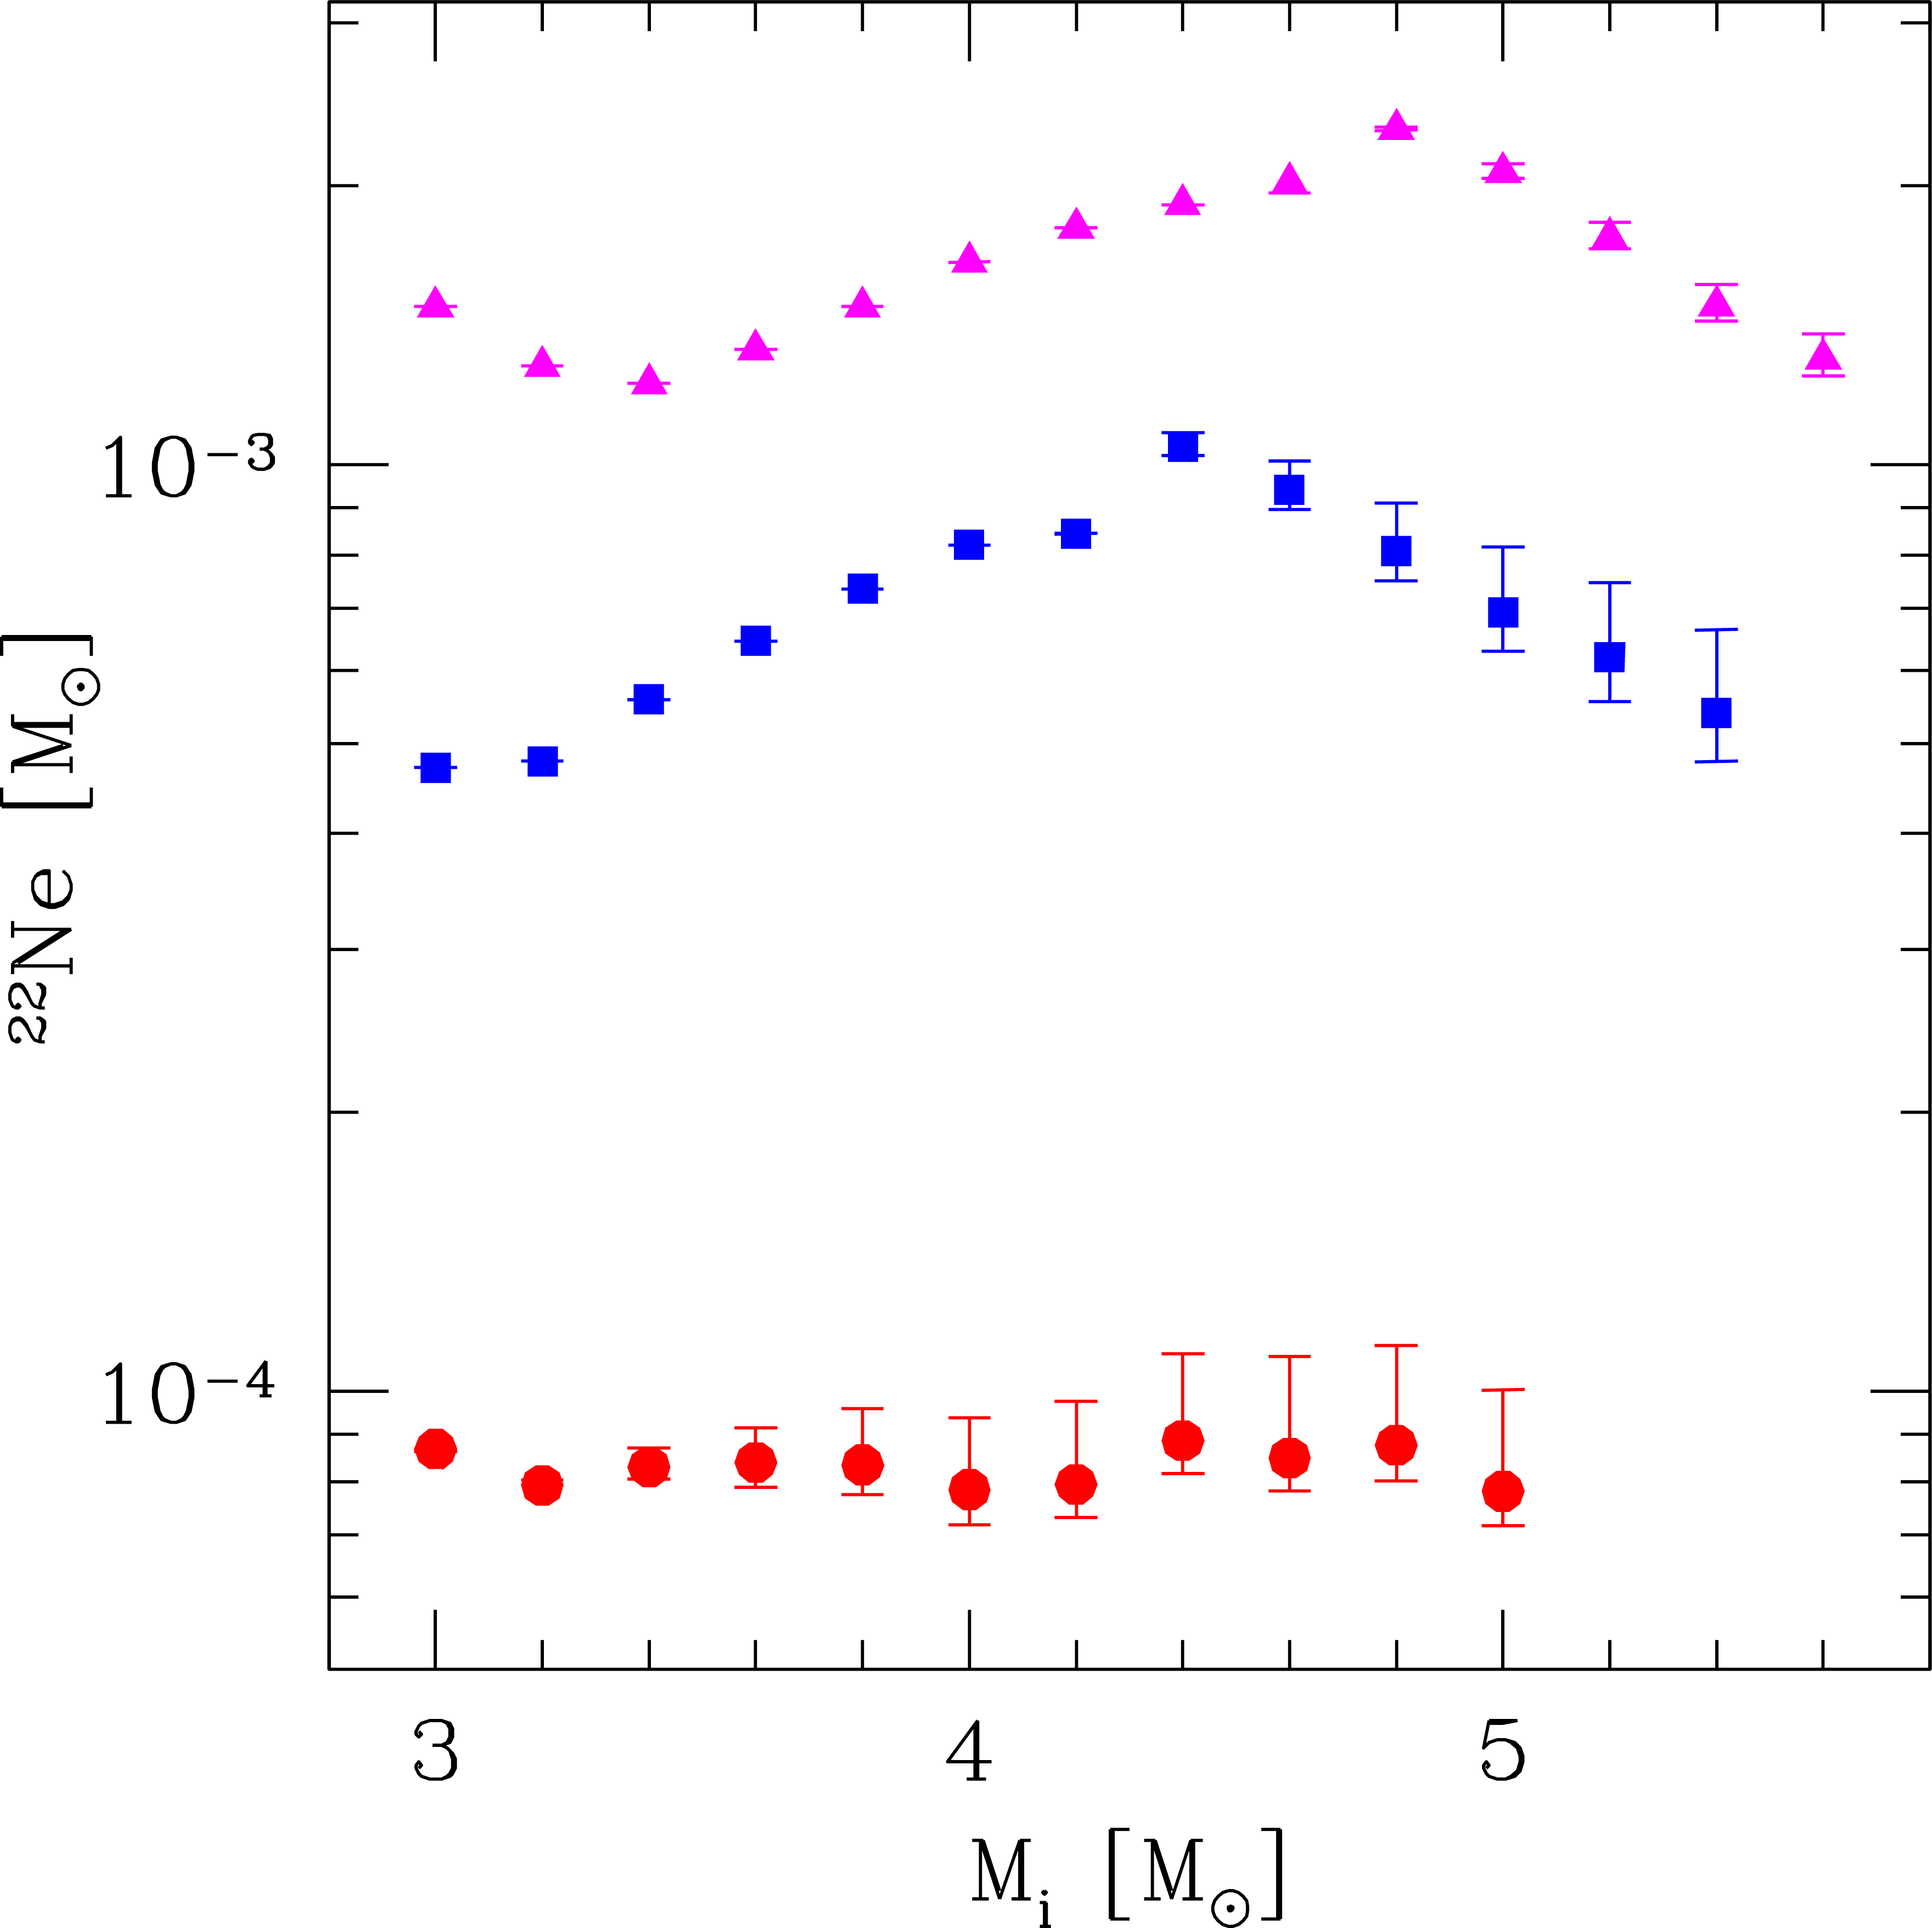
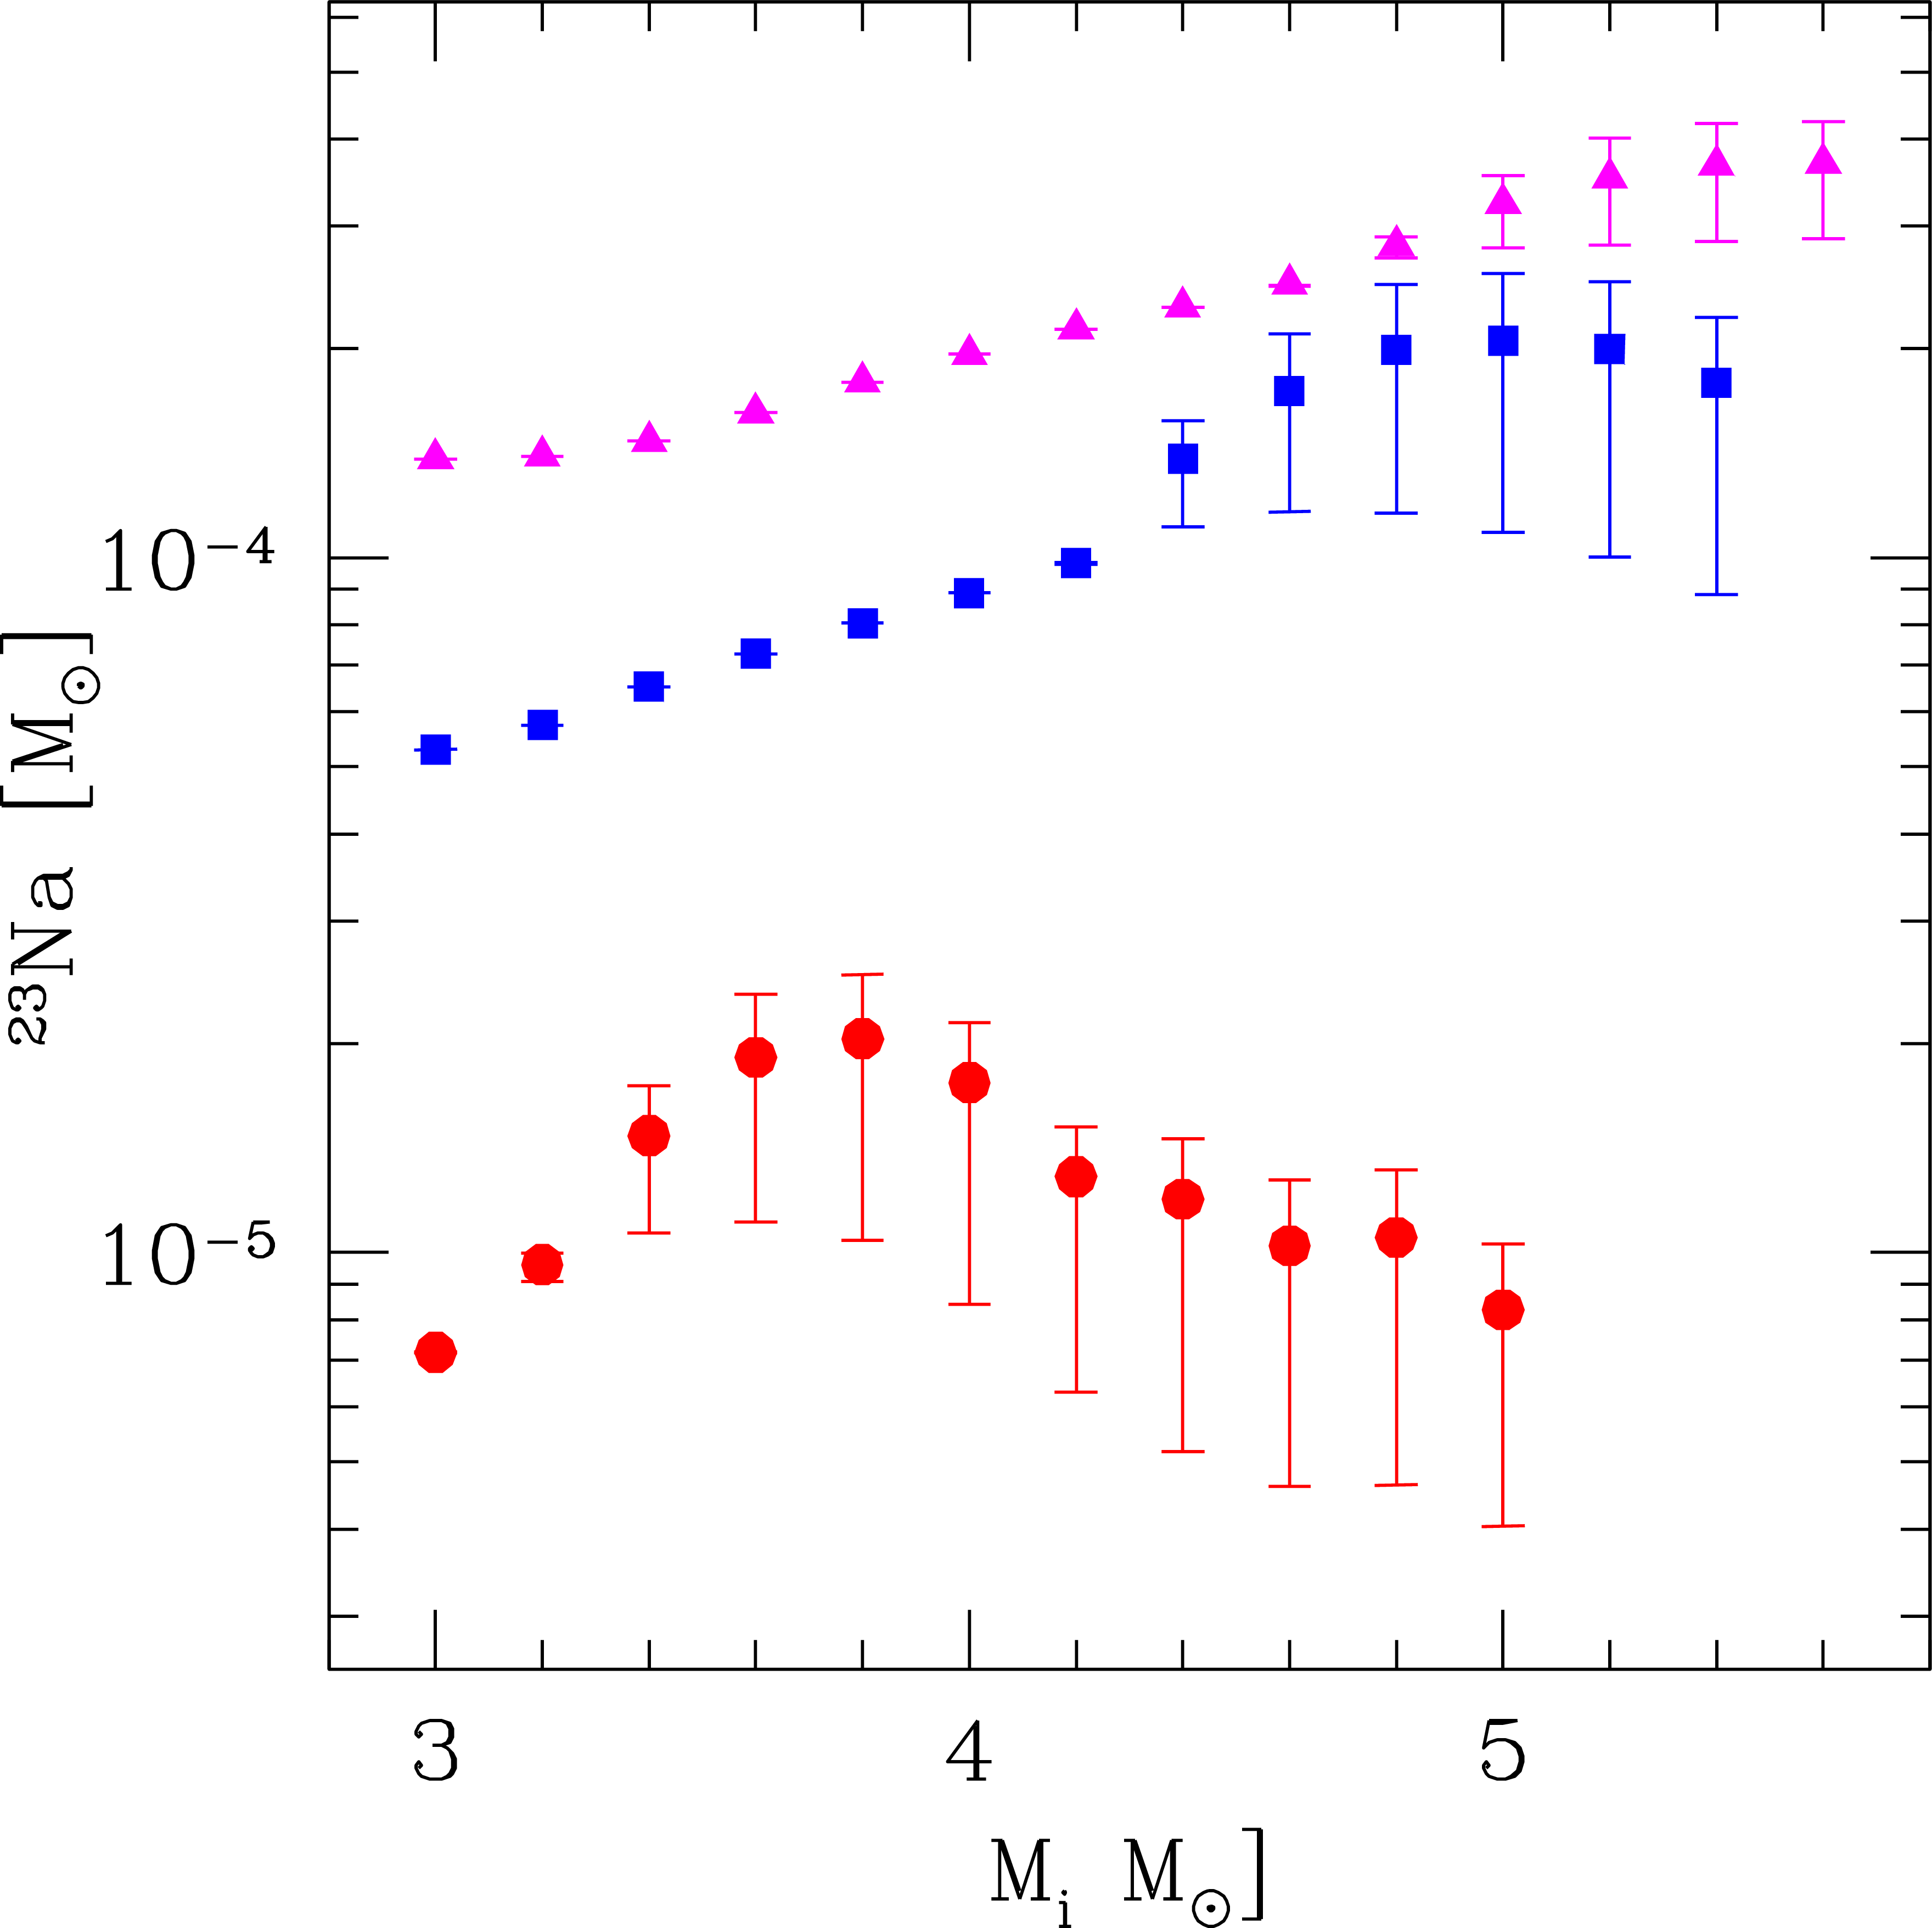
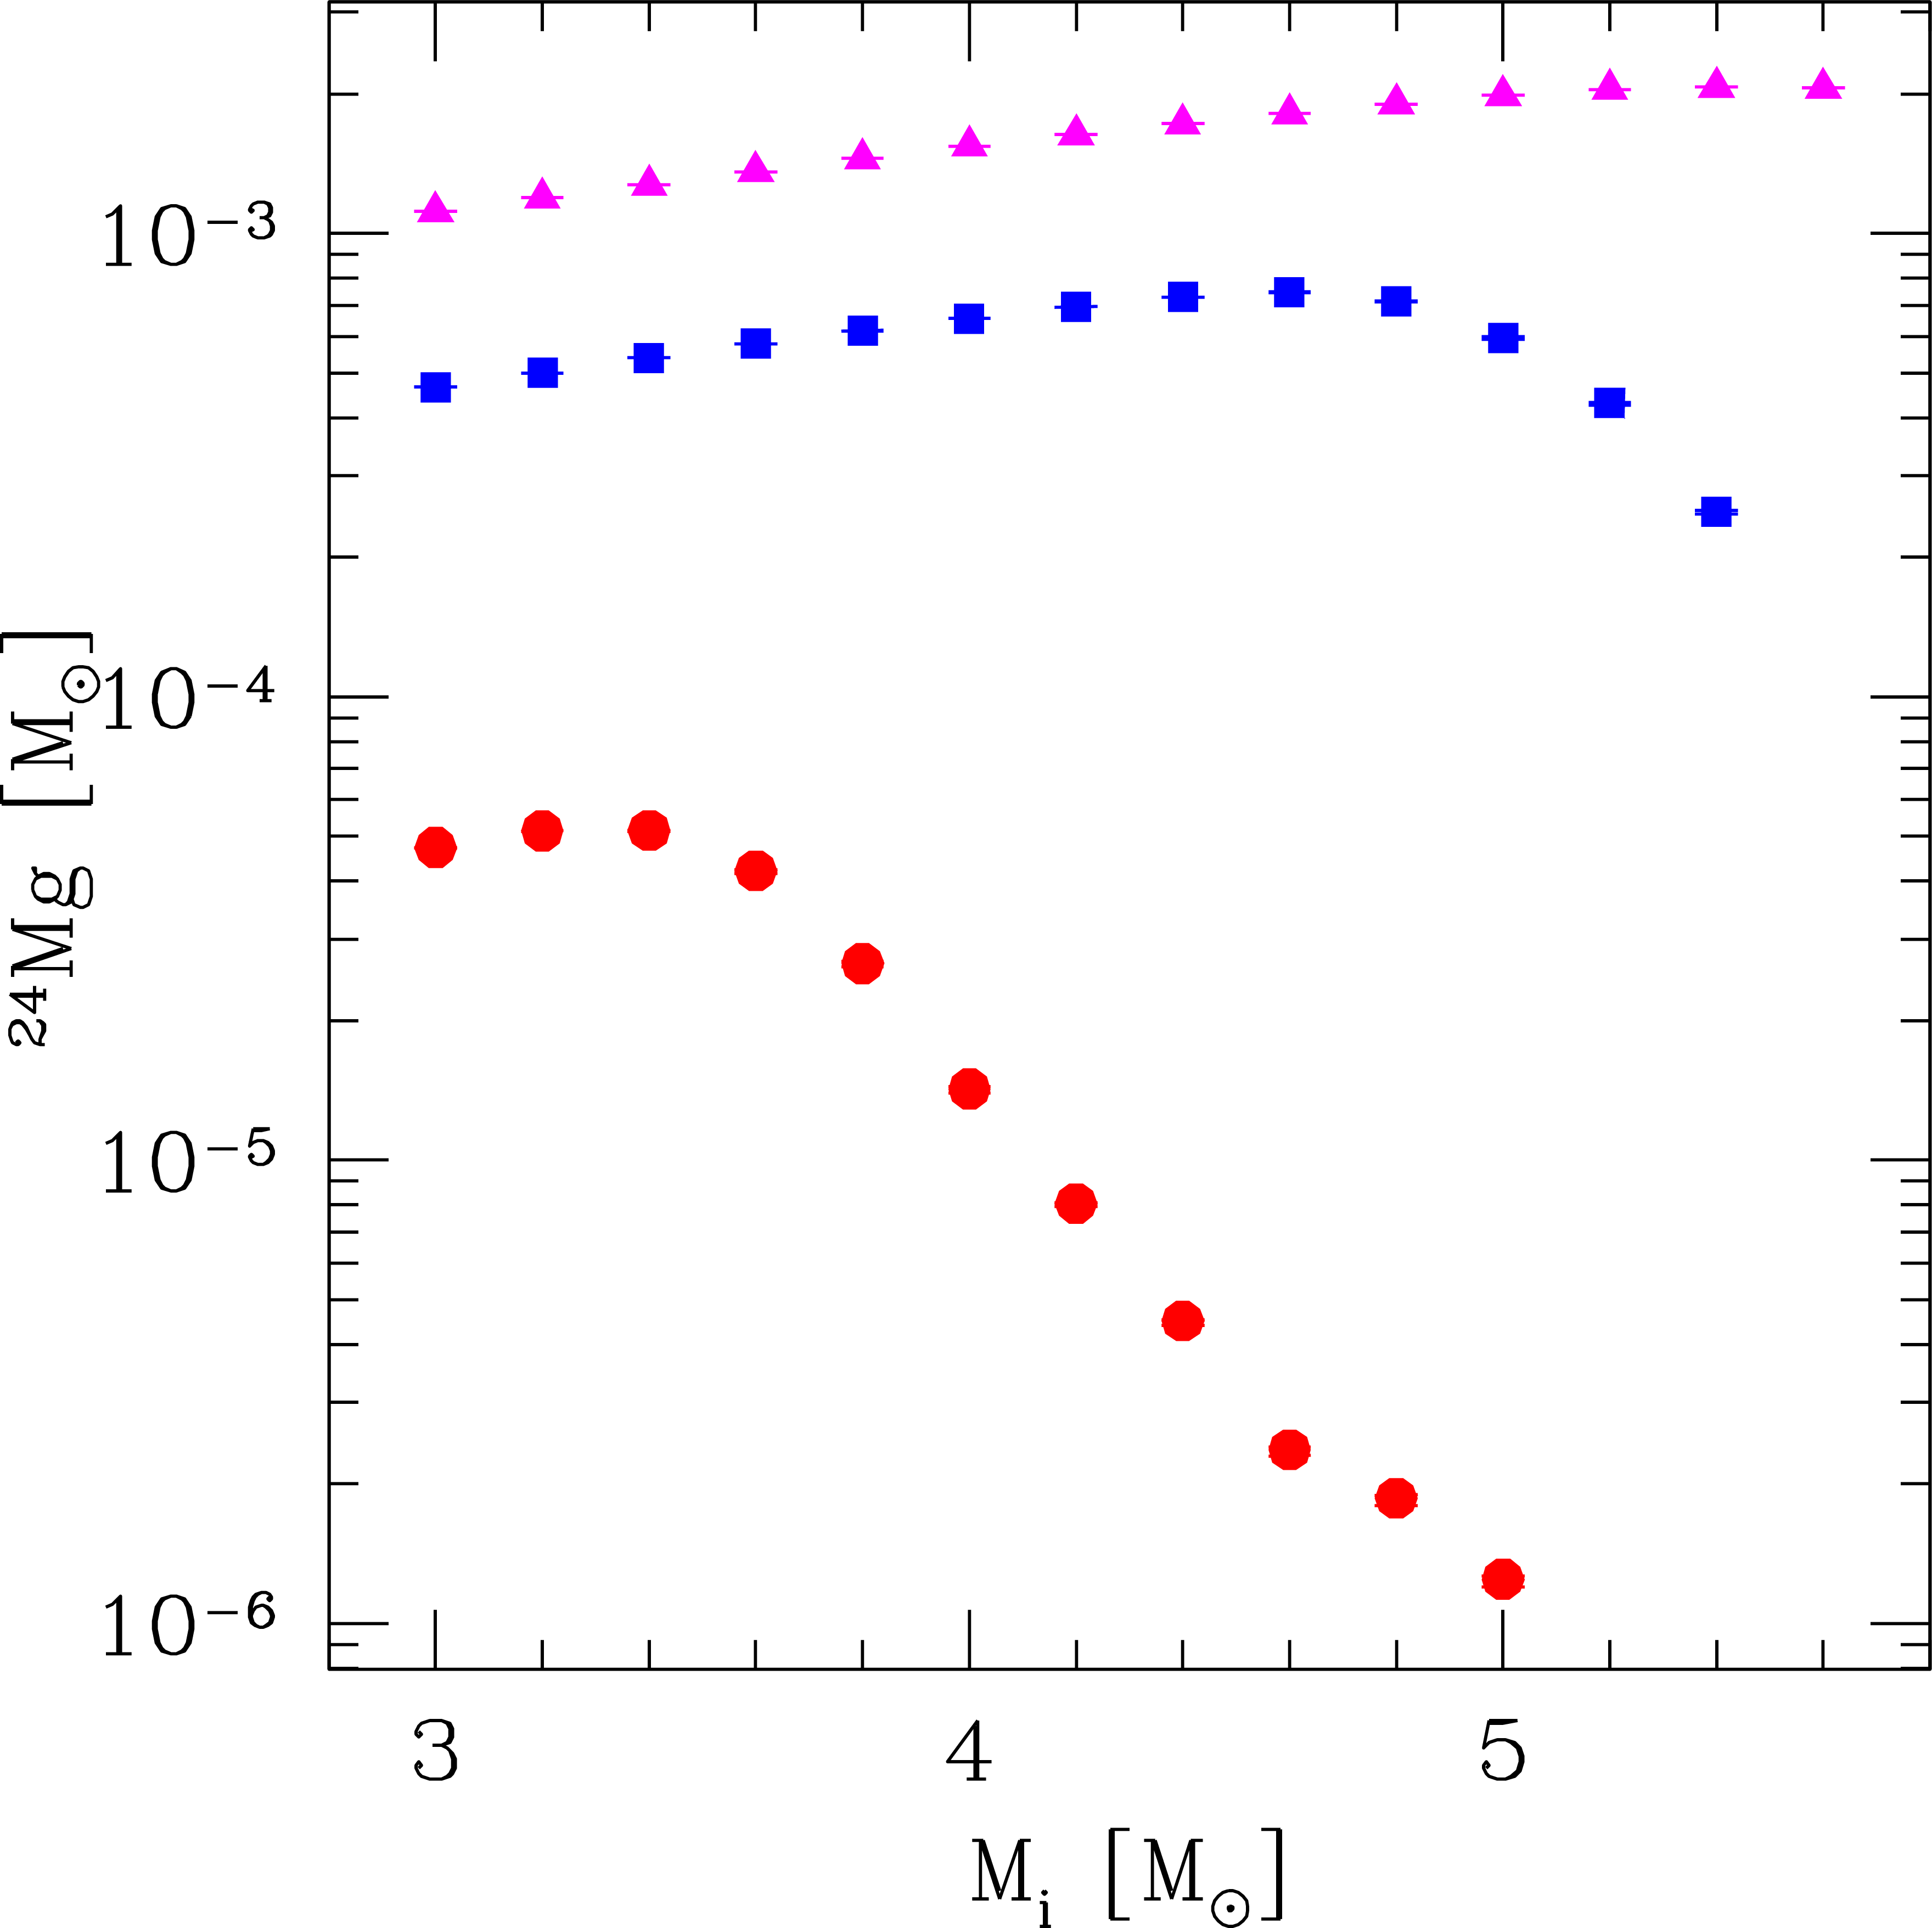
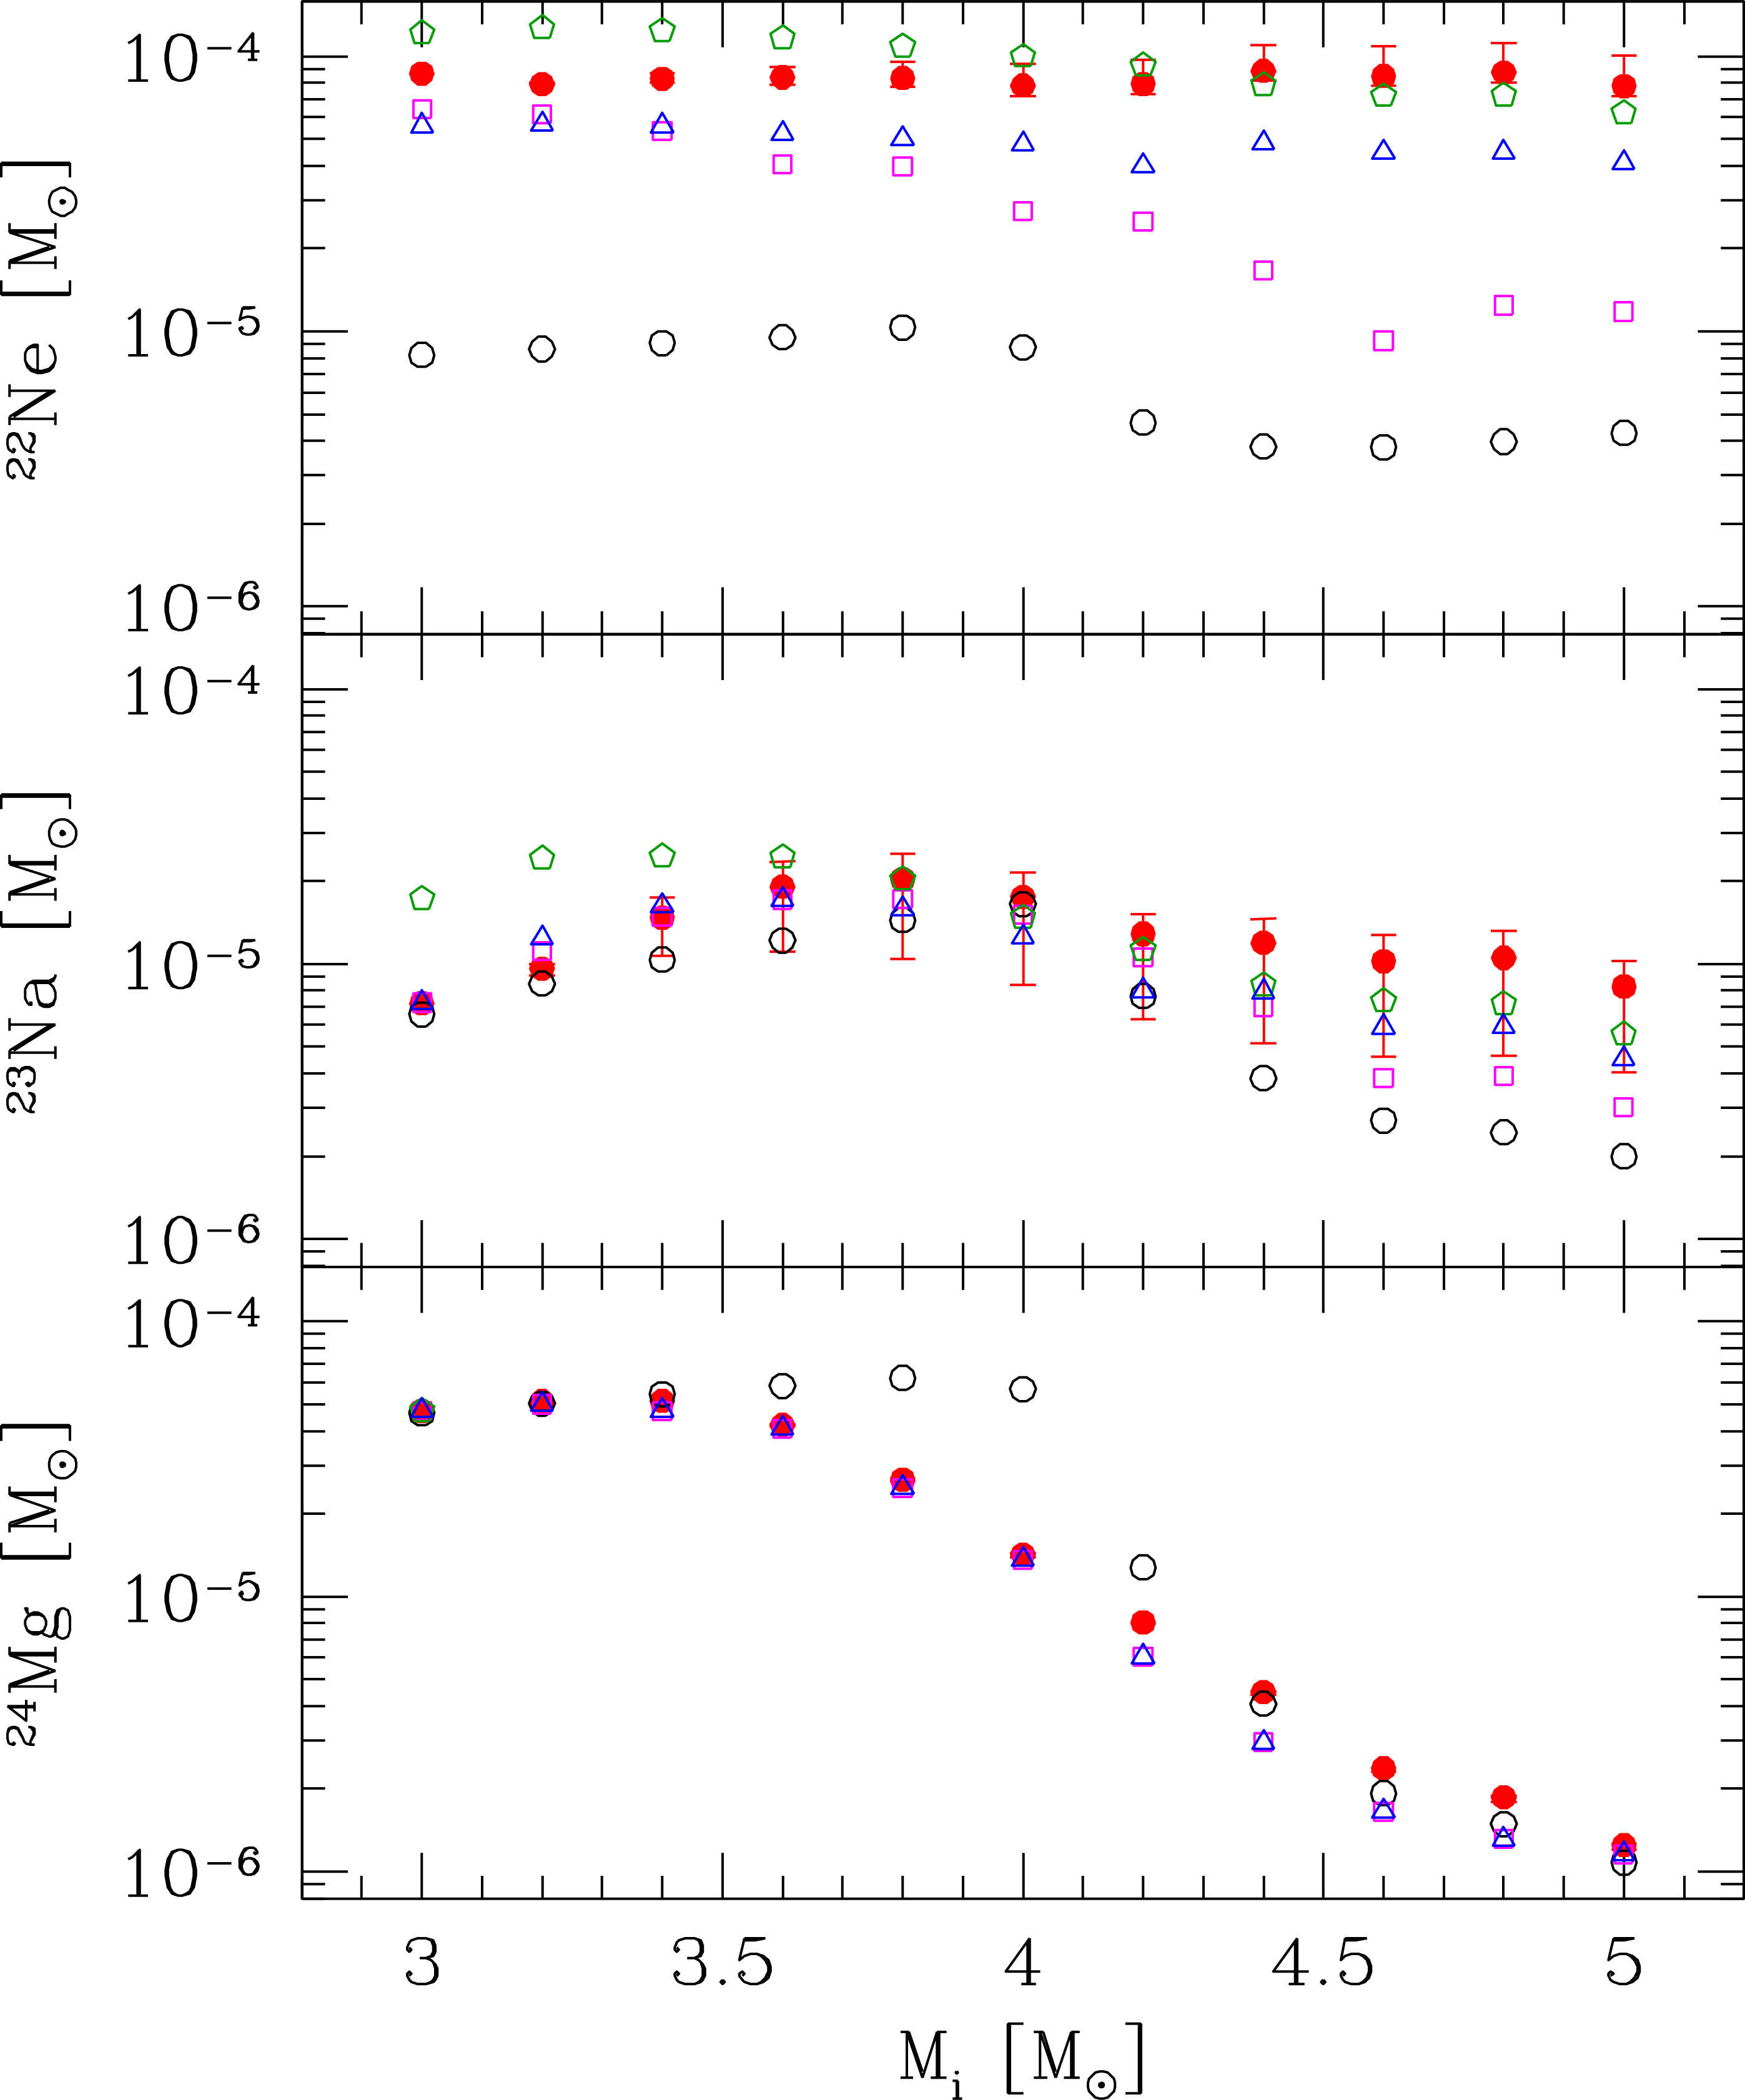
Figure 7 displays the uncertainties in the 22Ne, 23Na and 24Mg ejecta ascribed only to the current uncertainties in the LUNA rate of the 22NeNa reaction, for our reference set of stellar model prescriptions. The error bars for 22Ne and 23Na increase in models with larger initial mass and lower metallicity. This is not surprising since these conditions favor the development of HBB due to the higher temperatures attained at the base of the convective envelope.
Let us denote with and the ratios of the between the ejecta obtained with the lower and upper limits of the LUNA rate and the those obtained with the recommended LUNA rate. In the AGB models with and initial masses in the range the error bars for the 22Ne and 23Na ejecta correspond to factor pairs of and , respectively. These values are significantly lower than the error bars estimated by Izzard et al. (2007), who reported much wider ranges and for the 22Ne and 23Na ejecta produced by the lowest metallicity set of their synthetic TP-AGB models222The quoted results of Izzard et al. (2007) refer to stellar models with and . when varying the 22NeNa rate only.
The LUNA improvement is indeed striking for the upper limit of 23Na ejecta, as the relative uncertainty has decreased from to in the worst case. No significant effect is predicted for the ejecta of 24Mg.
To have a global evaluation of the nuclear uncertainties affecting the ejecta of 22Ne and 23Na we should consider other relevant reactions involved in the NeNa cycle, in particular , and . To this aim we refer to the results of detailed investigations carried out by Izzard et al. (2007) and more recently by Cesaratto et al. (2013).
In the work of Izzard et al. (2007) all reaction rates involved in the NeNa cycle were varied simultaneously in all possible combinations of lower and upper limits, available at that time. As to the 23Na+p rates, the reference rates were taken from Rowland et al. (2004), and multiplicative factors of and were adopted to define the lower and upper limits for the rates of and , respectively.
A conclusion of the study by Izzard et al. (2007) was that the ejecta of 22Ne and 23Na are mainly affected by the uncertainties of the 22NeNa rate (see tables 6 and 7 of Izzard et al. (2007)). Only for 23Na the lower-range uncertainties in the ejecta were found to be somewhat influenced by the uncertainties in the destruction rates 23Na+p (see their table 7).
More recently, Cesaratto et al. (2013) calculated new rates for and based on nuclear experiments which allowed, for the first time, to derive an upper limit estimate for the strength of a 138-keV resonance, until then neglected in previous studies. A consequence of this is that the recommended rate for has been reduced significantly (by over one order of magnitude at GK), compared to the IL10 version. At the same time, the contribution of the 138-keV resonance is found to be negligible for the reaction and the revised rate of Cesaratto et al. (2013) is in excellent agreement with that of IL10.
As a result, the 23Na destruction due to proton captures appears to be totally dominated by the reaction over the temperature range relevant for HBB. The reaction rate ratio is all over the temperature interval characteristic of HBB, so that a minor leakage into the Mg-Al cycle is expected (see figure 16 of Cesaratto et al., 2013).
Therefore, despite the large reduction of the rate, the impact on the abundance of 23Na is quite small. In their test nucleosynthesis calculations, applied to an AGB model with HBB, Cesaratto et al. (2013) derived an increase in the final 23Na abundance by only compared the predictions obtained with the IL10 rate.
Concerning the present estimates for the lower and upper limit uncertainties of the 23Na+p reactions over the range temperature range 0.07-0.1 GK, the typical dividing/multiplicative factors with respect to the recommended rate do not exceed in the case of the IL10 rate for , and are within the range in the case of the rate for revised by Cesaratto et al. (2013). These values correspond to relatively small uncertainties and should be taken into consideration when discussing the role of AGB stars with HBB in the context of the observed O-Na anti-correlations of GGC stars (see Section 6).
5.1.2 Evolutionary uncertainties
It is instructive to compare now the current nuclear uncertainties with those that are driven by stellar evolution uncertainties. It is well known that the most problematic aspects to treat on theoretical grounds are those related to mass loss, third dredge-up and HBB, due to our still defective knowledge of the complex physics involved. Basically, we lack an accurate determination of the efficiency of these processes, and how they vary with the mass and the composition of the star.
Mass loss is commonly parameterized in AGB stellar models and several possible options are available. Depending on the adopted mass-loss rate prescription quite significant differences arise in the evolutionary models, mainly in terms of lifetimes, number of thermal pulses, chemical enrichment, final core mass, and HBB over-luminosity (see, e.g. Rosenfield et al., 2016; Kalirai et al., 2014; Ventura & D’Antona, 2005b). HBB efficiency is also critically affected by the adopted theoretical framework to treat convection and its related parameters (e.g., Ventura & D’Antona, 2005a). The depth of the third dredge-up is still much debated among AGB modelers (e.g., Marigo & Girardi, 2007; Marigo, 2015, for a review), as it critically depends also on technical and numerical details (Mowlavi, 1999a; Frost & Lattanzio, 1996). For massive AGB stars with , the situation is particularly heterogeneous, as the predictions for the efficiency vary from high ( or larger, e.g. Herwig, 2004; Karakas et al., 2002; Vassiliadis & Wood, 1993), to moderate (e.g., Cristallo et al., 2015; Ventura & D’Antona, 2008). In this mass range direct constraints from observations are still lacking, making the overall picture rather unclear.
In view of the above, we estimated the impact of stellar evolution assumptions computing additional TP-AGB models with (, [/Fe]=0.4), each time changing an input prescription. The adopted prescriptions are summarized in Table 2. With respect to the reference model, calculated following , the changes were applied to the mixing-length parameter , the mass-loss rate , and the third dredge-up efficiency . The reference model is characterized by a very efficient third dredge-up (with a maximum close to unity; see right panels of Fig. 4), a relatively efficient HBB which leads to the activation of the CNO, NeNa, MgAl cycles (see Fig. 5), and a mass-loss prescription that was calibrated on a sample of Galactic Miras.
The sequence of the four models was chosen to test the effect on the ejecta of 22Ne, 23Na, and 24Mg when varying the strength of the aforementioned processes. It is worth noting that there is a strong coupling among them so that a change in one process may have a sizable impact also on the others. The main results are presented in Fig. 8 for the whole mass range considered and the lowest metallicity , for which HBB is expected to be most efficient.
Efficiency of mass loss:
Models and differ from model in terms of the mass-loss law. While model adopts the popular mass-loss formula proposed by Vassiliadis & Wood (1993, hereinafter also VW93), model uses the Blöcker (1995) prescription with the efficiency parameter , which gives much higher rates. We find that the VW93 model predicts chemical ejecta that are comparable with those of the reference models. In fact the two mass-loss prescriptions, though based on different approaches and different calibration samples, share a similar functional dependence that predicts an exponential increase of during the initial stages of the TP-AGB evolution (see the discussion in Marigo et al., 2013).
Large differences show up, instead, between the , models, and the models . As to this latter group, the higher mass-loss rates lead to a reduction of the TP-AGB lifetimes, particularly significant for the most massive and luminous AGB stars. For instance, the model with suffers a lower number of third dredge-up episodes (14 instead of 30) and HBB remains active for a shorter time. As a consequence, compared to the reference models, the models predict ejecta of 22Ne and 23Na that are lower by factors in the range and , respectively. The reduction of the 24Mg yield is smaller, by factors in the range .
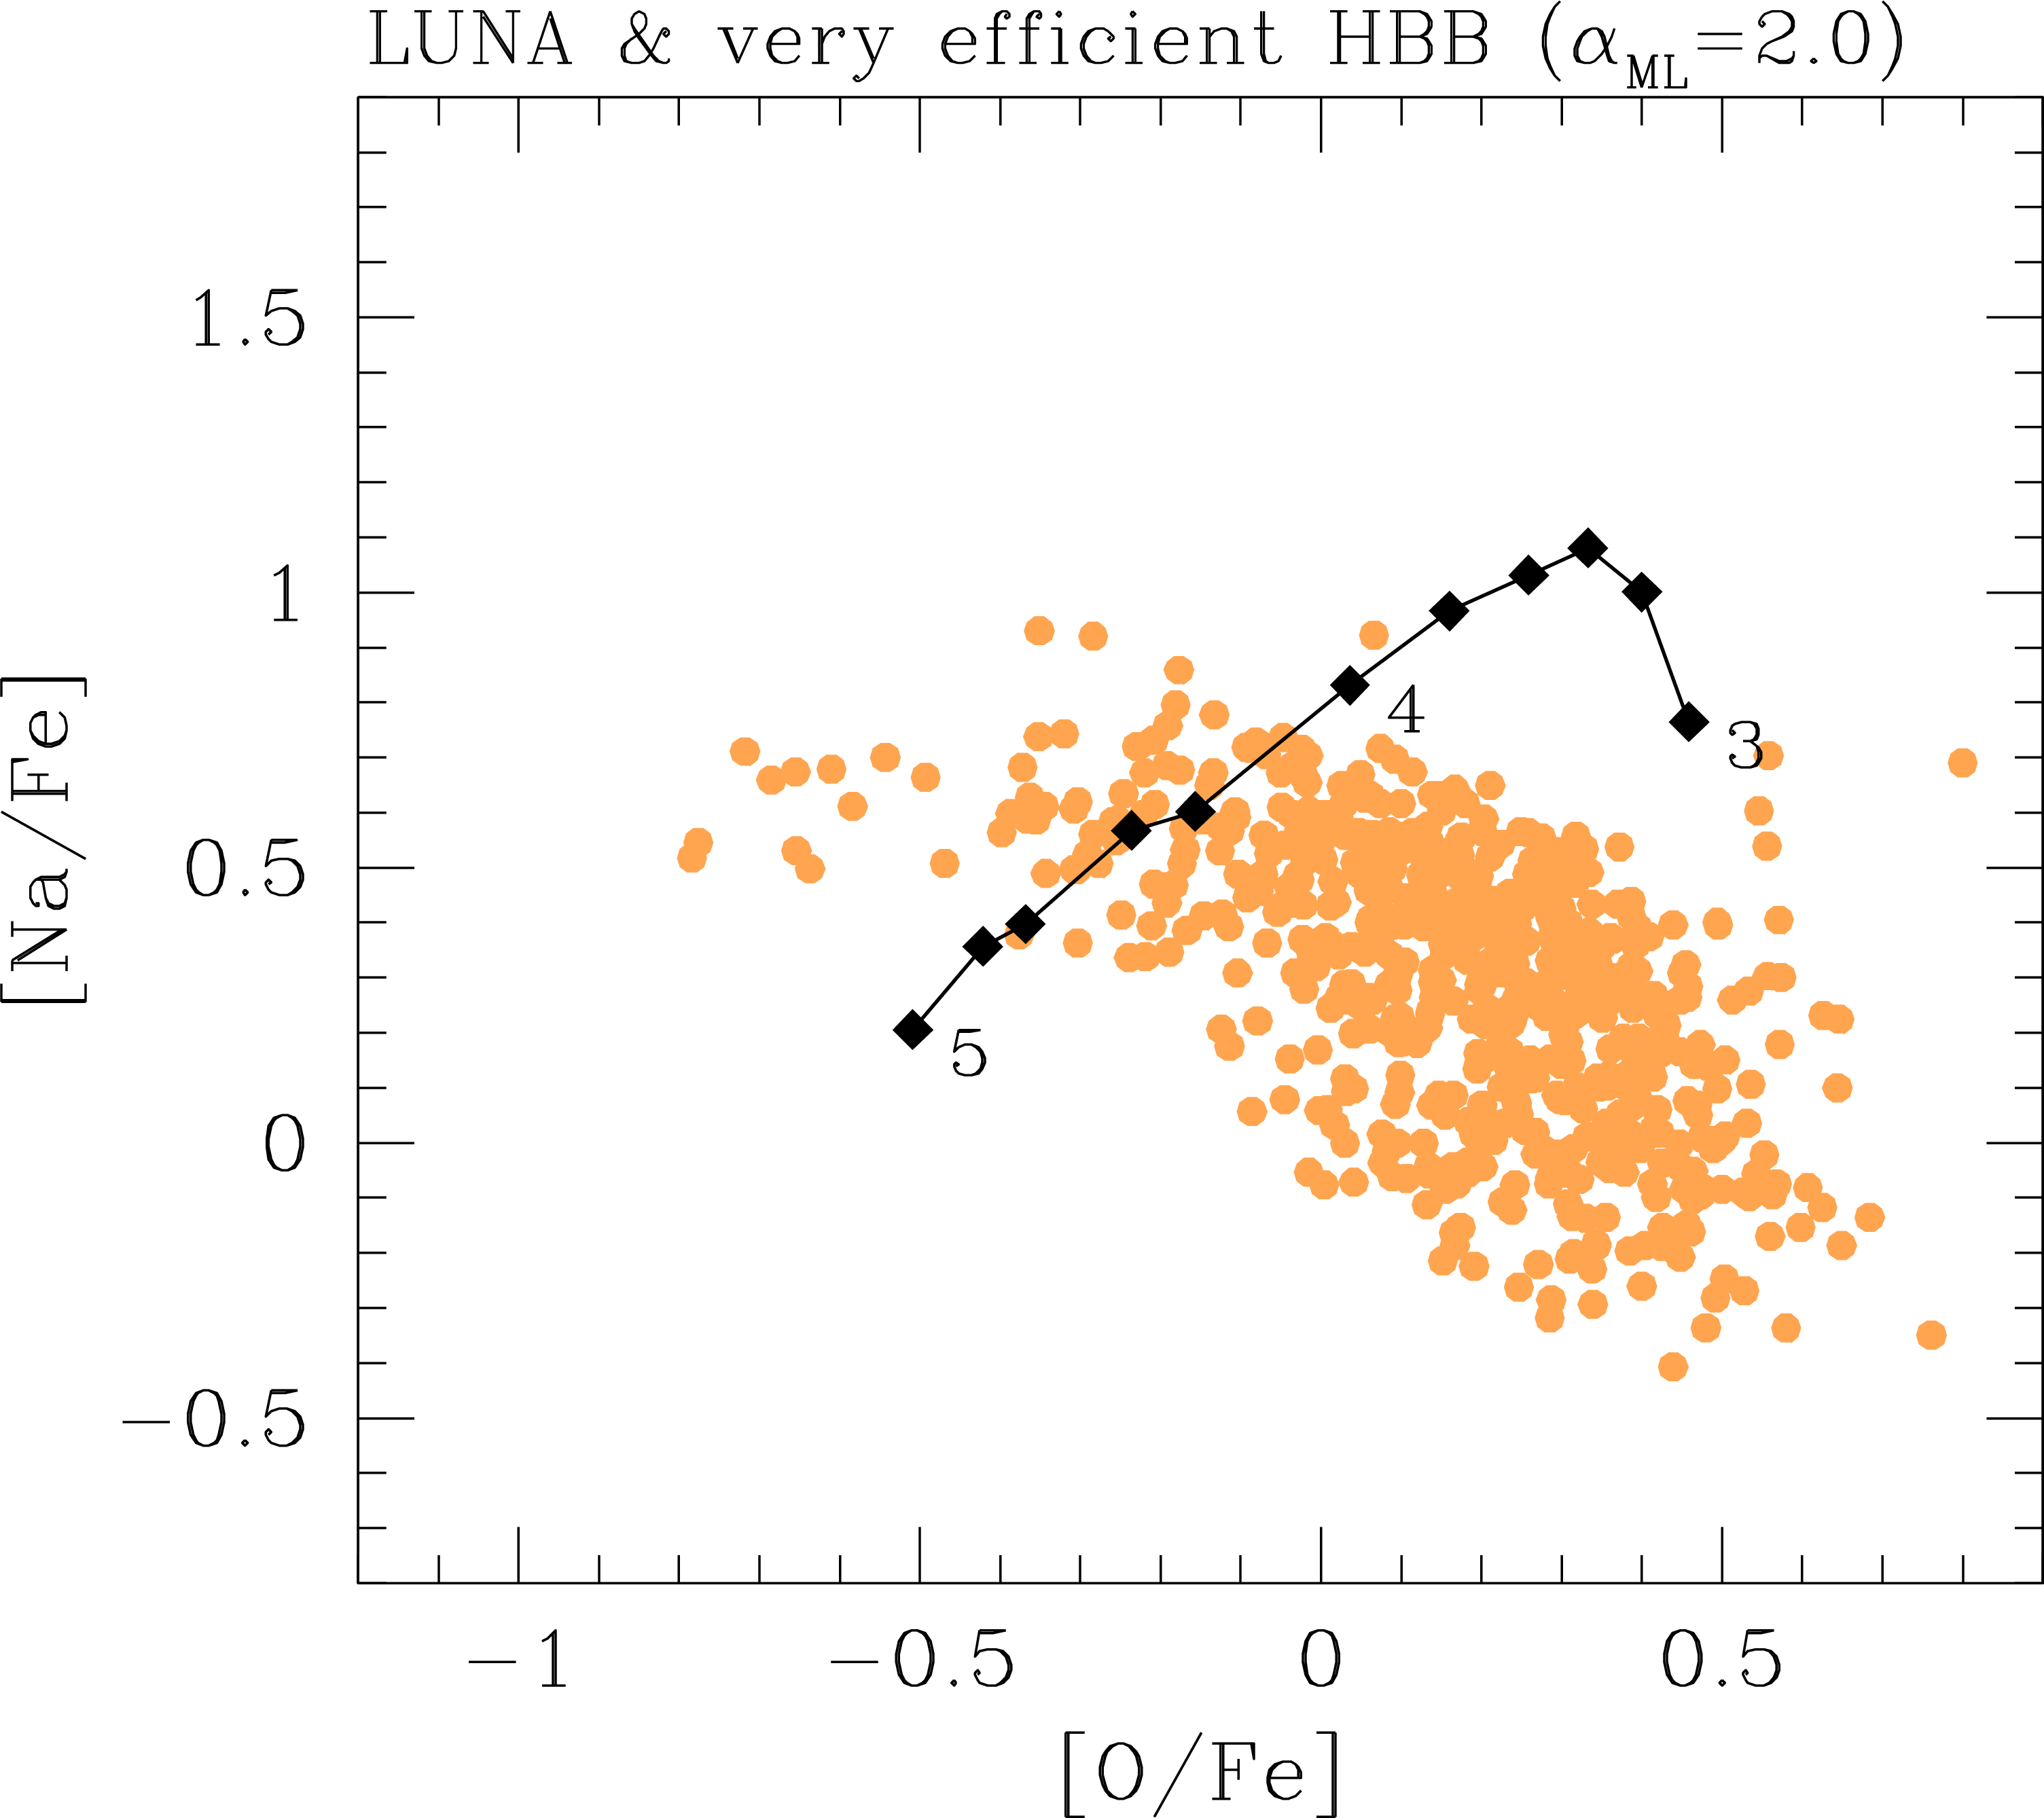
Efficiency of HBB:
Models test the effect of increasing the strength of HBB. This is obtained setting the mixing length parameter to a higher value () compared to the reference value (). As a consequence, hotter temperatures are attained in the deepest layers of the convective envelope so that nuclear reactions in NeNa cycle occur faster. Also, the maximum quiescent luminosity attained is larger (e.g., instead of for the reference model with ). Despite the stronger HBB, the integrated yields of 22Ne, 23Na, and 24Mg for models are found to be lower than the predictions (by factors in the range ). This is explained considering that the higher luminosities reached by models favor a more intense mass loss, which anticipates the termination of the AGB phase (e.g., 24 thermal pulses in model compared to 30 in model with ).
Efficiency of the third dredge-up:
As models , , , are all characterized by a very efficient third dredge-up, we explored in the models the case in which no dredge-up () is expected to take place during the entire TP-AGB evolution. In this way we may sample the overall uncertainty in the chemical yields bracketed by two opposite conditions. The main effect of taking is that no newly synthesized 22Ne is injected into the convective envelope at thermal pulses. As a consequence, the production of 23Na through the 22NeNa reaction during the inter-pulse phase is greatly reduced as it involves only the cycling of the NeNa isotopes that are originally present in the envelope when HBB is activated. This is evident in Fig. 8 where the 22Ne and 23Na yields predicted in models are found to be lower than those produced by the reference models by a factor in the ranges and , respectively. The variation in the 24Mg yields is not monotonic with the stellar mass. The absence of the third dredge-up favors larger 24Mg yields at initial masses of , while smaller yields are predicted at larger masses, . This complex trend is the time-integrated result of mass loss and HBB efficiency during the TP-AGB evolution in stars of different initial masses.
In summary, from this exercise it is evident that the improvements in the nuclear S-factor for the 22NeNa reaction achieved with LUNA have significantly reduced the uncertainties in the chemical ejecta of 22Ne and 23Na produced by intermediate-mass AGB stars with HBB. On the other hand, we conclude that remaining, not negligible, uncertainties are ascribed mainly to evolutionary aspects that still urge a substantial theoretical effort.
To give some representative numbers we refer to the () model. The largest uncertainty factors for the 22Ne yields due to the nuclear S-factor of 22NeNa have decreased from to . As to the 23Na yields, we go from to . At the same time, the evolutionary uncertainties still make a large contribution, rising the factors up to for 22Ne and to for 23Na. As to the 24Mg yields, the impact of 22NeNa is found to be smaller than in previous estimates (e.g., Izzard et al., 2007), and its nuclear uncertainties should be dominated by other nuclear reactions in the NeNa cycle (23NaMg, 24MgAl), not analyzed here.
6 The oxygen-sodium anti-correlation in GGCs
In recent years a number of studies have analyzed the hypothesis of metal-poor intermediate-mass AGB and super-AGB stars experiencing HBB as plausible candidates to explain the observed anti-correlations between light elements (C-N,O-Na, Al-Mg) that characterize the chemical patterns exhibited by the stars of Galactic globular clusters (e.g., D’Antona et al., 2016; Renzini et al., 2015; Conroy, 2012; D’Ercole et al., 2010; Ventura & D’Antona, 2009; Renzini, 2008; Prantzos et al., 2007; Karakas et al., 2006; Ventura & D’Antona, 2005c; Fenner et al., 2004; Herwig, 2004; Denissenkov & Herwig, 2003, and references therein). Though a uniform consensus on the AGB scenario has not been reached (other stellar candidates are discussed, for instance, by Denissenkov & Hartwick, 2014; Krause et al., 2013; de Mink et al., 2009; Prantzos et al., 2007; Decressin et al., 2007), it is interesting to look at the patterns of the AGB chemical yields on the observed O-Na anti-correlation diagram. Relevant properties of the AGB ejecta are provided in Table 3.
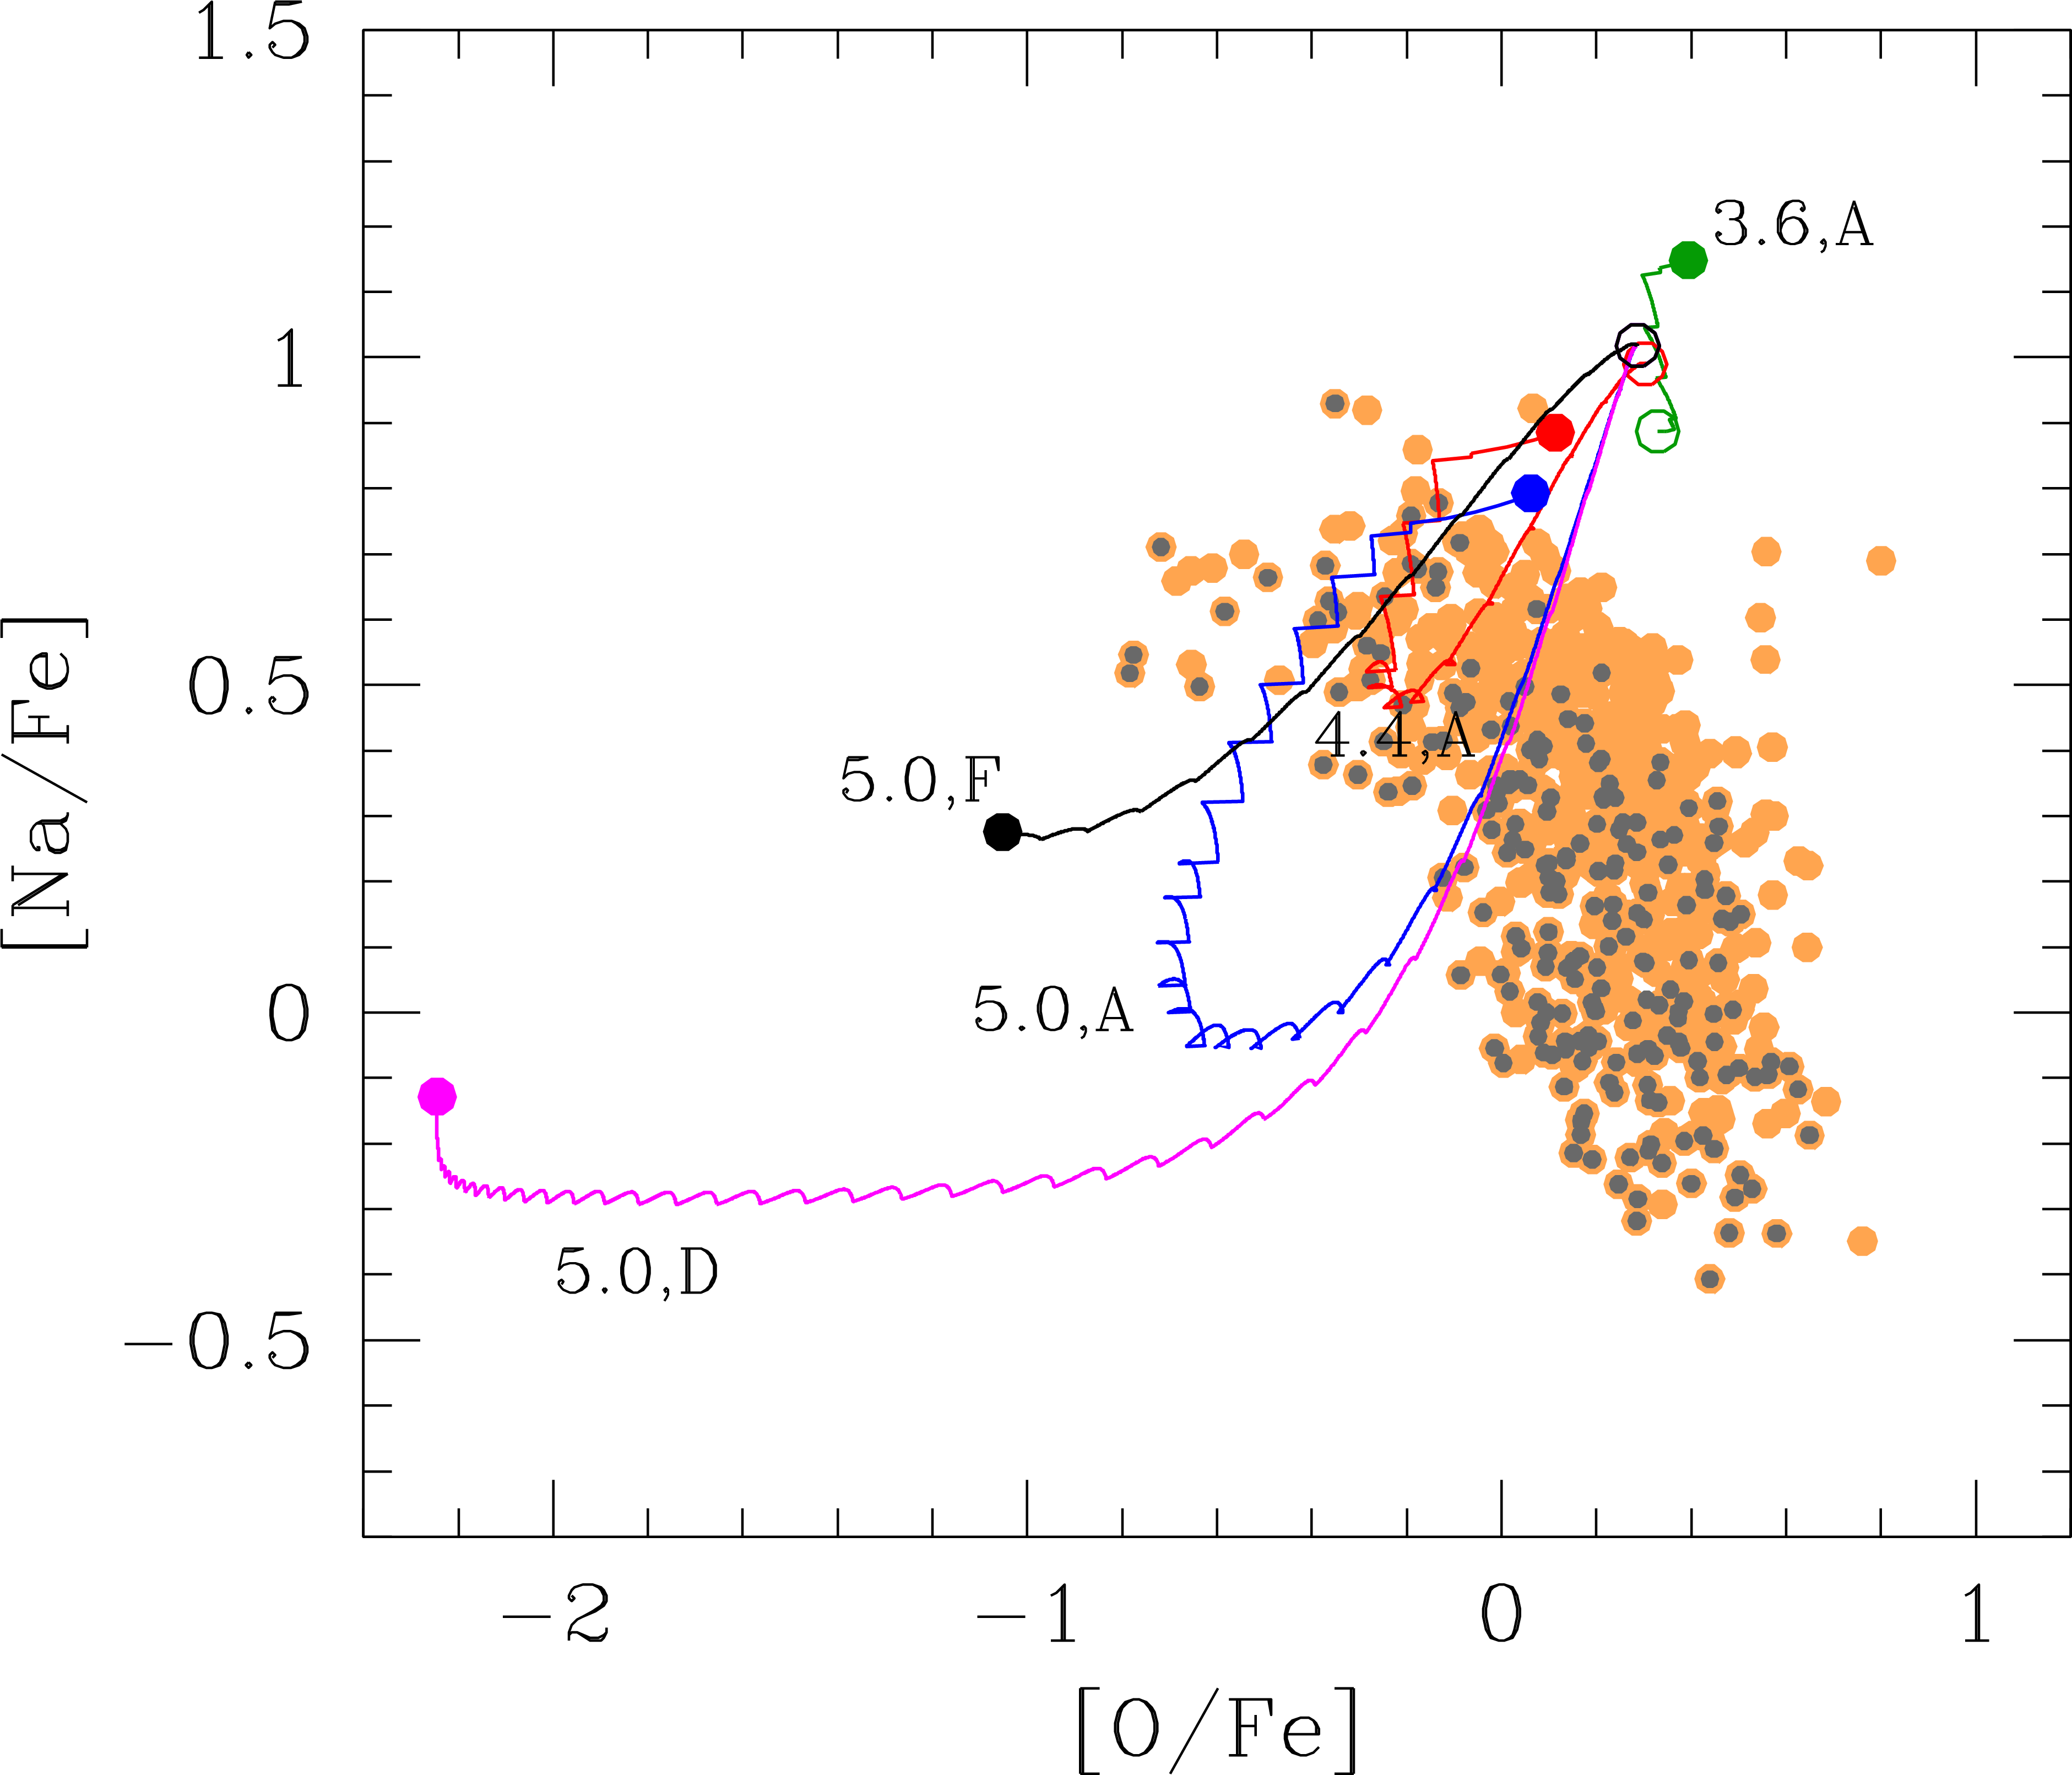
In Fig. 9 we show the evolution drawn by a few selected low-metallicity models (with , and [Fe]), during their whole TP-AGB evolution, until the complete ejection of the envelope. This is the result of the combined effect of both HBB and the third dredge-up (if present), and mass loss.
Among the seventeen clusters included in the catalog of Carretta et al. (2009), which span a large range in metallicity, four (NCG 1904, NGC 3201, NGC 6254, NGC 6752) have iron abundances ([Fe/H] -1.579, -1.512, -1.575, -1.555, respectively) that are quite close (within the errors) to that of our set of low-metallicity models ([Fe/H] -1.56)333Our reference solar mixture (Caffau et al., 2011), and that from Kurucz (1994) used in the spectroscopic work of Carretta et al. (2009) are characterized by similar metal abundances, corresponding to a total Sun’s metallicity 0.0152 and 0.0158, respectively.. The abundance data for these clusters (grey dots), draw a well-defined O-Na anti-correlation, with a few stars extending into the upper region characterized by the highest Na enrichment, which is the main focus of the analysis that follows.
We note that the model exhibits a modest abundance evolution, characterized by a little depletion of O, and some enrichment in 23Na due to a relatively mild HBB. Moving to larger stellar mass (i.e. ) HBB becomes stronger and the models draw an extended loop, along which 23Na is initially destroyed together with O, and later it is efficiently produced thanks to the periodic injection of fresh 22Ne by the third dredge-up at thermal pulses, followed by the operation of the 22NeNa reaction during the inter-pulse periods (see also Fig. 5). As HBB becomes weaker and eventually extinguishes (due to the reduction of the envelope mass by stellar winds), some additional O enrichment may occur if a few final third dredge-up events take place before the termination of the TP-AGB phase. Conversely, if no third dredge-up occurs ( as in models and ; Table 2) the source of 22Ne synthesized during thermal pulse is not at work so that the abundance loop does not show up and sodium is essentially destroyed by HBB with respect to its abundance after the second dredge-up. The significance of the different trends is discussed further in Section 6.1.
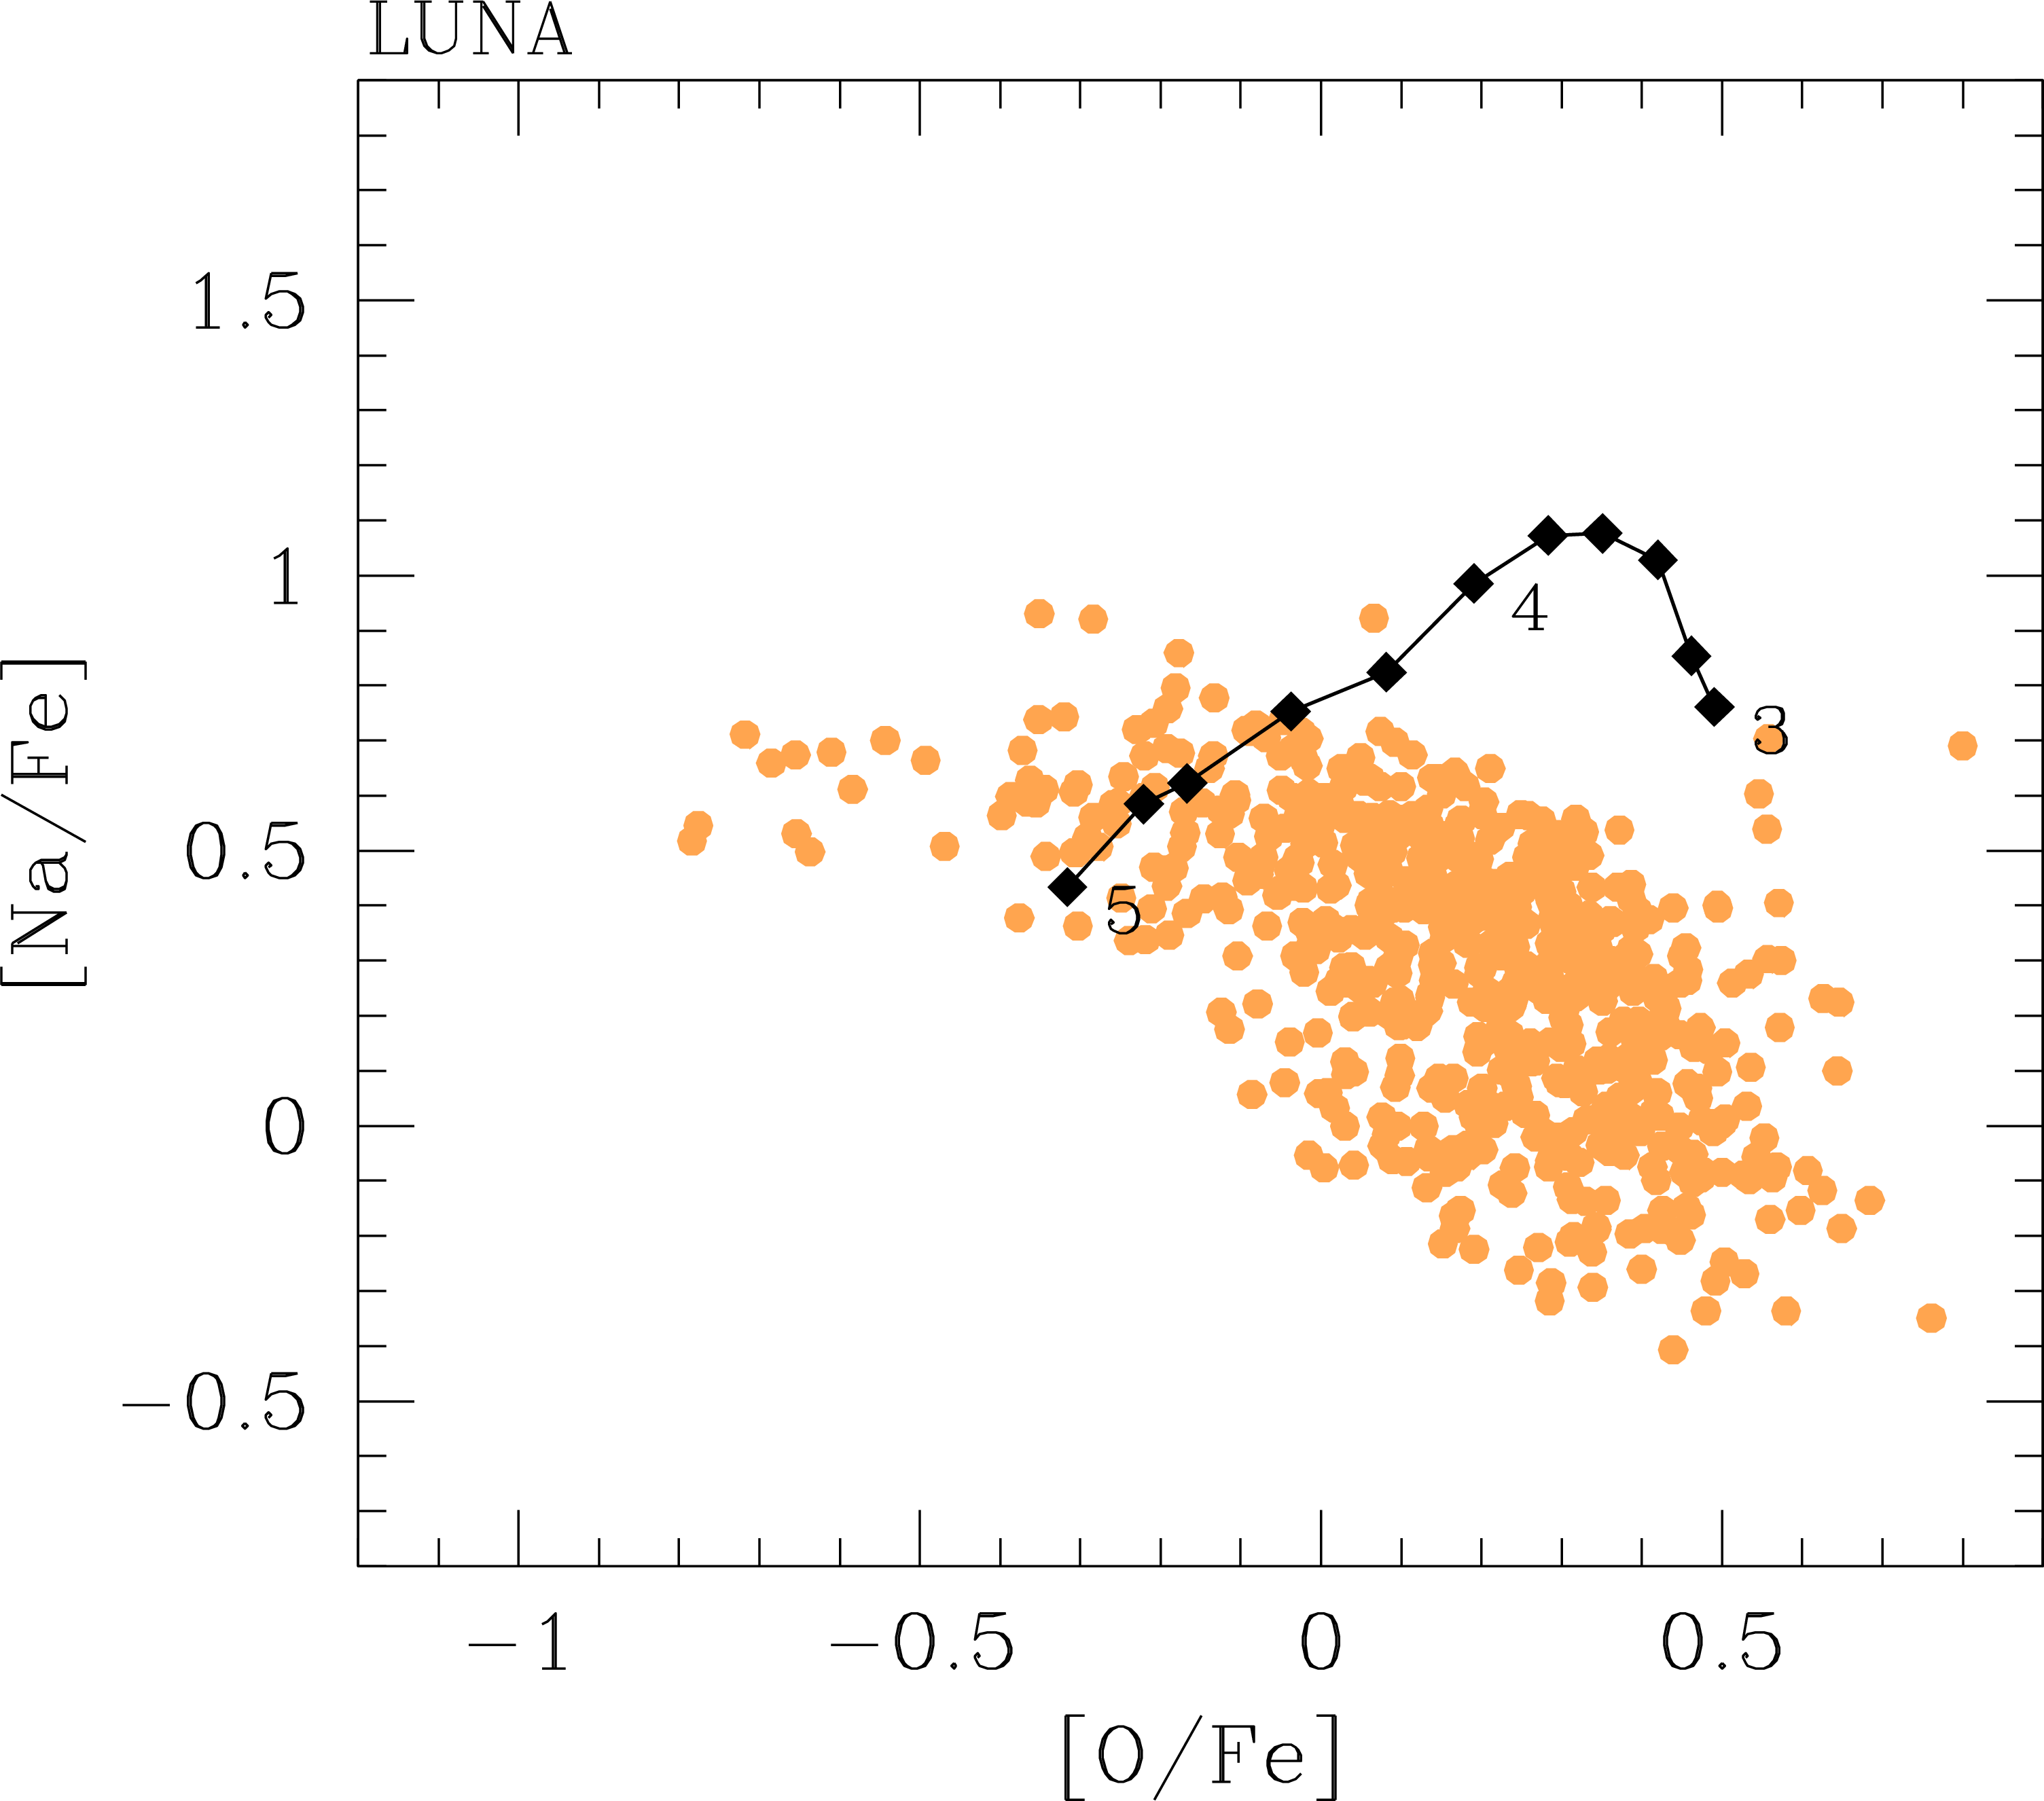
The left panels of Fig. 10 (from top to bottom) compare the results obtained with the prescriptions but varying the rate of the 22NeNa reaction applied to the low-metallicity set of stellar models. Each stellar model is represented by a point in the diagram, whose coordinates are the surface abundance ratios computed as weighted averages, that is summing up the amounts of elements ejected at each time time step and then normalizing them to the total ejected mass. The range of initial masses goes from 3.0 to 5.0 in steps of .
| , , [/Fe]=0.4 | |||||||||||
|---|---|---|---|---|---|---|---|---|---|---|---|
| Reference prescriptions | |||||||||||
| Efficient third dredge-up | |||||||||||
| Mi [] | Mfin [] | <X(He)> | <A(Li)> | <[C/Fe]> | <[N/Fe]> | <[O/Fe]> | <[Na/Fe]> | <[Mg/Fe]> | <[Al/Fe]> | ||
| 3.0 | 11 | 0.81 | 0.30 | 3.74 | 1.81 | 1.45 | 0.49 | 11.77 | 0.76 | 0.44 | 0.05 |
| 3.2 | 11 | 0.82 | 0.31 | 3.95 | 1.34 | 2.21 | 0.46 | 10.75 | 0.85 | 0.43 | 0.08 |
| 3.4 | 12 | 0.83 | 0.32 | 3.46 | 1.21 | 2.28 | 0.42 | 10.94 | 1.03 | 0.44 | 0.11 |
| 3.6 | 13 | 0.85 | 0.33 | 3.30 | 1.03 | 2.12 | 0.35 | 10.94 | 1.08 | 0.44 | 0.15 |
| 3.8 | 14 | 0.86 | 0.34 | 3.19 | 0.99 | 2.12 | 0.28 | 10.75 | 1.07 | 0.45 | 0.26 |
| 4.0 | 16 | 0.88 | 0.35 | 3.12 | 0.90 | 2.14 | 0.19 | 10.23 | 0.99 | 0.45 | 0.32 |
| 4.2 | 17 | 0.89 | 0.35 | 3.03 | 0.78 | 2.12 | 0.08 | 9.95 | 0.82 | 0.45 | 0.43 |
| 4.4 | 20 | 0.91 | 0.36 | 2.91 | 0.70 | 2.11 | -0.04 | 10.26 | 0.75 | 0.45 | 0.56 |
| 4.6 | 23 | 0.93 | 0.36 | 2.77 | 0.57 | 2.07 | -0.17 | 9.71 | 0.62 | 0.43 | 0.67 |
| 4.8 | 26 | 0.94 | 0.37 | 2.72 | 0.54 | 2.07 | -0.22 | 9.76 | 0.58 | 0.42 | 0.71 |
| 5.0 | 30 | 0.97 | 0.37 | 2.72 | 0.48 | 2.01 | -0.32 | 8.85 | 0.43 | 0.39 | 0.74 |
| Models : Efficient mass loss with Blöcker (1995) and | |||||||||||
| Mi [] | Mfin [] | <X(He)> | <A(Li)> | <[C/Fe]> | <[N/Fe]> | <[O/Fe]> | <[Na/Fe]> | <[Mg/Fe]> | <[Al/Fe]> | ||
| 3.0 | 10 | 0.80 | 0.30 | 4.00 | 1.37 | 2.23 | 0.46 | 10.36 | 0.76 | 0.42 | 0.05 |
| 3.2 | 10 | 0.81 | 0.31 | 3.66 | 1.01 | 2.31 | 0.44 | 9.78 | 0.94 | 0.42 | 0.09 |
| 3.4 | 10 | 0.82 | 0.32 | 3.38 | 1.31 | 2.22 | 0.38 | 8.86 | 1.03 | 0.42 | 0.12 |
| 3.6 | 10 | 0.84 | 0.33 | 3.15 | 0.27 | 2.27 | 0.30 | 7.30 | 1.06 | 0.41 | 0.16 |
| 3.8 | 11 | 0.85 | 0.34 | 2.97 | 1.19 | 2.14 | 0.23 | 7.18 | 1.01 | 0.42 | 0.26 |
| 4.0 | 11 | 0.87 | 0.35 | 2.83 | 0.19 | 2.18 | 0.10 | 5.62 | 0.91 | 0.41 | 0.32 |
| 4.2 | 12 | 0.89 | 0.35 | 2.70 | 0.98 | 2.04 | -0.01 | 5.23 | 0.67 | 0.41 | 0.43 |
| 4.4 | 12 | 0.91 | 0.36 | 2.60 | 0.25 | 2.04 | -0.21 | 3.91 | 0.46 | 0.39 | 0.55 |
| 4.6 | 13 | 0.92 | 0.36 | 2.65 | -0.03 | 1.85 | -0.37 | 2.81 | 0.23 | 0.36 | 0.65 |
| 4.8 | 13 | 0.94 | 0.37 | 2.55 | 0.07 | 1.92 | -0.45 | 2.95 | 0.17 | 0.35 | 0.72 |
| 5.0 | 14 | 0.96 | 0.37 | 2.70 | 0.49 | 1.74 | -0.48 | 2.52 | 0.02 | 0.33 | 0.72 |
| Models : Efficient HBB with =2.0 | |||||||||||
| Mi [] | Mfin [] | <X(He)> | <A(Li)> | <[C/Fe]> | <[N/Fe]> | <[O/Fe]> | <[Na/Fe]> | <[Mg/Fe]> | <[Al/Fe]> | ||
| 3.0 | 10 | 0.81 | 0.30 | 3.82 | 1.38 | 2.03 | 0.46 | 8.77 | 0.77 | 0.41 | 0.05 |
| 3.2 | 10 | 0.82 | 0.31 | 3.41 | 1.27 | 2.11 | 0.40 | 8.82 | 1.00 | 0.42 | 0.10 |
| 3.4 | 11 | 0.83 | 0.32 | 3.31 | 1.04 | 2.19 | 0.33 | 8.76 | 1.08 | 0.43 | 0.14 |
| 3.6 | 12 | 0.84 | 0.33 | 3.18 | 0.72 | 2.06 | 0.26 | 8.41 | 1.03 | 0.42 | 0.18 |
| 3.8 | 13 | 0.86 | 0.34 | 3.13 | 0.73 | 2.04 | 0.16 | 8.18 | 0.97 | 0.42 | 0.31 |
| 4.0 | 14 | 0.87 | 0.35 | 3.05 | 0.70 | 2.04 | 0.04 | 7.82 | 0.83 | 0.42 | 0.42 |
| 4.2 | 15 | 0.89 | 0.35 | 2.94 | 0.49 | 1.96 | -0.16 | 6.70 | 0.60 | 0.39 | 0.58 |
| 4.4 | 17 | 0.91 | 0.36 | 2.82 | 0.47 | 1.97 | -0.24 | 7.22 | 0.57 | 0.38 | 0.66 |
| 4.6 | 19 | 0.93 | 0.36 | 2.74 | 0.33 | 1.91 | -0.37 | 6.53 | 0.40 | 0.35 | 0.74 |
| 4.8 | 21 | 0.94 | 0.37 | 2.72 | 0.31 | 1.90 | -0.42 | 6.42 | 0.36 | 0.34 | 0.75 |
| 5.0 | 24 | 0.97 | 0.37 | 2.76 | 0.24 | 1.83 | -0.51 | 5.74 | 0.21 | 0.31 | 0.73 |
| Models : No third dredge-up (=0) | |||||||||||
| Mi [] | Mfin [] | <X(He)> | <A(Li)> | <[C/Fe]> | <[N/Fe]> | <[O/Fe]> | <[Na/Fe]> | <[Mg/Fe]> | <[Al/Fe]> | ||
| 3.0 | 17 | 0.85 | 0.29 | -1.14 | -0.29 | 0.68 | 0.36 | 1.00 | 0.72 | 0.40 | 0.06 |
| 3.2 | 20 | 0.86 | 0.31 | -0.77 | -0.29 | 0.72 | 0.35 | 1.00 | 0.79 | 0.40 | 0.08 |
| 3.4 | 24 | 0.88 | 0.32 | 0.68 | -0.29 | 0.76 | 0.34 | 1.00 | 0.85 | 0.40 | 0.11 |
| 3.6 | 29 | 0.90 | 0.32 | 2.50 | -0.30 | 0.79 | 0.33 | 1.00 | 0.89 | 0.40 | 0.13 |
| 3.8 | 34 | 0.92 | 0.33 | 3.47 | -0.89 | 0.91 | 0.32 | 1.00 | 0.93 | 0.39 | 0.22 |
| 4.0 | 38 | 0.94 | 0.34 | 3.27 | -0.99 | 1.10 | 0.17 | 1.00 | 0.96 | 0.39 | 0.25 |
| 4.2 | 41 | 0.96 | 0.35 | 3.03 | -0.81 | 1.29 | -0.43 | 1.00 | 0.51 | 0.39 | 0.48 |
| 4.4 | 42 | 0.97 | 0.35 | 2.89 | -0.75 | 1.34 | -1.08 | 1.00 | 0.15 | 0.32 | 0.79 |
| 4.6 | 44 | 0.99 | 0.36 | 2.77 | -0.72 | 1.36 | -1.50 | 1.00 | 0.00 | 0.23 | 0.89 |
| 4.8 | 47 | 1.00 | 0.36 | 2.72 | -0.70 | 1.36 | -1.64 | 1.00 | -0.05 | 0.19 | 0.90 |
| 5.0 | 50 | 1.02 | 0.37 | 2.72 | -0.67 | 1.36 | -1.72 | 1.00 | -0.15 | 0.14 | 0.80 |
| Models : Efficient HBB with , , 23NaNa / 5 | |||||||||||
|---|---|---|---|---|---|---|---|---|---|---|---|
| Mi [] | Mfin [] | <X(He)> | <A(Li)> | <[C/Fe]> | <[N/Fe]> | <[O/Fe]> | <[Na/Fe]> | <[Mg/Fe]> | <[Al/Fe]> | ||
| 3.0 | 12 | 0.82 | 0.30 | 4.07 | 1.53 | 1.52 | 0.45 | 7.76 | 0.74 | 0.42 | 0.05 |
| 3.2 | 13 | 0.83 | 0.31 | 3.45 | 1.15 | 1.94 | 0.40 | 7.73 | 0.91 | 0.42 | 0.09 |
| 3.4 | 14 | 0.84 | 0.32 | 3.32 | 1.02 | 1.99 | 0.32 | 7.49 | 1.06 | 0.43 | 0.14 |
| 3.6 | 15 | 0.86 | 0.33 | 3.22 | 0.67 | 1.83 | 0.23 | 7.18 | 1.08 | 0.43 | 0.19 |
| 3.8 | 16 | 0.87 | 0.34 | 3.13 | 0.66 | 1.87 | 0.10 | 6.59 | 1.12 | 0.43 | 0.33 |
| 4.0 | 18 | 0.89 | 0.34 | 3.04 | 0.51 | 1.91 | -0.05 | 6.58 | 1.08 | 0.43 | 0.45 |
| 4.2 | 20 | 0.91 | 0.35 | 2.94 | 0.45 | 1.88 | -0.22 | 6.34 | 1.01 | 0.42 | 0.61 |
| 4.4 | 22 | 0.92 | 0.36 | 2.82 | 0.28 | 1.84 | -0.41 | 5.73 | 0.89 | 0.39 | 0.73 |
| 4.6 | 24 | 0.94 | 0.36 | 2.74 | 0.21 | 1.78 | -0.56 | 5.11 | 0.76 | 0.35 | 0.80 |
| 4.8 | 25 | 0.95 | 0.37 | 2.72 | 0.15 | 1.78 | -0.63 | 4.75 | 0.71 | 0.33 | 0.81 |
| 5.0 | 29 | 0.98 | 0.37 | 2.76 | 0.09 | 1.72 | -0.71 | 4.37 | 0.59 | 0.31 | 0.77 |
| Models : Efficient mass loss with Blöcker (1995) and , , 23NaNa / 3 | |||||||||||
| Mi [] | Mfin [] | <X(He)> | <A(Li)> | <[C/Fe]> | <[N/Fe]> | <[O/Fe]> | <[Na/Fe]> | <[Mg/Fe]> | <[Al/Fe]> | ||
| 3.0 | 17 | 0.84 | 0.29 | -1.41 | -0.29 | 0.68 | 0.36 | 1.00 | 0.72 | 0.40 | 0.06 |
| 3.2 | 19 | 0.86 | 0.31 | -0.21 | -0.29 | 0.72 | 0.35 | 1.00 | 0.79 | 0.40 | 0.08 |
| 3.4 | 23 | 0.88 | 0.32 | 1.59 | -0.29 | 0.76 | 0.34 | 1.00 | 0.85 | 0.40 | 0.11 |
| 3.6 | 23 | 0.89 | 0.32 | 3.46 | -0.31 | 0.80 | 0.33 | 1.00 | 0.89 | 0.40 | 0.13 |
| 3.8 | 28 | 0.91 | 0.33 | 3.38 | -1.20 | 0.94 | 0.31 | 1.00 | 0.94 | 0.39 | 0.22 |
| 4.0 | 29 | 0.92 | 0.34 | 3.09 | -0.99 | 1.16 | 0.10 | 1.00 | 1.03 | 0.40 | 0.27 |
| 4.2 | 27 | 0.93 | 0.35 | 2.87 | -0.83 | 1.30 | -0.31 | 1.00 | 0.95 | 0.40 | 0.42 |
| 4.4 | 24 | 0.94 | 0.35 | 2.76 | -0.77 | 1.35 | -0.68 | 1.00 | 0.73 | 0.38 | 0.65 |
| 4.6 | 20 | 0.95 | 0.36 | 2.74 | -0.74 | 1.36 | -0.86 | 1.00 | 0.54 | 0.35 | 0.76 |
| 4.8 | 20 | 0.96 | 0.36 | 2.73 | -0.71 | 1.36 | -0.95 | 1.00 | 0.46 | 0.34 | 0.79 |
| 5.0 | 17 | 0.98 | 0.37 | 2.89 | -0.71 | 1.35 | -0.86 | 1.00 | 0.35 | 0.33 | 0.76 |
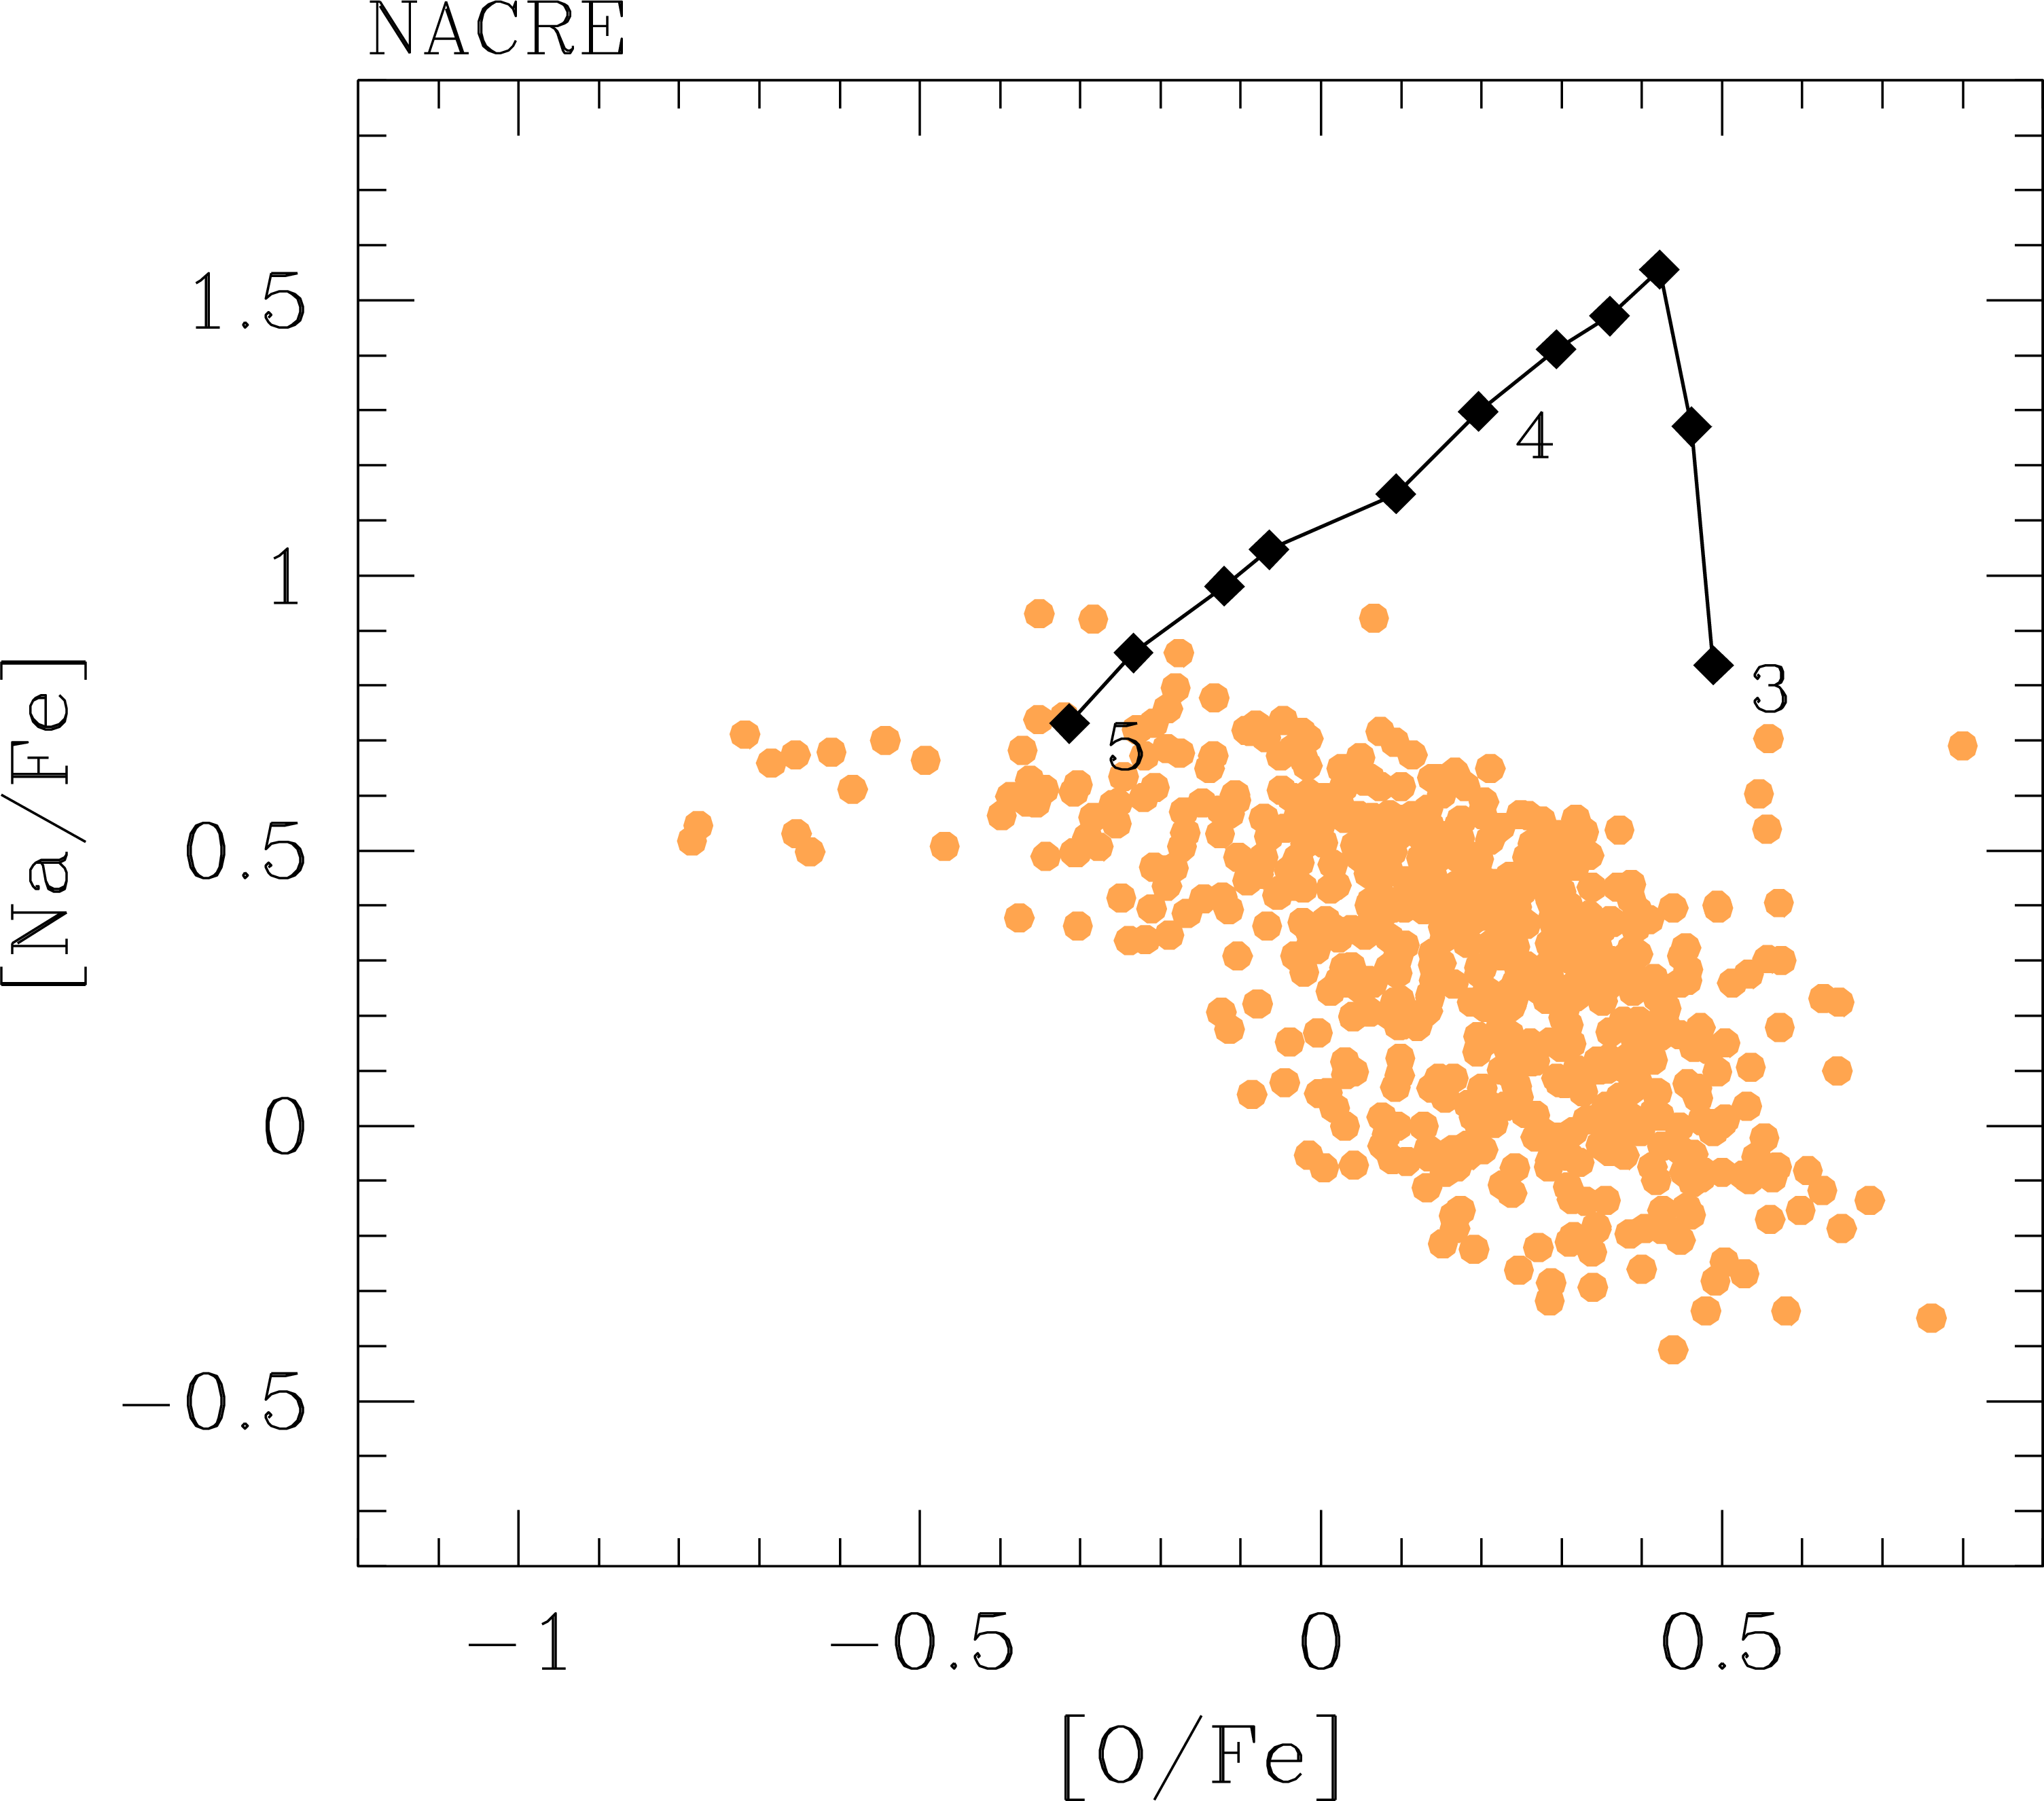


A feature common to all panels of Fig. 10 is that, independently of the adopted input physics, the sequence of AGB models at increasing initial stellar mass runs crosswise the observed anti-correlation, the higher-mass ones reaching lower [O/Fe] values. This trend has already been reported in the literature (see e.g., Ventura & Marigo, 2010). The only way to make the stellar models bend over the populated region is to invoke a dilution process with gas of pristine composition, which basically shares the same chemical pattern as the field stars of the same [Fe/H].
According to a present-day scenario the observed anti-correlation would be the result of multiple star formation episodes within GGCs, in which the ejecta of AGB stars from a first generation polluted the gas involved in the subsequent secondary star formation events (Ventura & D’Antona, 2008). In this framework GGC stars that populate the upper region of the anti-correlation (high Na, low O) would exhibit the chemical abundances of pure AGB ejecta, while stars on the opposite extreme (low Na, high O) would sample a pristine composition, typical of the first generation. In between are all the GGC stars born out of a mixture in which the AGB ejecta were partially diluted into a pristine gas.
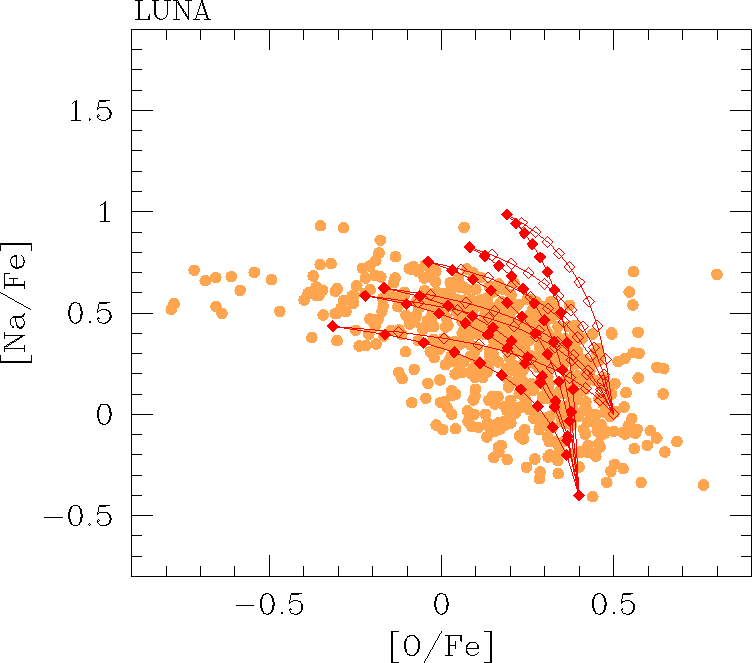
In this simplified picture low-metallicity AGB models should be found in the upper part of the observed anti-correlation. Looking at Fig. 10 we note that depending on the assumed rate 22NeNa, the sequence of AGB models change their location significantly. In particular, the NACRE models are characterized by high [Na/Fe] and hardly intersect the data but for the highest stellar masses, the IL10 models cross the anti-correlation in the middle not touching the Na-richest, O-poorest points, the LUNA sequence attain Na abundances consistent with the upper extreme of the anti-correlation, but fails to reach the points with the lowest oxygen abundance, i.e. [O/Fe]. We address this point in Section 6.1.
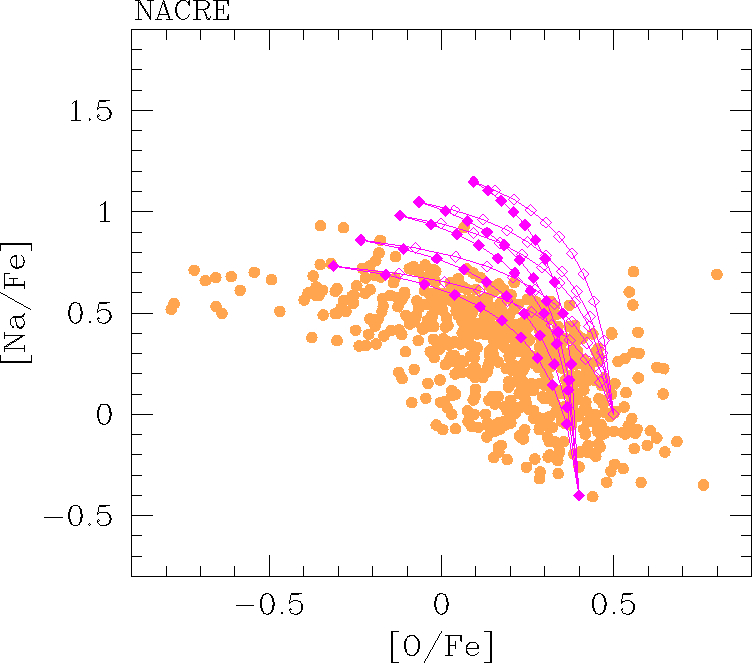
It is now interesting to examine the behavior of the models when a simple dilution model is adopted. The dilution effect can be mimicked according to the formula (Conroy, 2012):
| (1) |
where the subscripts and refer to the original pristine gas and the pure AGB ejecta, and is the fraction of the AGB ejecta mixed into the gas.
For each set of models we applied Eq. 1 to draw a dilution curve, which starts at given by the AGB evolutionary calculations (with ) and ends at a point having coordinates (, ); with ). For this latter we assume two combinations (0.4,-0.3) and (0.5, 0.0) to mimic some dispersion in the [Na/Fe]o and [O/Fe]o ratios, which is present in the observed data.
By eye, the set of LUNA models at the bottom-left panel of Fig. 11 seems to reproduce better the trend of O-Na anti-correlation, compared to the other cases. However, we note that data at lower [Na/Fe] are not completely covered by our most massive TP-AGB models (up to ). In this respect the impact of other AGB model prescriptions (i.e. efficiency of mass loss, HBB, and third dredge-up) may be important and are analyzed later in this section.
We caution that the relatively good match of our reference LUNA models cannot be taken as a full support to the AGB star hypothesis. In fact, these models are characterized by an efficient third dredge-up, which produces a net increase in the CNO abundance in the ejecta, at variance with the observational indication that in various GGCs stars that belong to the first and second populations, have constant CNO, within the errors, or relatively similar (e.g., Ivans et al., 1999; Carretta et al., 2005). Recent spectroscopic observations (e.g., Yong et al., 2009; Yong et al., 2015) have revealed a much more complex situation: there are stars belonging to the same clusters that exhibit non-negligible variations of the CNO, others that show a constant CNO abundance. Given this intricate picture we analyse various degrees of CNO enrichment in Section 6.1.
In order to keep the increase of the CNO abundance low in the AGB envelopes a possibility is to invoke that almost no third dredge-up took place at thermal pulses. In this way the ejecta would exhibit the nucleosynthesis fingerprint of an (almost) pure NeNa cycle. In the models this condition can be obtained assuming a very efficient mass-loss rate and/or imposing that depth of the third dredge-up events was small (low ).
To explore the impact of these assumptions let us analyze the set of TP-AGB evolutionary calculations referred to as , , and in Table 1. Relevant properties of the ejecta are presented in Table 3.
The quantity is defined as the ratio between the average CNO abundance in the ejecta and the initial value at the time the star formed. We note that in our adopted definition of the abundances are expressed by number and not by mass fraction since during CNO cycle operation what is conserved is the number of the catalysts and not their mass.
The results of our calculations are shown in Figs 10 and 11 (see the label at the top of each panel for identification). As to the sets and , they are both characterized by a shorter TP-AGB evolution, which reduces the number of TPs, hence limiting the CNO increase at the surface. At the same time, the shortcoming is that the most massive AGB models considered here () tend to produce sodium ejecta that are lower than the standard case, and do not reach the upper extreme of the anti-correlation. This would imply that the O-Na anti-correlation is caused by AGB stars within a very narrow mass range, which requires an extremely fine-tuned initial-mass function.
In the case with the CNO abundance is unchanged, but on the O-Na diagram the agreement is poor as the most massive AGB stars experience a significant depletion of oxygen, whereas their sodium abundance becomes even lower. In fact no fresh 22Ne is injected into the envelope at TPs and when the 22NeNa reaction is reactivated during HBB no significant amount of 23Na is synthesized. Moreover, as already mentioned in Sec. 5.1.2, models without third dredge-up tend to have longer TP-AGB lifetimes (mass loss is less efficient because of their higher effective temperatures), so that a larger amount of oxygen is burnt into nitrogen.
6.1 Can we recover the Na-rich, O-poor extreme of the anti-correlation?
All AGB models described so far are not able to extend into the O-poor extreme of the anti-correlation, matching the sodium abundances at the same time. The inability of AGB models to reach [O/Fe] has been already reported by D’Ercole et al. (2012) who invoked the occurrence of an extra-mixing process during the red giant branch phase of GGC stars.
More generally, examining the available AGB ejecta in the literature we realize that three main issues affect their suitability to represent the extreme composition of the first stellar generation in GGCs (see also D’Antona et al., 2016). Namely, to our knowledge, no existing AGB (or super-AGB) model has shown to fulfill the whole set of conditions:
-
•
-
•
-
•
, or more stringently, .
The first two conditions, which apply to the upper extreme of the anti-correlation, are difficult to meet since a more efficient destruction of oxygen via the ON cycle is usually accompanied by an efficient destruction of sodium through the reaction, and to a lesser extent through the . This trend is more pronounced with increasing stellar mass, as clearly shown in all panels of Fig. 10.
A way to increase the overall sodium production is to assume an efficient third dredge-up, so that newly synthesized 22Ne can be injected into the envelope and later burnt into 23Na. But this brings along the problem of increasing the CNO abundance, yielding , as shown in Table 3.
An alternative possibility is that of lowering the destruction of sodium, by reducing the current rate for reaction. This suggestion has been put forward by Ventura & D’Antona (2006), and more recently by D’Antona et al. (2016); Renzini et al. (2015); D’Orazi et al. (2013).
In view of the above, we single out an optimal set of AGB model prescriptions that best reproduce the chemical constraints on Na, O, and CNO content, which characterize the upper extreme of the anti-correlation.
To achieve this goal we follow a sort of “calibration path”, which requires several model calculations and tests. For a given level of third dredge-up efficiency, we first adjust the mixing-length parameter and the mass loss to obtain the right temperature evolution at the base of the convective envelope that produces the right O-depletion in the average ejecta. Clearly, some mild degeneracy between convection and mass loss efficiencies is present, but the uncertainty range is small for reasonable choices of the parameters. Then, we reduce the destruction rate of 23NaNe by the suitable factor that allows to reach the required Na enrichment.
We summarize here the final results of our investigation. Let us start from the constraint on the CNO abundance, and consider two possible requirements expressed by and , respectively. They define two classes of TP-AGB models.
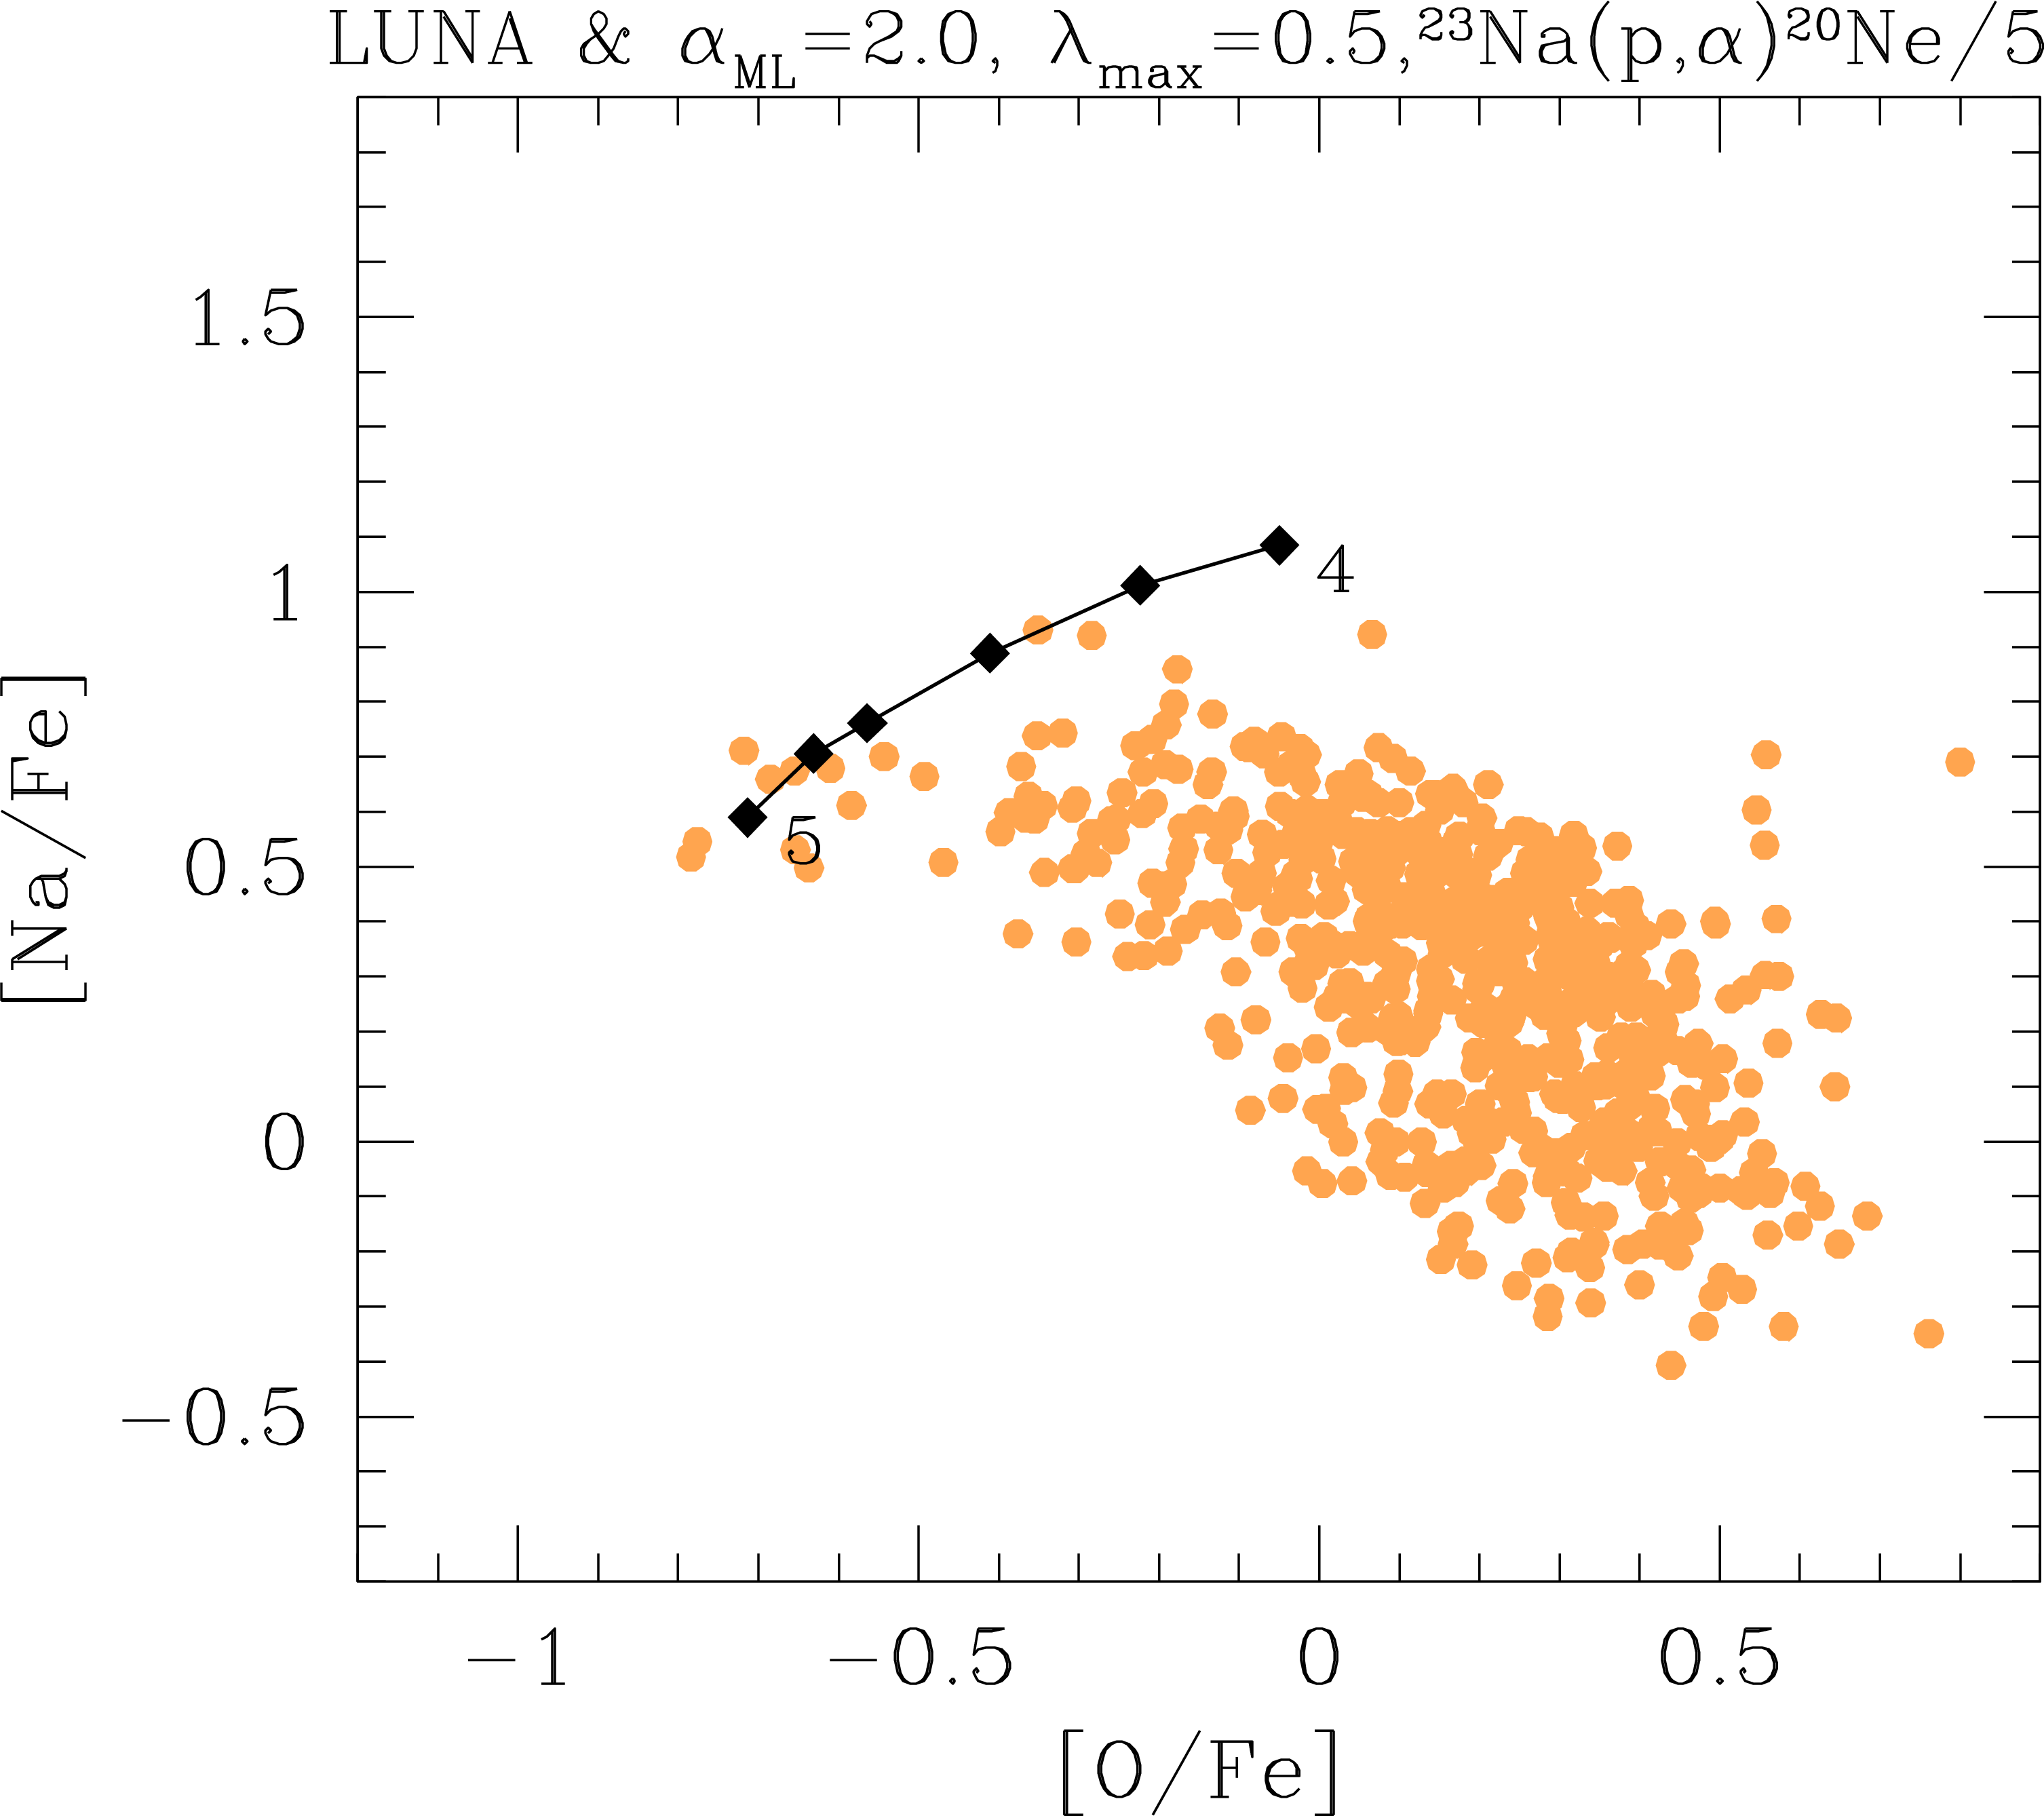
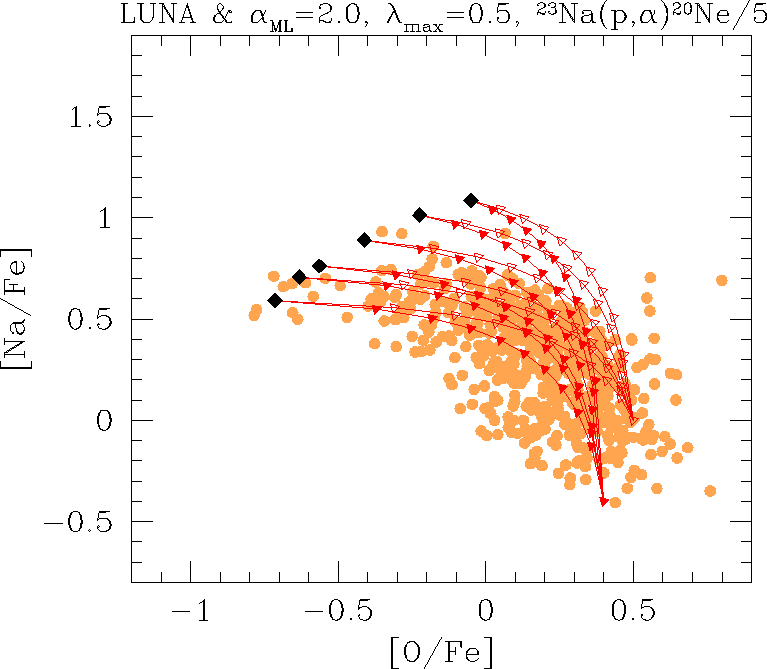
The requirement implies that some dredge-up is allowed to take place during the TP-AGB evolution. Under these conditions, our best set of models (named in Table 2) is calculated assuming a moderate third dredge-up, with a maximum efficiency , which produces for initial masses . We are able to reach the lowest [O/Fe] by increasing the mixing length parameter to , which causes a very efficient HBB. At the same time, we prevent a large destruction of sodium by reducing the IL10 rate for by a factor of . All other prescriptions are the same as in our reference set.
The results are presented in Fig. 12 and the relevant characteristics of the ejecta are listed in Table 3. This set of AGB models is able, for the first time, to reproduce the Na-rich, O-poor extreme of the O-Na anti-correlation, while keeping a mild CNO increase. The most massive AGB models, with reach the stars with the lowest [O/Fe] as a consequence of a suitable combination of efficient HBB and mass loss, without the need of invoking extra-mixing episodes as suggested by D’Ercole et al. (2012). At the same time, we confirm previous suggestions (D’Antona et al., 2016; Renzini et al., 2015) about the need of decreasing the destruction rate of sodium.
The requirement implies that no third dredge-up occurred. Under this stringent assumption, our best performing set of models (named in Table 2), is calculated with , adopting a more efficient mass-loss prescription (Blöcker, 1995, with ), and reducing the rate by a factor of 3. As before, all other prescriptions are the same as in . The results are shown in Fig. 13 and the properties of the corresponding ejecta are summarized in Table 3. The upper extreme of the anti-correlation and its dispersion is also well described by the average abundance of the AGB models with initial masses .
Compared to the set with , in models we apply a few changes in the input prescriptions which are explained as follows. The absence of dredge-up episodes in models makes both the atmospheres and the convective envelopes somewhat hotter, as a consequence of the lower opacities444Equation of state and detailed Rosseland mean opacities are computed with the ÆSOPUS at each time step during the evolution, consistently with the chemical composition.. This leads to increase the strength of HBB, so that (instead of 2) already allows us to obtain the required oxygen depletion. At the same time, the TP-AGB evolution is a little shorter which prevents an excessive destruction of both oxygen and sodium. Also in this case we have to limit the consumption of sodium by reducing the nuclear rate of proton captures.
In this context model predictions are heterogeneous. On one hand, relatively lower efficiencies of the third dredge-up are predicted at increasing core mass as a consequence of the weaker thermal pulses555when the maximum He-burning luminosity attained during thermal pulses is lower. (Ventura & D’Antona, 2008; Cristallo et al., 2015). In addition, the combined action of hot dredge up (Goriely & Siess, 2004) and hot bottom burning limits the occurrence of the third dredge up in stars with initial mass (see the discussion in Straniero et al., 2014). Interestingly, independent indications towards a modest third dredge-up in stars with are also derived from the analysis of the Galactic initial-final mass relation (Kalirai et al., 2014). On the other hand, other AGB models predict that the efficiency of the the third dredge-up increases with the stellar mass (e.g., Karakas & Lattanzio, 2014; Herwig, 2004; Karakas et al., 2002). On observational grounds, the high Rb abundances measured in luminous AGB stars in the Magellanic Clouds and in the Galaxy hint that stars with HBB do experience the third dredge-up (Zamora et al., 2014; García-Hernández et al., 2009, 2006). It follows that quantifying the efficiency of the third dredge-up in massive AGB stars is still an open issue and it can be reasonably treated as a free parameter in AGB models to explore the impact of various assumptions, in a way similar to what we performed in this study.
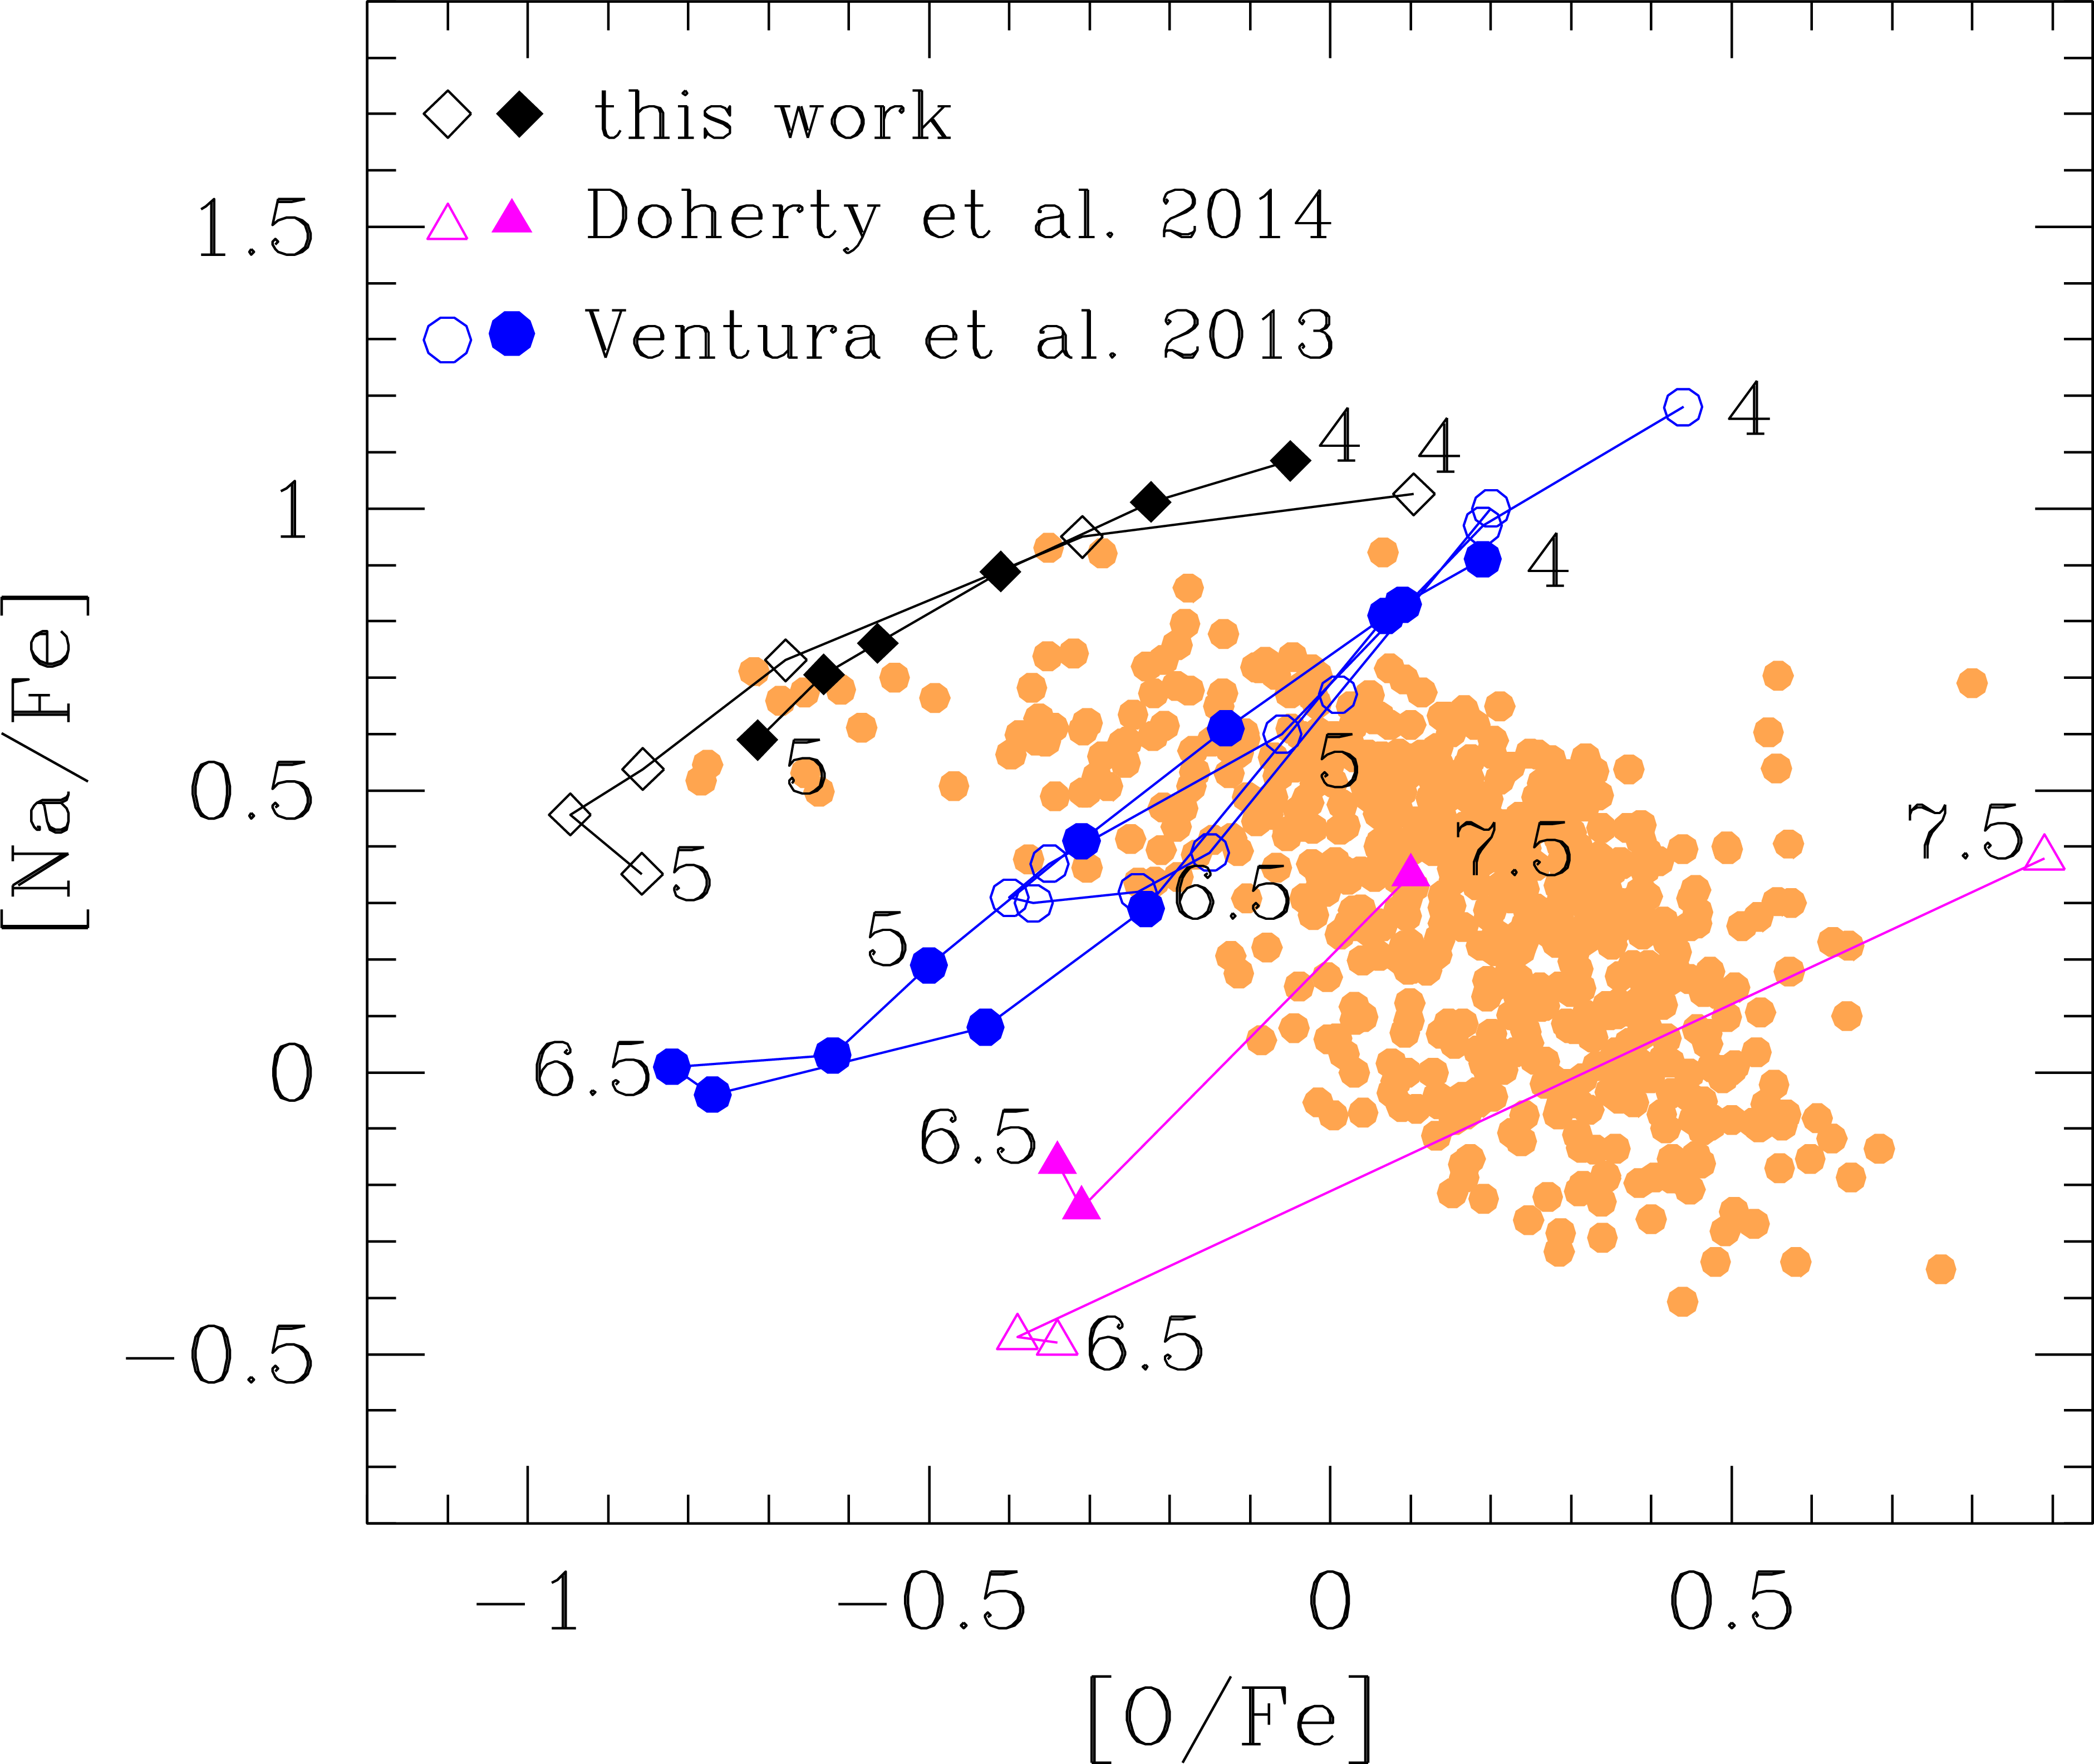
For comparison, in Fig. 14 we show our best-fitting models ( and ) together with the predictions of other two theoretical studies, namely Ventura et al. (2013), and Doherty et al. (2014b), which include AGB and super-AGB models. We note that quite different abundances characterize the different sets of models, even when sharing the same, or similar, initial mass and metallicity. In particular, as already discussed by these authors, the O-poor and Na-rich extreme of the anti-correlation is not reached by the models, in the framework of their adopted prescriptions. As already mentioned, D’Ercole et al. (2012) suggested that this difficulty may be overcome assuming deep mixing during the RGB phase of the second generation stars forming in a gas with high helium abundance.
On the other hand, our analysis shows that the extreme of the O-Na anti-correlation may, in principle, be reproduced with pure ejecta of AGB stars, without invoking extra-mixing episodes in other phases.
In particular, our calculations demonstrate quantitatively that a sizable reduction (by a factor of 3-5) of the rate of the reaction is necessary to prevent an excessive sodium destruction when the third dredge-up is not efficient or even absent. We should caution, however, that such a drastic change in the rate is not supported by recent nuclear cross section studies (Cesaratto et al., 2013; Iliadis et al., 2010a). The present lower-limit estimates allow to reduce the recommended rate by a factor of at the largest.
We did not attempt to fulfill additional chemical constraints, such as those related to the Mg-Al anti-correlation (Carretta, 2015). We have verified that no significant magnesium destruction is predicted in AGB models with the adopted set of nuclear rates. In this respect we note that our reference rate for is taken from IL10, while a recent revision with LUNA has increased it by roughly a factor of at the temperatures relevant for HBB (Straniero et al., 2013). We plan to adopt the latter rate and to extend our chemical investigation of the Mg and Al isotopes in a follow-up study.
Also, as shown in Table 3, our massive TP-AGB models exhibit a large helium content in their ejecta (mainly determined by the second dredge-up on the E-AGB), which would correspond to an increase of with respect to the assumed initial value, . These values are larger than the typical range reported by Milone et al. (2014) for a group of GGCs, and may represent a severe issue to the AGB star scenario (Bastian et al., 2015). We note, however, that our analysis is focused on the Na-rich, O-poor extreme of the anti-correlation, which is mainly populated by the stars of the cluster NGC 2808. For this cluster the helium spread is large, (Milone et al., 2012), consistent with our predictions.
A deeper scrutiny of all these additional chemical constraints requires a dedicated study on each specific cluster, as well as to extend the analysis to other metallicities, and it is beyond the original aim of the present paper.
7 Summary and conclusions
In this theoretical study we analyzed the ejecta of 22Ne and 23Na contributed by intermediate-mass stars during their entire evolution. In particular, we focused on the impact of the new LUNA measurements of the astrophysical S-factor for the reaction 22NeNa. The new experimental set-up and the discovery of three new resonances have led to a significant reduction in the uncertainty of the rate, which drops from factors of down to just a few. At the temperatures most relevant for stellar evolutionary models the new LUNA rate is significantly lower than the previous estimate provided by NACRE, but somewhat larger than that of Iliadis et al. (2010a).
In order to evaluate the current uncertainties that still affect the ejecta of 22Ne and 23Na, and to disentangle those associated to nuclear physics from those related to other evolutionary aspects, we calculated a large grid of stellar evolutionary models with initial masses in the interval from to , for three values of the initial composition. For each stellar model, the entire evolution, from the pre-main sequence to ejection of the complete envelope, was computed varying a few key model prescriptions, namely the rate of 22NeNa, the rate of mass-loss on the AGB, the efficiency of the third dredge-up, and the mixing-length parameter used in our adopted theory of convection.
In the light of the results obtained with the new LUNA rate for 22NeNa, we provide below a recapitulation of the most relevant processes that affect the ejecta of 22Ne and 23Na from intermediate-mass stars, the main uncertainty sources, and the implications we derived in relation to the Na-rich, O-poor extreme of the O-Na anti-correlation in GGCs.
-
•
The second dredge-up on the early-AGB causes a significant increase of the surface abundance of 23Na, up to a factor of in stars with high mass and low metallicity. Correspondingly, the surface concentration of 22Ne is diminished by . These elemental changes hardly depend on the adopted rate for 22NeNa, while are controlled by other physical parameters, e.g. the efficiency of mixing and the extension of convective overshoot applied to the inner border of the convective envelope. During the subsequent TP-AGB phase significant changes in the surface abundances of 22Ne and 23Na are caused by the occurrence of third dredge-up events and HBB.
-
•
The main effect of the third dredge-up is the injection of fresh 22Ne into the envelope at thermal pulses, which will be later involved in the NeNa cycle during the next inter-pulse period. The process of HBB leads to an initial depletion of 23Na, followed by an increase of its abundance – through the reaction 22NeNa – when 23Na and 24Mg reach the nuclear equilibrium. The quantitative details of these general trends critically depend on the rate assumed for 22NeNa.
-
•
Comparing the results for 22Ne and 23Na obtained with our reference set of input prescriptions for the AGB evolution, but varying the rate for 22NeNa, we find that the 23Na ejecta predicted with the LUNA data are quite lower than those derived with NACRE, and somewhat larger than with IL10. The opposite behavior applies to 22Ne.
-
•
Comparing the results for 22Ne and 23Na obtained with the recommended LUNA rate as well as the associated lower and upper limits, we estimated the current uncertainties of the chemical ejecta directly ascribed to the nuclear S-factor. At low metallicity the amplitudes of the largest error bars reach factors of for 23Na and for 22Ne. These uncertainties are significantly lower than those reported in past studies.
-
•
Other reactions involved in the NeNa cycle may contribute to the nuclear uncertainties of the 22Ne and 23Na ejecta, in particular the destruction rates for sodium, i.e. and . Our present-day knowledge, based on nuclear cross section experiments (Iliadis et al., 2010a; Cesaratto et al., 2013), indicates that destruction of sodium is largely dominated by the reaction at the temperatures relevant for HBB . The estimated lower and upper limit uncertainties for this rate are, however, relatively low, not exceeding .
-
•
The remaining uncertainties of the chemical ejecta for 22Ne and 23Na are mainly dominated by stellar evolutionary aspects, in particular the efficiency of convection, mass loss, and third dredge-up events. While the efficiencies of mass loss and convection mainly control the duration of HBB and the activation of the nuclear cycles, the third dredge-up has a direct effect on the total abundance of the isotopes that enter in the cycles. In fact, the amount of material that is dredged-up to the surface determines the amount of new 22Ne that is added into the envelope and later converted into 23Na by the 22NeNa reaction. Our tests indicate only varying the efficiency of the third dredge-up in low-metallicity AGB stars from high values () to zero () causes a reduction of the 22Ne ejecta by factors of 10-20, as well a reduction 23Na ejecta by factors of 4-5.
-
•
We examined our results in relation to the hypothesis that the observed O-Na anti-correlation observed in GGCs’ stars is due to processed material in the ejecta of low-metallicity AGB stars. The ejecta obtained with the LUNA rate, together with our reference AGB model prescriptions, are able to recover the most Na-enriched stars of the anti-correlation, which are expected to exhibit the chemical composition of pure AGB ejecta. By adopting a simple dilution model, the general morphology of the anti-correlation is also satisfactorily reproduced. At the same time, however, we predict a sizable increase of the CNO content in the AGB ejecta (caused by the efficient third dredge-up assumed in the models), a feature that is at variance with the observations.
On the other hand, assuming no or weak third dredge-up, hence no or little 22Ne enrichment in the envelope, models are not able to produce the highest [Na/Fe] values on the upper extreme of the anti-correlation. This difficulty holds also under the assumptions of very high mass loss and/or strong HBB, as in both cases the TP-AGB phase is shortened and no significant replenishment of 22Ne is predicted. The contribution from super-AGB stars, not explicitly treated in this work, is likely not to improve the situation since sodium ejecta tend to decrease at increasing stellar mass (Doherty et al., 2014b; D’Ercole et al., 2010).
-
•
Starting from our reference AGB models, we changed various input prescriptions to verify whether the chemical constraints on sodium, oxygen and CNO content can be simultaneously fulfilled. After several tests, we singled out two optimal sets of AGB model assumptions under which the Na-rich, O-poor extreme of the anti-correlation is, for the first time, reproduced by pure AGB ejecta (without invoking external processes such as extra-mixing on the RGB).
In the first set of models we allow a moderate third dredge-up, so that the CNO abundance increases by a factor . Matching the oxygen and sodium abundances requires an efficient HBB and a significant reduction, by a factor of 5, of the rate for , in combination with the LUNA rate for 22NeNa.
In the second set of models we impose the absence of any third dredge-up event, in order to keep the total CNO abundance constant. In this case the extreme of the anti-correlation is also reached by adopting moderately different prescriptions for the mass loss, HBB, and the sodium destruction rate (with a reduction by a factor of 3).
-
•
Such "calibrated" modifications (by a factor of 3-5) of the nuclear rate for confirm quantitatively earlier suggestions by independent studies (D’Antona et al., 2016; Renzini et al., 2015; Ventura & D’Antona, 2006). At the same time, they appear to be too large if one considers that present lower-limit estimates of the nuclear cross section allow a maximum reduction by a factor of . At present, this poses a severe problem that undermines the suitability of the AGB star solution in the context of the GGCs anti-correlations. Future nuclear experiments will be of key relevance to quantify more precisely the extent of sodium destruction in the stellar sites where the NeNa cycle operates.
-
•
Other constraints, such as the magnesium depletion and the helium spread of different stellar populations, are not explicitly considered in the chemical calibration. We note that our AGB ejecta at low metallicity, likewise many other sets in the literature, are highly enriched in helium as a consequence of the second dredge-up. In the framework of a simple dilution model, this would likely imply a large helium spread between stars of the first and second generations, and therefore may represent a serious difficulty to the AGB scenario, as discussed by Bastian et al. (2015, but see also () for a different approach).
In conclusion, the AGB star hypothesis still deserves further quantitative analyses, which may be performed through stellar evolution experiments similar to those we have carried out in this study.
Acknowledgments
This research is mainly supported by the University of Padova and by the ERC Consolidator Grant funding scheme (project STARKEY, G.A. n. 615604). The LUNA experiment was supported by INFN, DFG (BE 4100-2/1), NAVI (HGF VH-VI-417) and OTKA (K101328). We thank Maria Lugaro for helpful comments and discussion.
References
- Angulo et al. (1999) Angulo C., Arnould M., Rayet M., Descouvemont P., Baye D., Leclercq-Willain C., 1999, Nuclear Physics A, 656, 3
- Bastian et al. (2015) Bastian N., Cabrera-Ziri I., Salaris M., 2015, MNRAS, 449, 3333
- Bedijn (1988) Bedijn P. J., 1988, A&A, 205, 105
- Blöcker (1995) Blöcker T., 1995, A&A, 297, 727
- Böhm-Vitense (1958) Böhm-Vitense E., 1958, ZAp, 46, 108
- Boothroyd & Sackmann (1988) Boothroyd A. I., Sackmann I.-J., 1988, ApJ, 328, 653
- Boothroyd et al. (1995) Boothroyd A. I., Sackmann I.-J., Wasserburg G. J., 1995, ApJ, 442, L21
- Bressan et al. (2012) Bressan A., Marigo P., Girardi L., Salasnich B., Dal Cero C., Rubele S., Nanni A., 2012, MNRAS, 427, 127
- Broggini et al. (2010) Broggini C., Bemmerer D., Guglielmetti A., Menegazzo R., 2010, Annual Review of Nuclear and Particle Science, 60, 53
- Caffau et al. (2011) Caffau E., Ludwig H.-G., Steffen M., Freytag B., Bonifacio P., 2011, Sol. Phys., 268, 255
- Carretta (2015) Carretta E., 2015, ApJ, 810, 148
- Carretta et al. (2005) Carretta E., Gratton R. G., Lucatello S., Bragaglia A., Bonifacio P., 2005, A&A, 433, 597
- Carretta et al. (2009) Carretta E., Bragaglia A., Gratton R., Lucatello S., 2009, A&A, 505, 139
- Cavanna et al. (2014) Cavanna F., et al., 2014, European Physical Journal A, 50, 179
- Cavanna et al. (2015) Cavanna F., Depalo R., Aliotta M., Anders M., Bemmerer D., Best A., LUNA Collaboration 2015, Physical Review Letters, 115, 252501
- Cesaratto et al. (2013) Cesaratto J. M., et al., 2013, Phys. Rev. C, 88, 065806
- Chantereau et al. (2016) Chantereau W., Charbonnel C., Meynet G., 2016, A&A, 592, A111
- Conroy (2012) Conroy C., 2012, ApJ, 758, 21
- Costantini et al. (2009) Costantini H., Formicola A., Imbriani G., Junker M., Rolfs C., Strieder F., 2009, Reports on Progress in Physics, 72, 086301
- Cristallo et al. (2009) Cristallo S., Straniero O., Gallino R., Piersanti L., Domínguez I., Lederer M. T., 2009, ApJ, 696, 797
- Cristallo et al. (2011) Cristallo S., et al., 2011, ApJS, 197, 17
- Cristallo et al. (2015) Cristallo S., Straniero O., Piersanti L., Gobrecht D., 2015, ApJS, 219, 40
- Cyburt et al. (2010) Cyburt R. H., et al., 2010, ApJS, 189, 240
- D’Antona et al. (2016) D’Antona F., Vesperini E., D’Ercole A., Ventura P., Milone A. P., Marino A. F., Tailo M., 2016, MNRAS, 458, 2122
- D’Ercole et al. (2010) D’Ercole A., D’Antona F., Ventura P., Vesperini E., McMillan S. L. W., 2010, MNRAS, 407, 854
- D’Ercole et al. (2012) D’Ercole A., D’Antona F., Carini R., Vesperini E., Ventura P., 2012, MNRAS, 423, 1521
- D’Orazi et al. (2013) D’Orazi V., Campbell S. W., Lugaro M., Lattanzio J. C., Pignatari M., Carretta E., 2013, MNRAS, 433, 366
- Dalcanton et al. (2009) Dalcanton J. J., et al., 2009, ApJS, 183, 67
- Decressin et al. (2007) Decressin T., Meynet G., Charbonnel C., Prantzos N., Ekström S., 2007, A&A, 464, 1029
- Denissenkov & Hartwick (2014) Denissenkov P. A., Hartwick F. D. A., 2014, MNRAS, 437, L21
- Denissenkov & Herwig (2003) Denissenkov P. A., Herwig F., 2003, ApJ, 590, L99
- Depalo et al. (2015) Depalo R., et al., 2015, Phys. Rev. C, 92, 045807
- Doherty et al. (2014a) Doherty C. L., Gil-Pons P., Lau H. H. B., Lattanzio J. C., Siess L., 2014a, MNRAS, 437, 195
- Doherty et al. (2014b) Doherty C. L., Gil-Pons P., Lau H. H. B., Lattanzio J. C., Siess L., Campbell S. W., 2014b, MNRAS, 441, 582
- Fenner et al. (2004) Fenner Y., Campbell S., Karakas A. I., Lattanzio J. C., Gibson B. K., 2004, MNRAS, 353, 789
- Forestini & Charbonnel (1997) Forestini M., Charbonnel C., 1997, A&AS, 123
- Frost & Lattanzio (1996) Frost C. A., Lattanzio J. C., 1996, ApJ, 473, 383
- García-Hernández et al. (2006) García-Hernández D. A., García-Lario P., Plez B., D’Antona F., Manchado A., Trigo-Rodríguez J. M., 2006, Science, 314, 1751
- García-Hernández et al. (2009) García-Hernández D. A., et al., 2009, ApJ, 705, L31
- Girardi et al. (2010) Girardi L., et al., 2010, ApJ, 724, 1030
- Goriely & Siess (2004) Goriely S., Siess L., 2004, A&A, 421, L25
- Hale et al. (2004) Hale S. E., Champagne A. E., Iliadis C., Hansper V. Y., Powell D. C., Blackmon J. C., 2004, Phys. Rev. C, 70, 045802
- Herwig (2004) Herwig F., 2004, ApJ, 605, 425
- Iliadis et al. (2010a) Iliadis C., Longland R., Champagne A. E., Coc A., Fitzgerald R., 2010a, Nuclear Physics A, 841, 31
- Iliadis et al. (2010b) Iliadis C., Longland R., Champagne A. E., Coc A., 2010b, Nuclear Physics A, 841, 251
- Ivans et al. (1999) Ivans I. I., Sneden C., Kraft R. P., Suntzeff N. B., Smith V. V., Langer G. E., Fulbright J. P., 1999, AJ, 118, 1273
- Izzard et al. (2007) Izzard R. G., Lugaro M., Karakas A. I., Iliadis C., van Raai M., 2007, A&A, 466, 641
- Kalirai et al. (2014) Kalirai J. S., Marigo P., Tremblay P.-E., 2014, ApJ, 782, 17
- Karakas (2010) Karakas A. I., 2010, MNRAS, 403, 1413
- Karakas & Lattanzio (2003) Karakas A. I., Lattanzio J. C., 2003, PASA, 20, 393
- Karakas & Lattanzio (2007) Karakas A., Lattanzio J. C., 2007, PASA, 24, 103
- Karakas & Lattanzio (2014) Karakas A. I., Lattanzio J. C., 2014, PASA, 31, e030
- Karakas et al. (2002) Karakas A. I., Lattanzio J. C., Pols O. R., 2002, PASA, 19, 515
- Karakas et al. (2006) Karakas A. I., Fenner Y., Sills A., Campbell S. W., Lattanzio J. C., 2006, ApJ, 652, 1240
- Krause et al. (2013) Krause M., Charbonnel C., Decressin T., Meynet G., Prantzos N., 2013, A&A, 552, A121
- Kurucz (1994) Kurucz R., 1994, Solar abundance model atmospheres for 0,1,2,4,8 km/s. Kurucz CD-ROM No. 19. Cambridge, Mass.: Smithsonian Astrophysical Observatory, 1994., 19
- Marigo (2001) Marigo P., 2001, A&A, 370, 194
- Marigo (2015) Marigo P., 2015, in Kerschbaum F., Wing R. F., Hron J., eds, Astronomical Society of the Pacific Conference Series Vol. 497, Why Galaxies Care about AGB Stars III: A Closer Look in Space and Time. p. 229 (arXiv:1411.3126)
- Marigo & Aringer (2009) Marigo P., Aringer B., 2009, A&A, 508, 1539
- Marigo & Girardi (2007) Marigo P., Girardi L., 2007, A&A, 469, 239
- Marigo et al. (2003) Marigo P., Girardi L., Chiosi C., 2003, A&A, 403, 225
- Marigo et al. (2008) Marigo P., Girardi L., Bressan A., Groenewegen M. A. T., Silva L., Granato G. L., 2008, A&A, 482, 883
- Marigo et al. (2013) Marigo P., Bressan A., Nanni A., Girardi L., Pumo M. L., 2013, MNRAS, 434, 488
- Milone et al. (2012) Milone A. P., Piotto G., Bedin L. R., Cassisi S., Anderson J., Marino A. F., Pietrinferni A., Aparicio A., 2012, A&A, 537, A77
- Milone et al. (2014) Milone A. P., et al., 2014, ApJ, 785, 21
- Mowlavi (1999a) Mowlavi N., 1999a, A&A, 344, 617
- Mowlavi (1999b) Mowlavi N., 1999b, A&A, 350, 73
- Prantzos et al. (2007) Prantzos N., Charbonnel C., Iliadis C., 2007, A&A, 470, 179
- Rauscher & Thielemann (2000) Rauscher T., Thielemann F.-K., 2000, Atomic Data and Nuclear Data Tables, 75, 1
- Renzini (2008) Renzini A., 2008, MNRAS, 391, 354
- Renzini et al. (2015) Renzini A., et al., 2015, MNRAS, 454, 4197
- Rolfs & Rodney (1988) Rolfs C. E., Rodney W. S., 1988, Cauldrons in the Cosmos. The University of Chicago Press, Chicago 60637
- Rosenfield et al. (2014) Rosenfield P., et al., 2014, ApJ, 790, 22
- Rosenfield et al. (2016) Rosenfield P., Marigo P., Girardi L., Dalcanton J. J., Bressan A., Williams B. F., Dolphin A., 2016, preprint, (arXiv:1603.05283)
- Rowland et al. (2004) Rowland C., Iliadis C., Champagne A. E., Fox C., José J., Runkle R., 2004, ApJ, 615, L37
- Sallaska et al. (2013) Sallaska A. L., Iliadis C., Champange A. E., Goriely S., Starrfield S., Timmes F. X., 2013, ApJS, 207, 18
- Schröder & Cuntz (2005) Schröder K.-P., Cuntz M., 2005, ApJ, 630, L73
- Siess (2010) Siess L., 2010, A&A, 512, A10
- Smiljanic et al. (2009) Smiljanic R., Gauderon R., North P., Barbuy B., Charbonnel C., Mowlavi N., 2009, A&A, 502, 267
- Straniero et al. (2013) Straniero O., et al., 2013, ApJ, 763, 100
- Straniero et al. (2014) Straniero O., Cristallo S., Piersanti L., 2014, ApJ, 785, 77
- Vassiliadis & Wood (1993) Vassiliadis E., Wood P. R., 1993, ApJ, 413, 641
- Ventura & D’Antona (2005a) Ventura P., D’Antona F., 2005a, A&A, 431, 279
- Ventura & D’Antona (2005b) Ventura P., D’Antona F., 2005b, A&A, 439, 1075
- Ventura & D’Antona (2005c) Ventura P., D’Antona F., 2005c, ApJ, 635, L149
- Ventura & D’Antona (2006) Ventura P., D’Antona F., 2006, A&A, 457, 995
- Ventura & D’Antona (2008) Ventura P., D’Antona F., 2008, A&A, 479, 805
- Ventura & D’Antona (2009) Ventura P., D’Antona F., 2009, A&A, 499, 835
- Ventura & Marigo (2010) Ventura P., Marigo P., 2010, MNRAS, 408, 2476
- Ventura et al. (2013) Ventura P., Di Criscienzo M., Carini R., D’Antona F., 2013, MNRAS, 431, 3642
- Yong et al. (2009) Yong D., Grundahl F., D’Antona F., Karakas A. I., Lattanzio J. C., Norris J. E., 2009, ApJ, 695, L62
- Yong et al. (2015) Yong D., Grundahl F., Norris J. E., 2015, MNRAS, 446, 3319
- Zamora et al. (2014) Zamora O., García-Hernández D. A., Plez B., Manchado A., 2014, A&A, 564, L4
- de Mink et al. (2009) de Mink S. E., Pols O. R., Langer N., Izzard R. G., 2009, A&A, 507, L1