11email: chris.haines@oa-brera.inaf.it 22institutetext: Institute of Physics, Jan Kochanowski University, ul. Swietokrzyska 15, 25-406 Kielce, Poland 33institutetext: Università degli Studi di Milano, via G. Celoria 16, 20133 Milano, Italy 44institutetext: Aix Marseille Univ, CNRS, LAM, Laboratoire d’Astrophysique de Marseille, Marseille, France 55institutetext: INAF - Osservatorio Astronomico di Bologna, via Ranzani 1, I-40127, Bologna, Italy 66institutetext: INAF - Istituto di Astrofisica Spaziale e Fisica Cosmica Milano, via Bassini 15, 20133 Milano, Italy77institutetext: INAF - Osservatorio Astronomico di Trieste, via G. B. Tiepolo 11, 34143 Trieste, Italy 88institutetext: INAF - Osservatorio Astronomico di Torino, 10025 Pino Torinese, Italy 99institutetext: Dipartimento di Fisica e Astronomia - Alma Mater Studiorum Università di Bologna, viale Berti Pichat 6/2, I-40127 Bologna, Italy 1010institutetext: Laboratoire Lagrange, UMR7293, Université de Nice Sophia Antipolis, CNRS, Observatoire de la Côte d’Azur, 06300 Nice, France 1111institutetext: National Centre for Nuclear Research, ul. Hoza 69, 00-681 Warszawa, Poland 1212institutetext: INFN, Sezione di Bologna, viale Berti Pichat 6/2, I-40127 Bologna, Italy 1313institutetext: Aix-Marseille Université, Jardin du Pharo, 58 bd Charles Livon, F-13284 Marseille cedex 7, France1414institutetext: IRAP, 9 av. du colonel Roche, BP 44346, F-31028 Toulouse cedex 4, France1515institutetext: Astronomical Observatory of the Jagiellonian University, Orla 171, 30-001 Cracow, Poland 1616institutetext: School of Physics and Astronomy, University of St Andrews, St Andrews KY16 9SS, UK 1717institutetext: INAF - Istituto di Astrofisica Spaziale e Fisica Cosmica Bologna, via Gobetti 101, I-40129 Bologna, Italy 1818institutetext: INAF - Istituto di Radioastronomia, via Gobetti 101, I-40129, Bologna, Italy 1919institutetext: Canada-France-Hawaii Telescope, 65–1238 Mamalahoa Highway, Kamuela, HI 96743, USA 2020institutetext: Aix Marseille Univ, Univ Toulon, CNRS, CPT, Marseille, France 2121institutetext: Dipartimento di Matematica e Fisica, Università degli Studi Roma Tre, via della Vasca Navale 84, 00146 Roma, Italy 2222institutetext: INFN, Sezione di Roma Tre, via della Vasca Navale 84, I-00146 Roma, Italy 2323institutetext: INAF - Osservatorio Astronomico di Roma, via Frascati 33, I-00040 Monte Porzio Catone (RM), Italy 2424institutetext: Astronomical Observatory of the University of Geneva, ch. d’Ecogia 16, 1290 Versoix, Switzerland2525institutetext: Department of Astronomy & Physics, Saint Mary’s University, 923 Robie Street, Halifax, Nova Scotia, B3H 3C3, Canada2626institutetext: Institute for Astronomy, University of Edinburgh, Royal Observatory, Blackford Hill, Edinburgh EH9 3HJ, UK 2727institutetext: Center for Theoretical Physics, Al. Lotnikow 32/46, 02-668 Warsaw, Poland
The VIMOS Public Extragalactic Redshift Survey (VIPERS)
We use the full VIPERS redshift survey in combination with SDSS-DR7 to explore the relationships between star-formation history (using d4000), stellar mass and galaxy structure, and how these relationships have evolved since . We trace the extents and evolutions of both the blue cloud and red sequence, by fitting double Gaussians to the d4000 distribution of galaxies in narrow stellar mass bins, for four redshift intervals over . This reveals downsizing in star formation, as the high-mass limit of the blue cloud retreats steadily with time from at to by the present day. The number density of massive blue-cloud galaxies (, d) drops sharply by a factor five between and . These galaxies are becoming quiescent at a rate that largely matches the increase in the numbers of massive passive galaxies seen over this period. We examine the size-mass relation of blue cloud galaxies, finding that its high-mass boundary runs along lines of constant or equivalently inferred velocity dispersion. Larger galaxies can continue to form stars to higher stellar masses than smaller galaxies. As blue cloud galaxies approach this high-mass limit, they start to be quenched, their d4000 values increasing to push them towards the green valley. In parallel, their structures change, showing higher Sérsic indices and central stellar mass densities. For these galaxies, bulge growth is necessary for them to reach the high-mass limit of the blue cloud and be quenched by internal mechanisms. The blue cloud galaxies that are being quenched at lie along the same size-mass relation as present day quiescent galaxies, and seem the likely progenitors of today’s S0s.
Key Words.:
Galaxies: evolution, star formation, stellar content, structure1 Introduction
The recent wide-field surveys such as the Sloan Digital Sky Survey (SDSS) have firmly established that galaxies in the local Universe can be broadly divided into two distinct populations according to their UV-optical colours: the blue cloud made up of young, star-forming galaxies; and the red sequence of passively-evolving galaxies that becomes increasingly dominant with stellar mass (Strateva et al., 2001; Baldry et al., 2004; Wyder et al., 2007; Blanton & Moustakas, 2009; Taylor et al., 2015). This bimodality in colour (or star-formation activity) and its mass-dependence has been shown to persist to at least (Pozzetti et al., 2010; Muzzin et al., 2013; Ilbert et al., 2013; Tomczak et al., 2014), with star-forming galaxies following a tight relation between star formation rate (SFR) and stellar mass () (Noeske et al., 2007; Speagle et al., 2014; Lee et al., 2015).
This dichotomy in colour is deeply entwined with the well-known structural bimodality of galaxies, which can broadly be separated into smooth early-types and disc-dominated spirals (Hubble, 1926; Sandage, 1961; Kormendy & Bender, 2012). The bivariate distribution of galaxies in the colour–Sérsic index () plane reveals two distinct peaks corresponding to blue, star-forming discs and red, quiescent bulges (Driver et al., 2006; Ball et al., 2007), up to (Bruce et al., 2014; Krywult et al., 2016). The star-formation activity of galaxies in the local Universe has been found to correlate more strongly with mean stellar mass density (; Kauffmann et al., 2003a, 6; Brinchmann et al., 2004), the presence of a bulge (Bell, 2008), and the stellar mass density within the central kpc (; Fang et al., 2013) than with stellar mass. Omand et al. (2014) found that the fraction of quiescent galaxies correlates best with . These correlations have been found to persist up to (Franx et al., 2008; Wuyts et al., 2011; Cheung et al., 2012; Bell et al., 2012; Lang et al., 2014; Barro et al., 2015; Whitaker et al., 2016). These correlations suggest that the internal structure of a galaxy, and its development, must play a crucial role in driving or regulating its star formation activity, although Lilly & Carollo (2016) show how these correlations can arise naturally even in cases where structure plays no physical role.
The total stellar mass content of galaxies has approximately doubled since .0–1.2 (e.g. Muzzin et al., 2013; Ilbert et al., 2013; Tomczak et al., 2014). This growth in the integrated stellar mass contained within galaxies has been found to be in good agreement with the cosmic SFR integrated over the same period (Bell et al., 2007; Ilbert et al., 2013). However, while these new stars are being formed within the blue cloud, the build-up of stellar mass is largely confined to the red sequence population of quiescent galaxies (Arnouts et al., 2007; Tomczak et al., 2014), while the integrated stellar mass within the star-forming galaxy population has remained approximately constant since (Bell et al., 2007; Ilbert et al., 2010; Pozzetti et al., 2010).
If the massive blue-cloud galaxies observed at were to continue growing by forming stars at rates given by the evolving SFR– relation of normal star-forming galaxies through to the present day, this would leave a large population of massive spiral galaxies at (Bell et al., 2007). This population is simply not seen in the local universe. Instead, the maximum stellar mass of actively star-forming galaxies was observed by Cowie et al. (1996) to have fallen steadily from to lower redshifts, a process they termed as “downsizing”. The term downsizing has since been used to describe a variety of seemingly anti-hierarchical behaviours within galaxy populatons (Fontanot et al., 2009), such as the finding that massive quiescent galaxies have stellar populations that formed earlier and over shorter time-scales than lower-mass systems (e.g. Thomas et al., 2005). This can lead to confusion. Here we refer to downsizing in the original sense of Cowie et al. (1996).
Something is required to shut down star formation in massive blue cloud galaxies at a high enough rate to ensure that the stellar mass function (SMF) of star-forming galaxies remains approximately unchanged since (Pozzetti et al., 2010; Moutard et al., 2016b), and to enable the high-mass end of the red sequence to build up rapidly over the same period (Davidzon et al., 2013; Fritz et al., 2014). Peng et al. (2010) show that to keep the blue cloud SMF unchanged requires a mechanism which terminates star formation in massive galaxies at a rate that is statistically proportional to their SFR. This process is loosely termed “mass quenching” and is believed to be the dominant mechanism for terminating star formation among high-mass () blue cloud galaxies, while environment-related processes become more important at lower stellar masses (e.g. Haines et al., 2007). In this work, we focus on those quenching processes that act internally to the galaxy (including its circumgalactic medium) and which define the limiting galaxy properties beyond which they cannot continue growing through forming stars. We do not consider environmental effects further.
A variety of physical mechanisms have been proposed that could be responsible for quenching star formation in blue cloud galaxies once they reach a certain mass (Gabor et al., 2010). Feedback from an active galactic nucleus (AGN) has been frequently invoked to limit the growth of massive galaxies and produce the turnover in the SMF by suppressing gas cooling (Bower et al., 2006). Gas-rich galaxy mergers channel large amounts of gas onto the central nucleus, fuelling powerful starbursts and rapid black hole growth, until feedback from accretion is able to drive quasar winds and expel the remaining gas from the galaxy, quenching star formation (Di Matteo et al., 2005; Hopkins et al., 2006). Subsequent low-level “radio mode” AGN feedback may then prevent the hot gas corona from cooling and reinitiating star formation (Croton et al., 2006).
Martig et al. (2009) proposed that the build up of a central mass concentration or bulge within a massive star-forming galaxy could stabilize the gas disc against fragmentation and collapse into molecular gas clouds, and morphologically quench its star formation from the inside-out (Genzel et al., 2014). Low-level feedback from the winds of AGB stars could contribute to prevent the residual gas from cooling in dense, early-type galaxies, keeping them quiescent (Conroy et al., 2015). The evolution of a galaxy is also thought to depend on the mass of the dark matter (DM) halo that hosts it, through the transition from low-mass halos where narrow streams of cold gas continually feed the galaxy with new fuel for star formation, to DM haloes more massive than where stable virial shocks form, heating the infalling gas to the virial temperature (K), and dramatically reducing the accretion rate of gas onto the galaxy (Kereš et al., 2005; Dekel & Birnboim, 2006; Dekel et al., 2009)
The star formation history of a galaxy is fundamentally written within its spectrum, comprising both emission lines from gas ionized by the UV photons of short-lived hot O and B stars, representing the current SFR, and the stellar continuum produced by evolved stars. This continuum contains a complex array of spectral features and absorption lines that encode many details of the stellar demographics. One of the most direct methods for characterising the star formation history of galaxies is measuring the 4000Å spectral break (hereafter d4000), the strongest discontinuity in the optical spectrum of a galaxy. The strong break occurs in older stellar populations due to a sudden accumulation of absorption features blueward of 4000Å (e.g. Caii H+K lines) that appear in stars cooler than G0 (6000K) due to ionized metals. In hotter stars, elements are multiply ionized and the opacity decreases, so the break appears much smaller (d.0–1.4). Since hot stars are short-lived, the d4000 index increases monotonically with stellar age. Kauffmann et al. (2003b) showed that it is an excellent age indicator, in particular for young ( Gyr, d) stellar populations where it does not depend strongly on metallicity. Brinchmann et al. (2004) showed that d4000 may also be used as a proxy for specific-SFR (SFR/). Kauffmann et al. (2003a) showed that galaxies in the local Universe can be split into two well-separated populations: low-mass galaxies with low d4000 values () indicative of young stellar populations, low surface mass densities and Sérsic indices typical of discs; and high-mass galaxies with high d4000 values () indicative of old stellar populations, high stellar mass densities and concentrations. Later studies that combined d4000 with a range of age and metallicity-dependent spectral indices to obtain more robust constraints on the light-weighted stellar ages of galaxies, confirmed that the bimodality in d4000 seen by Kauffmann et al. (2003a) indeed signifies a bimodality in stellar age (Gallazzi et al., 2005; Haines et al., 2006).
The key limitation of Kauffmann et al. (2003a) and other SDSS-based studies is that all the galaxies are at essentially the same redshift, so that we cannot follow the evolution of the observed trends between d4000 and or galaxy structure over a cosmically signficant time-scale, or determine when these trends were established. The present paper attempts to do this, taking advantage of the recently completed VIMOS Public Extragalactic Redshift Survey (VIPERS) to trace the bimodal distribution of galaxies in the d4000– plane back to , and explore how the relationships between star-formation history, stellar mass and galaxy structure have evolved over the last eight billion years.
The fundamental objective of the VIPERS project has been to provide a representative vision of the large-scale structure and the global properties of galaxies when the Universe was about half its current age (Guzzo et al., 2014), just as the SDSS survey has done for the local Universe. The availability of robust spectral parameters including d4000 and [Oii], as well as stellar masses and structural parameters obtained from high-quality CFHTLS imaging, for a well-defined sample of almost 100,000 galaxies at , allows the distributions of the global properties of galaxies to be mapped in fine detail. VIPERS uniquely provides a large volume coverage at allowing the assembly of statistically representative samples of relatively rare massive galaxies above , and in particular those at the high-mass end of the blue cloud. The VIPERS survey and the local SDSS sample are described in Section 2.
Section 3 examines the evolution of the bimodal distribution of galaxies in the d4000– plane, and downsizing in the high-mass limit of the blue cloud. The evolution in the number density of massive blue-cloud galaxies is presented in Section 4. Section 5 presents the size-mass relations of blue-cloud galaxies, examining the dependencies of d4000 and on the effective radius and stellar mass of galaxies, and demonstating how mass quenching is influenced also by galaxy size. The discussion and summary follow in Sections 6 and 7. A concordance CDM cosmology with , and km s-1 Mpc-1 is assumed throughout.
2 Data
VIPERS is a spectroscopic survey, completed in 2015, which has targeted 000 galaxies at over 23.5 deg2, split into two fields within the Canada-France-Hawaii Telescope Legacy Survey Wide (CFHTLS-Wide111http://www.cfht.hawaii.edu/Science/CFHTLS/), namely W1 and W4. All details of the survey design, construction and scientific goals can be found in Guzzo et al. (2014). Spectroscopic targets were selected to have (after correction for Galactic extinction), with a second selection criterion, based on () and () colours applied to exclude low-redshift () objects.
All the spectroscopic observations for VIPERS were carried out using the VIsible Multi-Object Spectrograph (VIMOS) on the 8.2m Very Large Telescope (VLT) Unit 3, with the LR-Red grism which provides a spectral resolution over the wavelength range 5500–9500Å at a dispersion of 7.3Å/pixel. To maximize the multiplex capabiliity of VIMOS, the short-slit strategy described in Scodeggio et al. (2009) was used. This enabled a target sampling rate of 47% to be reached with a single pass. The reduction and redshift measurement is performed within a fully automated pipeline, before each redshift is independently validated by two team members and its reliability quantified using the flag , following a scheme similar to that used for VVDS (Le Fèvre et al., 2005) and zCOSMOS (Lilly et al., 2007). From repeated measurements, typical redshift uncertaintes of are obtained (Scodeggio et al., 2016).
The dataset used in this paper is based on an internal pre-release of the final, complete VIPERS spectroscopic catalogue, the Second Public Data Release (PDR-2; Scodeggio et al., 2016). From this sample, we consider only the 75 479 galaxies with highly accurate redshift measurements, that is with and . This excludes broad-line AGN, stars and secondary objects that happened by chance to appear in the slit of a primary target. The strength of the 4000Å break was measured for all galaxies with reliable redshifts in the range , which meant that the spectral feature was fully contained within the wavelength range covered by the VIMOS spectra (Garilli et al., 2014). We adopt the narrow definition of the amplitude of the 4000Å break introduced by Balogh et al. (1999), which is relatively insensitive to the effects of dust reddening. This is defined as the ratio of the average continuum flux density in the wavebands 4000–4100Å and 3850–3950Å. At the VIPERS sample becomes highly incomplete due to the colour cuts imposed in the selection of spectroscopic targets, while at , the survey becomes incomplete even at the highest stellar masses (; Davidzon et al., 2013). We thus limit our analysis to redshifts , giving a final sample of 65 142 galaxies with reliable redshifts and d4000 measurements, 43 607 in the W1 field and 21 535 in W4. The PDR-2 sample includes 450 additional reliable redshifts in the range that were validated after the analysis was completed, i.e. a difference of % from the sample used.
Since it was only possible to obtain redshifts for 0% of all possible targets, statistical weights are required to make this subsample representative of all galaxies within the parent photometric catalogue (). For every galaxy in the final sample, the likelihood that it was targeted and a reliable redshift obtained is encoded through the Target Sampling Rate (TSR) and Spectroscopic Success Rate (SSR) parameters (for full details see Guzzo et al., 2014). The TSR reflects the localized variation in the spatial density of targets across the survey area, as the fraction of galaxies within a given VIMOS quadrant satisfying the selection criteria that it was then possible to place behind a slit and observe. The SSR represents the probability of being able to obtain a reliable redshift for a galaxy, given its magnitude, redshift and VIMOS quadrant.
For each galaxy in the VIPERS spectroscopic sample, improved photometric measurements have been obtained in the bands from the T0007 release of the CFHTLS images and photometric catalogues of the W1 and W4 fields, combined with photometry from the VIPERS Multi-Lambda Survey (VIPERS-MLS222http://cesam.lam.fr/vipers-mls/; Moutard et al., 2016a), based on follow-up CFHT/WIRCam -band imaging or from the VISTA Deep Extragalactic Observations (VIDEO; Jarvis et al., 2013) survey. Total stellar masses () and rest-frame colours are obtained using the updated Hyperzmass (Bolzonella et al., 2000, 2010) code, with a set-up similar to that used in Davidzon et al. (2016). The photometry of each galaxy is compared to a set of synthetic spectral energy distributions (SEDs) shifted by . The SED library is built using the stellar population synthesis model of Bruzual & Charlot (2003), with a wide variety of star-formation histories and adopting the universal initial mass function (IMF) of Chabrier (2003). Each template has a fixed metallicity ( or ) and dust reddening that follows Calzetti et al. (2000) or Prévot-Bouchet (Prevot et al., 1984; Bouchet et al., 1985) attenuation curves ( ranging from 0 to 3). The code selects as best-fit SED the model that minimizes the value. The stellar mass estimate is taken directly from the best-fit template. Absolute magnitudes in the rest-frame waveband are computed starting from the apparent magnitude observed in the filter closest to , and then -corrected using the model SED. We derive the stellar mass completeness limits of the VIPERS survey as a function of both redshift and d4000 value as described in Appendix A.
2.1 Structural parameters
Krywult et al. (2016) determined robust structural parameter measurements (e.g. , ) for VIPERS galaxies with reliable redshifts (), fitting 2D PSF-convolved Sérsic profiles to the observed -band light distribution of galaxies from the high-quality CFHTLS-Wide images (T0006 release). These images obtained with the MegaCam instrument have a 0.186′′ pixel scale and typical seeing of 0.64′′ FHWM. To accurately model the PSF variation across each MegaCam image, elliptical Moffat fits were performed for isolated, bright, non-saturated stars that are distributed across the full image. Each fitted parameter of the Moffat function was then approximated by a 2D Chebyshev polynomial, enabling the local PSF to be generated at the position of each galaxy.
In this work we use the circularized -band half-light radius () as a measure of each galaxy’s size, and the best-fit Sérsic index as a measure of its structure. Krywult et al. (2016) fully tested the reliability of their structural parameter measurements by placing model galaxies within the CFHTLS images, from which they estimate uncertainties in their half-light radii of 4.4% (12%) for 68% (95%) of galaxies. Assuming that the stellar mass is distributed radially following the observed -band light (i.e. there are no radial variations in the mass-to-light ratio within the galaxy), the effective stellar mass surface density is then defined as . The central stellar mass surface density is estimated by integrating the best-fit Sérsic profile in two dimensions out to a radius of 1 kpc.
Approximately 13% of the VIPERS survey area was not covered by the structural parameter analysis of Krywult et al. (2016), while other galaxies are excluded due to having poor local PSFs, GALFIT not converging, or because the best-fit profile had which is not physical. This results in a sample of 49 533 galaxies with reliable structural parameters (and reliable redshifts) or 76% of our full sample of 65 142. The likelihood that we were able to determine structural parameters for a galaxy shows no sign of depending on its properties (e.g. stellar mass) or redshift. The stellar mass and redshift distributions of those galaxies with reliable structural parameters are indistinguishable from the full sample.
2.2 SDSS comparison sample of local galaxies
For a comparison sample of local () galaxies with available stellar masses, d4000 measurements and structural parameters we take the catalogue of Omand et al. (2014) which is based upon the 7th data release of the SDSS (SDSS-DR7; Abazajian et al., 2009), and matches the structural parameter measurements of Simard et al. (2011) with the stellar mass estimates and spectral index measurements (e.g. d4000) from the MPA-JHA DR7 catalogues (Kauffmann et al., 2003b; Brinchmann et al., 2004; Salim et al., 2007). We consider only those galaxies within the contiguous region of the the North Galactic Cap, which covers 7 500 deg2. These stellar masses assume a Kroupa IMF, and so we reduce them by 10% to correct their mass-to-light ratios to the Chabrier (2003) IMF used here.
For direct comparison to our structural parameters, we take the -band half-light circularized effective radii () and Sérsic index from the best-fit PSF-convolved pure Sérsic profiles obtained by Simard et al. (2011) using GIM2D. Simard et al. (2011) also performed full bulge-disc decompositions, with bulge and exponential disc components, from which we take their measurements of the fraction of -band light in the bulge component (B/T). The faint galaxy magnitude limit of the SDSS spectroscopic survey is , while Simard et al. (2011) apply a bright galaxy cut at . This results in incompleteness, both at low masses () for , but also at the very highest stellar masses () within .
3 The bimodal d4000 distribution of galaxies and its evolution from z=1.0 to the present day
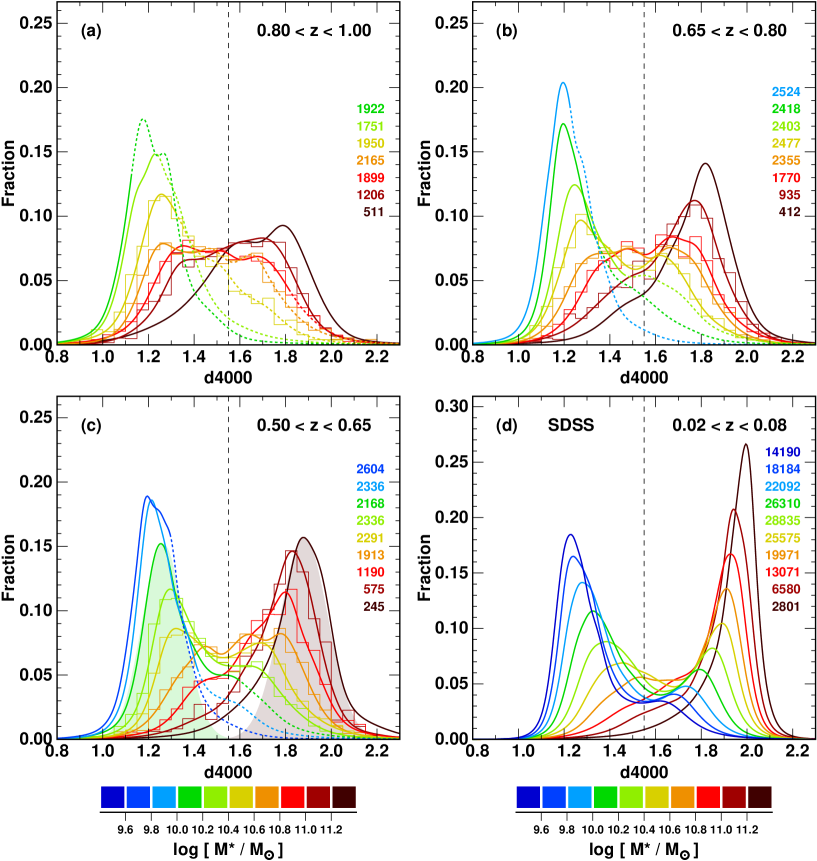
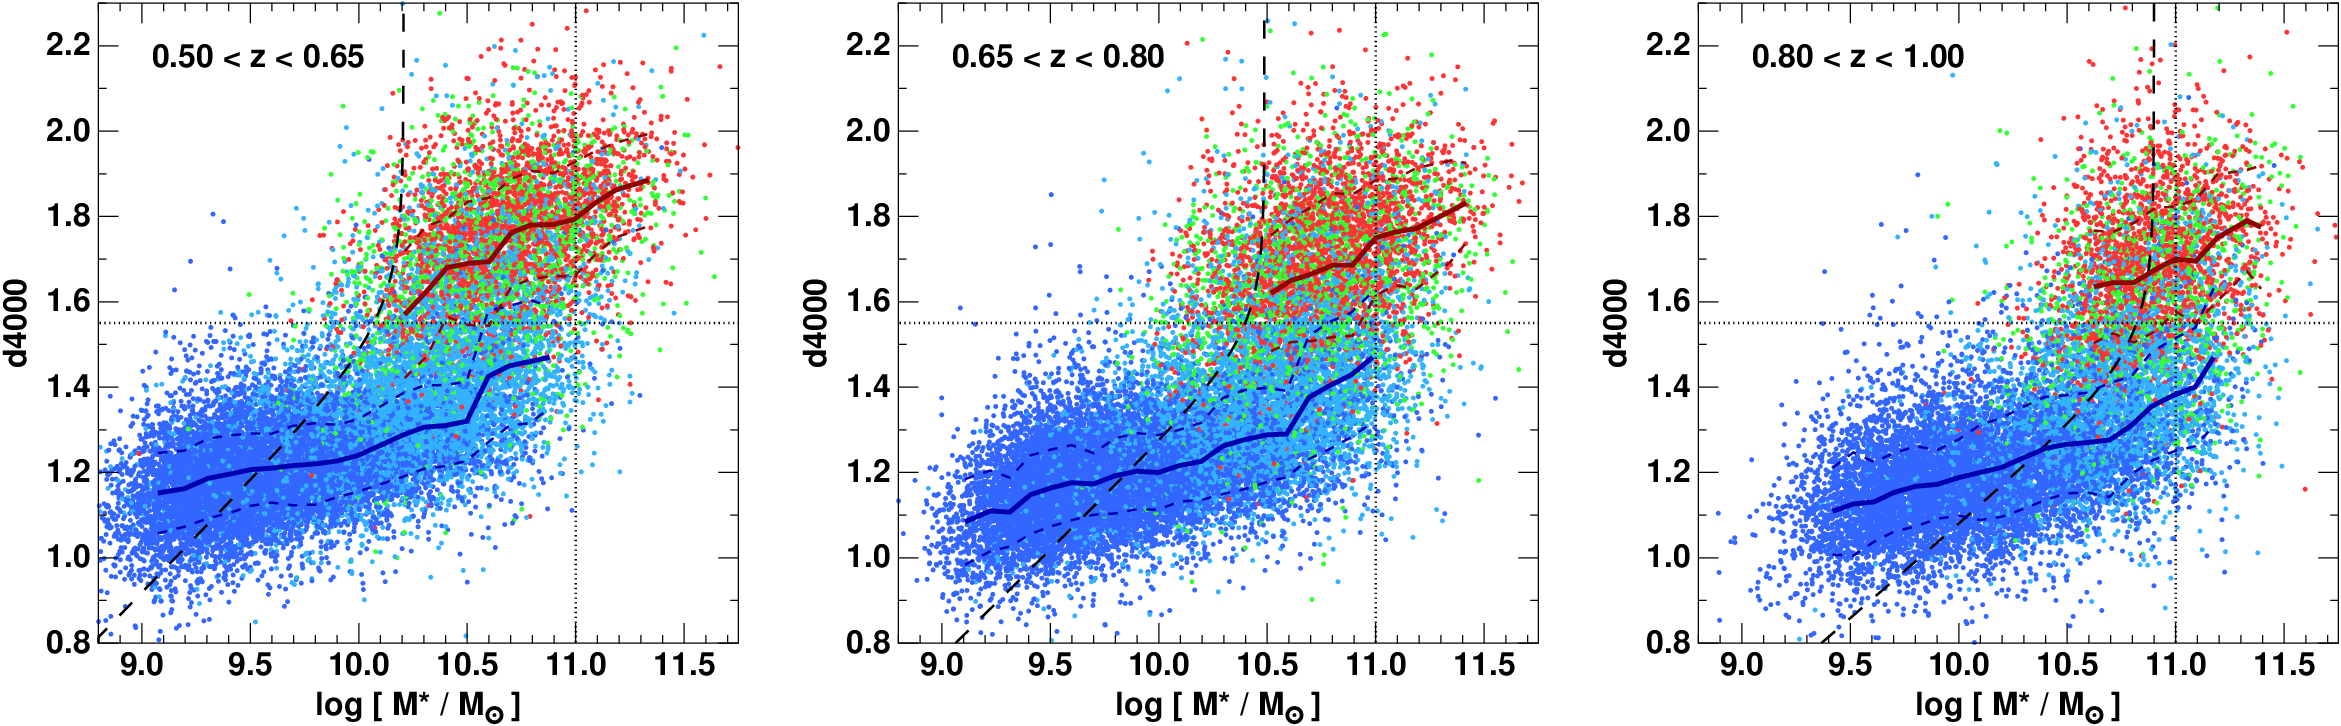
Figure 1 shows the d4000 distributions of galaxies, sliced into 0.2 dex wide bins of stellar mass, in four redshift ranges from to the present day, combining VIPERS and SDSS datasets. The VIPERS survey is split into three redshift ranges 0.8–1.0, 0.65–0.80 and 0.50–0.65 (panels a–c), that span approximately equal periods of time (0.89, 0.81 and 0.97 Gyr respectively). To allow direct comparison with galaxies in the local Universe, Fig. 1d presents the d4000 distributions of galaxies from SDSS-DR7 divided into the same stellar mass bins. The mean redshifts of these four bins are .90, 0.73, 0.58 and 0.06 respectively.
The d4000 distributions, , for each stellar mass bin (coloured curves) are estimated using the adaptive kernel estimator (Silverman, 1986), with each galaxy represented by a Gaussian kernel whose width is proportional to , where is the d4000 value of that galaxy. By matching the level of smoothing to the density of information, the adaptive kernel gives an objective and non-parametric estimator of the underlying distribution of a set of points, optimised to identify sub-structure and bimodality (Pisani, 1993).
For the first three redshift intervals, every VIPERS galaxy is weighted by the TSR and SSR to reflect the probability it was targetted and a reliable redshift obtained, as well as an additional correction to account for stellar mass incompleteness. To account for stellar mass incompleteness in the SDSS sample, each galaxy in Fig. 1d is weighted according to the fraction of the total volume within where it would have . The area under each curve is normalized to unity, so the curves describe the probability distribution of d4000 within that stellar mass bin. The curves become dotted when % of the galaxies at a given d4000, stellar mass and redshift bin are expected to fall below our mag survey limit.
Figure 1 shows the development of bimodality in the d4000 distribution over the last 8 billion years. At (Fig. 1a) there is a robust peak at d marking the blue cloud, but only a weak possible peak at d to mark the red sequence in the highest stellar mass bin. Otherwise the red sequence appears more as a flat shelf in the subsequent stellar mass bins (orange/red curves). Less than 1 Gyr later at (Fig. 1b), the bimodality is now established with a clear peak at d in the highest two stellar mass bins (). The height of the peak for the red sequence continues to rise with time through Figs 1c,d, as does the number of stellar mass bins where this peak is seen. The bimodality gets continually stronger with time, while the valley between the two peaks gets steadily deeper and wider to the present day. This bimodality allows us to robustly separate galaxies into blue cloud and red sequence populations in the VIPERS data by splitting the sample at a d4000 value of 1.55 (dashed line), midway between the two peaks at (Fig. 1c). This appears a reasonable choice also at higher redshifts (Fig. 1a,b), and is the same limit used by Kauffmann et al. (2003a) to separate young and old galaxies in the SDSS survey. At all redshifts, the relative fraction of galaxies in the blue cloud decreases with increasing stellar mass, while that in the red sequence increases. Both blue cloud and red sequence populations systematically shift to larger d4000 values with increasing stellar mass.
At low to intermediate stellar masses (), the d4000 distribution of blue cloud galaxies can be well described by a Gaussian function in all four redshift bins. Where the red sequence shows a strong peak, it also has a Gaussian-like form. Following Baldry et al. (2004) we fit double Gaussians to the d4000 distributions of each stellar mass bin, allowing us to derive the central d4000 values and dispersions for both blue cloud and red sequence populations.
At higher stellar masses (), the blue cloud becomes comparable in strength or sub-dominant to the red sequence, appearing as either a small hump or a flat shelf in the d4000 distribution at d.4–1.5. This feature is sufficiently prominent to allow the central d4000 value of the blue cloud to be fitted, and the low-d4000 side modelled by a Gaussian function, enabling its standard deviation to be estimated. At these stellar masses there is no obvious green valley: the d4000 distribution remains flat or rising through to the red sequence, suggestive of a continuous flow of quenching galaxies leaving the blue cloud and moving across to build up the red sequence. The typical uncertainties in the d4000 values of galaxies at these stellar mass ranges are (0.07) for those in the blue cloud in the () redshift bin, rising slightly to (0.10) in the red sequence, and hence are not sufficiently high to smooth away any green valley.
In the very highest stellar mass bin(s) (), the blue cloud appears no more than an extended low-d4000 tail of the dominant red sequence, and there is no feature enabling the central d4000 value of the blue cloud to be constrained. The blue cloud galaxies appear too rare to allow us to define the d4000 distribution of the blue cloud population in any meaningful way. The upper limit of the blue cloud in each redshift slice is determined as the highest stellar mass bin where a Gaussian function can be fitted to the d4000 distribution at d.
Figure 2 shows the distribution of galaxies in the d4000– plane for the same three redshift ranges. Solid curves show the central d4000 values of the blue and red sequences obtained from the double Gaussian fits as a function of mass, while the dashed lines indicate the 1 widths of each sequence. Galaxies are colour coded according to their location in the NUV ( versus ) colour-colour diagram, applying the same delimiting cuts as Moutard et al. (2016b) to split the NUV diagram into three regions, enabling galaxies to be classified into passive (red points in Fig. 2), star-forming (blue points) and intermediate “green valley” (green points) populations. The advantage of the NUV diagnostic over traditional single-colour classifications (e.g. ) is its ability to effectively disentangle the effects of dust extinction and star-formation activity on galaxy colours (Arnouts et al., 2013). This resolves the issue of dusty-red star-burst galaxies contaminating the red sequence passive population which plagues simpler ()-type classifiers (e.g. Haines et al., 2008; Brammer et al., 2011).
Figure 2 demonstrates the good consistency between the classification of galaxies into blue cloud and red sequence populations from their d4000 value and that using the NUV diagnostic, at all stellar masses and redshifts covered by VIPERS. In the bin, 89% of NUV-selected passive galaxies have d, placing them along the red sequence in the d4000 vs stellar mass diagram, while 92% of NUV-selected star-forming galaxies have d and lie along our blue sequence. Conversely, 95% of blue cloud galaxies with d would be classified as star-forming from their NUV colours. NUV-selected green valley galaxies share a similar distribution in the d4000– plane to passive ones, and 72% have d.
An advantage of d4000 over the NUV diagnostic is that is provides a single continuous variable which can be readily associated to the mean stellar age or star-formation history of a galaxy (Kauffmann et al., 2003a) (although see Arnouts et al., 2013, for how NUV colours can be used to estimate SFRs). This enables us to examine the distribution of d4000 values (or equivalently stellar ages), rather than simply split galaxies into two or three sub-populations. We seek to identify subtle changes in the d4000 values within sub-populations. These could be indicative of ongoing changes within these populations due to the slow decline of star-formation activity in normal blue-cloud galaxies at these redshifts, but also the first stages of quenching that take a galaxy from the blue cloud to the red sequence. It also allows the properties of VIPERS galaxies at to be directly compared with those in the local Universe covered by the SDSS (Kauffmann et al., 2003a, 6).
3.1 Evolution of the blue cloud since
Figure 1 allows the evolution of the blue cloud population to be followed in detail from to the present day by carefully comparing the d4000 distributions at fixed stellar mass through the four redshift bins studied.
At (Fig 1a), the stellar mass bin is the highest one in which the blue cloud can be defined, as a flat shelf that extends over d.3–1.6 containing a significant fraction of the galaxy population in that mass bin. This shelf weakens though the next redshift bin, leaving nothing more than an extended tail of the red sequence by (Fig. 1c). The first feature which could be fitted as a blue cloud population at is the weak shelf at d.4–1.55 in the mass bin. In fact, the d4000 distribution of the 11.0–11.2 stellar mass bin at , most closely matches that in the 10.8–11.0 mass bin at and the 10.6–10.8 mass bin (orange curve) at . The upper stellar mass limit of the blue cloud appears thus to drop by dex from at to by . An examination of Fig. 1d indicates that this mass limit drops by a further 0.2 dex by the present day, the first signature of the blue cloud being the shelf apparent at d.5–1.7 in the 10.6–10.8 mass bin (orange curve).
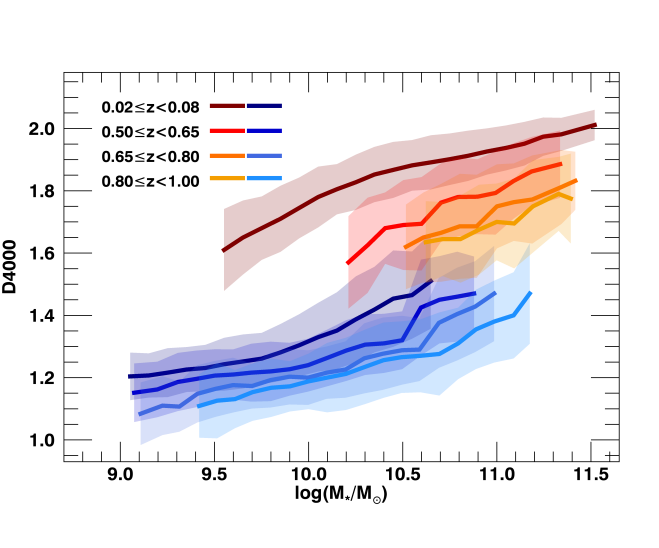
This evolution of the blue cloud is summarized in Figure 3, which plots the central d4000 values and 1 widths of the blue cloud and the red sequence populations as a function of stellar mass for the four redshift bins discussed above. This shows that the location and extent of the blue cloud has evolved smoothly and continuously between and the present day in two ways. First, the upper stellar mass limit of the blue cloud has retreated steadily by dex from at down to 10.7 at , as described above. Second, the whole blue cloud has shifted to higher d4000 values at fixed stellar mass. For , where the blue cloud has a Gaussian-like d4000 distribution, the central d4000 values increase by 0.05–0.07 between the 0.8–1.0 and 0.50–0.65 redshift bins, and another 0.07–0.10 by the present day. This gradual increase in d4000 with time probably reflects a combination of the steady decline in the specific SFRs of the star-forming main sequence between and the present day (Noeske et al., 2007; Behroozi et al., 2013; Lee et al., 2015), and a slow ageing of their stellar populations over the intervening 8 Gyr.
In each redshift bin, the d4000– relation for the blue cloud appears approximately linear with a slope of .12–0.14 (with no sign of evolution), that starts to deviate from the linear approximation by turning upwards towards the high-mass limit. This upturn appears to initiate at ever lower stellar masses as time advances, from at to by the present day.
3.2 Evolution of the red sequence since
The evolution of the red sequence from to the present day shown by Figure 3 can be summarized by two main changes. First, the red sequence as a whole has steadily shifted upwards to larger d4000 values with time, by 0.12 between the 0.8–1.0 and 0.50–0.65 redshift bins, and a further 0.13 by the present day. The d4000– relation appears roughly linear with a slope which does not vary within the VIPERS data, but flattens slightly to for the local SDSS dataset. The d4000– relation for quiescent galaxies in VIPERS and its meaning in terms of the evolution of their stellar populations is beyond the scope of this paper, and is the focus of Siudek et al. (2016).
Second, while the red sequence already appears to be in place at the highest stellar masses at , it can be seen to extend to ever lower stellar masses with time, reaching by the present day. While the lower extents of the red sequence in the VIPERS data are essentially determined by the magnitude limit of the survey, corresponding to at for quiescent galaxies, the red sequence is only partly in place in the 10.2–10.4 stellar mass bin immediately above this limit at , appearing as no more than a shelf at d400.5–1.7 extending out of the dominant blue cloud (Fig. 1c).
Figure 1 shows that the stellar mass bins which first show a Gaussian-like d4000 distribution for the red sequence population are those at the highest stellar masses. Only the bin can be considered as being even marginally in place at 0.80–1.00 (Fig. 1a), while the first two mass bins () appear Gaussian-like at 0.65–0.80 (Fig. 1b), increasing to the top three mass bins () at (Fig. 1c). The finding of strongly-peaked d4000 distributions are indicative of relatively mature red sequence populations at these high stellar masses. Newly quenched galaxies (with d400.6–1.7) arrive onto the sequence at a rate that is much lower than that when the bulk of the sequence was put in place. Instead, the stellar mass ranges where the d4000 distribution appears rather flat over 1.4–1.8, should be those where the red sequence is immature, and being assembled at that redshift through the ongoing quenching of galaxies previously on the blue cloud. This can be seen to be occurring at at (Fig. 1a), at (Fig. 1b) and at (Fig. 1c). In other words, the stellar mass range where the red sequence is in the process of being assembled shifts steadily downwards with time.
3.3 Evolution in the transition mass of galaxies
One way of quantifying the effect of downsizing is to measure the transition mass, , of galaxies as a function of redshift. This is defined as the stellar mass at which the number densities of blue cloud and red sequence galaxies are equal, and their stellar mass functions intersect. It marks the transition from low-mass galaxies that are predominately star-forming to high-mass systems that are mostly quiescent (Kauffmann et al., 2003a).
We estimate for each of our four redshift bins, where the number densities of blue cloud (d) and red sequence (d) galaxies are equal, as shown in Fig. 4 by the solid red circles. The transition mass falls steadily with time within the VIPERS dataset from at to at . The latter is very close to the value found by Kauffmann et al. (2003a) for local galaxies, suggesting little further evolution since . However, this oft-repeated value was only provided as a ballpark figure in Kauffmann et al. (2003a) where many global galaxy properties were seen to change. Applying the exact same threshold of d, we find or for SDSS galaxies with . For comparison, Moustakas et al. (2013) obtain from their SDSS-GALEX sample.
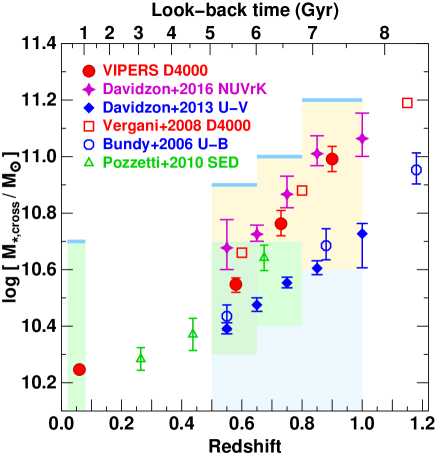
The values from our VIPERS analysis are fully consistent with those produced by Vergani et al. (2008) applying a similar d4000 classification (red squares in Fig. 4) to galaxies in the VIMOS VLT Deep Survey (VVDS; Le Fèvre et al., 2005). Their results indicate that the transition mass keeps increasing steadily beyond , reaching at .
The transition masses presented here are systematically .2–0.3 dex higher than those of Davidzon et al. (2013) who applied a classification to the VIPERS PDR1 sample (blue diamonds). However, when classifying galaxies using the NUV diagnostic of Davidzon et al. (2016), and reperforming the analysis on the same PDR1 sample, the resultant transition masses (magenta stars) and trends now appear rather consistent with those obtained using our d4000 classification. Bundy et al. (2006) split galaxies from the DEEP2 redshift survey by their () colour, obtaining values (open blue octagons) in agreement with those of Davidzon et al. (2013). The lower transition masses obtained when using optical colours to split galaxies could be due to the significant numbers of star-forming galaxies known to contaminate the red sequence due to the effects of dust reddening (Haines et al., 2008; Brammer et al., 2011). This is supported by the obtained using the NUV classifier being in much better agreement with those obtained using the d4000 spectral feature.
To link these transition masses back to the d4000 distributions of Fig. 1, the upper stellar mass limits of the blue cloud determined in § 3.1 are shown in Fig. 4 by blue horizontal lines. The steady fall in at least keeps pace (and may be more rapid) with the retreat of the upper stellar mass limit of the blue cloud since . For the upper reaches of the blue cloud at , the d4000 distribution appears unimodal, with a flat top extending over over d4000 values 1.4–1.8. The stellar mass bins where this flat-topped distribution is seen are shown in Fig. 4 by the yellow shaded regions. Interestingly the lowest stellar mass where this behaviour is seen shows no evidence of evolving, remaining at . This is approximately the characteristic stellar mass obtained for the stellar mass function of star-forming galaxies, and which has been found to remain invariant at over in numerous studies (e.g. Peng et al., 2010; Ilbert et al., 2013; Tomczak et al., 2014; Moutard et al., 2016b). This supports the view that marks the critical scale above which mass quenching becomes widepread (Bell et al., 2007). The stellar mass range where a Green Valley can be discerned as a central dip between relatively distinct red and blue sequences (green shaded region in Fig. 4), can be seen to extend downwards from to ever lower stellar masses with time, paralleling the evolution in and the high-mass limit of the blue cloud.
4 Evolution at the high-mass limit of the blue cloud
The previous section showed how the high-mass limit of the blue cloud has retreated from at to by . How does this retreat (downsizing) translate into an evolution in the actual number density of massive galaxies?
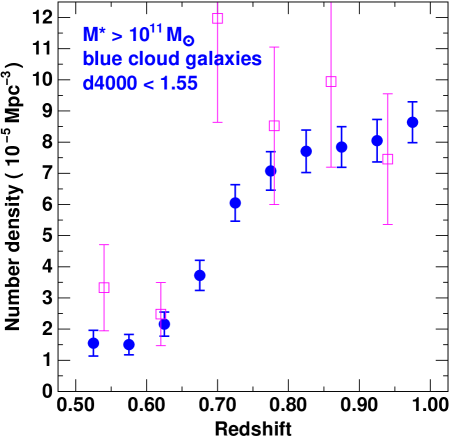
Figure 5 plots the evolution in the number density of massive () blue-cloud galaxies with d (blue points) over . The volume covered by VIPERS is sufficient to contain over 1,000 massive blue-cloud galaxies over this redshift range, allowing it to be finely divided into narrow redshift bins just 0.05 in width. Each galaxy is weighted according to its TSR and SSR to account for spectroscopic incompleteness. Table 1 reports the numbers of VIPERS galaxies in each redshift bin, and the resultant number density of massive blue-cloud galaxies. Based on their observed apparent -band magnitudes, the loss of massive blue-cloud galaxies from the VIPERS survey due to being too faint () should be negligible, at least up to . We also do not expect to miss massive blue cloud galaxies due to the VIPERS , colour selection criteria, as their observed colours remain reasonably far from the colour cuts used.
The number density of massive blue-cloud galaxies remains relatively constant at a value over , before rapidly dropping by a factor 4–5 over a time-scale of just Gyr, to reach a value of just by . We find 342 massive blue-cloud galaxies within our SDSS-DR7 subsample over , corresponding to a number density of . This suggests no further significant decline in the population after .
The sharp decline over is also seen in the zCOSMOS data (magenta squares), taken from the final zCOSMOS-bright sample of about 20 000 galaxies over the 1.7 deg2 COSMOS field and selected simply to have (Lilly et al., 2007, 2009), as measured from the COSMOS HST-ACS F814W images. Each galaxy is weighted to account for local spectroscopic incompleteness in the zCOSMOS survey in the same way as VIPERS. The smaller areal coverage means that cosmic variance effects are much more important for zCOSMOS, and the error bars include the expected bin-to-bin uncertainties due to cosmic variance (20–25% for our redshift bins of width 0.08), assuming the formula of Driver & Robotham (2010). The number densities seen in the three highest redshift bins in the zCOSMOS data are consistent with the high plateau seen in VIPERS, while the two lowest redshift bins show number densities lower, close to those seen in the much larger volume covered by VIPERS. The only inconsistency is seen in the bin centred at , which contains two previously known wall-like structures of connected groups at and (Knobel et al., 2012; Iovino et al., 2016) that dominate the number counts for this bin. The largest source of uncertainty in the evolution seen in the VIPERS data is unlikely to be Poisson noise or cosmic variance, but systematics in the stellar mass estimates. Moustakas et al. (2013) show that changing the stellar population synthesis models or the priors (e.g. the stochastic use of bursts) can affect the level of evolution observed in the number densities of massive star-forming galaxies (their Fig. 20). However, these effects do not appear large enough (.2 dex over ) to fundamentally change our result.
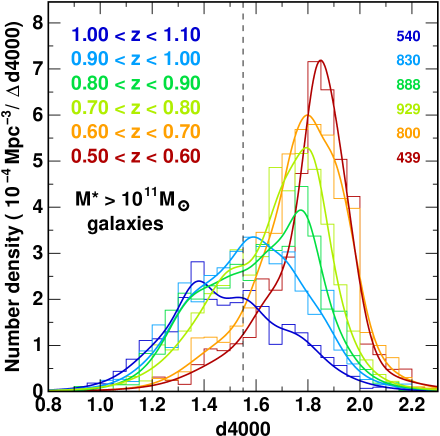
The natural question at this point is where have these massive blue cloud galaxies gone? Assuming that they haven’t lost any stellar mass, they must have left the massive blue cloud sample by becoming quiescent, increasing their d4000 values beyond our limit of 1.55. Figure 6 plots the d4000 distributions of VIPERS galaxies with normalized per unit comoving volume, in six redshift bins spanning
This figure encapsulates the large-scale shift in the d4000 distribution of the most massive galaxies from being a dominant blue cloud population peaking at d at , the peak shifting through intermediate values (d) in the next redshift slice (0.9–1.0), before the red sequence becomes gradually more dominant through to . It is clear that the majority of the massive galaxies which resided on in the blue cloud at have been transferring steadily through the green valley and onto the red sequence by . These results are fully consistent with the systematic shifts in the d4000 distributions of galaxies from the VIMOS VLT Deep Survey (VVDS), with the median d4000 value shifting from 1.37 at to 1.69 at (Fig. 1 of Vergani et al., 2008).
| Redshift | |||
|---|---|---|---|
| range | () | ||
| 0.50–0.55 | 17 | 1.55 | 0.42 |
| 0.55–0.60 | 24 | 1.50 | 0.33 |
| 0.60–0.65 | 34 | 2.16 | 0.39 |
| 0.65–0.70 | 67 | 3.72 | 0.49 |
| 0.70–0.75 | 121 | 6.05 | 0.59 |
| 0.75–0.80 | 146 | 7.08 | 0.63 |
| 0.80–0.85 | 161 | 7.71 | 0.67 |
| 0.85–0.90 | 176 | 7.84 | 0.67 |
| 0.90–0.95 | 175 | 8.05 | 0.70 |
| 0.95–1.00 | 202 | 8.64 | 0.65 |
| 1.00–1.05 | 177 | 8.08 | 0.71 |
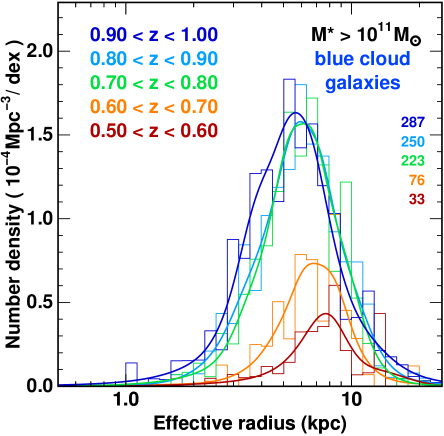
Figure 7 presents the size distributions of these massive blue cloud (, d) galaxies, for five redshift bins covering , where size is quantified by the half-light radius, , in kpc. The axis indicates the number density of galaxies per unit comoving volume per dex in , so that vertical shifts between curves reflect changes in the number density of blue cloud galaxies of a fixed size. The highest three redshift bins are all consistent with a log-normal distribution of mean kpc and 0.18 dex width, with no apparent changes in the number density at fixed size. The mean proper effective radius increases with time for the lowest two redshift bins, as the overall number density sharply drops, to kpc for . The likelihood that a massive galaxy that was on the blue cloud at and is still there at , can be seen to depend strongly on its size. While the number density of massive blue cloud galaxies more compact than average ( kpc) drops by a factor ten between and , it falls by just a factor three for those galaxies larger than average. At the same time, the mean size of those massive galaxies which must have left the blue cloud between and is still 5.5 kpc.
In contrast we find little evidence for evolution in the Sérsic-index distribution of massive blue-cloud galaxies over this period, or a preferential quenching of these galaxies based on their structure. The distribution extends over (i.e. spanning both classical exponential and de Vaucouleurs profiles), peaking at intermediate values () at all redshifts covered by VIPERS (0.5–1.0).
5 Evolution of the size-mass relation
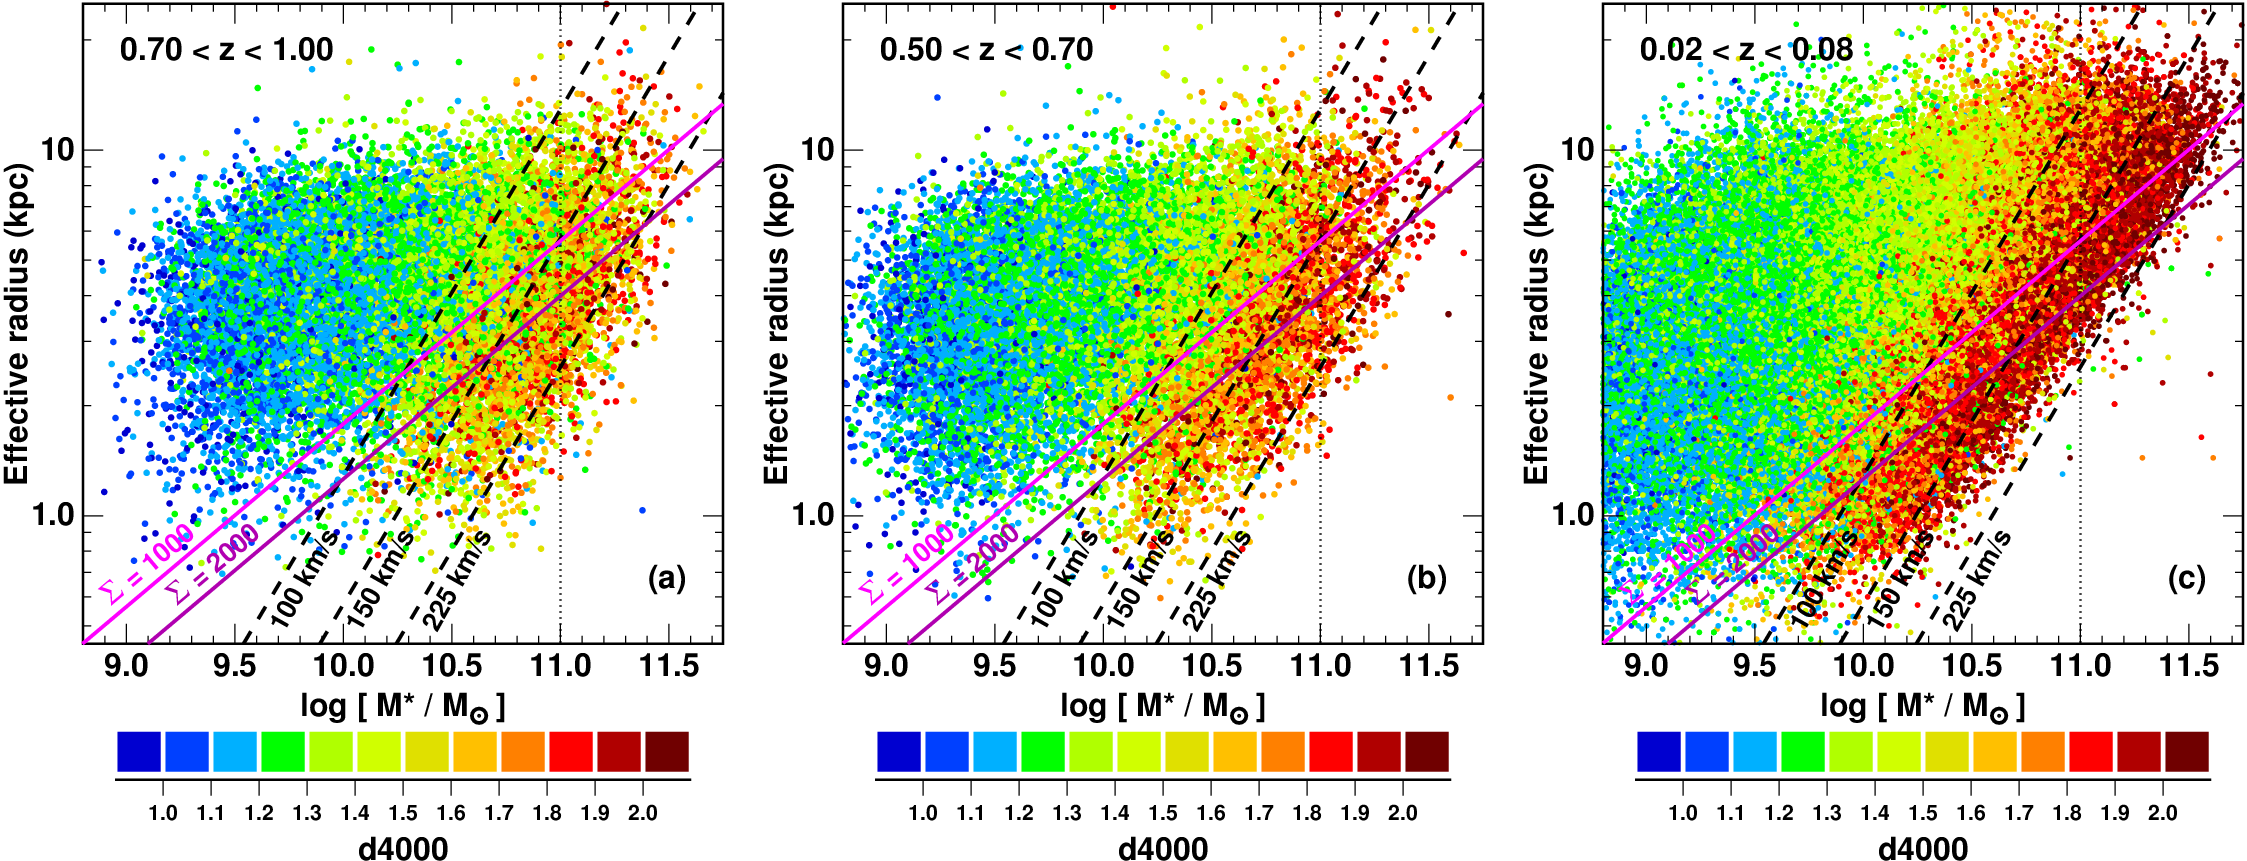
We examine the evolution of the size-mass relation of galaxies from to the present day in Figure 8, plotting effective radius versus stellar mass for three redshift intervals: 0.7–1.0, 0.5–0.7 (VIPERS) and 0.02–0.08 (SDSS). The VIPERS data are now split into just two redshift bins and , which encapsulate the two phases of evolution seen in Fig. 5, and span similar look-back times (1.41 and 1.26 Gyr respectively). Galaxies are colour-coded by their d4000 values, enabling the dependence of a galaxy’s star-formation history on its size and stellar mass to be separated objectively, without a priori imposing a specific combination of the two properties (e.g. , ). Black diagonal dashed lines mark constant inferred velocity dispersions of 100, 150 and 225 km s-1 assuming the relation of Franx et al. (2008), where the constant was chosen so that the of the SDSS galaxies matched the measured velocity dispersions (see also Bezanson et al., 2011).
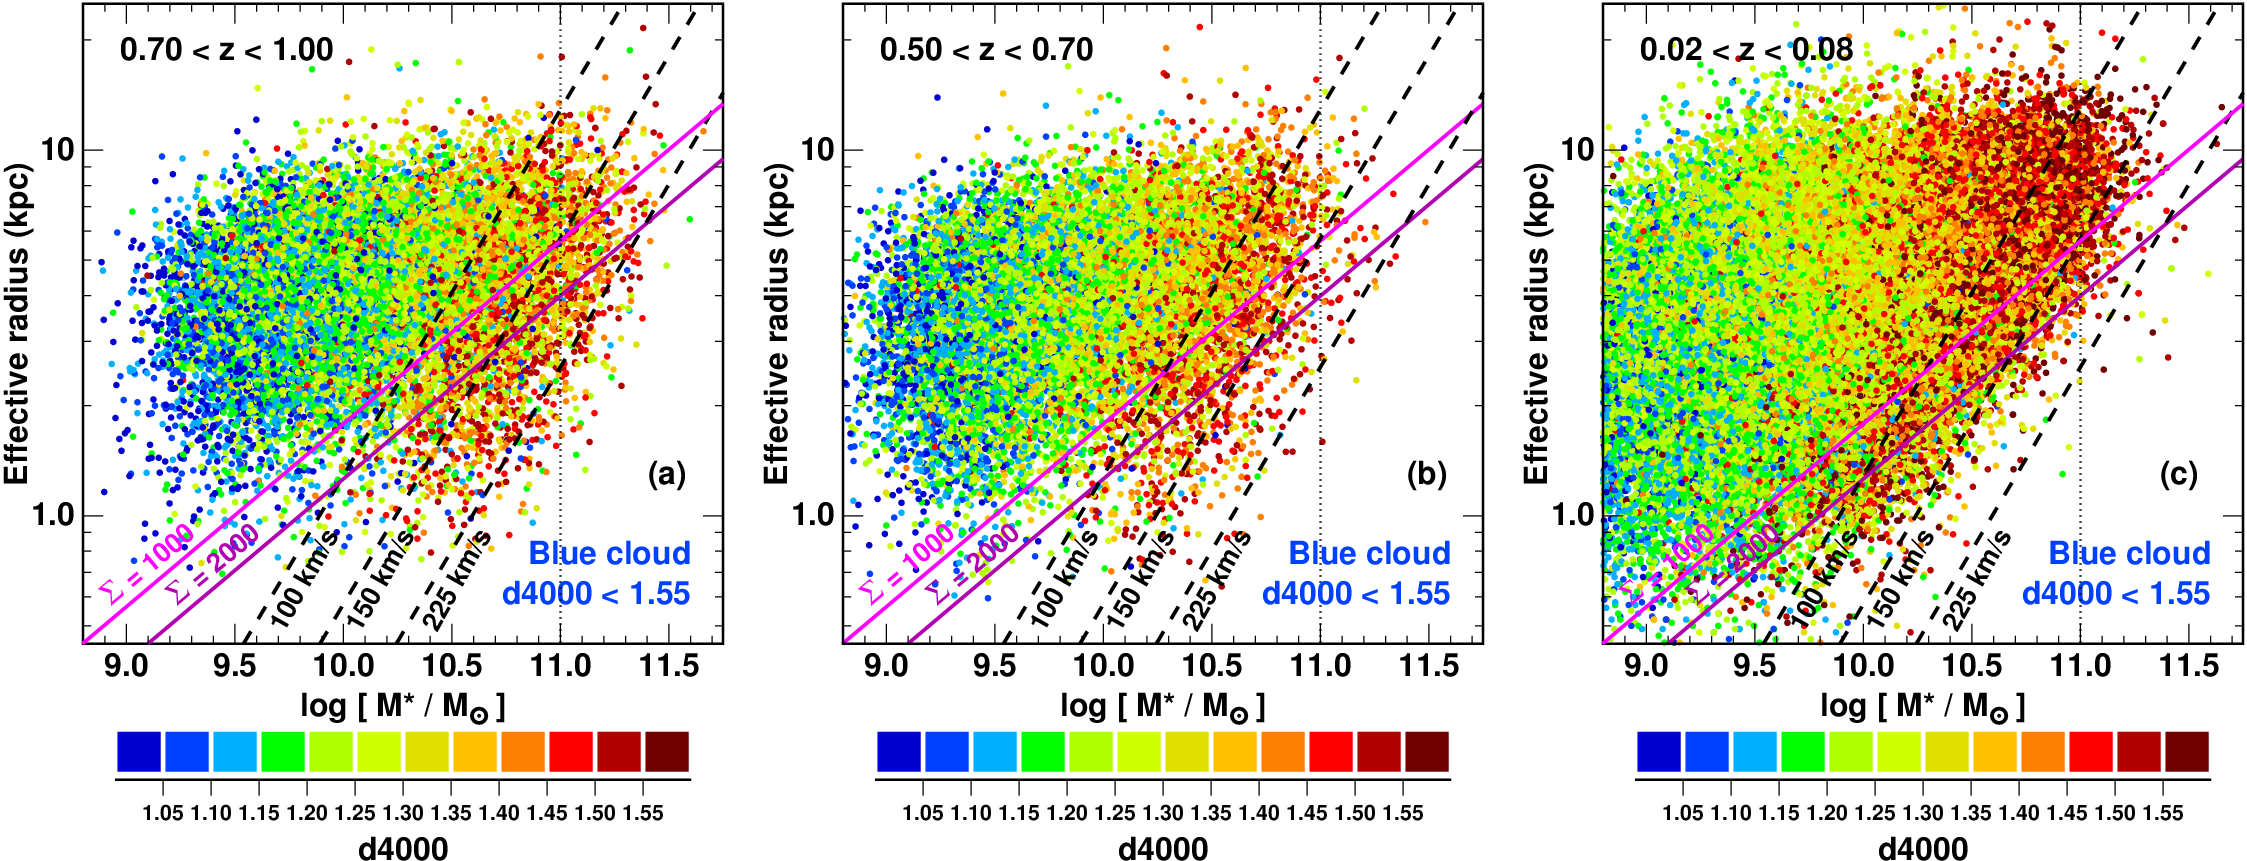
Figure 8c shows galaxies from the SDSS-DR7 sample. Only galaxies identified as centrals by Yang et al. (2012) are plotted. Hence any trends should be due to the effects of mass quenching rather than environmental quenching due to the galaxy becoming a satellite within a more massive halo. Most notable is that the galaxy population is very sharply bounded on three sides of the size-mass plot. There is an upper size limit of 10 kpc, rising slowly with stellar mass to 20 kpc by , and a lower boundary at kpc (which may be a resolution limit). Most importantly, there is a very sharp upper stellar mass limit, which runs diagonally through the size-mass plot, approximately along the line of constant velocity dispersion at km s-1. The empty region to the lower-right of this line is termed the Zone-of-Exclusion by Cappellari et al. (2013), as the region of the size-mass relation where none of their 260 local early-type galaxies from the ATLAS3D survey are found. Taylor et al. (2010) warn that the absence of compact high-mass systems is at least partly due to SDSS spectroscopic target selection criteria, which exclude objects on the basis of having bright fiber magnitudes () to avoid cross-talk between the fibers. The SDSS should however be % complete for compact, massive galaxies at . It is also immediately apparent that the star-formation history of galaxies is also fundamentally defined by this same diagonal limit, with all the old, quiescent galaxies (d; red points) bounded within a narrow diagonal strip, some 0.5 dex wide in , that runs parallel to this fundamental high-mass limit for galaxies. The quiescent galaxy population is essentially bounded within the two diagonal lines marking inferred velocity dispersions of 100 km s-1 and 225 km s-1, while virtually all galaxies to the left of these lines have young stellar populations with d (green, blue points).
The VIPERS data allow the evolution of these sharp fundamental boundaries and behaviours to be followed back in time to in comparable detail. The most notable aspect of Fig. 8 is the lack of difference in the basic distributions of galaxies in the size-mass plane at the three epochs. There are well-defined upper and lower size limits of kpc and 10 kpc in all three panels. The upper mass bound continues to run parallel to the lines of constant velocity dispersion, and the oldest galaxies with the highest d4000 values (red points) remain limited to a narrow diagonal band along this edge. While in the SDSS data, the most massive galaxies appear essentially confined just within the 225 km s-1 line, in the VIPERS data, some galaxies do appear to extend just beyond it (by up to 0.1–0.2 dex), suggesting a marginal shift since . The fundamental result of Figure 8 appears that the basic properties of the size-mass relation were already in place at , and have only evolved gradually to the present day.
While the location of these massive quiescent galaxies in the size-mass plane appears to evolve little, moving to higher redshifts their d4000 values do appear to decline, indicative of younger stellar populations. The evolution of these massive, passive galaxies is the focus of Gargiulo et al. (2016), while in this work we explore what causes a star-forming galaxy at the upper end of the blue cloud to leave it and become quiescent. However in Fig. 8, the upper-limits of the blue cloud and galaxies in the first stages of transformation are hidden, submerged under the dominant population of old, already quiescent galaxies.
To gain insights into what processes push a galaxy from the upper end of the blue cloud, and fundamentally limit the ability of galaxies to continue to grow through star formation, Figure 9 displays the size-mass relation for the same three redshift intervals as Fig. 8, but plotting only blue cloud galaxies (d). Galaxies are colour-coded according to their d4000 as before, but the scale has been changed so that orange/red points mark galaxies on the high-d4000 wing of the blue cloud (), and hence most likely to be those about to leave it. The d4000 values of blue cloud galaxies increase steadily with stellar mass, from (blue points) at the lowest masses to (red points) at the high-mass end. For stellar masses above the dependence of d4000 appears tilted, such that smaller galaxies have slightly higher d4000 values at fixed stellar mass than larger ones. Moreover, the high-mass upper limit of the blue cloud appears tilted, such that it appears to run parallel to the diagonal black dashed lines marking constant inferred velocity dispersion . For comparison, lines of constant stellar mass (, dotted line) and stellar mass density (magenta lines) run at significant angles with respect to the upper-limit of the blue cloud.
There is evidence of evolution between the two highest redshift bins. At (Fig. 9a) the upper limit of the blue cloud is approximately demarcated by the final black dashed line at 25 km s-1, including a significant population with . By (Fig. 9b), the upper limit of the blue cloud has now retreated to the middle black dashed line marking km s-1, with just a smattering of points beyond it. This upper bound does not show signs of further movement to the present day (Fig. 9c), with blue cloud galaxies from the SDSS-DR7 extending up to the 50 km s-1 dashed line, beyond which the number density drops abruptly.
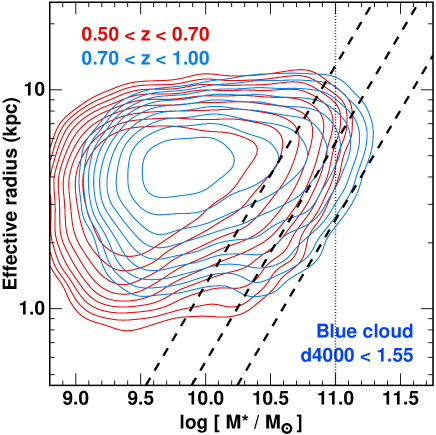
Figure 10 directly compares the bivariate number density distribution of galaxies in the two highest redshift bins, weighting each galaxy to account for spectroscopic and stellar mass incompleteness, and accounting for the different comoving volumes sampled by VIPERS over the two redshift ranges. The high-mass limit of the blue cloud at (blue contours) can be seen to be shifted 0.17 dex to higher stellar masses with respect to that at (red contours) at fixed effective radius. The iso-density contours along this high-mass edge are parallel to the dashed lines for both redshift bins, confirming that the upper limit of the blue cloud runs along lines of constant .
At (Fig. 9a), the galaxies on the high-d4000 wing of the blue cloud (; orange/red points) appear mostly confined to the diagonal band between the first and third black dashed lines ( km s-1). These are the galaxies that are most likely to be in the process of leaving the blue cloud and become the next arrivals onto the red sequence. A comparison to Fig. 8c shows that this band roughly corresponds to the region enclosing massive passive galaxies at the present day. Figure 9b indicates that by , most of those galaxies with km s-1 must indeed have left the blue cloud, while those with km s-1 now represent the high-mass limit of the blue cloud, and having d4000 values , are those most likely to leave in the near future. This changes little to the present day (Fig. 9c).
The extension of galaxies to the left of the km s-1 lines at large radii ( kpc) may well be due to aperture effects, as the 3′′ diameter (3.5 kpc at ) SDSS fibres sample only inside for such large galaxies. The presence of a bulge component and steep negative metallicity gradients within disc galaxies could contribute to produce significant biases in the d4000 measurements of these objects (Kewley et al., 2005; González Delgado et al., 2015). At the redshift range of the VIPERS survey, the 1′′ slit-width corresponds to 6.1 kpc at and 8.0 kpc at , and the slits are designed to be long enough to extend beyond the galaxy in both directions in order to measure the sky background (unlike fibres). We thus do not expect to be significantly affected by metallicity gradients, and note that they should act in the opposite direction to the observed trend.
The band of blue cloud galaxies with the highest d4000 values (1.40–1.55), while tilted, extends over the full range of effective radii seen among the whole blue cloud population. The retreat in the blue cloud revealed in Figure 10 appears to be systematic, with no significant dependence on effective radius. This suggests that the size distribution of galaxies leaving the blue cloud is similar to that of galaxies still in it.
5.1 Changes in galaxy structure within the blue cloud
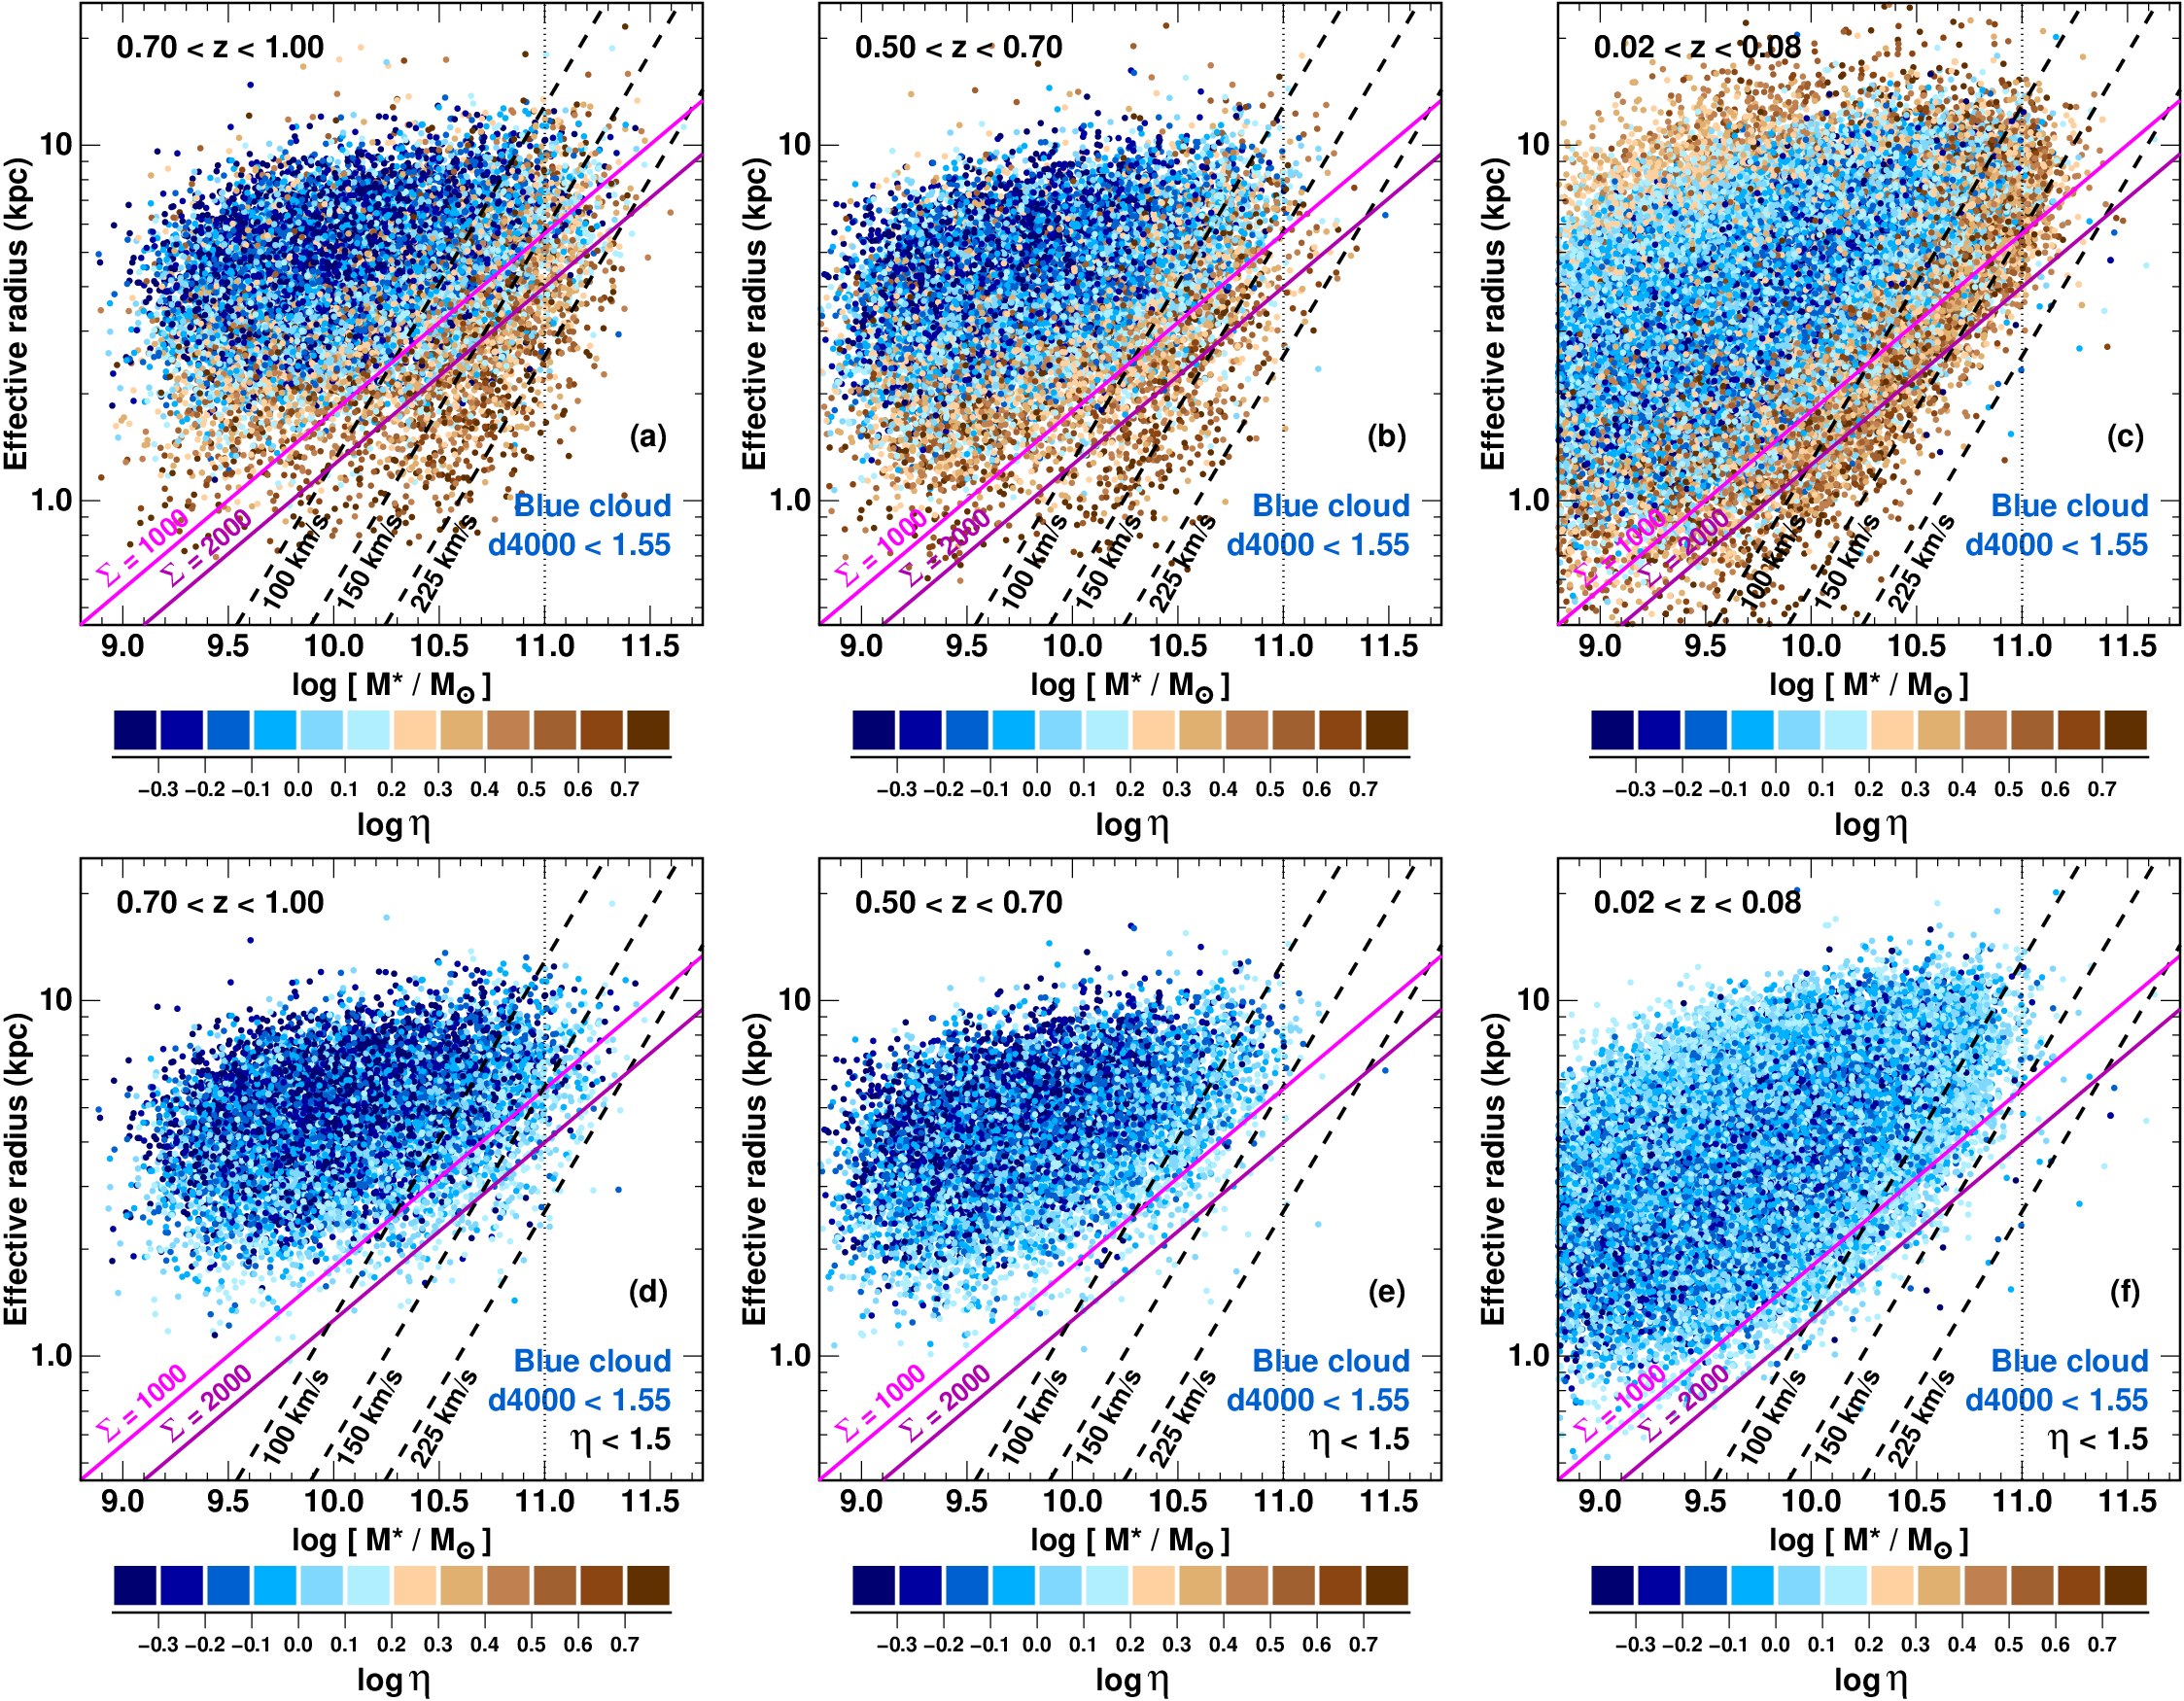
The upper panels of Fig. 11 plot the size-mass relation of blue cloud galaxies (d) for three different redshift intervals as before, but now colour code galaxies according to their Sérsic index rather than d4000 value. The first two panels show that the concentrations () of blue cloud galaxies within VIPERS () vary systematically with size and stellar mass in two different directions. First, for galaxies to the left of the km s-1 line, their Sérsic index increases steadily as galaxies become smaller, from for larger galaxies with kpc, to for the most compact systems with kpc, and little additional dependence on stellar mass. Second, the Sérsic index also increases with stellar mass, with the km s-1 line dividing low-mass galaxies with late-type morphologies (, blue points) and high-mass systems with increasingly concentrated profiles, reaching (brown points) for those galaxies on the high-mass edge of the blue cloud. This latter trend parallels that seen for d4000 in Fig. 9a,b for the same blue cloud galaxies. As galaxies in the blue cloud start to approach its high- edge, both their internal structures and their ability to continue forming stars are being systematically affected, even as they remain within the blue cloud. In contrast, no such change in d4000 values is seen for the compact low-mass systems to parallel the increase in .
The lower panels show that these same trends are apparent, even when considering only secure late-type galaxies with . That is, the late-type galaxies with the highest ( km s-1), also have the highest Sérsic indices (, light blue points), while those to the left of the 100 km s-1 line have (darker blue points). Even the first phases of structural transformation are aligned with an increase in . The regions where late-type galaxies on the blue cloud can appear on the size-mass plane can be seen to have shrunk considerably in Figs. 11d,e from the upper panels where no morphological selection was made. First, all of the most compact galaxies ( kpc) have disappeared, reducing the overal radial (vertical) extent of the blue cloud at all stellar masses. More importantly, the high-mass limit appears to have retreated by 0.10–0.15 dex. Only 30% of km s-1 blue cloud galaxies at have . This shrinkage demonstrates the comprehensive nature of the physical processes that are driving the structural changes in blue cloud galaxies in certain regions of the size-mass plane.
As before, the SDSS-DR7 dataset can be used to see whether the patterns apparent in the size-mass relation of blue cloud galaxies at remain to the present day. Figure 11c confirms that blue cloud galaxies are confined to the same regions of the size-mass plane as VIPERS galaxies at . The high-mass limit of the blue cloud at can be seen to essentially run along the line marking km s-1. The connections between morphology () and location of a galaxy in the size-mass plane are also persistent. Low-mass galaxies with km s-1 are virtually all late types (; blue points), except for the most compact ( kpc) and large systems ( kpc) which show higher concentrations. As blue cloud galaxies push through the km s-1 line, and approach the high-mass boundary of the blue cloud population, their structures become increasingly concentrated (; brown points). Repeating this analysis using the bulge-to-total ratios of Simard et al. (2011) produces the same global trends (Appendix B). Galaxies on the leading edge of the blue cloud have significant bulge components (), while lower mass systems are uniformly disc-dominated (B/T0.25).
5.2 The link to central stellar mass surface density
Numerous studies have indicated that the central stellar mass surface density is a much better predictor of star formation activity within a galaxy than stellar mass (Cheung et al., 2012; Fang et al., 2013; Barro et al., 2015; Whitaker et al., 2016), while the presence of a prominant bulge appears a necessary condition for galaxies to quench star formation on galaxy-wide scales (Bell, 2008; Bell et al., 2012). However, while the results presented above showing the clear trends connecting the changes in d4000 and with the location of galaxies in the size-mass relation, and in particular along lines of constant or , it is not clear how these trends relate to .
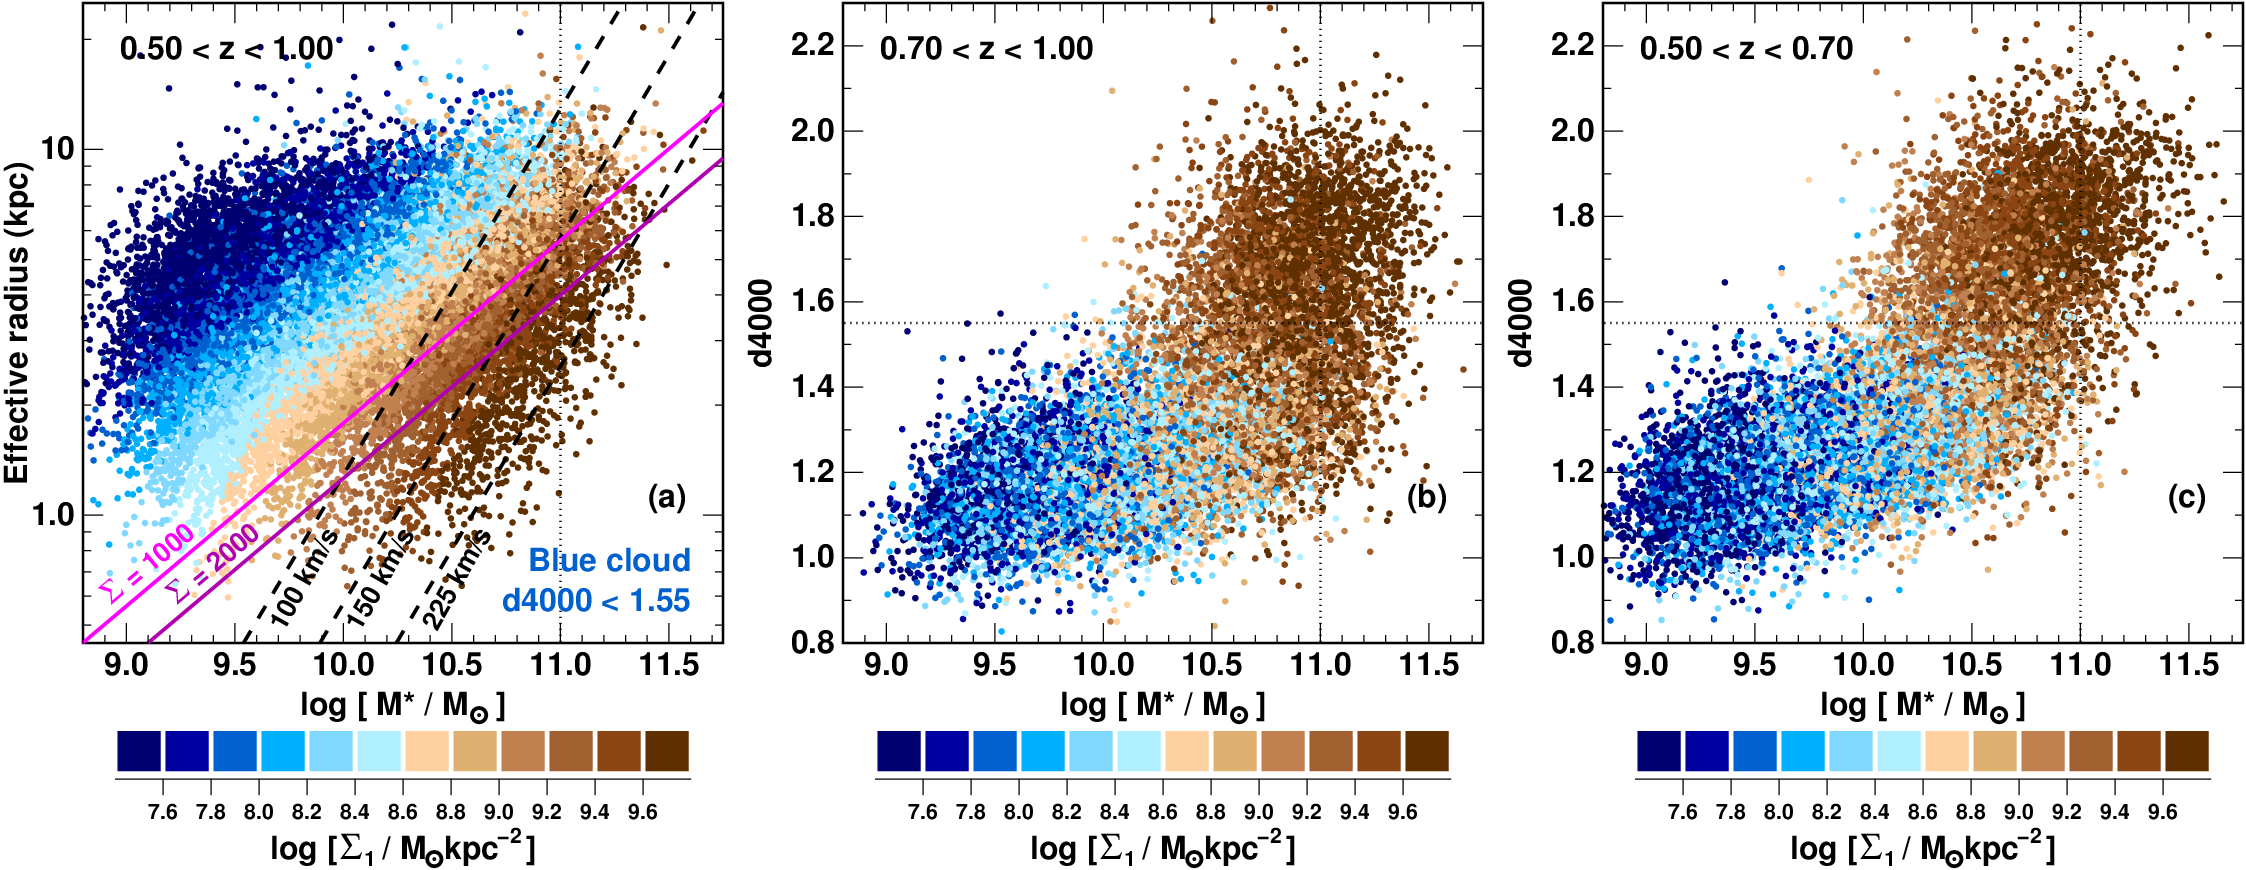
Figure 12a shows the variation of central stellar mass surface density within the size-mass plot for blue cloud galaxies, over the combined VIPERS redshift range . The values can be well described as a function of just size and mass, with little scatter in among galaxies of a fixed size and mass. Overall, the values increase from the top-left of the plot (large low-mass galaxies) towards the lower-right (compact massive galaxies), as expected for a density measure. The iso- contours notably change slope through the plot, from being parallel to lines of constant (magenta lines) for (blue points), then gradually becoming steeper to become parallel to lines of constant (black dashed lines) for the highest central stellar mass densities (; darker brown points). As a result, the upper limit of the blue cloud could also be defined as a threshold in , as well as (or ).
Figures 12b,c show the distributions of VIPERS galaxies in the d4000– plane for two redshift intervals (0.7–1.0 and 0.5–0.7), colour coded by . In both panels, quiescent galaxies (d) uniformly have high central stellar mass densities, (brown points). In the transition mass regime () where both blue cloud and red sequence galaxies co-exist, those galaxies with low central stellar mass densities (blue points) are confined within the blue cloud. Within the blue cloud population increases linearly with stellar mass, albeit with significant scatter, such that all massive blue cloud galaxies with also have high central stellar mass densities (brown points), for both redshift intervals. Thus, the massive blue cloud galaxy population () at , many of which must leave the blue cloud and be quenched by (Fig. 5), already have the high values that are seemingly a prerequisite for this quenching process to commence.
6 Discussion
In Fig. 1 we plotted the d4000 distributions of galaxies as a function of mass and redshift, revealing how the bimodal d4000 distribution seen among galaxies in the local Universe has developed over the last eight billion years. This enabled us to track the evolution of the location and extent of both the blue cloud and red sequence in the d4000– plane (Fig. 3). This revealed how the high-mass limit of the blue cloud has retreated significantly, from at to by the present day. This retreat is what Cowie et al. (1996) was referring to when coining the term “downsizing”.
This observed downsizing of star formation can be understood by considering the recent findings that the SFR– relation of the main sequence of star-forming galaxies is not linear () throughout as previously thought (Elbaz et al., 2007; Peng et al., 2010), but shows a clear flattening at high masses (Whitaker et al., 2014; Lee et al., 2015; Tomczak et al., 2016). The curvature of the SFR– relation increases with time, while the stellar masses at which the sequence starts to bend downwards decreases with time (Lee et al., 2015). This means that the rate of decline in the SFRs of blue-cloud galaxies is much greater at the highest masses (), than at lower masses () where the relation is still close to linear.
We model the mass growth and sSFR evolution of star-forming galaxies for a range of final stellar masses (see Appendix C for details), assuming that blue cloud galaxies assemble their stellar mass through star formation, at rates following the evolving SFR– relation of star-forming galaxies from Tomczak et al. (2016), and taking into account stellar mass loss following Moster et al. (2013). This shows how the overall star-formation history and stellar mass assembly (through star formation) is accelerated in the most massive blue-cloud galaxies relative to their lower-mass counterparts (Fig. 15). Notably, the stellar mass at which the sSFR of blue-cloud galaxies is equal to , where is the age of the Universe at redshift , is very close to the high-mass limits of the blue cloud that we obtain over . At , the stellar mass of blue-cloud galaxies where is , falling to by (Fig. 15b). As d4000 can be considered a proxy for sSFR, it seems plausible that as the sSFRs of massive blue cloud galaxies decline steadily with time, their d4000 values correspondingly rise and eventually cross our d threshold, taking them out of our blue cloud sample.
6.1 The decline of massive star-forming galaxies and the rise of massive passive galaxies
Figure 5 showed how the number density of massive blue-cloud galaxies (, d) has rapidly dropped five-fold between and . This result appears surprising given the consensus view that the SMF of star-forming galaxies has not changed signficantly since (Borch et al., 2006; Bell et al., 2007; Vergani et al., 2008; Pozzetti et al., 2010). But these papers were based on surveys covering deg2 and so strongly affected by cosmic variance. More recently, Moustakas et al. (2013) again found no evolution over in the SMF of star-forming galaxies at intermediate masses (109.5–10M⊙) within the 5.5 deg2 PRIMUS survey. However, they also find that the number density of the most massive star-forming galaxies () declines by 55% since . Brammer et al. (2011) observe an overall decline in the number densities of UVJ-selected star-forming galaxies between and . Davidzon et al. (2013) find that the most massive () blue galaxies completely disappear at , suggesting that at such extremely high masses, star formation already turns off at earlier epochs ().
Figure 6 shows that these massive blue-cloud galaxies are being steadily quenched throughout this period (), transferring from the blue cloud to the red sequence. Using the same VIPERS PDR-2 sample, Gargiulo et al. (2016) find that the overall number density of massive passive galaxies (, NUV-selected to be passive following Davidzon et al., 2016), has increased steadily from at to at . This increase is fully consistent with the drop in number density among the massive blue-cloud population from to over the same period. Gargiulo et al. (2016) show that this is also true if star-forming galaxies are selected using the NUV diagnostic of Davidzon et al. (2016), rather than d4000 as done here. Gargiulo et al. (2016) split the massive passive galaxies (MPGs) according to their mean stellar mass density , and find that while the densest MPGs (; below the lower magenta line in Fig. 8) show essentially no evolution in number density, the least dense MPGs (; above the higher magenta line in Fig. 8) show very rapid evolution in their number density, that can explain most of the global increase in number density of MPGs.
6.2 The size-mass relation
Figure 8 showed that the distribution of galaxies in the size-mass plane were confined to specific regions, with effective radii in the range 1–10 kpc, and an upper mass limit that runs diagonally in the plots approximately along lines of constant or inferred velocity dispersion. These fundamental boundaries evolve little over , except that at fixed mass, high-mass systems may be slightly more compact than seen in the local Universe.
In all three redshift bins, old, red sequence galaxies with d lie within a narrow, diagonal band that runs parallel to this fundamental high-mass limit for galaxies. The dependence of d4000 appears tilted, so that galaxies with the same d4000 value lie along lines of constant velocity dispersion (dashed lines). This observation parallels that seen for local early-type galaxies within the ATLAS3D survey, where their colours, H absorption-line strengths, molecular gas fractions, SSP-equivalent stellar ages, metallicities and abundances all follow trends of constant velocity dispersion in the size-mass plane (Cappellari et al., 2013; McDermid et al., 2015). Shetty & Cappellari (2015) find similar trends for SSP-equivalent stellar ages following constant velocity dispersion for a sample of 154 galaxies at , comprising both star-forming and quiescent galaxies.
Whitaker et al. (2016) examined the relationships between specific SFR (sSFR) (based on stacking analysis of Spitzer/MIPS 24m photometry) and the location of galaxies within the size-mass plane for galaxies from the CANDELS and 3D-HST surveys. They obtain very similar trends to those seen in Fig. 8, with specific-SFR decreasing with stellar mass, such that galaxies along lines of constant have the same specific-SFRs. These trends are seen in all three of their redshift bins: 0.5–1.0, 1.0–1.5 and 1.5–2.5. They also repeat the analysis considering only UVJ-selected star-forming galaxies, and for their sample find the same trends as we obtain in Figure 9, with the specific-SFRs falling for galaxies along the leading edge of the blue cloud, and larger galaxies having higher sSFRs than smaller ones at fixed stellar mass. There are some hints of these trends even within their redshift bin.
Using SDSS-DR7 data, Omand et al. (2014) examined how the fraction of quiescent (defined using a cut in sSFR) galaxies () depends on size () and stellar mass. For central galaxies, they find a sharp transition from mostly active galaxies to mostly quiescent, with contours of constant that approximatly follow . Among the actively star-forming galaxies, the sSFRs show a significant dependence on effective radius at fixed stellar mass, being 0.2 dex lower for more compact systems, at least at intermediate masses ().
Lilly & Carollo (2016) caution us not to overinterpret the trends shown in Fig. 8, or those of Omand et al. (2014), as proof that changes in galaxy structure must be associated with the quenching process. They point out the simple observation that star-forming galaxies have undergone continual size-growth at fixed instantaneous stellar mass of the form since (Buitrago et al., 2008; Newman et al., 2012; Mosleh et al., 2012; Patel et al., 2013; van der Wel et al., 2014). Hence galaxies that formed their stars earlier (have larger d4000 values) will naturally be smaller than those of the same stellar mass whose stars formed later, without any need for structure-dependent quenching processes. Likewise, quiescent galaxies at any epoch will be smaller than star-forming galaxies of the same stellar mass, since the star-forming progenitors of the quiescent galaxies would have been much smaller at the epoch at which they ceased forming stars. Lilly & Carollo (2016) consider a toy model for the growth of star-forming galaxies in which the radial distribution of new stars being formed within the galaxy always follows an exponential profile with a scale length , while their specific SFRs evolve to match observations of the main star-forming sequence. This naturally ensures that ongoing star formation is always more radially extended within these star-forming galaxies than the integrated radial distribution of stars formed previously (as observed; Nelson et al., 2016), resulting in inside-out growth. For the most massive star-forming galaxies () central dense concentrations (“bulges”) are produced with pc-2, due to the stars formed at early epochs when the galaxy was much smaller. Steep positive radial gradients in sSFR are also naturally produced, similar to those seen in massive star-forming galaxies at (Tacchella et al., 2015).
Lilly & Carollo (2016) show that a quenching mechanism that terminates star formation in the model galaxies with a likelihood that depends solely on their stellar mass (and not structure), can result in iso-quenched fraction contours among central galaxies that lie along lines of constant surface density , closely reproducing the observations of Omand et al. (2014). Omand et al. (2014) also show that such trends can also be produced by a quenching mechanism that depends only on , but which also reduces the galaxy size by a factor two. Finally, the sizes and masses of already quenched galaxies can change significantly over time due to dry mergers and repeated minor merging (van Dokkum et al., 2010; Cappellari et al., 2013), further altering the patterns of within the size-mass plane. All the above processes can thus artificially create or alter apparent trends seen in Figure 8 or in over the size-mass plane.
We thus argue that to determine the relevance of galaxy structure in terminating star formation in blue-cloud galaxies, requires focusing on the fundamental trends and boundaries within which these blue-cloud galaxies are able to continue growing through star formation. Such an approach should not be affected by progenitor effects or size growth through dry/minor mergers. Thus the observations that the leading edge of the blue cloud in the size-mass plane in Figs. 9–12 is tilted to run parallel to lines of constant or , rather than vertical, implies that the fundamental limit beyond which galaxies cannot continue to form stars depends significantly on galaxy size. Larger galaxies can continue to form stars to higher stellar masses than smaller galaxies. Fig. 10 shows how this limit retreats systematically to lower stellar masses by 0.17 dex from the bin to that at . This appears concrete evidence of downsizing of star-formation at these redshifts. Similarly, Moustakas et al. (2013) find that the stellar mass at fixed cumulative number density of the most massive star-forming galaxies decreases by dex since , while Brammer et al. (2011) find a dex decrease in between and .
As blue cloud galaxies approach the high-mass limit, their d4000 values start to increase, pushing them to the high-d4000 wing of the blue cloud (). These are the galaxies most likely to be quenched in the near future and subsequently join the red sequence. These quenching galaxies lie within a diagonal band (0.6–0.7 dex wide), between the two black dashed lines in Fig. 9a ( km s-1), which can be considered the quenching zone for galaxies at these redshifts. The fact that this quenching zone runs diagonally, combined with the 1 dex range in effective radii of blue-cloud galaxies, means that the range of stellar masses where galaxies are being quenched (0.1–3) is much wider than the width of the quenching zone at fixed size.
Figures 11 and 12 showed that the structures of blue-cloud galaxies in the quenching zone have already changed, having Sérsic indices and high central stellar mass densities kpc2. Bulge growth is necessary for these galaxies to reach the high-mass limit of the blue cloud and be quenched. Lang et al. (2014) show a marked increase in the Sérsic index and B/T ratios of star-forming galaxies with stellar masses above at (in both redshift bins examined). They also find that the fraction of quenched galaxies correlates strongly with bulge mass, but not with disc mass. At fixed disc mass, the fraction of quenched galaxies increases rapidly with B/T ratio.
It is particularly interesting that the quenching zone of blue-cloud galaxies lies precisely along the same size-mass relation as quiescent galaxies in the local Universe (Fig. 8c). Given that these galaxies have already changed their structures and have dense centres, these quenching galaxies do not seem to have to evolve much further beyond terminating their star formation. These objects would seem to be likely progenitors for today’s S0 population.
Given the well-known tight correlation between the mass of the central supermassive black hole (M∙) and the velocity dispersion of its host galaxy (e.g. Kormendy & Ho, 2013), the alignment of the quenching zone and the edge of the blue cloud with lines of constant is suggestive of AGN feedback playing a role in the quenching process. van den Bosch (2016) obtain a best-fit relation between black hole mass M∙, stellar mass and size of the form , or M. As galaxies traverse the quenching zone, their central black hole mass should thus increase by two orders of magnitude, from from M on the 100 km s-1 line to M as they reach the 225 km s-1 line in our size-mass figures. Heckman & Best (2014) show that radiative-mode AGN with accretion rates % of the Eddington limit are preferentially hosted in blue-cloud (d) galaxies with high stellar mass densities, exactly describing the galaxies in our quenching zone.
Figures 12b,c show that high central stellar mass densities ( kpc2) appear necessary for a galaxy to have become quiescent (d), as seen previously (Bell, 2008; Bell et al., 2012). This threshold in also happens to run parallel to the high-mass edge of the blue-cloud population, and lines of constant d4000 values. This supports the idea that quenching of star formation is linked to the presence of a dense central stellar mass concentration in a galaxy. It is not that surprising that the most massive star-forming galaxies have different structures to their lower mass counterparts. Using the evolving SFR– relations of Tomczak et al. (2016) as before to predict the star-formation histories of blue-cloud galaxies as a function of stellar mass, the most massive blue-cloud galaxies in VIPERS () should have had their SFR peak at (Fig. 15), before it declines by a factor 3–5 by . Thus, the bulk of their stellar mass would have been assembled when the galaxy was much smaller and denser, and naturally forms a bulge-like central mass concentration (without considering any possible compaction process). Blue cloud galaxies which have at , only had their peak SFR at .0–1.2, and so the bulk of star formation has occured when the galaxy is close to its present size, meaning no significant change in structure.
At higher redshifts, Tacchella et al. (2015) show that massive star-forming galaxies at (with SFRs0–300 M⊙, placing them on the main star-forming sequence at that redshift) already host fully grown bulges with the high central stellar mass densities of present day quiescent ellipticals, and show evidence of inside-out quenching. They suggest that the high central stellar mass densities of these massive star-forming galaxies arise through gas-rich dissipative processes such as violent disc instabilities leading to a compaction of the gas disc (Dekel & Burkert, 2014; Zolotov et al., 2015; Tacchella et al., 2016). This central mass concentration (bulge) could then induce morphological or gravitational quenching by stabilizing the remaining gas disc against fragmentation into molecular clouds (Martig et al., 2009), quenching star formation from the inside out, resulting in central dips in the star-formation efficiency or rings of star formation in the outer disc (Genzel et al., 2014).
The relative narrowness of the quenching zone and the associated global changes in structure are indicative of a rather rigid, uniform transformation that affects most, if not all, star-forming galaxies once they enter the zone, and indeed before, given the rather tight SFR– relation of star-forming galaxies with intrinsic scatter of 0.2–0.3 dex (Noeske et al., 2007; Speagle et al., 2014; Lee et al., 2015). This uniformity would appear at odds with the merger-driven quasar feedback model of Hopkins et al. (2006), whereby massive star-forming galaxies are quenched as the result of infrequent, extreme events. This uniformity could instead suggest that galaxies follow rather well-defined evolutionary tracks, and that quenching is less a specific event, but a normal continuation of their late-stage evolution (Gladders et al., 2013; Abramson et al., 2016).
7 Summary
We have used the full VIPERS redshift survey in combination with SDSS-DR7 to explore the relationships between star-formation history (as quantified using d4000), stellar mass and galaxy structure, and establish the limiting galaxy properties beyond which they are unable to continue growing via star formation, and how these limits evolve from to the present day.
-
•
We measured the d4000 distributions of galaxies in narrow bins of stellar mass, in order to establish the locations and dispersions of both the blue cloud and red sequence populations as a function of stellar mass and redshift. We identify the upper limit of the blue cloud as the first stellar mass bin where no appreciable peak or feature is visible in the d4000 distribution at values indicative of young stellar populations (d). The high-mass limit is seen to retreat steadily with time from at to in galaxies from the SDSS-DR7.
-
•
The comoving number density of massive blue cloud galaxies (, d) is also seen to decline by a factor 4–5 between to within the VIPERS dataset. These massive galaxies are being quenched in large numbers at and contribute to the rapid increase in the number densities of massive passive galaxies seen to occur over this period.
-
•
The star-formation histories of galaxies are seen to depend on their size () as well as stellar mass, with larger galaxies having younger stellar populations than smaller ones at fixed stellar mass. Galaxies with the same d4000 values align themselves along lines of constant or in the size-mass plane.
-
•
The upper limit of the blue cloud population also runs along a line of constant . As star-forming galaxies grow and approach this limit, their d4000 values start to increase, pushing them towards the Green Valley. Their structures are also showing systematic changes, with Sérsic indices more characteristic of early-type galaxies, and high central stellar mass densities kpc-2. These trends are seen both for VIPERS galaxies at and SDSS galaxies in the local Universe.
-
•
The massive star-forming galaxies that are leaving the blue cloud at , already lie along size-mass relation of present day quiescent galaxies, and seemingly have to do relatively little beyond stopping forming stars to become today’s S0s.
Acknowledgements.
We acknowledge the crucial contribution of the ESO staff for the management of service observations. In particular, we are deeply grateful to M. Hilker for his constant help and support of this program. Italian participation to VIPERS has been funded by INAF through PRIN 2008, 2010, and 2014 programs. LG and BRG acknowledge support from the European Research Council through grant n. 291521. OLF acknowledges support from the European Research Council through grant n. 268107. JAP acknowledges support of the European Research Council through grant n. 67093. RT acknowledges financial support from the European Research Council through grant n. 202686. AP, KM, JK and MS have been supported by the National Science Centre (grants UMO-2012/07/B/ST9/04425 and UMO-2013/09/D/ST9/04030). EB, FM and LM acknowledge the support from grants ASI-INAF I/023/12/0 and PRIN MIUR 2010-2011. LM also acknowledges financial support from PRIN INAF 2012. TM and SA acknowledge financial support from the ANR Spin(e) through the french grant ANR-13-BS05-0005. SDLT and MP acknowledge the support of the OCEVU Labex (ANR-11-LABX-0060) and the A*MIDEX project (ANR-11-IDEX-0001-02) funded by the ”Investissements d’Avenir” French government program managed by the ANR. and the Programme National Galaxies et Cosmologie (PNCG). Research conducted within the scope of the HECOLS International Associated Laboratory, supported in part by the Polish NCN grant DEC-2013/08/M/ST9/00664.References
- Abazajian et al. (2009) Abazajian K. N., Adelman-McCarthy J. K., Agueros M. A., 2009, ApJS, 182, 543
- Abramson et al. (2016) Abramson L. E., Gladders M. D., Dressler A. et al. 2016, preprint (arXiv:1604.00016)
- Arnouts et al. (2007) Arnouts S., Walcher C. J., Le Fèvre O. et al. 2007, A&A, 476, 137
- Arnouts et al. (2013) Arnouts S., Le Floc’h E., Chevallard J. et al. 2013, A&A, 558, 67
- Baldry et al. (2004) Baldry I. K., Glazebrook K., Brinkmann J. et al. 2004, ApJ, 600, 681
- Ball et al. (2007) Ball N. M., Loveday J., Brunner R. J., 2007, MNRAS, 383, 907
- Balogh et al. (1999) Balogh M. L., Morris S. L., Yee H. K. C., Carlberg R. G., Ellingson E. 1999, ApJ, 527, 54
- Baldry et al. (2004) Baldry I. K., Glazebrook K., Brinkmann J. et al. 2004, ApJ, 600, 681
- Barro et al. (2015) Barro G., Faber S. M., Koo D. C. et al. 2015, preprint (arXiv:1509.00469)
- Behroozi et al. (2013) Behroozi P. S., Wechsler R. J., Conroy C. 2013, ApJ, 770, 57
- Bell (2008) Bell E. F. 2008, ApJ, 682, 355
- Bell et al. (2007) Bell E. F., Zheng X. Z., Papovich C., Borch A., Wolf C., Meisenheimer K. 2007, ApJ, 663, 834
- Bell et al. (2012) Bell E. F., van der Wel A., Papovich C., et al. 2012, ApJ, 753, 167
- Bezanson et al. (2011) Bezanson R., van Dokkum P., Franx M. et al. 2011, ApJL, 737, 31
- Blanton & Moustakas (2009) Blanton M. R., Moustakas J., 2009, ARA&A, 47, 159
- Bolzonella et al. (2000) Bolzonella M., Miralles J. M., Pelló R. 2000, A&A, 363, 476
- Bolzonella et al. (2010) Bolzonella M., Kovac K., Pozzetti L. 2010, A&A, 524, 76
- Borch et al. (2006) Borch A., Meisenheimer K., Bell E. F., 2006, A&A, 453, 869
- Bouchet et al. (1985) Bouchet P., Lequeux J., Maurice E., Prevot L., Prevot-Burnichon M. L. 1985, A&A, 149, 330
- Bower et al. (2006) Bower R. G., Benson A. J., Malbon R. et al. 2006, MNRAS, 370, 645
- Brammer et al. (2011) Brammer G. B., Whitaker K. E., van Dokkum P. G., et al. 2011, ApJ, 739, 24
- Brinchmann et al. (2004) Brinchmann J., Charlot S., White S. D. M. et al. 2004, MNRAS, 351, 1151
- Bruce et al. (2014) Bruce V. A., Dunlop J. S., McLure R. J. et al. 2014, MNRAS, 444, 1001
- Bruzual & Charlot (2003) Bruzual G., Charlot S., 2003, MNRAS, 344, 1000
- Buitrago et al. (2008) Buitrago F., Trujillo I., Conselice C. J. et al. 2008, ApJL, 687, 61
- Bundy et al. (2006) Bundy K., Ellis R. S., Conselise C. J. et al. 2006, ApJ, 651, 120
- Calzetti et al. (2000) Calzetti D., Armus L., Bohlin R. C. et al. 2000, ApJ, 533, 682
- Cappellari et al. (2013) Cappellari M., McDermid R. M., Alatalo K., et al. 2013, MNRAS, 432, 1862
- Chabrier (2003) Chabrier G. 2003, PASP, 115, 763
- Cheung et al. (2012) Cheung E., Faber S. M., Koo D. C. et al. 2012, ApJ, 760, 131
- Conroy et al. (2015) Conroy C., van Dokkum P. G., Kravtsov A. 2015, ApJ, 803, 77
- Cowie et al. (1996) Cowie L. L., Songaila A., Hu E. M., Cohen J. G., 1996, AJ, 112, 839
- Croton et al. (2006) Croton D., Springel V., White S. D. M. et al. 2006, MNRAS, 365, 11
- Davidzon et al. (2013) Davidzon I., Bolzonella M., Coupon J. et al. 2013, A&A, 558, 23
- Davidzon et al. (2016) Davidzon I., Cucciati O., Bolzonella et al. 2016, A&A, 586, 23
- Dekel & Birnboim (2006) Dekel A., Birnboim Y. 2006, MNRAS, 368, 2
- Dekel et al. (2009) Dekel A., Birnboim Y., Engel G. et al. 2009, Nature, 457, 451
- Dekel & Burkert (2014) Dekel A., Burkert A., 2014, MNRAS, 438, 1870
- Di Matteo et al. (2005) Di Matteo T., Springel V., Hernquist L. 2005, Nature, 433, 604
- Driver et al. (2006) Driver S. P., Allen P. D., Graham A. W., et al. 2006, MNRAS, 368, 414
- Driver & Robotham (2010) Driver S. P., Robotham A. S. G., 2010, MNRAS, 407, 2131
- Elbaz et al. (2007) Elbaz D., Daddi E., Le Borgne D. et al. 2007, A&A, 468, 33
- Fang et al. (2013) Fang J. J., Faber S. M., Koo D. C., Dekel A. 2013, ApJ, 776, 63
- Fontanot et al. (2009) Fontanot F., De Lucia G., Monaco P., Somerville R. S., Santini P. 2009, MNRAS, 397, 1776
- Franx et al. (2008) Franx M., van Dokkum P., Förster Schreiber N. M., Wuyts S., Labbé I., Toft S. 2008, ApJ, 688, 770
- Fritz et al. (2014) Fritz A., Scodeggio M., Ilbert O., et al. 2014, A&A, 563, 92
- Gabor et al. (2010) Gabor J. M., Davé R., Finlator K., Oppenheimer B. D., 2010, MNRAS, 407, 749
- Gallazzi et al. (2005) Gallazzi A., Charlot S., Brinchmann J., White S. D. M., Tremonti C. A., 2005, MNRAS,362, 41
- Garilli et al. (2014) Garilli B., Guzzo L., Scodeggio M., et al. 2014, A&A, 562, 23
- Gargiulo et al. (2016) Gargiulo A., et al. 2016, A&A submitted, (arXiv:1611.07047)
- Genzel et al. (2014) Genzel R., Forster Schreiber N. M., Lang P., et al. 2014, ApJ, 785, 75
- Gladders et al. (2013) Gladders M. D., Oemler A., Dressler A. et al. 2013, ApJ, 770, 64
- González Delgado et al. (2015) González Delgado R. M., García-Benito R., Pérez E. et al. 2015, A&A, 581, 103
- Gorgas et al. (1999) Gorgas J., Cardiel N., Pedraz S., González J. J., 1999, A&AS, 139, 29
- Guzzo et al. (2014) Guzzo L., Scodeggio M., Garilli B., et al. 2014, A&A, 566, 108
- Haines et al. (2006) Haines C. P., La Barbera F., Mercurio A., Merluzzi P., Busarello G., 2006, ApJL, 647, 21
- Haines et al. (2007) Haines C. P., Gargiulo A., La Barbera F., 2007, MNRAS, 381, 7
- Haines et al. (2008) Haines C. P., Gargiulo A., Merluzzi P., 2008, MNRAS, 385, 1201
- Heckman & Best (2014) Heckman T. M., Best P. N. 2014, 2014, ARA&A, 52, 589
- Hopkins et al. (2006) Hopkins P. F., Hernquist L., Cox T. J., et al. 2006, ApJ, 163, 1
- Hubble (1926) Hubble E. P. 1926, ApJ, 64, 321
- Ilbert et al. (2010) Ilbert O., Salvato M., Le Floc’h E. et al. 1010, ApJ, 709, 644
- Ilbert et al. (2013) Ilbert O., McCracken H. J., Le Fèvre O. et al. 1013, A&A, 556, 55
- Iovino et al. (2016) Iovino A., Petropoulou V., Scodeggio M. et al. 2016, A&A, 592, 78
- Jarvis et al. (2013) Jarvis M. J., Bonfield D. G., Bruce V. A. et al. 2013, MNRAS, 428, 1281
- Kauffmann et al. (2003a) Kauffmann G., Heckman T. M., White S. D. M. et al. 2003a, MNRAS, 341, 54
- Kauffmann et al. (2003b) Kauffmann G., Heckman T. M., White S. D. M. et al. 2003b, MNRAS, 341, 33
- Kauffmann et al. (20036) Kauffmann G., Heckman T. M., de Lucia G. et al. 2006, MNRAS, 367, 1394
- Kennedy et al. (2016) Kennedy R., Bamford S. P., H aussler B. et al. 2016, MNRAS, 460, 3458
- Kereš et al. (2005) Kereš D., Katz N., Weinberg D. H., Davé R. 2005, MNRAS, 363, 2
- Kewley et al. (2005) Kewley L. J., Jansen R. A., Geller M. J. 2005, PASP, 117, 227
- Knobel et al. (2012) Knobel C., Lilly S. J., Iovino A., et al. 2012, ApJ, 753, 121
- Kormendy & Bender (2012) Kormendy J., Bender R. 2012, ApJS, 198, 2
- Kormendy & Ho (2013) Kormendy J., Ho. L. C. 2013, ARA&A, 51, 511
- Krywult et al. (2016) Krywult J., Tasca L. A. M., Pollo A., et al. 2016, A&A submitted (arXiv:1605.05502)
- Lang et al. (2014) Lang P., Wuyts S., Somerville R. S., et al. 2014, ApJ, 788, 11
- Lee et al. (2015) Lee N., Sanders D. B., Casey C. M., et al. 2015, ApJ, 801, 80
- Le Fèvre et al. (2005) Le Fèvre O., Vettolani G., Garilli B., et al. 2005, A&A, 439, 845
- Lilly et al. (2007) Lilly S. J., Le Fèvre O., Renzini A., et al. 2007, ApJS, 172, 70
- Lilly et al. (2009) Lilly S. J., Le Brun V., Maier C., et al. 2009, ApJS, 184, 218
- Lilly & Carollo (2016) Lilly S. J., Carollo C. M., 2016, ApJ submitted, (arXiv:1604.06459)
- Martig et al. (2009) Martig M., Bournaud F., Teyssier R., Dekel A., 2009, ApJ, 707, 250
- McDermid et al. (2015) McDermid R. M., Alatalo K., Blitz L., et al. 2015, MNRAS, 448, 3484
- Mosleh et al. (2012) Mosleh M., Williams R. J., Franx M. et al. 2012, ApJL, 756, 12
- Moster et al. (2013) Moster B. P., Naab T., White S. D. M. 2013, MNRAS, 428, 3121
- Moustakas et al. (2013) Moustakas J., Coil A. L., Aird J., et al. 2013, ApJ, 767, 50
- Moutard et al. (2016a) Moutard T., Arnouts S., Ilbert O., et al. 2016a, A&A, 590, 102
- Moutard et al. (2016b) Moutard T., Arnouts S., Ilbert O., et al. 2016b, A&A, 590, 103
- Muzzin et al. (2013) Muzzin A., Marchesini D., Stefanon M. et al. 2013, 777, 18
- Nelson et al. (2016) Nelson E. J., van Dokkum P. G., Förster Schreiber N. M., et al. 2016, ApJ, 828, 27
- Newman et al. (2012) Newman A. B., Ellis R. S., Bundy K., Treu T. 2012, ApJ, 746, 162
- Noeske et al. (2007) Noeske K. G., Weiner B. J., Faber S. M. et al. 2007, ApJL, 660, 43
- Omand et al. (2014) Omand C. M. B., Balogh M. L., Poggianti B. M. 2014, MNRAS, 440, 843
- Patel et al. (2013) Patel S. G., van Dokkum P. G.., Franx M., et al. 2013, ApJ, 766, 15
- Peng et al. (2010) Peng Y.-J., Lilly S. J., Kovac K., et al. 2010, ApJ, 721, 193
- Pisani (1993) Pisani A., 1993, MNRAS, 265, 706
- Pozzetti et al. (2010) Pozzetti L., Bolzonella M., Zucca E., et al. 2010, A&A, 523, 13
- Prevot et al. (1984) Prevot M. L., Lequeux J., Prevot L., Maurice E., Rocca-Volmerange B., 1984, A&A, 132, 389
- Salim et al. (2007) Salim S., Rich M. R., Charlot S., et al. 2007, ApJS, 173, 267
- Sandage (1961) Sandage A. 1961, The Hubble Atlas of Galaxies (Washington DC: Carnegie Institution of Washington)
- Scodeggio et al. (2009) Scodeggio M., Franzetti P., Garilli B., Le Fèvre O., Guzzo L., 2009, The Messenger, 135, 13
- Scodeggio et al. (2016) Scodeggio M., Guzzo L., Garilli B., et al. 2016, A&A submitted, (arXiv:1611.07048)
- Shetty & Cappellari (2015) Shetty S., Cappellari M., 2015, MNRAS, 454, 1332
- Silverman (1986) Silverman B. W., 1986, Density Estimation for Statistics and Data Analysis (London: Chapman & Hall)
- Simard et al. (2011) Simard L., Mendel J. T., Patton D. R., Ellison S. L., McConnachie A. W. 2011, ApJS, 196, 11
- Siudek et al. (2016) Siudek M., Malek K., Scodeggio M., et al. 2016, A&A submitted, (arXiv:1605.05503)
- Speagle et al. (2014) Speagle J. S., Steinhardt C. L., Capak P. L., Silverman J. D. 2014, ApJS, 214, 15
- Strateva et al. (2001) Strateva I., Ivezić Ž., Knapp G. R., et al. 2001, AJ, 122, 1861
- Tacchella et al. (2015) Tacchella S., Carollo C. M., Renzini A., et al. 2015, Sci, 348, 314
- Tacchella et al. (2016) Tacchella S., Dekel A., Carollo C. M., et al. 2016, MNRAS, 457, 2790
- Taylor et al. (2010) Taylor E. N., Franx M., Glazebrook K. et al. 2010, ApJ, 720, 723
- Taylor et al. (2015) Taylor E. N., Hopkins A. M., Baldry I. K. et al. 2015, MNRAS, 446, 2144
- Thomas et al. (2005) Thomas D., Maraston C., Bender R., Mendes de Oliviera C. 2005, ApJ, 621, 673
- Tomczak et al. (2014) Tomczak A. R., Quadri R. F., Tran K.-V. H. et al. 2014, ApJ, 783, 85
- Tomczak et al. (2016) Tomczak A. R., Quadri R. F., Tran K.-V. H. et al. 2016, ApJ, 817, 118
- van der Wel et al. (2014) van der Wel A., Franx M., van Dokkum P. G., et al. 2014, ApJ, 788, 28
- van den Bosch (2016) van den Bosch R. C. E. 2016, ApJ, 831, 134
- van Dokkum et al. (2010) van Dokkum P. G., Whitaker K. E., Brammer G., et al. 2010, ApJ, 709, 1018
- Vergani et al. (2008) Vergani D., Scodeggio M., Pozzetti L., et al. 2008, A&A, 487, 89
- Wake et al. (2012) Wake D. A., van Dokkum P. G., Franx M., 2012, ApJL, 751, 44
- Whitaker et al. (2014) Whitaker K., Franx M., Leja J., et al. 2014, ApJ, 795, 104
- Whitaker et al. (2016) Whitaker K., Bezanson R., van Dokkum P. G. et al. 2016, preprint (arXiv:1607.03107)
- Wuyts et al. (2011) Wuyts S., Förster Schreiber N. M., van der Wel A., et al. 2011, ApJ, 742, 96
- Wyder et al. (2007) Wyder T. K., Martin D. C., Schiminovich D. et al. 2007, ApJS, 173, 293
- Yang et al. (2012) Yang X., Mo H. J., van den Bosch F. C., Zhang Y., Han J., 2012, ApJ, 752, 41
- Zolotov et al. (2015) Zolotov A., Dekel A., Mandelker N. et al. 2015, MNRAS, 450, 2327
Appendix A Stellar mass completeness limits
For magnitude-limited surveys such as VIPERS, the minimum stellar mass to which a galaxy would be targetted depends on both its redshift and its stellar mass-to-light ratio . The mass-to-light ratio depends on the star-formation history of the galaxy, and so should be a simple function of d4000. To derive for all redshifts, we first estimate it for specific redshifts in intervals of 0.05 in (e.g. 0.50, 0.55, 0.60). We then take all VIPERS galaxies with redshifts within 0.025 of and determine the -band magnitude it would have if placed at . The limiting stellar mass () of that galaxy at is then the mass it would have if its apparent magnitude were equal to the limiting magnitude of the survey () given by . Figure 13 plots the resulting distribution of for galaxies placed at as a function of their d4000 value (light blue points). We measure the median value of these galaxies as a function of d4000 (blue curve), and the scatter (dashed curves). The appears to be relatively independent of d4000 for large values () indicative of quiescent galaxies, but falls exponentially with decreasing d4000 for d. We model this by fitting the blue curve with a double power law (red curve), that is fixed to become asympotically constant at large d4000 values. This process is repeated for the other (black curves). These power laws represent the 50% completeness limits of VIPERS. By shifting each curve up and down and measuring how the fraction of points below the curves change, the full distribution of stellar mass completeness ) is determined.
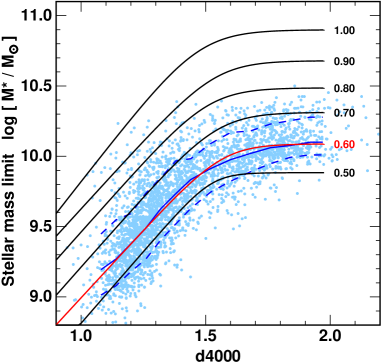
Appendix B Size-mass relation coded by the bulge-to-total ratio
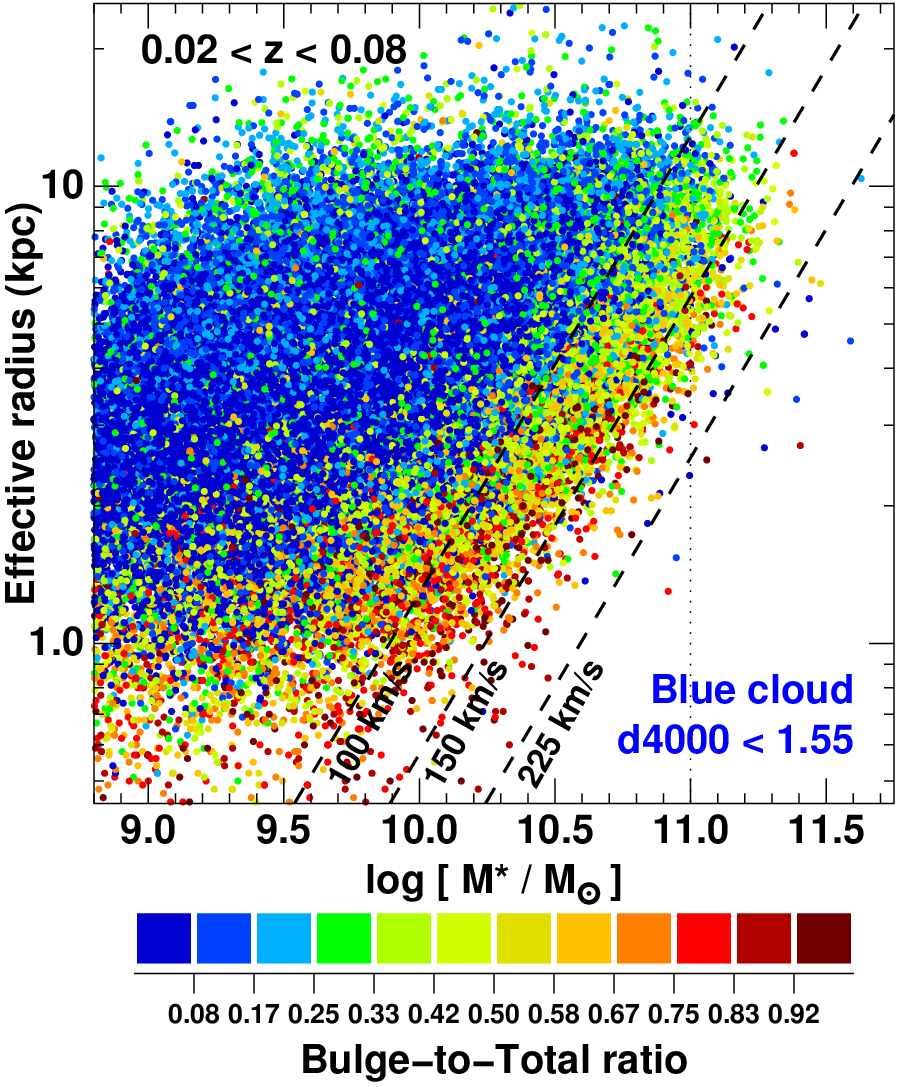
Simard et al. (2011) performed full bulge-disc decompositions, with bulge and exponential disc components, for all SDSS-DR7 galaxies in our sample. Figure 14 replots the size-mass relation of blue cloud galaxies (d) at from the SDSS-DR7, colour coded according to the fraction of -band galaxian light due to the bulge component (B/T). For galaxies which have two distinct components, a single Sérsic function may have difficulty fitting the radial light profile at all radii, and so in these cases the B/T ratio should be more robust measure of galaxy structure.
Galaxies on the leading edge of the blue cloud have significant bulge components (), as do the most compact systems ( kpc) at all stellar masses, while the remaining low-mass galaxies are uniformly disc-dominated (B/T0.25). This confirms that the changes in galaxy structure reported in Fig. 11 based on their Sérsic indices, for blue cloud galaxies along the high-mass edge of the blue cloud, do reflect concrete changes in galaxy structure.
Appendix C Growth and evolution of star-forming galaxies as a function of stellar mass
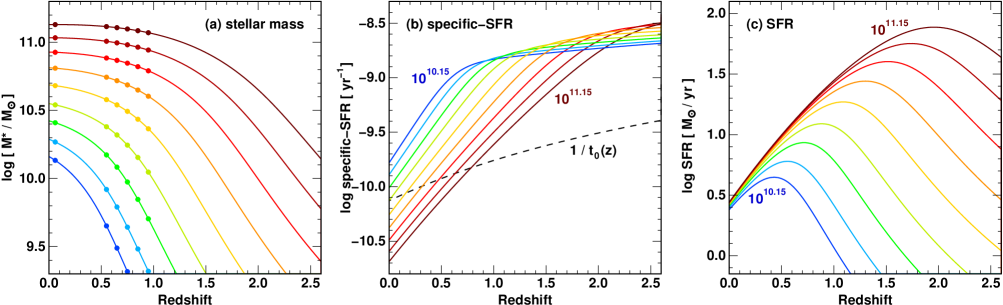
We use the parametrized functions describing the redshift evolution of the SFR– relation of UVJ-selected star-forming galaxies from Tomczak et al. (2014) to predict the stellar mass growth of star-forming galaxies as a function of redshift. The relations are based on observations of star-forming galaxies from the FourStar Galaxy Evolution Survey (ZFOURGE) in combination with far-infrared imaging from Spitzer and Herschel. We start with a seed galaxy at redshift 4.0, and initial stellar mass , from which we calculate its predicted SFR at that redshift from the parameterized SFR– relation given in Eq. 4 of Tomczak et al. (2014). In time steps equal to , the stellar mass is shifted by the amount of star formation added according to its SFR. SFRs are recalculated at each new time step. Mass loss due to stellar evolution is accounted for according to Equation 16 of Moster et al. (2013). We then evolve the observed stellar mass of the galaxy forward in time to the present day. We repeat this for a number of seed galaxies with a range of initial stellar masses, in order to populate the observed stellar mass range of star-forming galaxies at . The resulting mass growth profiles are shown in Fig. 15a by the coloured curves, from low-mass (blue) to high-mass (red) galaxies.
The evolutions of the specific-SFRs, SFR, of the same galaxies and their SFRs are shown in Figs. 15b and c. The black dashed curve in Fig. 15b indicates the evolution of where is the age of the Universe at redshift in yr. The specific-SFRs of star-forming galaxies of all masses remain relatively constant at high redshifts at values of and little dependency on mass. Starting with the most massive star-forming galaxies they progressively peel off this phase of flat specific-SFRs, and start a second phase of steady decline in specific-SFR that continues unabated to the present day. Massive star-forming galaxies can be seen to follow an accelerated evolution relative to their lower mass counterparts. Similarly, the SFRs of star-forming galaxies peak at a redshift that increases with stellar mass (Fig. 15c), from for low-mass systems which have at , to for those which become today’s most massive blue-cloud galaxies with .