A dynamics-free lower bound on the mass of our galaxy
Abstract
We use a sample of Milky Way (MW) analogs for which we have stellar and disk gas mass measurements, published measurements of halo gas masses of the MW and of similar galaxies, and the well-established value of the cosmological baryon fraction to place a lower bound on the mass of the Galaxy of and estimate that the mass is likely to be M⊙. Although most dynamical analyses yield measurements consistent with these results, several recent studies have advocated for a total mass well below . We reject such low mass estimates because they imply a Galactic baryon matter fraction significantly above the universal value. Convergence between dynamical mass estimates and those based on the baryonic mass is an important milestone in our understanding of galaxies.
keywords:
Galaxy: fundamental parameters – general – structure1 Introduction
An accurate measurement of the mass of our galaxy, the Milky Way (MW), is necessary for us to answer questions regarding the evolution of the Galaxy and its satellites, and to place the Galaxy within the larger cosmological context. Simple questions, such as whether the Magellanic Clouds are gravitationally bound to the Galaxy, remain unresolved given the full range of published mass estimates for the MW (Besla et al., 2007; Kallivayalil et al., 2013).
The direct way to estimate the mass of the MW, or any other galaxy, is to measure the kinematics of test particles, such as stars, globular clusters, and satellite galaxies, and to construct dynamical models that give rise to the observed kinematics. For nearly 30 years, since Zaritsky et al. (1989), we have had kinematic measurements of test particles that probe the anticipated virial volume of the MW ( kpc). Although the estimated total mass resulting from that study () remains consistent with a broad set of subsequent studies (Wilkinson & Evans, 1999; Sakamoto et al., 2003; Xue et al., 2008; Li & White, 2008; Watkins et al., 2010; McMillan, 2011; Boylan-Kolchin et al., 2013; Barber et al., 2014; Kafie et al., 2014; Eadie et al., 2015; Huang et al., 2016), some recent studies continue to advocate for significantly lower masses enclosed within 200 kpc ( (Sofue, 2009), (Bhattacharjee et al., 2014), and (Gibbons et al., 2014)). Even among studies that advocate for a total mass , their results vary from about (Xue et al., 2008; McMillan, 2011; Huang et al., 2016) to well above (Sakamoto et al., 2003; Li & White, 2008). Why has the field not converged in 30 years?
Although the idea of dynamical modelling is simple in principle, it is complicated in practice for various reasons. First, the results can be strongly model dependent. In some cases, the dynamical tracers do not extend out to the virial radius. As such, the estimated virial mass is a model-based extrapolation of constraints on the enclosed mass at smaller radii (Kalberla et al., 2007; Xue et al., 2008; Huang et al., 2016). Even without extrapolation, models can produce subtly different satellite populations than expected (Barber et al., 2014) subverting standard model assumptions. Second, we typically have incomplete kinematic information, usually only radial velocities for the test particles, and therefore uncertain orbits. This ambiguity translates to uncertainty in the derived mass of a factor of a few and can also lead to internal inconsistencies (see, for example, discussion by Wilkinson & Evans, 1999). Third, the number of test particles, particularly at the largest distances, is small. This challenge has led some investigators to develop increasingly sophisticated statistical analyses with the aim of extracting robust estimates and uncertainties (Little & Tremaine, 1987; Kochanek, 1996; Eadie et al., 2015). However, such efforts are compromised by their reliance on smooth, analytic models rather than the more realistic, cosmologically accurate ones. This shortcoming affects not only the nature of the dark matter halo, but also the characteristics of the satellites. For example, recent observations hint that some sets of satellite galaxies are not independent test particles but rather fell into the Galaxy halo as a bound group (Koposov et al., 2015). Fourth, even if the individual satellites provide independent probes of the Galaxy mass, they are not a random set of tracer particles. At large radii, their orbital phases are non-random (Zaritsky et al., 1989; White & Zaritsky, 1992; Boylan-Kolchin et al., 2013), and therefore no simple dynamical model in isolation will accurately reproduce the dependencies between Galaxy mass, galactocentric radius, and tracer particle velocity.
It is telling that within the last 30 years, despite the discovery of numerous distant tracer particles, proper motion measurements, and better models, both the typical MW mass estimate and the uncertainty, as judged by the range of estimates themselves, have remained unchanged. This behaviour suggests that we are facing systematic uncertainties rather than random ones. The bottleneck will eventually be broken by superior kinematic data and models, but in the interim, we propose a different approach, independent of dynamics, to provide competitive constraints on the lower bound of MW mass estimates.
The advent of precision cosmology provides new opportunities for the study of old problems. For our purpose, the relevant quantity is the ratio of the baryon density to the matter density, , or the baryon matter fraction. The availability of a precise determination of this value allows us to translate a measured total baryon mass to a total mass, assuming that galaxies have the cosmological baryon matter fraction. Because there may be baryonic mass loss during galaxy evolution (Larson, 1974), our adoption of as appropriate for galaxies is conservative in that it biases downward the total mass lower bound. The Planck Collaboration (2014) place at 0.155, while Komatsu et al. (2011) using data from the Wilkinson Microwave Anisotropy Probe place it at 0.167 (WMAP7). The difference is minor for our purposes, consistent within their quoted uncertainties, and we adopt the WMAP value.
It is difficult to complete a baryon inventory of our galaxy given our location within it. The effort requires substantial modelling of the observations (Flynn et al., 2006; McMillan, 2011). Even with the best of measurements, such a result represents a single example and leaves questions about the degree of possible variance among galaxies unanswered. To address these difficulties, we examine a sample of disk galaxies with the same rotation speed as the MW, which we refer to as MW analogs.
Given the baryons that we observe in these galaxies, what is the minimum total mass inferred if we adopt the cosmological baryon matter fraction, ? Using the mass distribution of the analogs, we find and describe below a bound defined by the 10th percentile () that is in significant tension with a subset of existing dynamical mass estimates and our preferred value ( M⊙) provides compelling support for the larger published mass estimates. In §2 we describe the data used in the baryon inventory. In §3 we describe how we reach our mass estimates using a sample of galaxies similar to the MW and discuss various aspects of the estimate, including the role of systematic errors and where the most significant progress can be made. Where needed, we adopt the simplified standard cosmology of , , and H km s-1 Mpc-1.
2 Data
The initial step in our baryon accounting consists of summing cold gas mass estimates for galaxy disks, from HI fluxes, and stellar mass estimates, from infrared magnitudes. The sum of these two components is only an initial step because we will not have yet included baryons in the halo. We will address this shortcoming in §3 using published studies.
2.1 Cold disk gas masses
We draw our HI data from the Cosmic Flows project, which has gathered and consistently remeasured digital HI spectra from the public archives of the largest radio-telescopes worldwide. Tens of thousands of galaxy line widths were measured or remeasured using a new robust method described by Courtois et al. (2009, 2011). A detailed description of the measurement and corrections for relativistic broadening, broadening due to finite spectral resolution, and internal turbulent motions are presented and discussed Courtois et al. (2009, 2011) and Tully & Courtois (2012). We have already used these data in previous papers regarding the baryonic Tully-Fisher relation (Zaritsky et al., 2014) and unusual galaxies (Courtois et al., 2015).
We currently have coherent HI measurements for 13,213 galaxies. This catalog is available for public use at the Extragalactic Distance Database (EDD) website111http://edd.ifa.hawaii.edu; catalog “All Digital HI” and we call it the “All Digital HI catalog". Several other parameters available are included (Tully et al., 2009) such as the integrated HI line fluxes computed from the HI lines, which have a flux calibration uncertainty of about 10 to 15%, and the average heliocentric velocities. We use the smooth Hubble flow distances, calculated from the CMB-frame recessional velocities.
Of interest here from that same dataset is , which is a measure of the width of the HI 21 cm emission line, corrected for inclination, and hence corresponding roughly to twice the disk rotation velocity. An important distinction among Tully-Fisher studies is that this measurement is not necessarily either the peak rotation velocity nor the asymptotic rotation velocity of a flat rotation curve. Measurements of the rotation obtained from resolved rotation curves can lead to lower-scatter, presumably more accurate versions of the scaling relation (for example, see McGaugh and Schombert, 2015). The scaling relation is not the focus here and we use the rotation velocities only to group galaxies as similar.
A key aspect, and source of uncertainty, in the measurement of is the disk inclination, , used to correct the rotation velocity for projection. The inclinations are obtained from the Hyperleda data based on measurements from optical images. To mitigate errors, we limit the sample to highly inclined galaxies () for which the projection corrections are then small. Increasing the inclination limit to 75∘ reduces the size of the sample but does not affect our conclusions.
To calculate cold gas disk masses, we use the HI flux from the database using where is the HI gas mass, is the luminosity distance in Mpc, and is the flux integrated within the HI line profile in units of Jy km s-1. To obtain an estimate of the full gas mass, rather than just HI, we us a sliding correction scale for with galaxy type (McGaugh & de Blok, 1997), and correct for the mass in He and metals by multiplying by 1.4.
We only consider galaxies with recessional velocities 2000 km s-1 to minimise distance errors due to peculiar velocities and morphological types Sab or later to focus on galaxies where rotational support dominates.
2.2 Stellar masses
We estimate the stellar masses using 3.6m fluxes, obtained either with the Spitzer Space Telescope (Werner et al., 2004) or WISE (Wright et al., 2010). To convert IR fluxes to stellar masses, we use the calibration based on the analysis by McGaugh and Schombert (2015), who calculate disk, stellar mass-to-light ratios, ’s, by requiring consistent Tully-Fisher relations for gas-rich and star-rich galaxies. They conclude that in solar units at 3.6m, with an intrinsic scatter among galaxies that is less than 30%.
This result is entirely consistent with an independent determination of the stellar at 3.6m done using the resolved stellar populations in the Large Magellanic Cloud (Eskew et al., 2012). The conversion advocated by Eskew et al. (2012) is , where is in Jy, in solar masses, and is the distance of the source in Mpc. For (Oh et al., 2008) and a 3.6m zero point of 280.9 Jy (Reach et al., 2005). The Eskew et al. (2012) calibration is equivalent to adopting of 0.53 in solar units at 3.6m. A relevant factor in that calculation is that it adopts a Salpeter initial mass function (Salpeter, 1955) to correct for stars below the detection limit. As such, the resulting stellar masses are biased high if the alternative Kroupa (Kroupa, 2001) or Chabrier (Charbrier, 2003) mass functions are in fact the correct ones. This discrepancy may be the reason why the Eskew et al. (2012) calibration results in stellar masses that are 18% larger, although such values are still within the McGaugh and Schombert (2015) limit on the intrinsic scatter.
3 The Mass of the Galaxy
In Figure 1 we plot the baryonic mass accounted for by the combination of the cold disk gas and stars that we have traced as described above as a function of . The existence of the evident correlation is what gives rise to the baryonic Tully-Fisher relation.
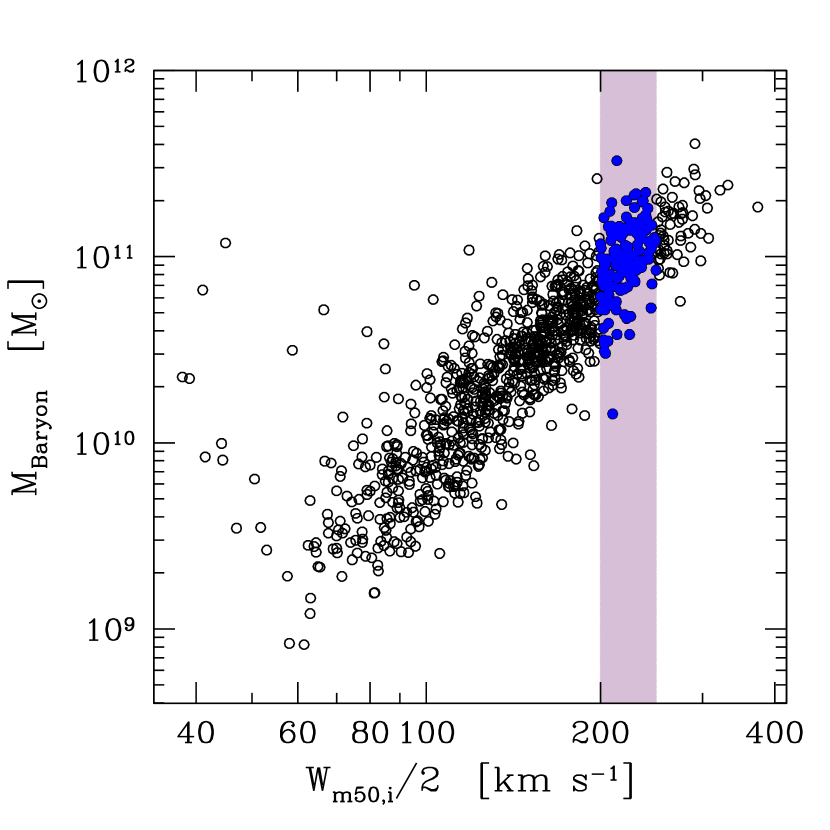
There is no direct observation of for the MW. There are, however, numerous measurements of the rotation curve from well inside the solar radius to about twice the solar radius (Burton & Gordon, 1978; Gunn et al., 1979; Clemens, 1985; Fich et al., 1989; Brand & Blitz, 1993; Honma & Sofue, 1997; Olling & Merrifield, 1998; Sofue et al., 2009; Huang et al., 2016). Although the details depend on the adopted values of the LSR Galactocentric distance and velocity, these studies place the bulk of the material between a few kpc radius to twice the solar radius at circulate velocities between 200 and 250 km s-1. The one among these studies that advocates for possibly lower circular velocities (Olling & Merrifield, 1998) obtains those estimates using a Galactic centre distance that is significantly smaller than the currently accepted value (Reid, 1993). As such, we adopt galaxies with rotation widths, , between 200 to 250 km s-1 as representative of the MW. is not necessarily the rotation speed at the solar radius, nor is it the “flat" asymptotic value of the rotation curve. measures the maximum rotation speed of a substantial amount of the HI in the galaxy, and so is an (upwardly) biased measurement of the rotation curve. With the existence of a number of studies that place much of the Galaxy’s gas at rotation speeds as high as 250 km s-1, including galaxies with as high as 250 km s-1 is appropriate.
We have 151 galaxies that are highlighted in Figure 1 and constitute our sample of MW analogs. One is possibly an outlier that lies too far above the bulk of the sample, and one that lies too far below. We remove these from the sample. Otherwise, the data seem representative of the galaxy sample as a whole in that they follow the mean trend of baryon mass with and show a typical degree of scatter. We present the resulting distribution baryon masses for the set of analogs in Figure 2. The upper panel of that Figure includes only the components discussed so far, disk gas and stars.
The baryon accounting is difficult in our own galaxy but there have been attempts and these provide a basic test of our results. Combining the published stellar disk mass (; McMillan, 2011) and disk gas mass ((; Dame, 1993) places the MW slightly below the median of the sample, but within 1 of the mean (Figure 2).
The summation of the mass of the stars and disk gas within these galaxies is known to be an incomplete baryon accounting because of the existence of significant amounts of gas in galaxy halos, including our own (Bregman, 2007; Gupta et al., 2012; Putman et al., 2012). A grossly incomplete baryon accounting will lead to an underestimate of the total mass. Even so, the median total mass determined from only these baryons, (see Table 2), is already larger than some of the dynamical total MW mass estimates. For the baryon inventory to be consistent with the smallest dynamical mass estimates in the literature, such as those of Sofue (2009) and Gibbons et al. (2014), our analog galaxies would have to have their full cosmological allotment of baryons (no baryonic mass loss) and have all of those baryons locked within their disks (no additional baryons in their halos).
The second of these two conditions can already be ruled out. The MW does have a significant amount of gas in its halo. Regarding the hot (T K) gas, we refer to recent measurements of that component in the Galaxy (Gupta et al., 2012; Miller & Bregman, 2015; Nicastro et al., 2016). These studies agree that there is substantial mass in hot halo gas, M⊙, although the derived values vary depending on the model assumptions, even within in a single study (from to M⊙; Nicastro et al., 2016) . We adopt an intermediate value, consistent within the uncertainties of both extremes (Miller & Bregman, 2015), with a modification that we increase the uncertainty to M⊙ to allow for the lower values among the range of estimates.
Adding this gas to our accounting, sampling 10,000 times from a Gaussian distribution defined by the adopted mean and revised uncertainty, we obtain the baryon and total mass distributions shown in the middle panel of Figure 2. The corresponding mass constraints are given in Table 2 and consist of a median total mass of and a 10th percentile lower bound of . We are beginning to be able to statistically rule out the smallest published estimates of the MW mass (eg. Sofue et al., 2009).
Accounting for the cool (T K) halo gas is more complicated because we must rely on measurements of this component in MW analogs rather than in the MW halo itself. By examining and modelling the metal ion absorption lines within the halos of galaxies, Werk et al. (2014) place a lower limit on the mass of such gas at per galaxy halo. Because the average galaxy in their sample has a slightly lower stellar mass than in ours (log of 10.6 for their sample in comparison to 10.87 for our sample of analogs and 10.81 for the MW(McMillan, 2011)), their lower limit is likely to also be a lower limit for our sample and for the MW. There are complex questions regarding the physical nature of this gas and its relation with the hot gaseous halo (Werk et al., 2016), but the ubiquitous existence of this component has recently been confirmed through the measurement of the H emission profile out to 100 kpc projected radius in galaxy halos using over 7 million SDSS sightlines (Zhang et al., 2016).
Formally Werk et al. (2014) claim their mass estimate to be a lower limit, suggesting that we should add the full amount to all of our analog galaxies. However, in the interest of capturing some level of uncertainty in this difficult measurement, we adopt a 1 uncertainty of 50%. Again we draw from a Gaussian, this time with a mean of and an uncertainty of . Adding this contribution, we find the distribution of masses shown in the lowest panel of Figure 2. The corresponding mass constraints are again presented in Table 2 and correspond to a median mass of M⊙ and a 10th percentile lower bound of M⊙.
How can one escape these conclusions? We see only two potential, but unattractive, paths. First, the contribution from the cool halo gas is not confirmed for the MW. Although we know of no reason why the MW would be distinct from other L∗ galaxies in this particular way, the measurement we use is not a direct measurement of this component in the halo of the MW. If one is willing to postulate the absence, or gross overestimation, of the cool gas in the MW halo, then the lower bound could drop to as far as M⊙. However, an independent argument against dismissing these halo baryons comes from matching numerical galaxy simulations to the baryonic Tully-Fisher relation, which requires that 40% of a galaxy’s baryons are in the disk (Zaritsky et al., 2014). That argument provides no guidance on the phase of the halo baryons, but the estimate that 60% of the baryons are in the halo is consistent with the sum of the masses independently measured for the cool and hot halo phases that we cite above. Second, if for the MW is lower than the range we adopted (from 200 to 250 km s-1) then the stellar and cold disk gas masses would correspondingly decrease (see Figure 1). Again, we see little indication that this is a viable possibility given previous empirical results on the MW rotation curve.
If we accept the results of the baryon accounting presented at face value and the typical dynamical total mass estimate of M⊙, we find that the community is converging on several important results. First, we understand at a broad level the constituent baryonic components of galaxies like the Milky Way. Conjectured possibilities of large populations of dark objects (halo white dwarfs, black holes, dense cold molecular gas clouds) cannot contribute significantly to the total baryon budget. Second, galaxies like the Milky Way do not lose significant fractions ( 10%) of their baryons to the intergalactic medium. Third, the disks of such galaxies contain at most 40% of the all the baryons initially within the halo. Confirming these conclusions depends primarily on improving the constraints on the mass of the hot and cold gaseous components of galaxy halos and in developing better upper limits on the dynamical mass estimates. The latter is generally not an area of focus because the dark matter problem has driven a focus on determining lower rather than upper bounds on the halo masses.

| Category | Value | Comment |
|---|---|---|
| cosmological baryon matter fraction | WMAP7 (Komatsu et al., 2011), Planck results lead to larger total mass estimates | |
| halo baryon fraction | cosmological | no expectation that it be above the cosmological value, unaccounted |
| baryonic mass loss from galaxies will cause us to underestimate total masses | ||
| 3.6m stellar mass-to-light ratio | from McGaugh and Schombert (2015), range includes Eskew et al. (2012), | |
| (M⊙/L⊙) | calibration, uncertainty is roughly consistent with IMFs ranging from | |
| Salpeter (1955) to Kroupa (2001) | ||
| MW circular velocity [km sec-1] | km sec-1 | from various studies cited in text |
| cool gas mass | M⊙ | not specifically for MW, but a lower limit for slightly lower stellar mass galaxies |
| (Werk et al., 2014), we treat as mean value and add an uncertainty of 50% | ||
| hot gas mass | 4.3 M⊙ | specifically for MW (Miller & Bregman, 2015), but we increase the uncertainty to |
| M⊙ to span other estimates (Nicastro et al., 2016) |
| Distribution | Median | 10th Percentile |
|---|---|---|
| [M⊙] | [M⊙] | |
| baryons only, disk gas + stars | ||
| total mass using disk gas + stars | ||
| total mass using disk & hot halo gas + stars | ||
| total mass using disk, cool & hot halo gas + stars |
4 Conclusions
With the ever improving census of baryons in galaxies similar to the MW, and in the MW itself, we are at a point where converting the baryon mass into an estimate of the total mass using the well-measured cosmological baryon matter fraction yields constraints on the total mass that are competitive with dynamical estimates. We find that to the degree we have a complete baryon census, the MW must have a total mass M⊙. We expect this to be a slightly conservative lower bound primarily because 1) galaxies are expected to have less than the cosmological baryon matter fraction due to mass loss arising from energetic feedback from stellar evolution and/or central engines (Larson, 1974; Oppenheimer & Davé, 2006), and 2) our baryon inventory is still likely to be incomplete. The largest source of uncertainty in this estimate arises in the accounting of the MW cool halo gas.
The use of the baryon fraction to set bounds on the mass of the Galaxy results in a limit that is in conflict with several recent dynamical studies advocating masses well below M⊙ (Sofue, 2009; Bhattacharjee et al., 2014; Gibbons et al., 2014). However, it must be noted that dynamical mass estimates have bounced around for nearly the past 30 years, without much sign of convergence. Our dynamics-free lower bound on the mass of the Galaxy provides an independent way that may help guide us to convergence on this issue. Ever improving baryonic inventories, particularly a measurement of the cool MW halo, may provide the strictest lower bounds on the total mass of the MW and other galaxies for some time. Once we reach convergence between the dynamical mass estimates and the total mass estimates derived from the baryon mass, we will be able to close several long-standing questions regarding galaxies.
Acknowledgements
DZ thanks the Université of Lyon 1 for financial support during a collaborative visit there that resulted in this paper and to everyone there for their welcoming friendship. DZ also acknowledges financial support from NSF AST-1311326 and the University of Arizona.
References
- Barber et al. (2014) Barber, C., Starkenburg, E., Navarro, J. F., McConnachie, A. W., & Fattahi, A., 2014, MNRAS, 437, 959
- Besla et al. (2007) Besla, G., Kallivayalil, N., Hernquist, L., Robertson, B., Cox, T. J., van der Marel, R. P., & Alcock, C., 2007, ApJ, 668, 949
- Bhattacharjee et al. (2014) Bhattacharjee, P., Chaudhury, S., & Kundu, S., 2014, ApJ, 785, 63
- Boylan-Kolchin et al. (2013) Boylan-Kolchin, M., Bullock, J. S., Sohn, S. T., Besla, G., & van der Marel, R. P., 2013,ApJ, 768, 140
- Brand & Blitz (1993) Brand, J., & Blitz, L., 1993, A&A, 275, 67
- Bregman (2007) Bregman, J. N., 2007, ARA&A, 45, 221
- Burton & Gordon (1978) Burton, W. B. and Gordon, M. A., 1978, A&A, 63, 7
- Charbrier (2003) Chabrier, G., 2003, PASP, 115, 763
- Clemens (1985) Clemens, D. P., 1985, ApJ, 295, 422
- Courtois et al. (2009) Courtois, H.M., Tully, R.B., FIsher, J.R., Bonhomme, N., Zavodny, M., & Barnes, A. 2009, AJ, 138, 1938
- Courtois et al. (2011) Courtois, H.M., Tully, R.B., Makarov, D.I., Mitronova, S., Koribalski, B., Karachentsev, I.D., & Fisher, J.R., 2011, MNRAS, 414, 2005
- Courtois et al. (2012) Courtois, H. M., Hoffman, Y., Tully, R. B., & Gottlöber, S. 2012, ApJ, 744, 43
- Courtois et al. (2015) Courtois, H. M., Zaritsky, D., Sorce, J. G., & Pomarède, D., 2015, MNRAS, 448, 1767
- Dame (1993) Dame, T. M., 1993, AIP Conference Series, 278, 267
- Eadie et al. (2015) Eadie, G. M., Harris, W. E., & Widrow, L. M., 2015, ApJ, 806, 54
- Eskew et al. (2012) Eskew, M., Zaritsky, D., & Meidt, S. 2012, AJ, 143 139
- Fich et al. (1989) Fich, M., Blitz, L., & Stark, A. A.,, 1989, ApJ, 342, 272
- Flynn et al. (2006) Flynn, C, Holmberg, J., Portinari, L., Fuchs, B. & Jahreiß, H.,2006, MNRAS, 372, 1149
- Gibbons et al. (2014) Gibbons, S. L. J., Belokurov, V., & Evans, N. W., 2014, MNRAS, 445, 3788
- Gunn et al. (1979) Gunn, J. E., Knapp, G. R., & Tremaine, S. D., 1979, AJ, 84, 1181
- Gupta et al. (2012) Gupta, A., Mathur, S., Krongold, Y., Nicastro, F., & Galeazzi, M. 2012, ApJ, 756, 8
- Honma & Sofue (1997) Honma, M., & Sofue, Y., 1997, PASJ, 49, 453
- Huang et al. (2016) Huang, Y., Liu, X.,Yuan, H. et al., arXiv:1604.01216
- Kafie et al. (2014) Kafle, P. R., Sharma, S., Lewis, G. F., & Bland-Hawthorn, J., 2014, ApJ, 794, 59
- Kalberla et al. (2007) Kalberla, P. M. W., Dedes, L., Kerp, J., & Haud, U., 2007, A&A, 469, 511
- Kallivayalil et al. (2013) Kallivayalil, N., van der Marel, R. P., Besla, G.,Anderson, J. & Alcock, C., 2013,ApJ, 764, 161
- Kochanek (1996) Kochanek, C.S. 1996, ApJ, 457, 228
- Komatsu et al. (2011) Komatsu, E., Smith, K. M., Dunkley, J. et al, .2011, ApJS, 192, 18
- Koposov et al. (2015) Koposov, S. E., Belokurov, V., Torrealba, G., & Evans, N. W., 2015, ApJ, 805, 130
- Kroupa (2001) Kroupa, P. 2001, MNRAS, 322, 231
- Larson (1974) Larson, R. B., 1974, MNRAS, 169, 229
- Levine et al. (2008) Levine, E. S., Heiles, C., & Blitz, L., 2008, ApJ, 679, 1288
- Li & White (2008) Li, Y.-S., & White, S. D. M., 2008, MNRAS, 384, 1459
- Little & Tremaine (1987) Little, B. & Tremaine, S., 1987, ApJ, 320, 493
- McGaugh & de Blok (1997) McGaugh, S.S., & de Blok, W.J.G. 1997, ApJ, 481, 689
- McGaugh and Schombert (2015) McGaugh, S. S., & Schombert, J. M. 2015, ApJ, 802, 18
- McMillan (2011) McMillan, P. J., 2011, MNRAS, 414, 2446
- Merrifield (1992) Merrifield, M. R., 1992, AJ, 103, 1552
- Miller & Bregman (2015) Miller, M. J. & Bregman, J. N., 2015, ApJ, 800, 14
- Nicastro et al. (2016) Nicastro, F., Senatore, F., Krongold, Y., Mathur, S., & Elvis, M. 2016, ApJ, 828, 12
- Oh et al. (2008) Oh, S.-H., de Blok, W. J.. G., Walter, F., Brinks, E., & Kennicutt, R.C., Jr. 2008, AJ, 136, 2761
- Olling & Merrifield (1998) Olling, R. P., & Merrifield, M. R., 1998, MNRAS, 297, 943
- Oppenheimer & Davé (2006) Oppenheimer, B. D., & Davé, R., 2006, MNRAS, 373, 1265
- Planck Collaboration (2014) Planck Collaboration, Ade, P. A. R., Aghanim, N., Armitage-Caplan, C., et al. 2014,A&A, 571, A16
- Putman et al. (2012) Putman, M. E., Peek, J. E. G., & Joung, M. R., 2012, ARA&A, 50, 491
- Reach et al. (2005) Reach, W. T., Megeath, S. T., Cohen, M. et al. 2005, PASP, 117, 978
- Reid (1993) Reid, M. J., 1993, ARA&A, 31, 345
- Sakamoto et al. (2003) Sakamoto, T., Chiba, M., & Beers, T. C., 2008, A&A, 397, 899
- Salpeter (1955) Salpeter, E.E., 1955, ApJ, 121, 161
- Sofue (2009) Sofue, Y., 2009, PASJ, 61, 153
- Sofue et al. (2009) Sofue, Y., Honma, M., & Omodaka, T., 2009, PASJ, 61, 227
- Tully & Courtois (2012) Tully, R.B., & Courtois, H.M. 2012, ApJ, 749, 78
- Tully et al. (2009) Tully, R.B., Rizzi, L., Shaya, E.J., Courtois, H.M., Makarov, D.I., & Jacobs, B.A. 2009, AJ, 138, 323
- Tully et al. (2013) Tully, R. B., Courtois, H. M., Dolphin, A. E., et al. 2013, AJ, 146, 86
- Watkins et al. (2010) Watkins, L. L., Evans, N. W., & An, J. H., 2010, MNRAS, 406, 264
- Werk et al. (2014) Werk, J. K., Prochaska, J. X., Tumlinson, J. et al., 2014, ApJ, 792, 8
- Werk et al. (2016) Werk, J. K., Prochaska, J.X., Cantalupo, S., Fox, A.J., Oppenheimer, B., Tumlinson, J., Tripp, T.M., Lehner, N., & McQuinn, M. 2016, ApJ, arXiv:1609.00012
- Werner et al. (2004) Werner, M.W., et al. 2004, ApJS, 154, 1
- White & Zaritsky (1992) White, S. D. M. and Zaritsky, D., 1992, ApJ, 394, 1
- Wilkinson & Evans (1999) Wilkinson, M. I., & Evans, N. W., 1999, MNRAS, 310, 645
- Wright et al. (2010) Wright, E. L., Eisenhardt, P. R. M., Mainzer, A. K., et al. 2010, AJ, 140, 1868
- Xue et al. (2008) Xue, X. X., Rix, H. W., Zhao, G., et al. 2008, ApJ, 684, 1143
- Zaritsky et al. (2014) Zaritsky, D., Courtois, H., Muñoz-Mates, J.-C., et al. 2014, AJ, 147, 134
- Zaritsky et al. (1989) Zaritsky, D.,Olszewski, E. W., Schommer, R. A.,Peterson, R. C., Aaronson, M., 1989, ApJ, 345, 759
- Zhang et al. (2016) Zhang, H., Zaritsky, D., Zhu, G., Menard, B., & Hogg, D. 2016, MNRAS, in press (arXiv:1611:00004)