On the energisation of charged particles by fast magnetic reconnection
Abstract
We study the role of turbulence in magnetic reconnection, within the framework of magneto-hydrodynamics, using three-dimensional direct numerical simulations. For small turbulent intensity we find that the reconnection rate obeys Sweet-Parker scaling. For large enough turbulent intensity, reconnection rate departs significantly from Sweet-Parker behaviour, becomes almost a constant as a function of the Lundquist number. We further study energisation of test-particles in the same setup. We find that the speed of the energised particles obeys a Maxwellian distribution, whose variance also obeys Sweet-Parker scaling for small turbulent intensity but depends weakly on the Lundquist number for large turbulent intensity. Furthermore, the variance is found to increase with the strength of the reconnecting magnetic field.
keywords:
MHD1 Introduction
Energetic charged particles with a wide range of energies are ubiquitous in astrophysics. At one end of the energy scale lie the galactic cosmic radiation with energies of the order of eV; at the other end lie particles, with energies of the order of a few s, accelerated by the magnetosphere of the Earth. The energy of particles energised by the Sun lies in the intermediate range: from particles energised by flare-associated events with energies of the order of eV, down to barely detectable events with energies about MeV (see e.g., Fichtel & McDonald, 1967; Sweet, 1969; Hudson & Ryan, 1995, for a review). The production of energetic particles in solar processes seems to occur as discrete events (see, e.g., Klimchuk, 2015). The current state-of-the-art of the instrumentation spanning observing bands all the way from -rays to low radio frequencies and emission mechanisms from thermal bremsstrahlung to coherent plasma emissions, allows us to study this process, from the development of active regions to the occurrence of the flare itself and the following aftermath in unprecedented detail. We have in-situ measurements of the plasma properties, usually at a few isolated points in the vicinity of the Earth. Nevertheless, the mechanism of energisation for the galactic cosmic rays, the solar particles or even the magnetospheric particles are not well-understood.
Theoretically, magnetic reconnection is considered to be one of the promising mechanisms to energise charged particles; indeed a significant amount of research in reconnection is motivated by the study of energetic particles in solar flares. The phenomenon of magnetic reconnection is one of the fundamental processes in astrophysics, (see e.g., Zweibel & Yamada, 2009, and references therein.) and is worth studying in its own right. Magnetic reconnection is typically defined as a process which gives rise to “…a topological rearrangement of the magnetic field that converts magnetic energy to plasma energy.” (Zweibel & Yamada, 2009). Within the domain of applicability of this definition, magnetic reconnection can be of various varieties. In the simplest case of resistive (or collisional) reconnection, which is applicable for very small but non-zero magnetic diffusivity (), the magnetic field lines are frozen in the flow except when they reconnect through magnetic diffusivity. This is modelled within the magnetohydrodynamic (MHD) description of the plasma. In the collisionless, non-MHD, regime, one realises that the electrons and the ions can have very different time scales and consequently a two-fluid description is necessary.
In what follows, we limit ourselves to the MHD description of reconnection. Within a reconnection model, if the reconnection rate goes to zero as then the reconnection process is defined to be slow; otherwise, it is called fast. Here is the Lundquist number with the thickness of the reconnecting current sheet and the Alfven speed given by the strength of the reconnecting magnetic field. Clearly, slow reconnection is not of relevance in most astrophysical problems. The original quasi-stationary model for resistive reconnection by Sweet (1958) was shown by Parker (1973) to be slow – the reconnection rate . Approximate analytical theory by Petschek (1964), who changed the planar the geometry of the Sweet-Parker model to that of an “X”, does give fast reconnection – the maximum reconnection rate – although numerical simulations generally show such configuration to be unstable unless is not a constant but increases near the X-point (Zweibel & Yamada, 2009). Through a boundary layer calculation in a similar geometry, Moffatt & Hunt (2002) showed that the evolution of the magnetic flux – the rate-of-change of magnetic flux is a measure of the reconnection rate – is determined by two timescales, not just the diffusive time scale but also the strain-rate of the flow at the X-point. In any case, all the evidence, both numerical and analytical, support the statement that resistive magnetic reconnection is a slow process unless small scale turbulence is taken into account.
In two-dimensions (2D), a numerical attempt to study reconnection rate as a function of Lundquist number for different turbulent intensities was made by Loureiro et al. (2009), who showed that at large enough turbulent intensities reconnection can be fast – the reconnection rate becomes independent of the Lundquist number. It is believed that such fast reconnection is due to 2D plasmoid instability (Loureiro et al., 2007; Huang & Bhattacharjee, 2013). As 2D MHD can be quite different from its three-dimensional (3D) counterpart a different mechanism may be responsible for fast reconnection in 3D. It has been argued that reconnection in the presence of turbulence, in 3D, would be typically fast (Lazarian & Vishniac, 1999; Eyink et al., 2011) and has been found to be so in numerical simulations of both forced (Kowal et al., 2009) and self-generated (Oishi et al., 2015) turbulence.
Through reconnection the magnetic energy is dissipated to energise the ions and electrons. The crucial question here is whether energisation by reconnection can generate suprathermal charged particles, i.e., those with energies “very much in excess of their general thermal background” (Parker, 1958). An important class of solar active emission at low radio frequencies is believed to arise from coherent plasma emission mechanisms. These emissions require the presence of a suprathermal population of particles in a thermal background, and it is the particles in this so called bump-on-the-tail part of the distribution which is responsible for the electromagnetic radiation. The principal question that we want to understand is, whether the process of fast magnetic reconnection can produce a family of energized charged particles with such properties.
This is a difficult question to study numerically because in-principle one has to also take into account the electromagnetic fields created by the energised ions and electrons, which can be done by performing kinetic simulations, e.g., by using particles-in-cell (PIC) algorithms (see, e.g., Zenitani & Hoshino, 2007; Hoshino, 2012; Hoshino et al., 2001; Sironi & Spitkovsky, 2014; Guo et al., 2014). Another option is to work with the test-particle approximation (see, e.g., Ambrosiano et al., 1988; Kowal et al., 2011, 2012; de Gouveia Dal Pino & Kowal, 2015; del Valle et al., 2016) where one solves numerically the partial differential equations of MHD and uses the resultant electromagnetic field to calculate the energisation of a number of charged particles, ignoring the electromagnetic field generated by these energized charged particles. Furthermore, an additional approximation – quasi-stationary – is also often employed, where one assumes that the evolution of the particles are so fast that time-evolution of the fields (velocity and magnetic) can be ignored or approximated (see, e.g., Threlfall et al., 2016, for a recent example).
The rest of this paper is organised as follows: in section 2 we describe our reconnection simulation which uses the tearing-mode setup of Loureiro et al. (2009) but in 3D. Next, we describe how we incorporate test-particles in our setup. Note that we do not use the quasi-stationary approximation. In section 3 we measure the reconnection rate by calculating the rate-of-change of magnetic flux and then study the energisation of the test-particles by calculating the probability distribution function (PDF) of their speed when they reach the boundary of our simulations box. We also find out how this PDF depend on various parameters of our model, including, the Lundquist number, the intensity of turbulence and the strength of the reconnecting magnetic field.
2 Model
Let us first describe our setup without the test-particles. We solve the equations of isothermal MHD for the velocity , the magnetic vector potential , and the density ,
| (1) |
| (2) |
| (3) |
where the operator denotes the convective derivative, is the magnetic field, the current density, is the permittivity of vacuum, is the traceless rate-of-strain tensor (the commas denote partial differentiation), the kinematic viscosity, the magnetic diffusivity, and the isothermal sound speed. In addition, we assume the ideal gas law to hold. Our domain is a Cartesian box of size with . The term in (3) is employed in some but not all of our simulations. The aim is to preserve the initial configuration of the magnetic field, such that a statistically stationary state of repeated reconnections can be set up, such that meaningful statistical averages can be computed.
2.1 Forced turbulence
Turbulence is generated by the last term in (1), with the external force given by (Brandenburg, 2001)
| (4) |
where is the position vector. On dimensional grounds, we choose , where is a non-dimensional forcing amplitude which controls the intensity of turbulence . At each timestep we select randomly the phase and the wavevector from many possible wavevectors in a certain range around a given forcing wavenumber, . Hence is a stochastic process that is white-in-time. The Fourier amplitudes,
| (5) |
where is the identity matrix, and
| (6) |
is a non-helical forcing function, and is an arbitrary unit vector not aligned with and is the unit vector along ; note that .
2.2 Test-particle approximation
The test-particles satisfy the non-relativistic dynamical equations:
| (7) | |||||
| (8) |
where and are the position and velocities of the test particles, which has charge and mass , is the three-dimensional Dirac delta function. The electric field
| (9) |
and the magnetic field are functions of the space coordinate .
2.3 Initial and boundary conditions
We impose periodic boundary condition on all three directions on all the field variables (velocity, density and magnetic field). We start our simulations with everywhere and with constant density, . In order to set-up initial magnetic reconnection configuration, we choose tearing mode configuration, i.e., the initial value for the vector potential is set as with
| (10) |
where is the width of the current sheet. This implies that as a initial condition, only the component of the magnetic field is non-zero and is a function of alone, i.e., . Once the simulation has reached a statistically stationary state of repeated reconnection events, we introduce the test-particles at uniformly distributed random locations within the current sheet (of thickness ) with zero initial velocity. When a test particle reaches the boundary of the domain it is removed from the simulation. This numerical experiment is repeated several times to obtain better statistics.
2.4 Nondimensional parameters
The usual process of non-dimensionalization of the dynamic equations yield the following non-dimensional parameters, Mach number, , Alfvenic Mach number , Lundquist number , Reynolds number, , magnetic Reynolds number, , and the magnetic Prandtl number, . Here we have defined as the root-mean-square velocity of the flow, and the , the Alfven speed, where is the maximum value of the magnitude of the reconnecting magnetic field, We also obtain two ratios of length scales where is the length of our box which is equal to the length of the current sheet, and . We non-dimensionalize the current by .
The non-dimensionalization of the test-particle equations gives one more dimensionless parameters, the Lorentz number, where the cyclotron frequency and the large-eddy-turnover-time .
Not all the dimensionless numbers listed above are independent of one another, e.g., and In all the runs in this paper, the parameters and are kept fixed as and respectively. The numerical values of all the parameters used in our runs are listed in table 1. The simulations are run with grid points. To check numerical convergence, we have used and for all our runs, and for a few selected runs. Note that, although the Reynolds number we use is moderate (less than ) our simulations cover a large range – two decades – of magnetic Reynolds number.
2.5 Numerical implementation
We solve the dynamical equations using the pencil-code, http://pencil-code.nordita.org, see also Brandenburg & Dobler (2002), which uses sixth-order central finite-difference in space and third-order Williamson-Runge-Kutta scheme (Williamson, 1980) in time. The external force is a white-in-time stochastic process integrated by using the Euler–Marayuma scheme (Higham, 2001). We use a uniform grid of points and test-particles per run. To solve for each test-particle we need to know and at the typically off-grid position of the particles; this is obtained by trilinear interpolation 111It has been noted by Ambrosiano et al. (1988) that a cubic-spline interpolation and a trilinear interpolation give same results in a similar problem. from neighbouring grid points.
Run Re Ma Lo A1 0.001 9.510-3 83 83 0.067 0.65 1 9 A2 0.001 6.110-3 43 144 0.034 0.34 3 18 A3 0.001 4.510-3 15 158 0.013 0.12 10 51 A4 0.001 3.110-3 7 261 0.006 0.06 33 103 A5 0.001 1.610-3 4 479 0.004 0.04 100 168 A6 0.001 4.310-4 4 1506 0.004 0.04 333 179 B1 0.01 1.310-2 67 67 0.054 0.53 1 11 B2 0.01 7.710-3 43 144 0.035 0.34 3 18 B3 0.01 4.410-3 40 406 0.032 0.32 10 19 B4 0.01 2.510-3 40 1333 0.032 0.31 33 20 B5 0.01 1.810-3 38 3895 0.031 0.3 100 20 B6 0.01 2.510-3 36 12181 0.029 0.28 333 22 C1 0.05 1.710-2 169 169 0.135 1.31 1 4 C2 0.05 1.210-2 167 557 0.133 1.3 3 4 C3 0.05 1.210-2 157 1572 0.125 1.22 10 5 C4 0.05 1.310-2 141 4706 0.112 1.09 33 5 C5 0.05 9.010-3 125 12531 0.1 0.97 100 6 C6 0.05 9.310-3 104 34837 0.083 0.81 333 7
 |
 |
 |
| A2 | A4 | A6 |
 |
 |
 |
| A5 | B5 | C5 |
 |
 |
| (a) | (b) |
 |
 |
| (c) | (d) |
3 Results and Discussion
We divide the results in two parts. In the first part we discuss our reconnection runs without any test particles. The energisation of the test particles is discussed next, in the section 3.2.
3.1 Fast Reconnection
Our runs can be divided into three families, A, B and C, in sequence of increasing intensity of turbulence. Within each family, we have performed six runs ranging from e.g., A1 to A6, by decreasing the magnetic diffusivity but keeping other parameters the same. The change in gives rise to a decrease in and a weak decrease in Ma, consequently the Lundquist number also decreases.
Classified in this fashion, the run A1 has the lowest turbulent intensity and the largest Lundquist number and the run C6 the highest turbulent intensity and the lowest Lundquist number. Table 1 lists various dimensionless quantities for all the runs.
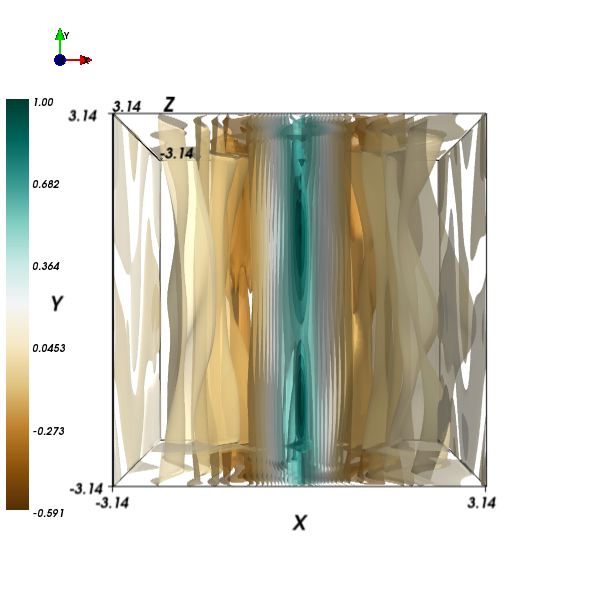
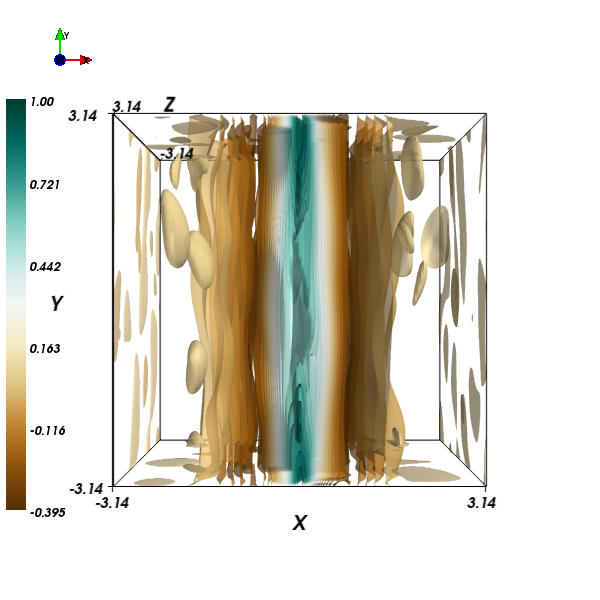
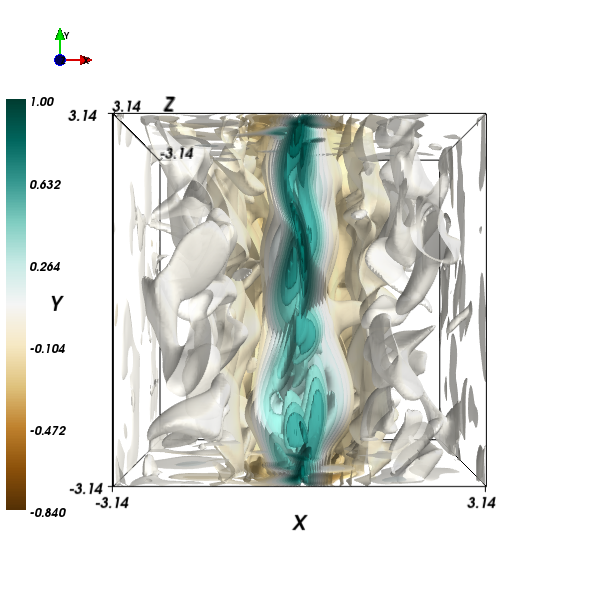
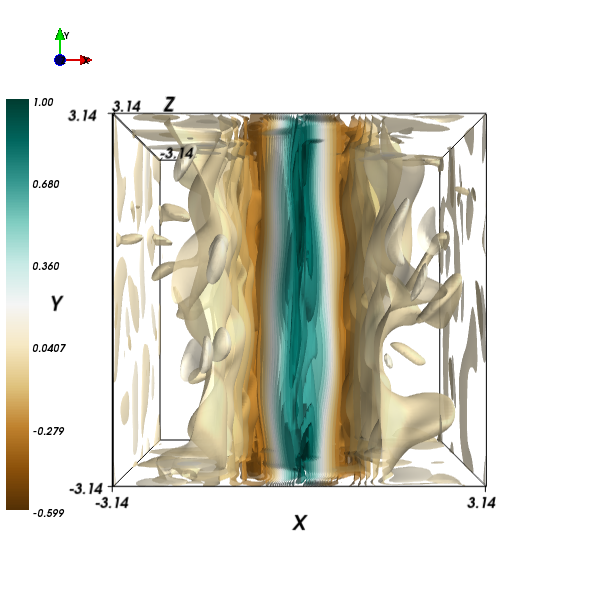
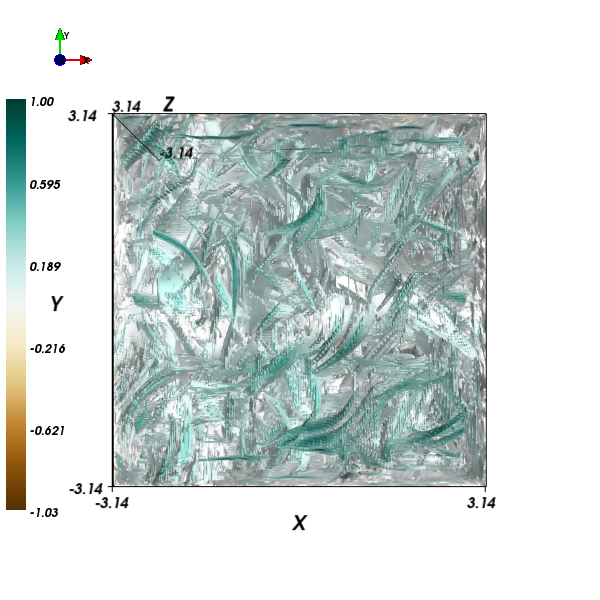
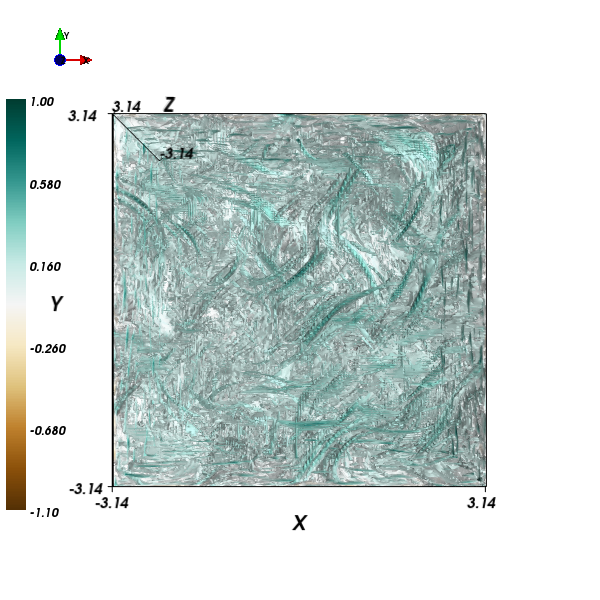
As mentioned in Section 2.3, we start our simulations with an initial magnetic field that gives rise to the tearing mode instability. Following Loureiro et al. (2009), we have added a magnetic forcing term in the induction equation, such that the magnetic flux consumed by the reconnection is replenished. In about one large-eddy-turnover-time after the start of our simulation, we observe the first reconnection event and then we observe the magnetic flux building up till the next reconnection event happens. Eventually, we obtain a statistically stationary state with repeated reconnection events. In Fig. 1 we show the 3D structures of the current sheet by plotting a pseudo-color plot of the z-component of the current, . In the top panel of Fig. 1, we show for three runs of family A. We find that as the Lundquist number decreases, the current sheet develops more and more small scale structures. In the bottom panel of Fig. 1 we show the impact of the increasing forcing amplitude on the current sheet structures; numerous small scale structures develop as the result of increased turbulent intensity. Samtaney et al. (2009) have suggested that these small scale structures are responsible for fast turbulent reconnection. In the runs with large amount of turbulent intensity, the effects of turbulence can be quite dramatic. To demonstrate this, we show in the upper panel of Fig. 2, a contour plot and in the plane for . The fluctuations due to turbulence are so large that the current sheet is practically invisible. On averaging the same snapshot over the direction we obtain and which we plot in the bottom panel. The averaging decreases the fluctuations and a hint of current sheet structure begins to reappear in , though it remains hard to discern in .
At present, there does not exist one unique prescription to measure the magnetic reconnection rate, particularly in the presence of turbulence, see e.g., Comisso & Bhattacharjee (2016) and references therein for a critical summary. In two dimensional laminar cases, the reconnection rate is the rate of change of vertical magnetic flux at the center of the current sheet. Loureiro et al. (2009) have suggested a generalisation of this to the turbulent case where they have measured the vertical magnetic flux at a fixed point in the grid (at the center of the laminar current sheet) and have fitted a line to the minima of such a time series to estimate the reconnection rate. Huang & Bhattacharjee (2010) in 2D simulations, and Beresnyak (2013) in 3D cases, have estimated reconnection rate by measuring the rate of change of the width of the current sheet. Kowal et al. (2009) have measured it by using a contour encompassing the reconnection region and calculating the flux that flows into the region. This incoming flux can also be estimated by finding out the typical speed of the inflow towards the current sheet (Jabbari et al., 2016).
In this paper, we suggest a prescription that is similar to the one suggested by Kowal et al. (2009). Consider the midplane () of our domain (in view of statistical homogeneity along the direction any plane can be considered). In this plane consider a closed contour which is a rectangle in the x-z plane whose sides are from to , and to . The rate-of-change of flux of the component of the magnetic field through this contour is given by
| (11) | |||||
| (12) |
The second equality follows from the periodic boundary conditions. But this flux is always close to zero because it consists of (roughly) equal amount of positive and negative flux, in other words the two integrals are (roughly) equal and opposite in sign. Hence a reasonable estimate of the rate-of-change of flux of only one sign can be obtained by reversing the direction of the second line integral and dividing by two. More precisely, we suggest the following expression:
| (13) |
This has the advantage that the relevant quantities are calculated away from the wandering current sheet. We non-dimensionalise by the speed-of-sound, to define, , which we call the reconnection rate. The reconnection rate is a highly fluctuating quantity as a function of time even for runs that have low turbulent intensity, as can be seen in the time-series of shown in Fig. 3. We take the maximum value of calculated over a large window of time, as a measure of the reconnection rate. The values of for all our runs are listed in table 1.
 |
Next, we plot in Fig. 4 the maximum reconnection rate as a function of the Lundquist number, , We find that the for the runs with the lowest turbulent intensity – the family A – the dependence of on S is consistent which is the Sweet-Parker scaling, which is plotted as a dashed line in the same figure. If we use the mean value of over the same time window instead of its maximum value, we obtain similar results. This provides a posteriori justification for using the prescription for that we have used. For the other two families, B and C, the we obtain significant departure from the Sweet-Parker behaviour. For the family B, follows the Sweet-Parker behaviour upto approximate beyond which the dependence on S is shallower. For the family C the departure from Sweet-Parker scaling happens at about beyond which is almost a constant as function of S. Hence the runs in family C are clearly in the regime of fast reconnection. The same behaviour has been observed by Loureiro et al. (2009) in a similar setup but in 2D.
 |
Another way to characterise magnetic reconnection is to calculate the volume-averaged non-dimensional magnetic energy dissipation rate (Oishi et al., 2015)
| (14) |
normalized by , as a function of the Lundquist number S. This quantity shows a behaviour qualitatively very similar to the reconnection rate, for the A runs, decreases with S for large S but for the B and C runs – the runs with high turbulent intensity – becomes almost independent of S for large S; as shown in Fig. 5. The advantage of using as opposed to as an indicator of turbulent reconnection is that the former being a volume averaged quantity is less noisy in turbulent simulations. To summarise, we have established that in our model of 3D tearing-mode reconnection, fast magnetic reconnection appears as a result of turbulence.
 |
3.2 Energisation of particles
Once a reconnection simulation has reached a statistically stationary state, we introduce the test-particles with random positions within to , but with zero initial velocity. The particles get energised and eventually reach the boundary of our simulation domain, where they are removed from the simulation. Hence the particles are not allowed to be repeatedly energised by the same reconnecting region. In Fig. 6 we plot the fraction of particles, , that reach the boundary of our domain between time and as a function of time . Curiously, the function has an exponential tail as shown in the inset of Fig. 6.
 |
Next, we plot the PDF of the speed of the ejected particles for three different representative runs A4, B4 and C4 in Fig. 7. All such PDFs are well approximated by a normalised Maxwellian distribution,
| (15) |
with the variance a function of the different parameters of the simulation. To demonstrate the accuracy of this fit, we have also plotted in Fig. 7 the Maxwellian fits to the PDFs. A Maxwellian distribution of speed of particles energised by the Fermi mechanism has also been observed in a much simpler context before (Mitra et al., 2014). Clearly, we do not obtain a non-thermal family of energised particles. Could the PDF be described by a Maxwellian distribution with a small non-thermal population at the tail?
It is generally difficult to obtain reliable information about the tail of a PDF by plotting histograms because of possible binning errors. Hence instead of studying the tail of the PDF, we have calculated the cumulative PDF (CDF) of the kinetic energy of the particles using rank-order method (Mitra et al., 2005) which allows the CDF to be free from binning errors 222 By definition, the CDF, . To calculate the CDF of a set of data with samples using rank-order method, sort the data in decreasing order. Assign the maximum value rank , the next value Rank and so on. The quantity we plot in the vertical axis of Fig. 8 is this rank divided by the sample size . Clearly, this is equal to . The method is best suited to study tails of CDF. If one is interested in the behaviour of the CDF for small values of its arguments, it would be necessary to sort in increasing order and then apply the same technique. . The CDF, for a representative run (C4), plotted in Fig. 8 with red circles, shows an exponential tail. An exponential tail of the CDF of kinetic energy implies that the PDF also possesses an exponential tail, which in turn implies that the tail of the PDF of velocities must be Gaussian.

 |
As we have now established that the PDF of the energies of the excited particles is a Maxwellian, it is determined by only one parameter, . The systematic dependence of the variance, , as a function of S for the three different families A B and C are plotted in Fig. 9. For the A family, for which the reconnection rate follows Sweet-Parker scaling we find the for large S, i.e., the typical velocity-scale of the energised particles follows the same scaling as that of the reconnection velocity. For the other two families, B and C, the we obtain significant departure from the Sweet-Parker behaviour. For the family B, follows the Sweet-Parker behaviour upto approximate beyond which the dependence on S is shallower. For the family C the departure from Sweet-Parker scaling happens at smaller values of S and the dependence of on S is a very slow decrease.
 |
Although the PDF of the speed of the ejected particles is Maxwellian, the variance, , is not determined by the temperature of our simulation, which is isothermal and same for all the runs. The variance, depends on the Lundquist number and also on the magnitude of the reconnecting magnetic field. To investigate the latter dependence we run a new set of simulations. We first select the run C4 which is one of our fast reconnection runs. Then do a series of runs with the same parameters as C4 but with different values of the reconnecting magnetic field. In each of these runs, we obtain a Maxwellian family of particles but the variance increases with strength of the reconnecting magnetic field, , as we show in Fig. 10.
 |
 |
 |
 |
| (a) A4 | (b) B4 | (c) C4 |
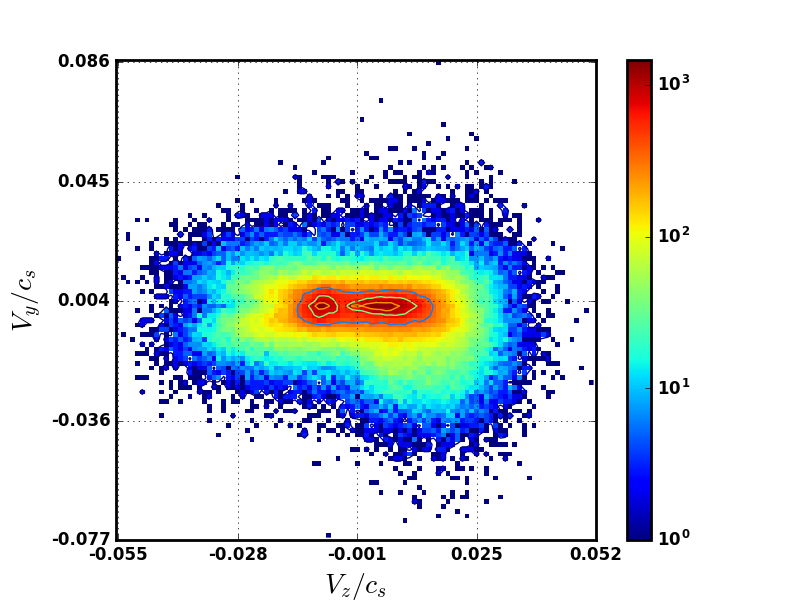
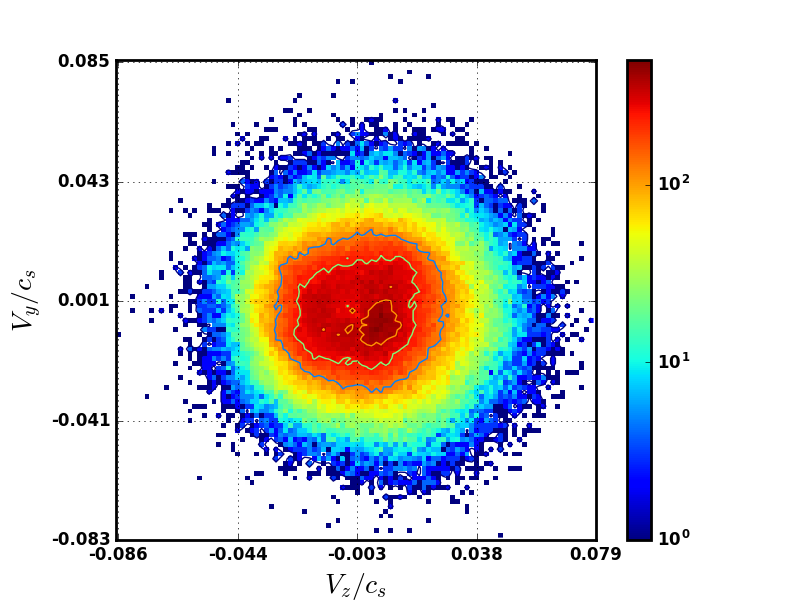
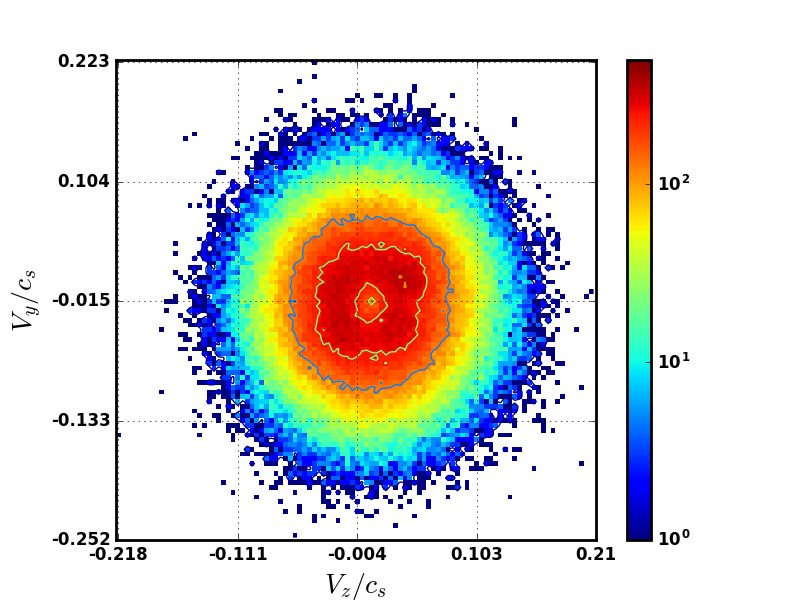
We would also like to point out what may seem to be an inconsistency in our results. The setup is clearly anisotropic, with the large-scale magnetic field pointing along the direction and is a function of the direction, but the Maxwellian distribution of the speed of the ejected particles suggests an isotropic distribution of velocities. To investigate this point further we have plotted in Fig. 11 a pseudocolor plot of the joint PDF of and of the ejected particles for three representative cases; runs A4, B4, and C4. The first one clearly shows anisotropic behaviour but as the strength of the turbulence, which is homogeneous and isotropic, increases the joint PDF becomes isotropic too. The other two joint PDFs (– and –) show a similar trend. Simulations of reconnection using particle-in-cell (PIC) codes have also observed similar behaviour of the joint PDF measured at points away from the reconnection region, although near the reconnection region the joint PDF has been shown to be far from isotropic 333Personal communication P. Bourdin
The most significant qualitative result of our simulations is that the PDF of the charged particles show Maxwellian distribution of velocities, or equivalently the tail of the PDF of energy is exponential. Earlier simulations using relativistic PIC codes (see e.g., Oka et al., 2010, figs. 4,5) have obtained the same result as ours for large plasma beta, but not for small plasma beta, where magnetic energy dominates over the thermal energy. Instead Drake et al. (2006) have found power-law tails in the PDF of energy. More recent similar simulations, e.g., Sironi & Spitkovsky (2014); Guo et al. (2014, 2015), have consistently found that the PDF of energy has a Maxwellian core superimposed with power-law tail with an exponent in the neighbourhood of . But such power-laws are found in “parameter regimes where the energy density in the reconnecting field exceeds the rest mass energy density” (Guo et al., 2014). Presumably, such high magnetic fields are not relevant for the solar corona. An understanding of the power-law tail typically requires exponential-in-time acceleration of the charged particles (see e.g. Drake et al., 2006) which is in in accord with the seminal work of Fermi (E. Fermi, 1949). As a counterargument, assume that the electric field, as seen by a charged particle, in a turbulent medium, has a very short correlation time and hence can be modelled as white noise. Then the solution to the problem is a random-walk in momentum-space which implies that energy (square of momentum) grows linearly with time and the PDF of speed would be Maxwellian. Both of these have been observed in numerical simulations of energization in time-periodic chaotic magnetic fields (Mitra et al., 2014). There are two crucial differences between our work and the above mentioned PIC simulations: (a) our flows are non-relativistic, (b) we use the test-particle approximation.
Simulations, where the test-particles are assumed to be relativistic although the flow obeys non-relativistic MHD equations, which further uses the quasi-stationary approximation, claim to have obtained exponential-in-time acceleration (Kowal et al., 2012) and power-law (del Valle et al., 2016) tail in the PDF of energy. Could it be that the periodic boundary conditions used in these simulations allow the charged particles to be repeatedly energised by the same reconnection regions and hence allows for exponential-in-time energisation and also a power-law spectrum? Furthermore, periodic boundary condition effectively makes the current sheet infinitely long and allows the possibility of the test-particle getting energised by repeated collision within the current sheet. To test this hypothesis, we have run two more simulations both with all the parameters same as our run C4 but the following differences: (C4a) with a box that is double in size along the directions parallel to the current sheet ( and direction); and (C4b) with periodic boundary conditions. The tail of the CDF of energy obtained using rank-order method for these two simulations are also plotted in Fig. 8. In both the cases we obtain the same qualitative result; the CDF has exponential tail, although quantitatively speaking the CDF of run C4 falls-off the fastest, followed by the case (C4a) above, followed by the case (C4b).
We conclude this section by pointing out the limitations of our work. We have used test-particles driven by MHD equations. The only way to go beyond test-particle approximation is to use particle-in-cell methods which have their own limitations. Furthermore, we have not used the oft-used quasi-stationary approximation but at a price. If we consider actual electrons or ion (e.g., proton) then in the corona the estimated Lorentz number would be of the order of a , in other words the typical gyrofrequency of the electron is approximately times the typical frequency (one over the time scale of largest eddies of turbulence) of the largest eddies of turbulence. It is impossible, even with the present state-of-the-art computing, to resolve such a wide range of time scales. So we have chosen to use the smallest Lorentz number that we could use which implies that our charged particles are effectively very heavy ions. This approximation is similar to the arbitrarily chosen charge-to-mass ratio of electrons in particle-in-cell codes. Another way out could be to use the guiding-center approximation for the test-particles.
4 Summary
To summarise, we have studied two problems in this paper. First we have studied reconnection in tearing-mode setup in three dimensions to find that in the absence of turbulence, reconnection follows Sweet-Parker scaling but for large enough turbulence it is possible to obtain fast reconnection. The topology of magnetic fields change in the presence of turbulence, developing more small scale structures. The current sheet fragments into plasmoids for both large turbulent intensities and for large Lundquist number. The density and characteristic length-scale of these islands depend more on the amplitude of the forcing (Fig. 2) than the Lundquist number. The fragmentation of the current sheet facilitates the formation of numerous reconnection sites and thus can make fast reconnection possible. Compared to earlier 2D simulations in a similar setup (Loureiro et al., 2009) the increase in reconnection rate due to turbulence is more pronounced in 3D than 2D. We also show that volume averaged magnetic energy dissipation rate can act as an useful proxy for the magnetic reconnection rate.
Next we have studied the energisation of test particles in this setup. We find that the test particles are indeed energised but the PDF of their speed can be described well by a Maxwellian distribution, hence we do not find a non-thermal population of particles. We also find that the PDF of the energised particles does not depend on temperature but rather on the strength of the reconnecting magnetic field. From this we can conjecture that if the strength of the reconnecting magnetic field is large enough – for example if the magnetic energy is significantly larger than the local thermal energy – the energised particles would be energised to energies larger than local thermal energies, although their PDF would still obey a Maxwellian distribution. Such a family of charged particles could be called suprathermal.
Acknowledgements
We thank the referee for constructive and pertinent suggestions. DM thanks Philippe Bourdin for useful discussion. We have use the software matplotlib to generate the figures in this paper (Hunter, 2007). After our paper was posted on the arxiv we obtained useful feedback which has been taken into account in this version. We would particularly like to thank Elisabete M. de Gouveia Dal Pino and Fan Guo. This work was supported in part by the Swedish Research Council Grant No. 638-2013-9243 (DM). We acknowledge the allocation of computing resources provided by the Swedish National Allocations Committee at the Center for Parallel Computers at the Royal Institute of Technology in Stockholm. A significant part of the work was done during DM’s stay in NCRA and during visits of RS and DO to Nordita. The financial support for these visits from NCRA and Nordita are gratefully acknowledged.
References
- Ambrosiano et al. (1988) Ambrosiano J., Matthaeus W. H., Goldstein M. L., Plante D., 1988, Journal of Geophysical Research: Space Physics, 93, 14383
- Beresnyak (2013) Beresnyak A., 2013, arXiv preprint arXiv:1301.7424
- Brandenburg (2001) Brandenburg A., 2001, ApJ, 550, 824
- Brandenburg & Dobler (2002) Brandenburg A., Dobler W., 2002, Comp. Phys. Comm., 147, 471
- Comisso & Bhattacharjee (2016) Comisso L., Bhattacharjee A., 2016, arXiv preprint arXiv:1609.02998
- Drake et al. (2006) Drake J., Swisdak M., Che H., Shay M., 2006, Nature, 443, 553
- E. Fermi (1949) E. Fermi 1949, Phys. Rev., 75, 1169
- Eyink et al. (2011) Eyink G. L., Lazarian A., Vishniac E. T., 2011, ApJ, 743, 51
- Fichtel & McDonald (1967) Fichtel C., McDonald F., 1967, Annual Review of Astronomy and Astrophysics, 5, 351
- Guo et al. (2014) Guo F., Li H., Daughton W., Liu Y.-H., 2014, Physical review letters, 113, 155005
- Guo et al. (2015) Guo F., Liu Y.-H., Daughton W., Li H., 2015, The Astrophysical Journal, 806, 167
- Higham (2001) Higham D., 2001, SIAM Review, 43, 525
- Hoshino (2012) Hoshino M., 2012, Physical review letters, 108, 135003
- Hoshino et al. (2001) Hoshino M., Mukai T., Terasawa T., Shinohara I., 2001, Journal of Geophysical Research, 106, 25979
- Huang & Bhattacharjee (2010) Huang Y.-M., Bhattacharjee A., 2010, Physics of Plasmas (1994-present), 17, 062104
- Huang & Bhattacharjee (2013) Huang Y.-M., Bhattacharjee A., 2013, Physics of Plasmas (1994-present), 20, 055702
- Hudson & Ryan (1995) Hudson H., Ryan J., 1995, Annual Review of Astronomy and Astrophysics, 33, 239
- Hunter (2007) Hunter J. D., 2007, Computing In Science & Engineering, 9, 90
- Jabbari et al. (2016) Jabbari S., Brandenburg A., Mitra D., Kleeorin N., Rogachevskii I., 2016, Monthly Notices of the Royal Astronomical Society, 459, 4046
- Klimchuk (2015) Klimchuk J. A., 2015, Philosophical Transactions of the Royal Society of London A: Mathematical, Physical and Engineering Sciences, 373
- Kowal et al. (2009) Kowal G., Lazarian A., Vishniac E., Otmianowska-Mazur K., 2009, ApJ, 700, 63
- Kowal et al. (2011) Kowal G., Dal Pino E. d. G., Lazarian A., 2011, ApJ, 735, 102
- Kowal et al. (2012) Kowal G., Dal Pino E. M. d. G., Lazarian A., 2012, Physical Review Letters, 108, 241102
- Lazarian & Vishniac (1999) Lazarian A., Vishniac E., 1999, ApJ, 517, 700
- Loureiro et al. (2007) Loureiro N., Schekochihin A., Cowley S., 2007, Physics of Plasmas, 14, 100703
- Loureiro et al. (2009) Loureiro N., Uzdensky D., Schekochihin A., Cowley S., Yousef T., 2009, Monthly Notices of the Royal Astronomical Society: Letters, 399, L146
- Mitra et al. (2005) Mitra D., Bec J., Pandit R., Frisch U., 2005, Phys. Rev. Lett, 94, 194501
- Mitra et al. (2014) Mitra D., Brandenburg A., Dasgupta B., Niklasson E., Ram A., 2014, Physical Review E, 89, 042919
- Moffatt & Hunt (2002) Moffatt H., Hunt R., 2002, in , Tubes, Sheets and Singularities in Fluid Dynamics. Springer, pp 125–132
- Oishi et al. (2015) Oishi J. S., Mac Low M.-M., Collins D. C., Tamura M., 2015, The Astrophysical Journal Letters, 806, L12
- Oka et al. (2010) Oka M., Phan T.-D., Krucker S., Fujimoto M., Shinohara I., 2010, The Astrophysical Journal, 714, 915
- Parker (1958) Parker E., 1958, Physical Review, 112, 1429
- Parker (1973) Parker E., 1973, The Astrophysical Journal, 180, 247
- Petschek (1964) Petschek H. E., 1964, NASA Special Publication, 50, 425
- Samtaney et al. (2009) Samtaney R., Loureiro N., Uzdensky D., Schekochihin A., Cowley S., 2009, Physical review letters, 103, 105004
- Sironi & Spitkovsky (2014) Sironi L., Spitkovsky A., 2014, ApJ, 783, L21
- Sweet (1958) Sweet P., 1958, in Lehnert B., ed., , Vol. Proc. IAU Symp. No 6, Electromagnetic Phenomena in Cosmical Physics. Cambridge Univ Press, p. 123
- Sweet (1969) Sweet P., 1969, Annual Review of Astronomy and Astrophysics, 7, 149
- Threlfall et al. (2016) Threlfall J., Bourdin P.-A., Neukirch T., Parnell C., 2016, Astronomy & Astrophysics, 587, A4
- Williamson (1980) Williamson J., 1980, Journal of Computational Physics, 35, 48
- Zenitani & Hoshino (2007) Zenitani S., Hoshino M., 2007, ApJ, 670, 702
- Zweibel & Yamada (2009) Zweibel E. G., Yamada M., 2009, Annual review of astronomy and astrophysics, 47, 291
- de Gouveia Dal Pino & Kowal (2015) de Gouveia Dal Pino E. M., Kowal G., 2015, in Lazarian A., de Gouveia Dal Pino E. M., Melioli C., eds, Astrophysics and Space Science Library Vol. 407, Astrophysics and Space Science Library. p. 373 (arXiv:1302.4374), doi:10.1007/978-3-662-44625-6˙13
- del Valle et al. (2016) del Valle M. V., Dal Pino E. d. G., Kowal G., 2016, Monthly Notices of the Royal Astronomical Society, 463, 4331