A search for neutrinos from fast radio bursts with IceCube
Abstract
We present a search for neutrinos in coincidence in time and direction with four fast radio bursts (FRBs) detected by the Parkes and Green Bank radio telescopes during the first year of operation of the complete IceCube Neutrino Observatory (May 2011 through May 2012). The neutrino sample consists of 138,322 muon neutrino candidate events, which are dominated by atmospheric neutrinos and atmospheric muons but also contain an astrophysical neutrino component. Considering only neutrinos detected on the same day as each FRB, zero IceCube events were found to be compatible with the FRB directions within the estimated 99% error radius of the neutrino directions. Based on the non-detection, we present the first upper limits on the neutrino fluence from fast radio bursts.
Subject headings:
neutrinos — radiation mechanisms: non-thermal1. Introduction
Fast radio bursts (FRBs) are a new class of astrophysical radio transients of very short (few millisecond) duration. The first was discovered in a 2007 analysis of archival data from the Parkes telescope (Lorimer et al., 2007). A total of 23 unique burst directions have now been detected by five different telescopes (Parkes, Arecibo, Green Bank, UTMOST, and ASKAP; Petroff et al. (2016)). One (and only one) of these directions has been found to repeat, producing at least 17 bursts at different times (Spitler et al., 2016; Scholz et al., 2016). The first claimed host identification and redshift (Keane et al., 2016) for an FRB was later shown to be an active galactic nucleus (Williams & Berger, 2016). However, after precise localization of the repeating burst by the VLA, an optical host galaxy was found (Chatterjee et al., 2017), and its redshift was determined to be 0.19 (Tendulkar et al., 2017). Given their rate of detection by radio surveys performed with relatively low exposure time and field of view, the rate of FRBs across the full (4) sky is estimated to be several thousand per day (Champion et al., 2016), about 10% of the core-collapse supernova rate (Murase et al., 2016).
The origin and emission mechanism of these bursts is unknown. Models have proliferated and include the birth of black holes from supramassive neutron stars (Falcke, H. & Rezzolla, L., 2014) and giant flares from magnetars (Pen & Connor, 2015). Their large dispersion measures indicate an extragalactic origin, but they could also originate in Galactic sources enshrouded in dense plasma (Loeb et al., 2014). Only one burst has been proven to repeat, and the same burst is the only one proven to be extragalactic. While the repetition rules out a cataclysmic model for that source, other bursts could be produced in cataclysmic scenarios. While leptonic emission is the default assumption in most models, hadronic emission mechanisms or association with hadronic emission regions are also possible, with implications for cosmic rays and neutrino emission (Li et al., 2014).
A 15-50 keV gamma-ray transient of 300 s duration, coincident with FRB 131104 with a statistical significance of 3 sigma, was reported by DeLaunay et al. (2016). No other afterglow or counterpart has been detected. If this is a genuine counterpart, the gamma-ray fluence is 6 orders of magnitude greater than the radio fluence, raising the energy budget for modeling the emission and for additional counterparts.
In addition to energy budget considerations, there are two additional constraints in modeling neutrino emission from FRBs: (1) the neutrino emission region must be dense enough in target matter or radiation to produce neutrinos, but not dense enough to absorb radio emission if it is produced in the same region; (2) it is difficult to cool hadrons quickly and thereby produce neutrino emission on short time scales. Nevertheless, target radiation fields and baryons are expected in the environment surrounding many possible FRB progenitors (Murase et al., 2016).
Because of their very short duration, prompt counterparts are most likely to be detected either by coordinated observation campaigns or serendipitously, in the latter case most likely by wide-field instruments. Because there is still so little known about the nature of fast radio bursts, it is essential to perform model-independent searches using a variety of wide-field instruments spanning multiple wavelengths and messengers.
IceCube is a cubic-kilometer neutrino detector located at the geographic South Pole. It consists of an array of 5160 digital optical modules encompassing a gigaton of ice as the active volume (IceCube Collaboration, 2017a). With sensitivity to all neutrino flavors over the full sky including both hemispheres, the IceCube detector enables a wide range of science (IceCube Collaboration, 2006).
IceCube has discovered a diffuse astrophysical neutrino flux between several TeV and several PeV (IceCube Collaboration, 2013a, b, 2014a, 2015a, 2015b, 2015c, 2016a). Many of the neutrino events originate far from the Galactic plane and are therefore likely to be extragalactic. Although the diffuse flux is detected with high statistical significance in multiple distinct detection channels, no evidence for discrete sources has been found, either in searches for clustering of the neutrinos or in cross-correlation with catalogs of source candidates (IceCube Collaboration, 2014b). The origin of the astrophysical neutrinos remains unknown. The majority of the astrophysical flux is not produced by gamma-ray bursts (IceCube Collaboration, 2012, 2015d, 2017b) or star-forming galaxies (Bechtol et al., 2017).
2. Neutrino Sample
The event sample used in this analysis is part of a multi-year data set optimized to search for point sources of astrophysical neutrinos. The event selection is described in detail in IceCube Collaboration (2014b). The first year of events and accompanying details (including the effective area of the event selection as a function of energy and declination) were recently released (IceCube Collaboration, 2016b). For each event, the data release includes the time of the event truncated to integer Modified Julian Day (MJD), the best-fit energy and direction, and an estimate of the direction uncertainty (50% containment radius).
The data set includes a total of 138,322 events from 333 days of livetime spanning May 2011 to May 2012 (MJD 55694 through 56062), with a roughly equal number of events from the northern and southern hemispheres. The data reduction and event reconstruction procedures are detailed in IceCube Collaboration (2014b). Events with declination greater than are considered “up-going” (northern hemisphere) events and are predominantly atmospheric neutrinos. “Down-going” (southern hemisphere) events reconstructed to originate from declination less than are dominated by cosmic-ray-induced atmospheric muons and high-energy muon bundles (multiple muons produced in the same extensive air shower).
As discussed in IceCube Collaboration (2014b), the event selection was performed separately for the northern and southern hemispheres with boosted decision trees. In the up-going region, the ice and the Earth act as a shield for atmospheric muons, so a high-purity neutrino sample with a wide energy range and low energy threshold is obtained. In the down-going region, high-energy neutrinos are also retained, but a high-purity neutrino sample cannot be as easily achieved due to the atmospheric muons. In order to bring the atmospheric muon contamination under control, a higher energy threshold was applied in the southern sky.
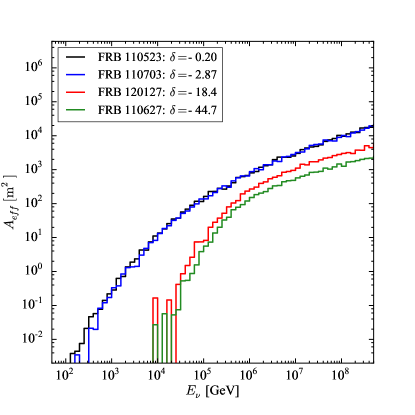
Figure 1 shows the muon neutrino effective area of the IceCube event selection as a function of energy in the direction of each FRB. At every energy the effective area is smaller in the southern sky than near the celestial equator due to the tight cuts necessary to reduce the cosmic-ray muon background in the southern sky. In the southern sky, fluctuations are visible in the effective area curves near the energy threshold ( 20 TeV), likely due to statistical fluctuations in the Monte Carlo used to calculate the curves.
The rate of detected events in the sample varies from day to day due to natural causes such as seasonal variation in the production of atmosphere neutrinos and muons (Tilav et al., 2010) and due to detector effects such as downtime. We estimated the size of possible downtime effects from the number of IceCube events detected on the day of each FRB. The event counts are (in time order of FRB occurrence) 423, 395, 342, and 465. Because the event count on each day is within 20% of the average count per day in the full sample (375), detector deadtime was likely not substantial on any of the FRB days.
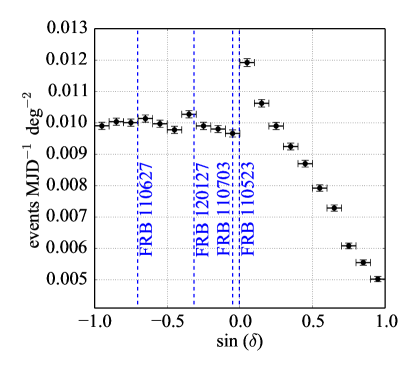
Figure 2 shows the event rate in this sample as a function of declination, averaged over right ascension and time during the year. Because of the higher energy threshold applied in the southern hemisphere to counteract the high atmospheric muon rate, the event rate varies by only a factor of 2 across the sky. The average rate is 0.009 events per square degree (roughly the area of the point-spread function) per day. Detection of a single event compatible with the direction of an FRB and detected on the same day as the FRB would therefore be interesting.
3. Coincidence search
Four FRBs have been detected in the year spanned by this IceCube event sample: FRB 110523 (Masui et al., 2015), FRB 110627, FRB 110703, and FRB 120127 (Thornton et al., 2013). Two are near the celestial equator and two are well south of it. Because the IceCube event times are truncated to integer MJD, temporal coincidence with these FRBs can only be tested on the one-day time scale. For each FRB, the radio burst detection time was truncated to integer MJD and the angular distance to each IceCube event on the same day was calculated. The localization error of each FRB is 0.2∘ or better (Thornton et al., 2013; Masui et al., 2015), negligible in this analysis.
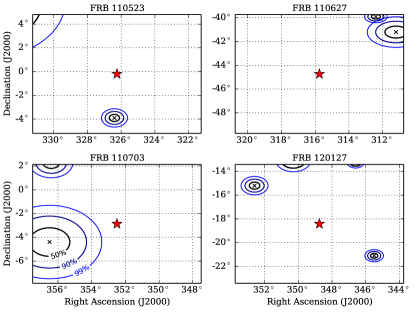
We assume for this search that the point-spread function for each event can be approximated by a radially symmetric two-dimensional Gaussian. Under this assumption, the radius of the 90% and 99% error circles can be determined from the 50% error circle by multiplying by a factor of 1.82 and 2.58, respectively. Figure 3 shows these error circles for coincident (on the same truncated MJD as the FRB) events near each of the FRBs. The nearest (relative to its error circle) coincident event is separated by 4.27∘ from FRB 110703 on MJD 55745, with a 50% angular error of 1.2∘.
4. Results and Conclusion
Because there is no IceCube event consistent with the time and direction of any of the four FRBs analyzed, we proceed to constrain the neutrino emission associated with each burst. Using the Poisson distribution, we construct a 90% confidence level upper limit on the neutrino fluence by finding the fluence that would produce on average 2.3 detected neutrinos.
The expected number of muon neutrinos detected from a source at zenith angle is
| (1) |
where is the neutrino flux at earth and is the IceCube effective area as a function of neutrino energy and zenith angle. We used the effective area corresponding to the event selection and selected for each FRB based on its declination (Figure 1). In order to constrain the neutrino flux, we assume the flux to be a power law given by
| (2) |
We set the normalization energy, , to 100 TeV and consider four different spectral indices ranging from 1.5 to 3. To calculate the expected number of events we perform the integral in Equation 1 from 1 TeV to 1 PeV in neutrino energy.
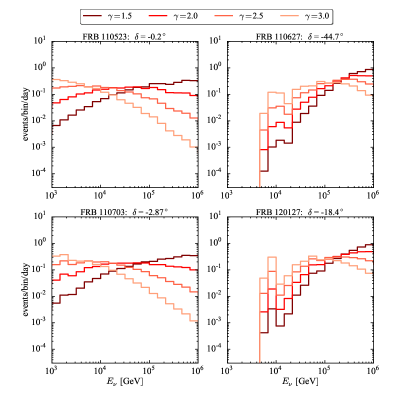
Figure 4 shows for each burst the distribution of event energies that IceCube would detect for various power-law neutrino spectra. The shape of each curve is determined by multiplying the flux by the effective area, and each curve is normalized to 2.3 total events, i.e. to the 90% confidence level upper limit on the expected number of events detected from the burst. As the figure shows, the tightest limits arise from the FRBs found near the celestial equator. This is a result of IceCube’s effective area peaking in this direction.
For the two bursts well south of the celestial equator, the effective area curves at these declinations have large fluctuations near 10 TeV, likely due to statistical uncertainty close to the energy threshold in the Monte Carlo used to determine the effective area. This is the cause of the fluctuations seen at 10 TeV in the right two panels of Figure 4.
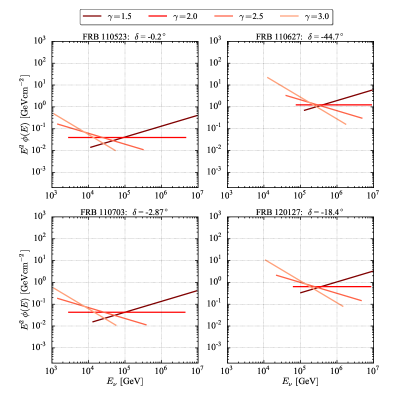
Figure 5 shows the corresponding time-integrated flux upper limits for several assumed spectral models for each FRB.
The neutrino fluence (time-integrated energy flux) is
| (3) |
where = 1 TeV and = 1 PeV. Table 1 shows the neutrino fluence upper limit for each burst for .
In the future, a more sensitive search can be performed for high-energy neutrinos from these and additional FRBs both by analyzing subsequent years of IceCube data and by using a looser event selection with greater effective area and greater background rate but on shorter time scales (extending from the one-day scale studied here over a range of scales all the way down to the intrinsic 10 ms FRB duration), similar to the strategy used for gamma-ray-burst neutrino searches (IceCube Collaboration, 2012, 2015d, 2017b). Furthermore, an IceCube search for lower-energy (MeV scale) neutrinos can be performed using an analysis strategy similar to that used for nearby supernovae (IceCube Collaboration, 2011).
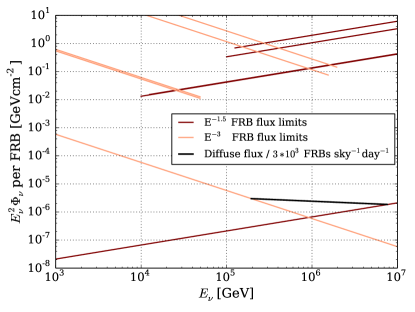
Using a complementary approach to derive an upper limit on the neutrino fluence per average FRB, we divide the all-sky diffuse neutrino flux by the all-sky FRB rate. The result is shown in Figure 6 and yields a more stringent upper limit than the per-burst analysis. Note that these two sets of upper limits test different hypotheses. The per-burst analysis tests whether there is significant neutrino emission from any particular burst, while the calculation using the diffuse neutrino flux treats all FRBs as a single homogeneous population. That is, if all FRBs across the sky (several thousand per day, the vast majority of which are not radio detected) were to produce a neutrino fluence saturating our per-burst upper limits, then they would produce a total diffuse astrophysical neutrino flux greater than that measured by IceCube.
Additional FRB observations are needed to determine whether there are sub-classes (e.g. repeating and non-repeating, or extragalactic and Galactic) of FRBs. Based on other astrophysical transients such as supernovae and gamma-ray bursts, sub-classes would not be surprising. The discovery of FRB sub-classes would bridge the gap between the two approaches by enabling searches for neutrino emission from individual sub-classes each with a lower rate than the total. It may be possible in the future to detect neutrino emission from a particular sub-class of FRBs.
In the absence of FRB sub-classes, stacking many FRBs in the future will enable even tighter constraints than those derived from the diffuse astrophysical neutrino flux. Interferometric arrays expected to begin operation in 2017 could detect 30 or more FRBs per day, or 104 per year (Rajwade & Lorimer, 2017). For short time windows approaching the radio emission duration (10 ms), an IceCube search stacking as many as to bursts will have a total background expectation of to events, and the constraints will become tighter than those derived directly from the diffuse neutrino flux.
Detection of a neutrino FRB signal in this analysis would have indicated a hadronic process, providing a strong constraint on FRB origins and emission mechanisms. It would have also constituted the first evidence for a high-energy astrophysical neutrino source. In the absence of a detection, we have calculated upper limits on each burst as well as a comparison to the total diffuse astrophysical neutrino flux. The expected onslaught of FRB detections in the near future will enable sensitive searches for neutrino emission by stacking thousands of bursts. We encourage theoretical work to provide quantitative predictions that can be tested by these searches.
| FRB | R.A. | Dec. | FRB MJD | Radio fluence (GeV cm-2) | Telescope | error (50%) | (GeV cm-2) | |
|---|---|---|---|---|---|---|---|---|
| 110523 | 21h45′ | -00∘12′ | 55704.63 | Green Bank | 3.70∘ | 0.3∘ | 0.184 | |
| 110627 | 21h03′ | -44∘44′ | 55739.90 | Parkes | 4.85∘ | 0.5∘ | 4.84 | |
| 110703 | 23h30′ | -02∘52′ | 55745.79 | Parkes | 4.27∘ | 1.2∘ | 0.184 | |
| 120127 | 23h15′ | -18∘25′ | 55953.34 | Parkes | 4.07∘ | 0.2∘ | 2.76 |
References
- Bechtol et al. (2017) Bechtol, K., Ahlers, M., Mauro, M. D., Ajello, M., & Vandenbroucke, J. 2017, The Astrophysical Journal, 836, 47. http://stacks.iop.org/0004-637X/836/i=1/a=47
- Champion et al. (2016) Champion, D. J., et al. 2016, Monthly Notices of the Royal Astronomical Society: Letters, 460, L30. http://mnrasl.oxfordjournals.org/content/460/1/L30.abstract
- Chatterjee et al. (2017) Chatterjee, S., Law, C. J., Wharton, R. S., et al. 2017, Nature, 541, 58
- DeLaunay et al. (2016) DeLaunay, J. J., Fox, D. B., Murase, K., et al. 2016, The Astrophysical Journal Letters, 832, L1. http://stacks.iop.org/2041-8205/832/i=1/a=L1
- Falcke, H. & Rezzolla, L. (2014) Falcke, H., & Rezzolla, L. 2014, Astronomy and Astrophysics, 562, A137
- IceCube Collaboration (2006) IceCube Collaboration. 2006, Astroparticle Physics, 26, 155 . http://www.sciencedirect.com/science/article/pii/S0927650506000855
- IceCube Collaboration (2011) —. 2011, Astron. Astrophys., 535, A109, [Erratum: Astron. Astrophys.563,C1(2014)]
- IceCube Collaboration (2012) —. 2012, Nature, 484, 351
- IceCube Collaboration (2013a) —. 2013a, Phys. Rev. Lett., 111, 021103. http://link.aps.org/doi/10.1103/PhysRevLett.111.021103
- IceCube Collaboration (2013b) —. 2013b, Science, 342, doi:10.1126/science.1242856
- IceCube Collaboration (2014a) —. 2014a, Phys. Rev. Lett., 113, 101101. http://link.aps.org/doi/10.1103/PhysRevLett.113.101101
- IceCube Collaboration (2014b) —. 2014b, The Astrophysical Journal, 796, 109. http://stacks.iop.org/0004-637X/796/i=2/a=109
- IceCube Collaboration (2015a) —. 2015a, Phys. Rev. D, 91, 022001. http://link.aps.org/doi/10.1103/PhysRevD.91.022001
- IceCube Collaboration (2015b) —. 2015b, Phys. Rev. Lett., 115, 081102. http://link.aps.org/doi/10.1103/PhysRevLett.115.081102
- IceCube Collaboration (2015c) —. 2015c, The Astrophysical Journal, 809, 98. http://stacks.iop.org/0004-637X/809/i=1/a=98
- IceCube Collaboration (2015d) —. 2015d, The Astrophysical Journal Letters, 805, L5. http://stacks.iop.org/2041-8205/805/i=1/a=L5
- IceCube Collaboration (2016a) —. 2016a, The Astrophysical Journal, 833, 3. http://stacks.iop.org/0004-637X/833/i=1/a=3
- IceCube Collaboration (2016b) —. 2016b, Search for point sources with the first year of IC86 data. IceCube Neutrino Observatory. Dataset, IceCube Neutrino Observatory. http://dx.doi.org/10.21234/B4159R
- IceCube Collaboration (2017a) —. 2017a, Journal of Instrumentation, 12, P03012. http://stacks.iop.org/1748-0221/12/i=03/a=P03012
- IceCube Collaboration (2017b) —. 2017b, ArXiv e-prints, arXiv:1702.06868
- Keane et al. (2016) Keane, E. F., et al. 2016, Nature, 530, 453. http://dx.doi.org/10.1038/nature17140
- Li et al. (2014) Li, X., et al. 2014, The Astrophysical Journal, 797, 33. http://stacks.iop.org/0004-637X/797/i=1/a=33
- Loeb et al. (2014) Loeb, A., Shvartzvald, Y., & Maoz, D. 2014, MNRAS, 439, L46
- Lorimer et al. (2007) Lorimer, D. R., et al. 2007, Science, 318, 777
- Masui et al. (2015) Masui, K., et al. 2015, Nature, 528, 523. http://dx.doi.org/10.1038/nature15769
- Murase et al. (2016) Murase, K., Kashiyama, K., & Mészáros, . 2016, Monthly Notices of the Royal Astronomical Society, 461, 1498. +http://dx.doi.org/10.1093/mnras/stw1328
- Pen & Connor (2015) Pen, U.-L., & Connor, L. 2015, The Astrophysical Journal, 807, 179. http://stacks.iop.org/0004-637X/807/i=2/a=179
- Petroff et al. (2016) Petroff, E., Barr, E. D., Jameson, A., et al. 2016, Publications of the Astronomical Society of Australia, 33, doi:10.1017/pasa.2016.35
- Rajwade & Lorimer (2017) Rajwade, K. M., & Lorimer, D. R. 2017, Monthly Notices of the Royal Astronomical Society, 465, 2286. +http://dx.doi.org/10.1093/mnras/stw2914
- Scholz et al. (2016) Scholz, P., Spitler, L. G., Hessels, J. W. T., et al. 2016, The Astrophysical Journal, 833, 177. http://stacks.iop.org/0004-637X/833/i=2/a=177
- Spitler et al. (2016) Spitler, L. G., et al. 2016, Nature, 531, 202. http://dx.doi.org/10.1038/nature17168
- Tendulkar et al. (2017) Tendulkar, S. P., Bassa, C. G., Cordes, J. M., et al. 2017, The Astrophysical Journal Letters, 834, L7. http://stacks.iop.org/2041-8205/834/i=2/a=L7
- Thornton et al. (2013) Thornton, D., et al. 2013, Science, 341, 53
- Tilav et al. (2010) Tilav, S., et al. 2010, arXiv:1001.0776
- Williams & Berger (2016) Williams, P. K. G., & Berger, E. 2016, The Astrophysical Journal Letters, 821, L22. http://stacks.iop.org/2041-8205/821/i=2/a=L22