The final publication is available at Springer via http://dx.doi.org/10.1007/978-3-319-54042-9_58
Poznań University of Technology
ul. Piotrowo 3A, 60-965 Poznań, Poland
{jan.wietrzykowski,michal.nowicki,piotr.skrzypczynski}@put.poznan.pl
Authors’ Instructions
Adopting the FAB-MAP algorithm for indoor localization with WiFi fingerprints
Abstract
Personal indoor localization is usually accomplished by fusing information from various sensors. A common choice is to use the WiFi adapter that provides information about Access Points that can be found in the vicinity. Unfortunately, state-of-the-art approaches to WiFi-based localization often employ very dense maps of the WiFi signal distribution and require a time-consuming process of parameter selection. On the other hand, camera images are commonly used for visual place recognition, detecting whenever the user observes a scene similar to the one already recorded in a database. Visual place recognition algorithms can work with sparse databases of recorded scenes and are in general simple to parametrize. Therefore, we propose a WiFi-based global localization method employing the structure of the well-known FAB-MAP visual place recognition algorithm. Similarly to FAB-MAP, our method uses Chow-Liu trees to estimate a joint probability distribution of re-observation of a place given a set of features extracted at places visited so far. However, we are the first who apply this idea to recorded WiFi scans instead of visual words. The new method is evaluated on the UJIIndoorLoc dataset used in the EvAAL competition, allowing a fair comparison with other solutions.
Keywords:
WiFi, indoor localization, FAB-MAP, Chow-Liu tree1 Introduction
Solving the self-localization problem is important for mobile robots, as the key component of autonomy. On the other hand, localization is also crucial for people, allowing them to find themselves in an unknown environment, and then efficiently navigate to the destination. Outdoor localization is mainly a solved problem since the introduction of the Global Positioning System (GPS). Unfortunately, the GPS signal is not available indoors, and therefore various solutions are developed to allow similar functionality in buildings. Especially interesting are solutions that do not require modifications to the existing infrastructure of buildings, allowing to introduce personal localization into existing sites (e.g. office buildings, shopping malls) easily and at a reasonable cost. Among the variety of existing approaches, the solutions relying only on the sensors of the ubiquitous mobile devices (e.g. smartphones) are the most appealing to the potential users. Nowadays, WiFi signals are available in most buildings that might be of interest for personal localization, whereas those signals can be received by every modern mobile phone or tablet. Thus, WiFi-based localization is of high practical importance. WiFi localization based on signal fingerprints is similar to visual place recognition when it comes to the underlying principles of data processing. Both classes of localization systems contain a pre-recorded database (called radio map for WiFi), and the current perception (image or signal scan for WiFi). Those data are compared to entries in the database to find similarity between the current perception and the places observed in the past. Therefore, we propose to adopt the statistical learning mechanism by means of the Chow-Liu tree [1], which was proven successful in the FAB-MAP algorithm to WiFi fingerprints used as features that describe unique places. We believe that the resulting method should be able to better understand the influence of information contained in the appearance of WiFi Access Point (AP) in the scan for localization purposes, than the already known algorithms for WiFi-based indoor localization.
2 Related work
Typical mobile devices are equipped with a variety of sensors: accelerometers, gyroscopes, magnetometers, cameras and WiFi/Bluetooth adapters. Due to the limited precision of each sensing modality, the best localization results are obtained when information from different sensors is fused. The inertial sensors are usually combined to create Attitude and Heading Reference System (AHRS) [2], which outputs the orientation of the device. The camera is also a useful sensor, as it enables to perceive the surroundings in a way similar to human perception. Processing a continuous stream of images allows the localization system to estimate pose by means of Visual Odometry (VO), which can be computed in real-time on a mobile device [3], but the process is computationally demanding and thus has a negative impact on the battery life. Alternatively, the images can be processed at discrete poses to detect if the camera observes an already visited location or a place from a pre-recorded database describing the environment [4]. Visual place recognition systems allow obtaining a global position estimate without much computational burden. The FAB-MAP algorithm [5] is a state-of-the-art solution proven in challenging environments. It learns the frequency of occurrence of similar (visual) features and co-occurrence of those features in order to obtain robust place recognition results.
In WiFi-based localization, the state-of-the-art is WiFi fingerprinting [6], which assumes that it is possible to obtain a precise and dense map of scans in known locations (radio map). During the localization phase, a WiFi scan is compared to the scans stored in the radio map, finding best matches according to the chosen metrics. To obtain the final position of the user, the positions of best matches (nearest neighbors) from the radio map are averaged without or with additional weights, thus this algorithm is called kNN or wkNN [6]. Moreover, when the localization task assumes the existence of multiple buildings and/or floors, the WiFi-based method estimates at first the building, next the floor, and then performs the localization procedure described above. The fingerprinting approach with careful, manual tuning achieves precise localization results, as can be seen in the annual localization challenge at the Indoor Positioning and Indoor Navigation (IPIN) conference [7]. The lengthy and sometimes cumbersome process of manual tuning in the fingerprinting approach encourages researchers to look for a machine learning solution to the WiFi-based localization. The existing machine learning approaches to WiFi fingerprinting include using Gaussian processes [8], neural networks [9], and random forests [10]. So far these approaches provide worse localization results than the best wkNN-based solutions. However, we have already demonstrated [11] that combining WiFi fingerprinting and visual place recognition can be beneficial, as those systems can be joined to operate in locations, where one of the systems might fail due to the lack of WiFi signals or due to the limited visual information being available. This paper extends this line of research investigating if a machine learning approach successfully used in visual place recognition may be directly adopted to WiFi fingerprints.
3 Adopting FAB-MAP to WiFi features
FAB-MAP [5] was designed especially to perform loop-closing for SLAM (Simultaneous Localization and Mapping) in robotics, and therefore was developed with scalability and robustness in mind. The algorithm is based on a probabilistic model that describes the probability that an already visited place is being observed, given a set of all feature vectors extracted at places visited so far (including the present one). This model enables to determine whether a new place is being visited, or a place visited in the past is re-observed. Although such interpretation of the model is suitable for the above-mentioned loop-closing problem, the task of estimating user position for indoor localization requires a different view. If we substitute the collection of already visited places with a database of known locations pin-pointed to a floor map, we get a probability distribution of the user position in this map. This idea is exploited in our recent work [4].
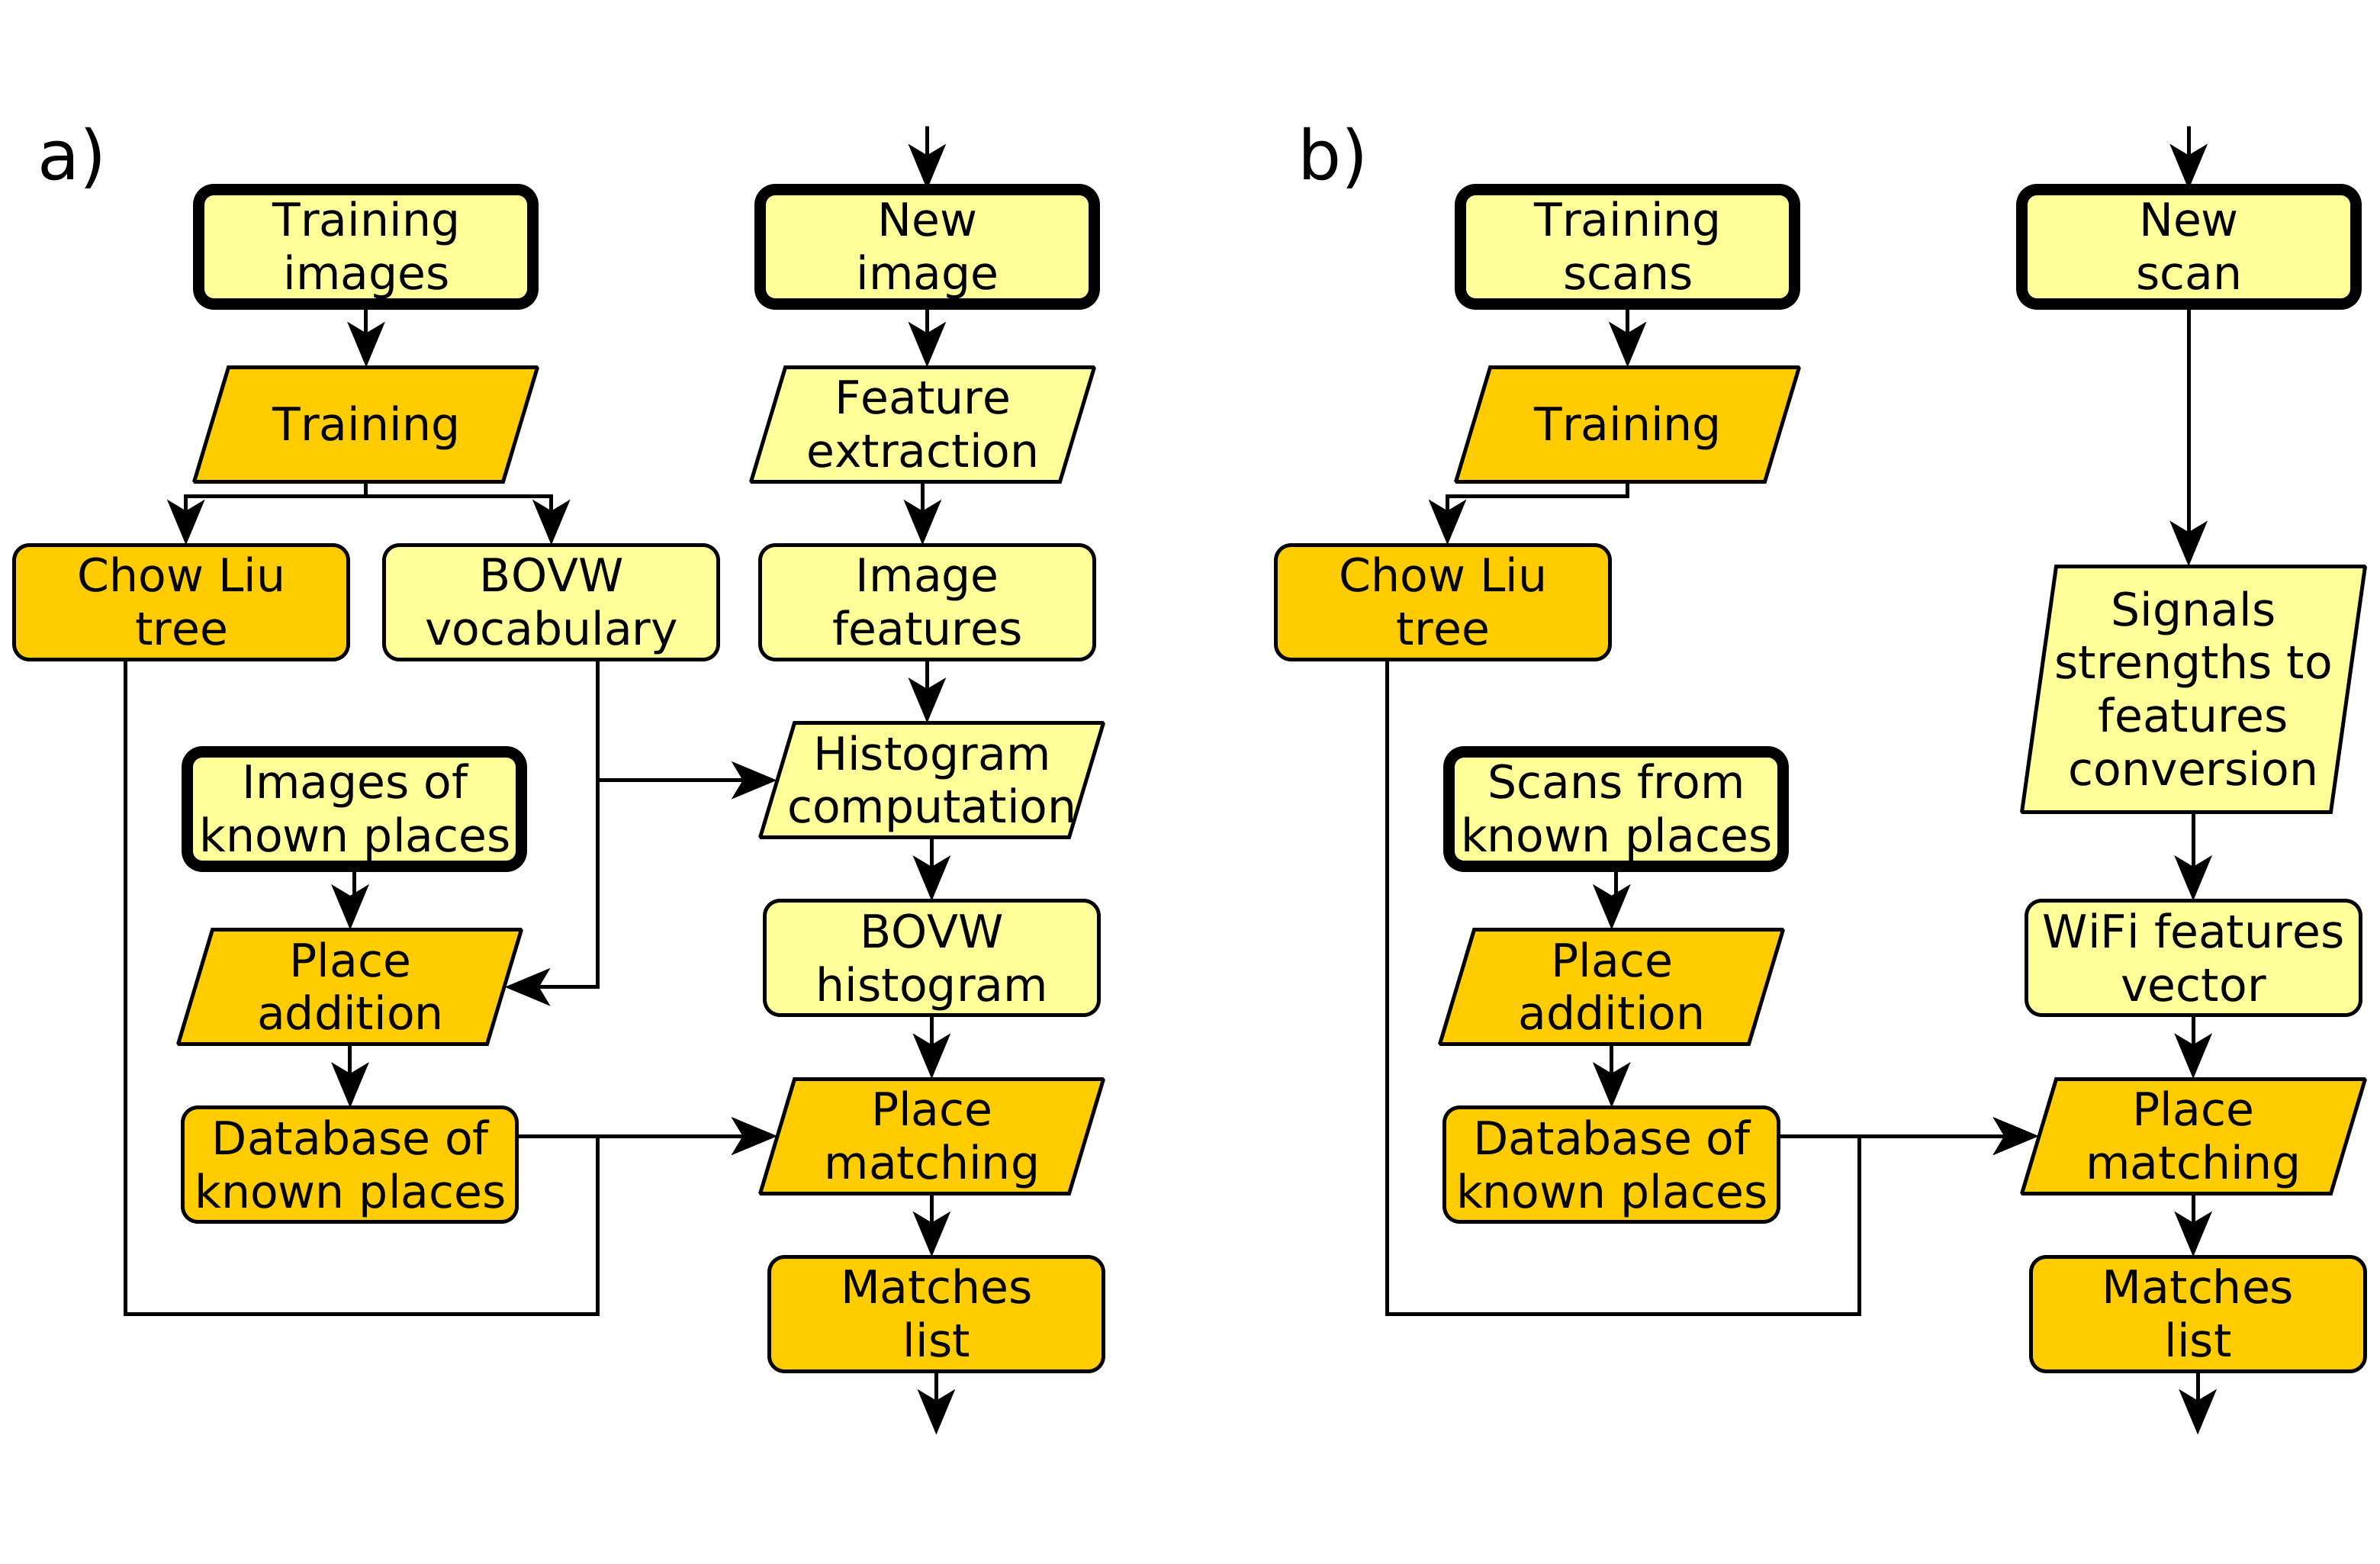
Our solution is based on the FAB-MAP and exploits the probabilistic inference mechanism implemented in the original algorithm. The differences come from the entirely different characteristics of locations we exploit: WiFi signal scans instead of point-like visual features. This caused substantial changes to the approach, which is used to create the vector of features, and to the training phase of the algorithm. A comparison of the block schemes for both algorithms is depicted in Fig. 1. In the FAB-MAP algorithm, the Bag of Visual Words (BOVW) representation of visual (point) features is used to characterize -th image/location . The BOVW vector is a histogram of visual words occurrences in an image, where the vocabulary is learned by clustering salient features extracted from training examples. The probabilistic model associates each histogram bin with a random variable . If the -th bin is zero, which means that the feature wasn’t detected on the image, then is set to 0, in the opposite case is set to 1. To separate a location model from the model of dependencies between features the hidden variables were introduced. These variables indicate whether a feature is present in the image. Note that the presence of a feature does not imply detection of this feature, because detectors are not perfect [12]. It is not uncommon that features are not detected despite their presence and that they are detected while being absent.
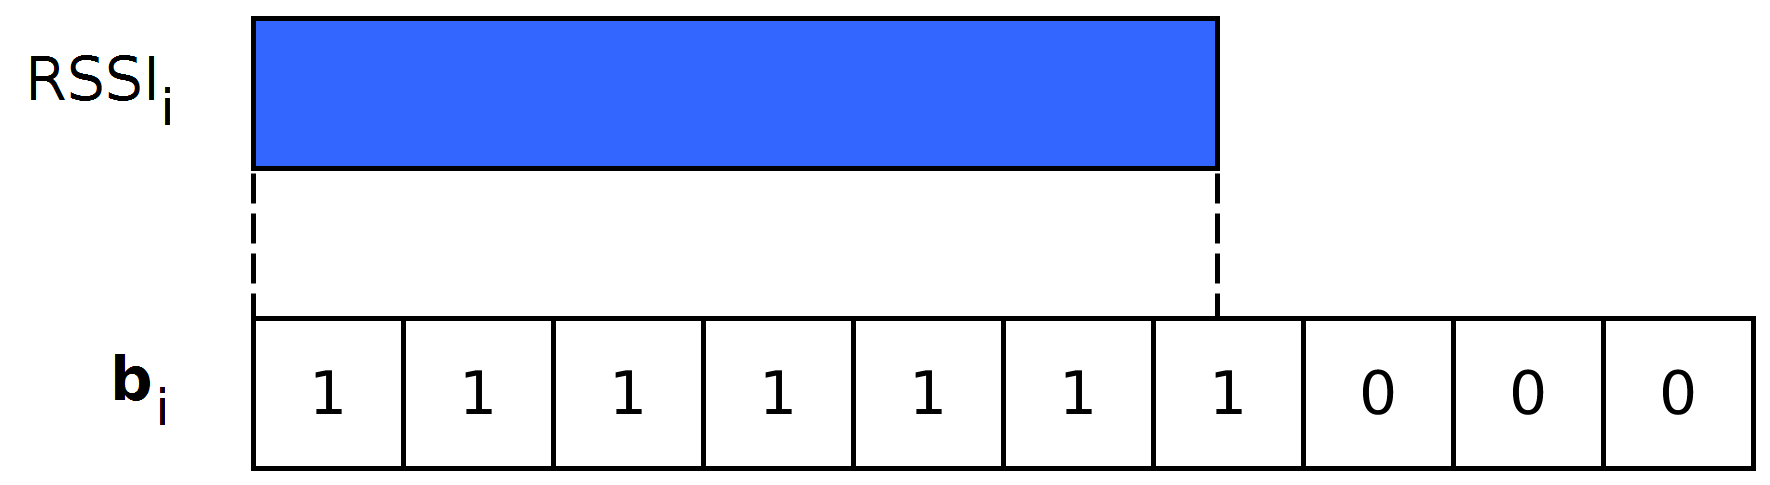
The main idea of place recognition based on WiFi scans is to employ vector features related to the WiFi signal measurements (scans) in place of the BOVW vectors (histograms). Since FAB-MAP maps each feature onto a binary representation, a proper conversion of a WiFi scan was necessary to get the most of the descriptive power out of it. A natural idea that comes to mind is to construct a vector of the networks’ presence in the current scan with the value indicating an absence of the -th network, and indicating presence of this network. This vector should contain for every network, identified by its unique BSSID number, present in the considered area. Unfortunately, such a conversion throws away all information about the strength of the signal (RSSI), which may be beneficial to the ability to discriminate different locations with a similar pattern of networks presence. Thus, we decided to extend the vector , so for every possible network, it contains bins forming a sub-vector for -th network. Each bin has an associated threshold and whenever the signal strength (expressed in dBm) of the -th network exceeds this threshold, its value is set to 1. Thresholds were uniformly distributed in range with a step (bin width) of 10 dBm. If a network is not present in the current scan, then all bins contain 0. This process is illustrated in Fig. 2.
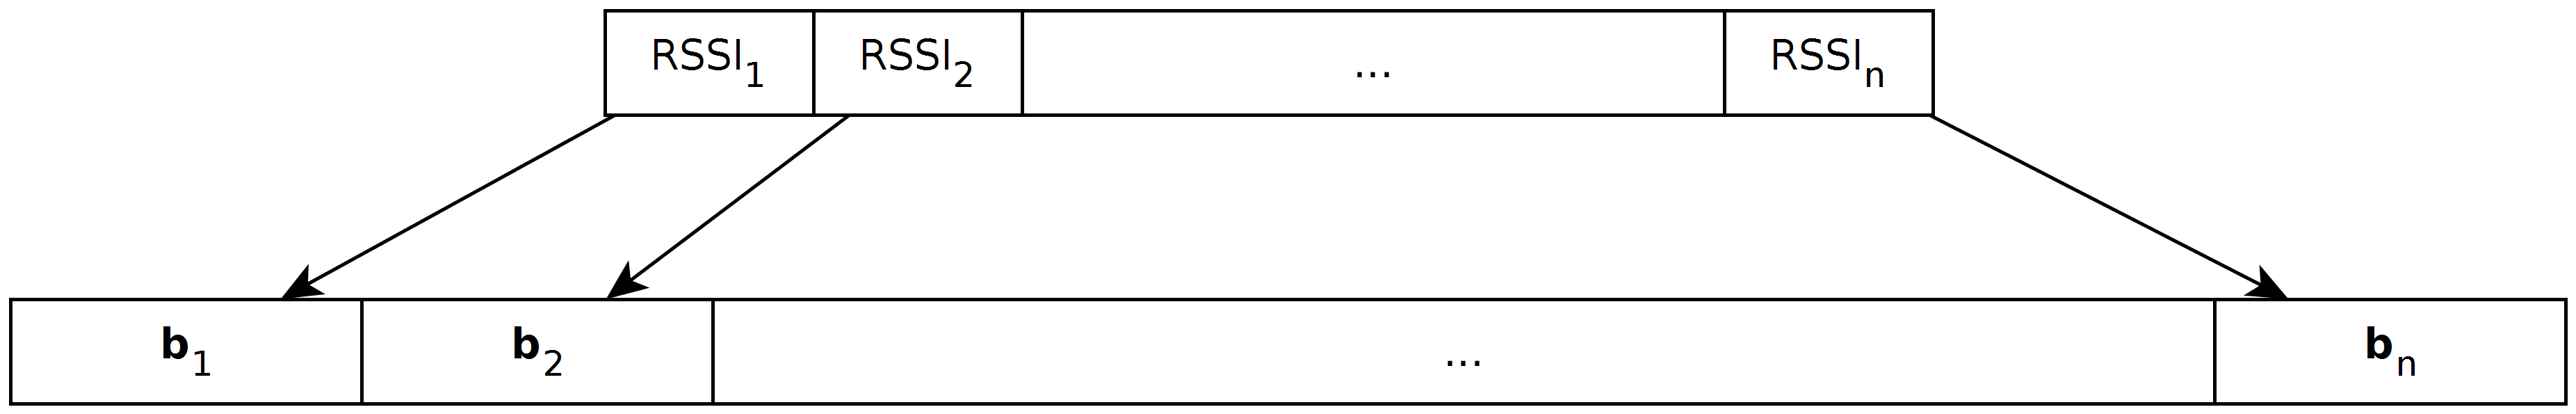
The final feature vector is a concatenation of all vectors. A schematic overview of the feature vector extension is presented in Fig. 3.
The FAB-MAP algorithm requires training phase prior to operation. The training phase consists of the Chow-Liu tree training step and construction of a database of known places that are going to be recognized. Given a dataset of scans made at various places in which multiple scans are taken at the same location, we had to split it into two datasets: one characterizing the environment and containing scans taken at disjoint locations for Chow-Liu tree training, and another one containing scans that will form a database of known places. We used DBScan [13] algorithm with parameters and to divide the input dataset into clusters of scans taken at one location. The parameter bounds the distance in which neighbors are searched, while MinPts denotes the minimum number of scans that are allowed to form a cluster.
A random scan drawn from each cluster was used to characterize the environment, whereas 10 other scans (also drawn at random) were used to construct the database of known places. It was necessary to use only 10 scans captured at a single location in order to balance the dataset, because at some locations there were many scans, while at others only a few. It caused locations with more scans to be favoured over locations with fewer scans.
A proper place recognition can take place after the training phase. Given a list of detected networks with BSSIDs and signal strengths for each of them, a feature vector is computed and feed to the FAB-MAP-like recognition procedure. The procedure returns a list of matches with a probability assigned to every location from the database of known places. We assume that the location with the highest probability is the current user location in the map.
OpenFABMAP [14], a publicly available C++ implementation of the FAB-MAP algorithm was used as the basis for our place recognition system. We made our code also publicly available through the GitHub platform 111https://github.com/LRMPUT/WiFi-FAB-MAP.git.
4 Experimental data
Another important part of designing a machine learning system is to properly evaluate the proposed solution. Of no less importance is the ability to compare the results to the state-of-the-art approaches. Therefore, we decided to use the UJIIndoorLoc [15] dataset, which is a database of WiFi scans captured at three buildings of Universitat Jaume I in Madrid, Spain. The area at which scans were taken covers almost 11000 m2 and contains 13 different floors. A wide range of devices (25) and multiple users guarantee a diversity of scans origin. The database consists of 19937 training and 1111 validation examples. For each example, information about detected WiFi networks along with their signal strength in dBm, longitude, latitude, building ID and floor number is attached. This information enabled us to set up an experiment to evaluate the efficiency of our system. Unfortunately, the original testing examples used in the EvAAL competition at IPIN 2015 [7] are not publicly accessible, therefore we used a part of the training dataset in the validation procedure, and treated the validation dataset as a test set. It is worth noting that the training dataset was collected approximately 4 months prior to the collection of validation and testing datasets. Moreover, the datasets were collected by different users and using different mobile devices. All that makes the estimation of user location a challenging task, especially taking into consideration that we were forced to use similar datasets in both the training and validation steps, which often brings a risk of overfitting the parameters.
5 Parameter tuning
An important property of machine learning algorithms is an ability to automatically estimate parameter values used in the algorithm on the basis of training examples. Nevertheless, usually there are few meta-parameters that have to be set prior to the training procedure.
Although these meta-parameters are often set manually by the system designer using his experience and observing the system behaviour, we have decided to automatize this process by using grid search and the validation dataset. In the FAB-MAP algorithm, there are two parameters that have a substantial influence on the system behaviour, namely PzGe and PzGne. These are detector model parameters and determine the , and quantities. The balanced training dataset containing 10 scans for each location was divided into two parts: subtraining and validation. The subtraining set was used to construct a database of known places while the validation one was used to evaluate the current parameter values. The space of parameters was extensively explored by using grid search with an exponential step. The PzGe parameter values were swept from to with a step of exponential function argument equal to and PzGne values from to with the same step size. The use of exponential steps is motivated by a wide-spread application of the exponential family in probabilistic modeling [16].
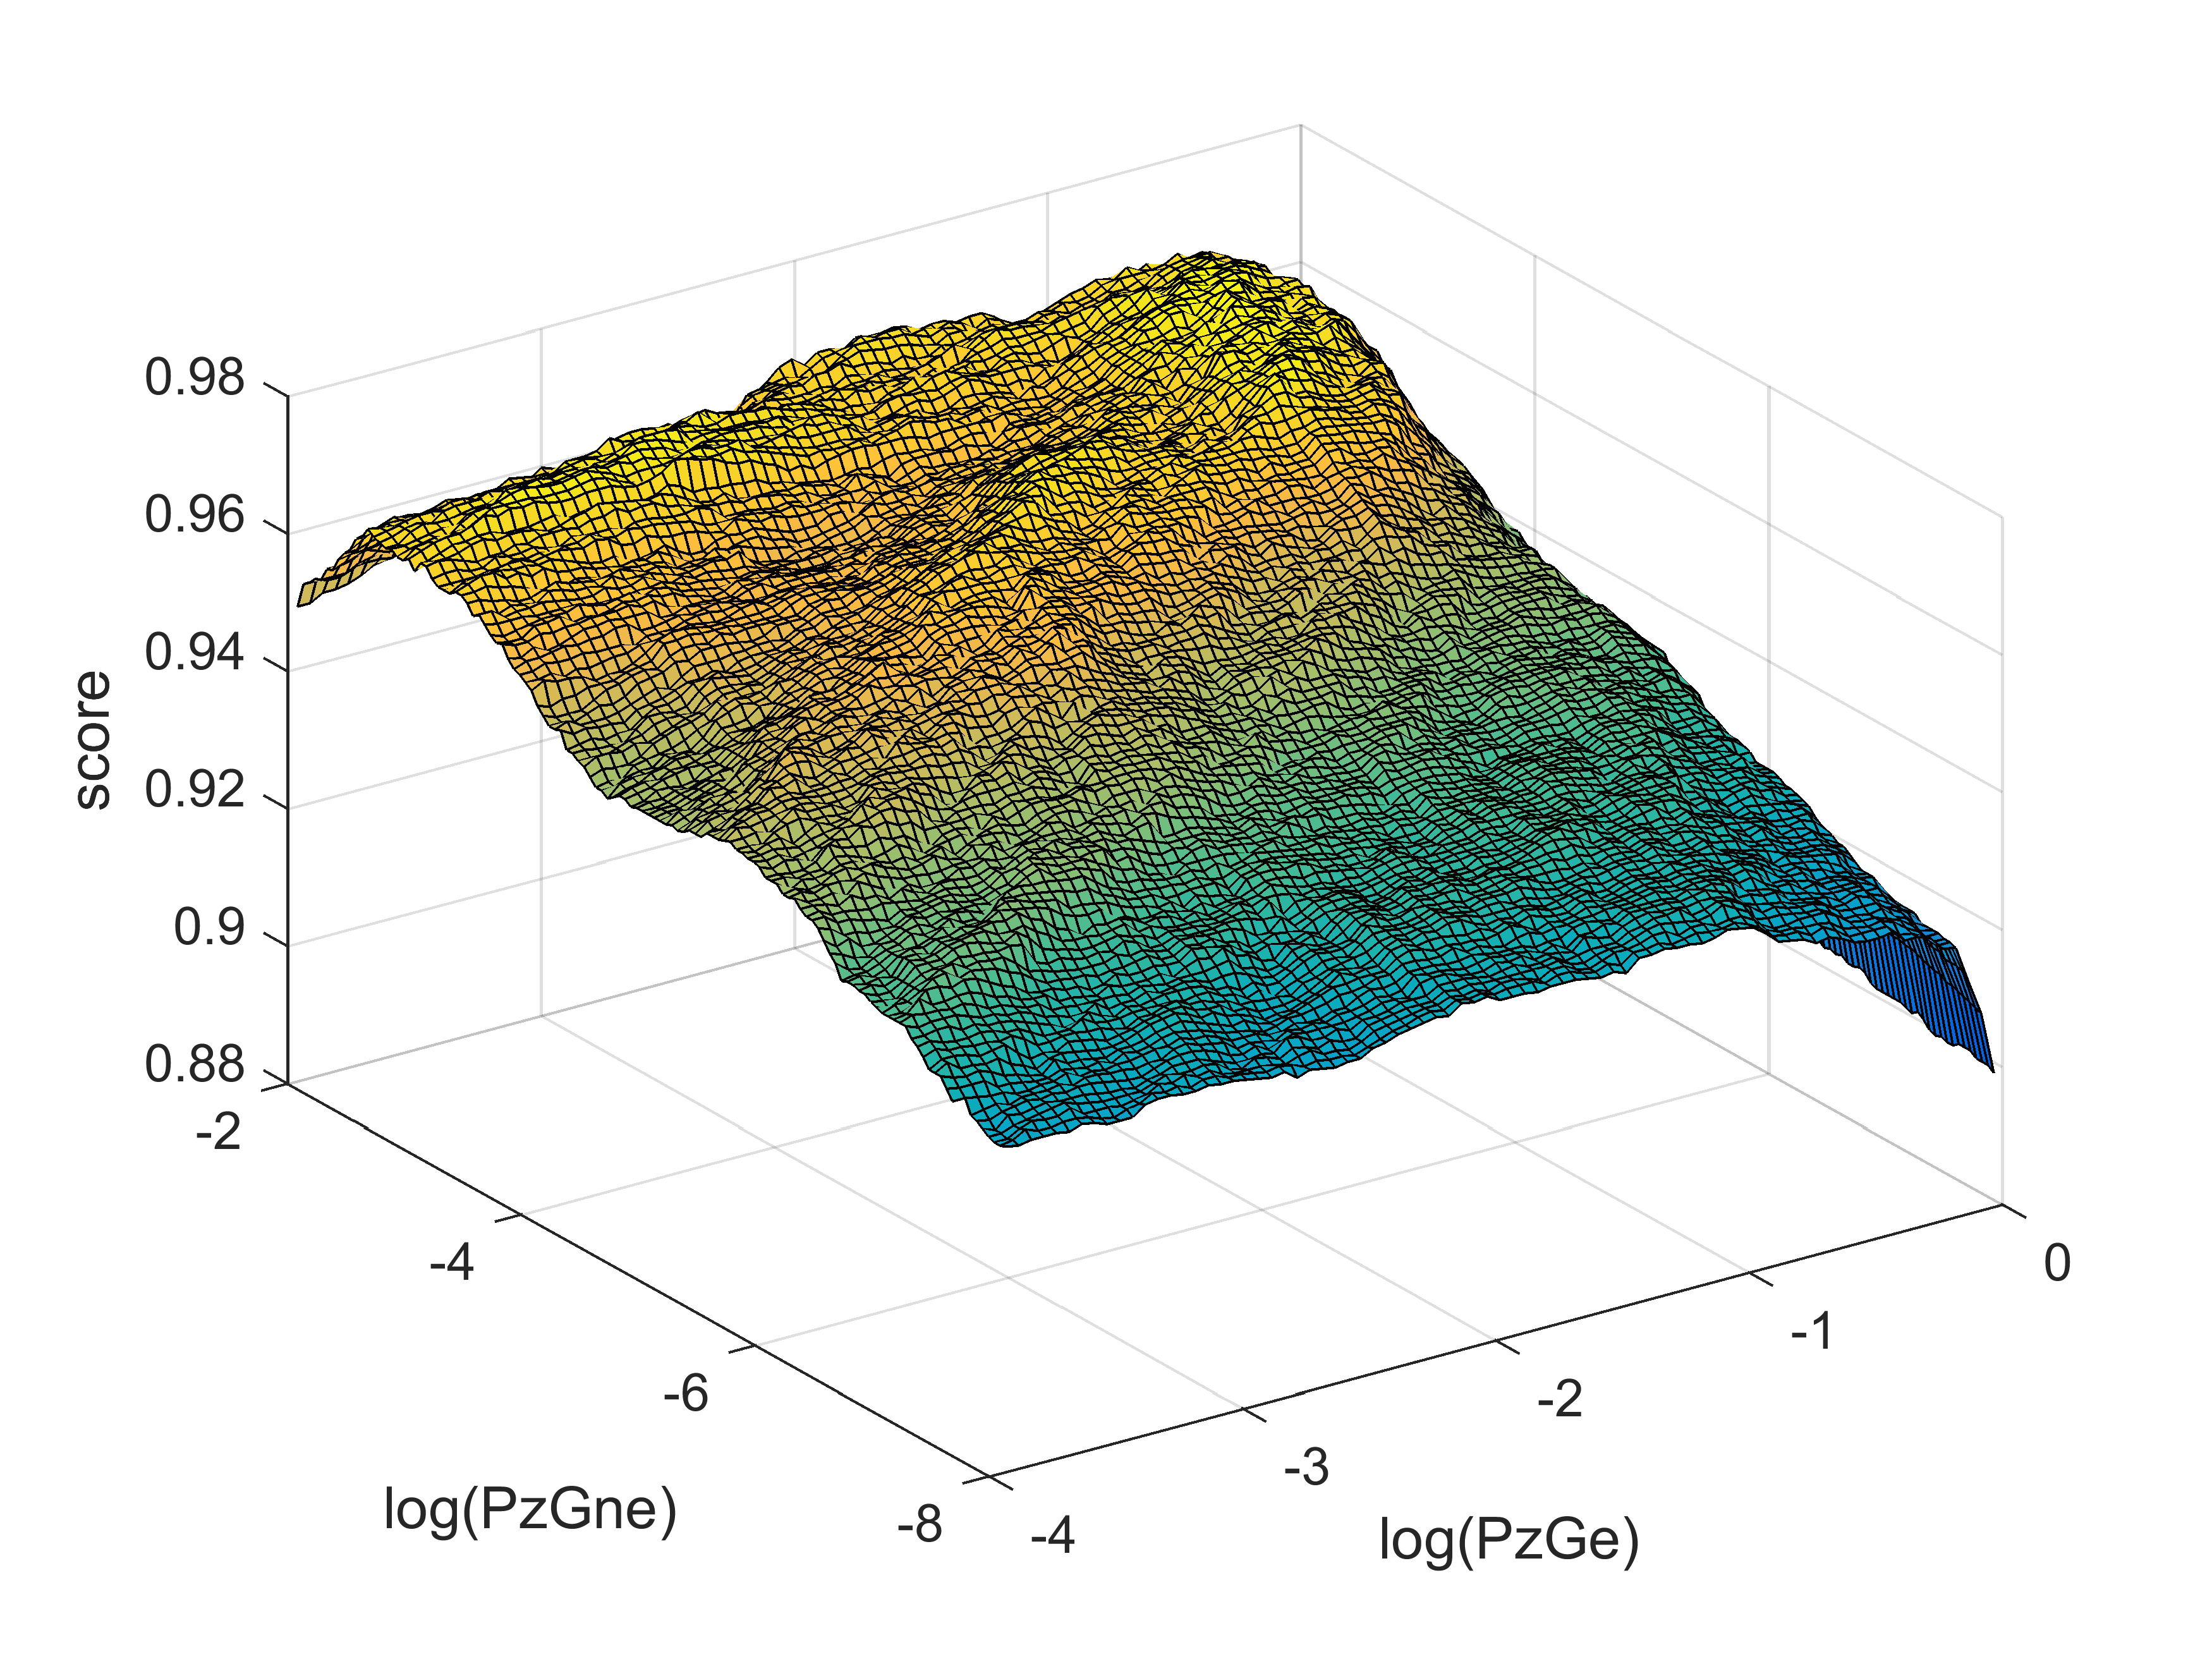
In the evaluation procedure, we used the accuracy of predicting a correct floor and a correct building at the same time as the score measure. Such prediction of the user location may seem imprecise, but it is often the case when coarse positioning is done by one algorithm and the fine position is computed by another one. The results of the parameter tuning procedure are presented in Fig. 4. Since there are only two parameters, it was convenient to plot a surface to visualize the influence of these parameters on the recognition accuracy. Finally, the best parameters were determined as PzGe = 0.31 and PzGne = 0.043.
6 Experimental evaluation
During experimental evaluation we computed score for every tested configuration. The score was the accuracy of correctly predicting the building and the floor at the same time. The prediction was considered correct if a building ID and floor number of the matched location from the database of known places were the same as the building ID and floor number of the example. Additionally, we calculated the mean distance error among the correctly classified examples using formula:
| (1) |
where is a set of correctly classified examples, is a position of -th example in meters, and is a position of the matched location from database of known places.
| Bin width | PzGe | PzGne | score | [m] |
|---|---|---|---|---|
| 5 | 0.3135 | 0.0429 | 0.82 | 9.99 |
| 5 | 0.3135 | 0.0043 | 0.89 | 8.50 |
| 5 | 0.3135 | 0.0004 | 0.92 | 8.55 |
| 10 | 0.4916 | 0.0550 | 0.81 | 9.96 |
| 10 | 0.4916 | 0.0055 | 0.89 | 8.21 |
| 10 | 0.4916 | 0.0006 | 0.91 | 8.40 |
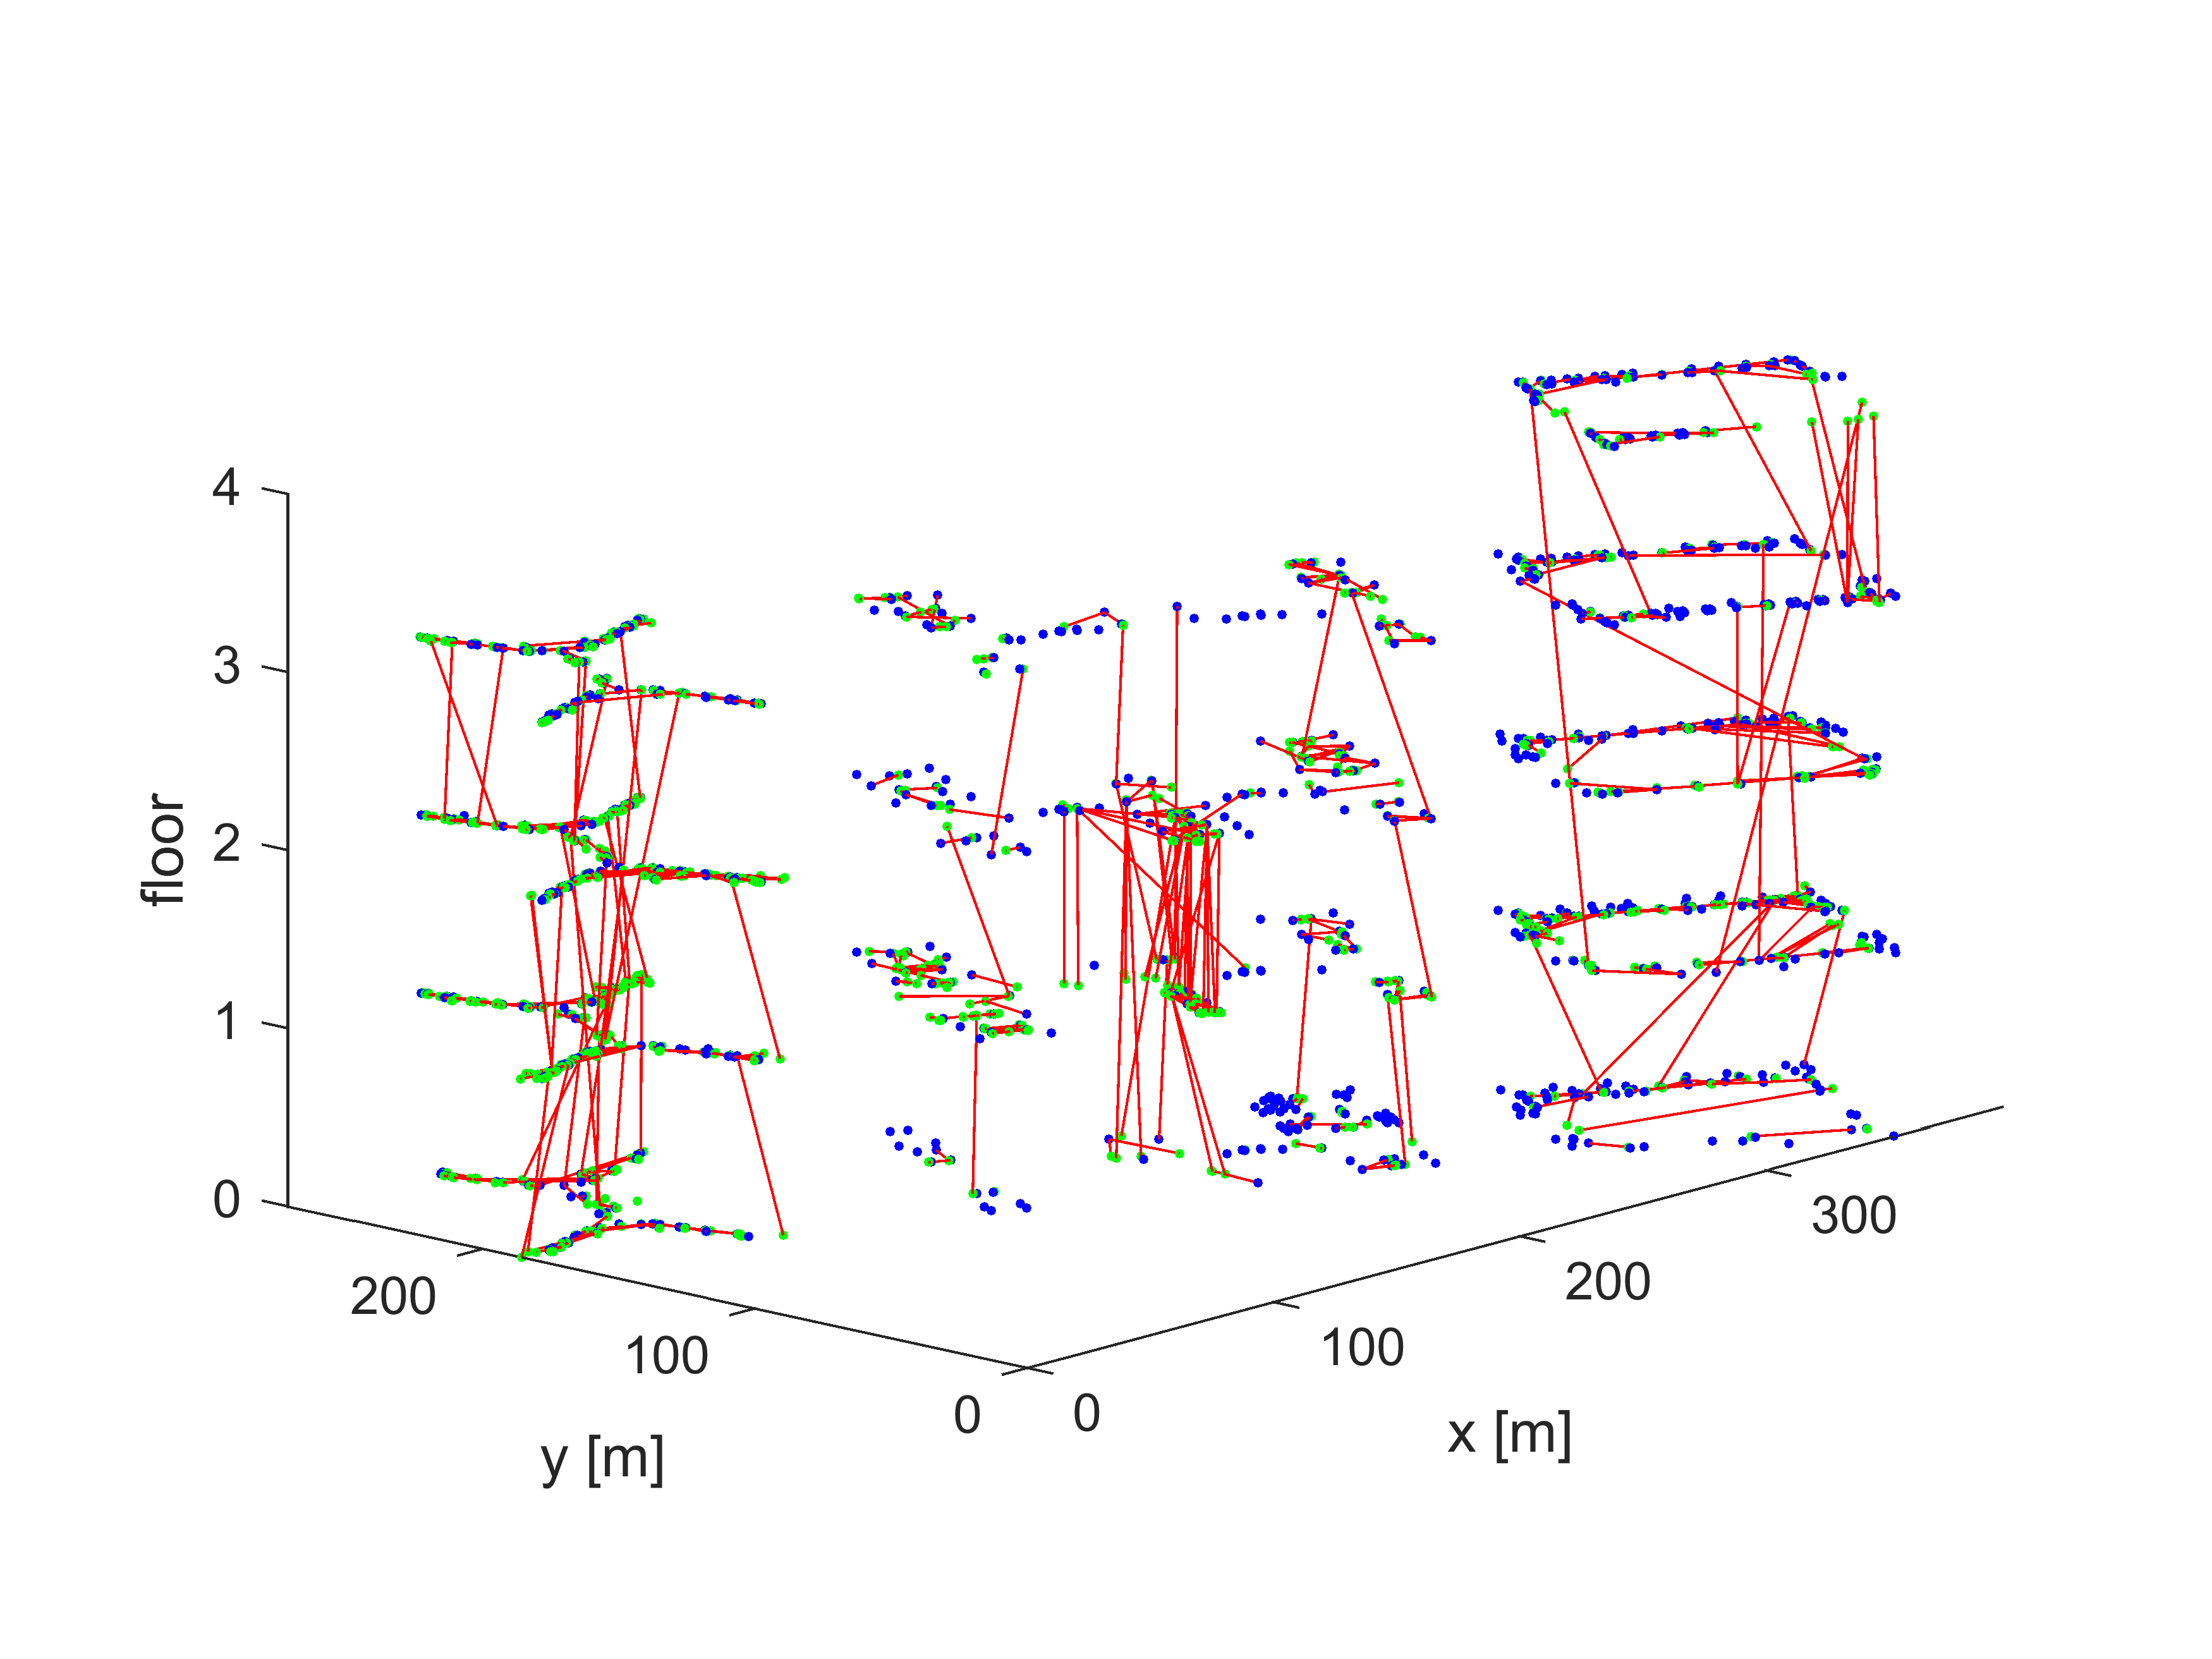
The results of the experimental evaluation are gathered in Tab. 1. We tested parameters obtained in a validation procedure as well as parameters with lowered PzGne values. The decision to test lower values of PzGne was motivated by the fact that in the case of WiFi scans it is rather unlikely to not detect a network that is in the range of a device, and we were not in a possession of a proper dataset for the validation procedure. In Fig. 5 we plotted location matches for all examples from the testing dataset. Red lines connect locations of examples with matched locations from the database of known places. Most of the matches are invisible because they are very short, but the rest indicate that frequent mistakes are floor mismatches. Locations that are above or below the true location are prone to be wrongly matched, which is expected as the WiFi signal easily penetrates the ceiling separating floors.
7 Conclusions
We proposed and tested a novel WiFi fingerprinting method which adopts the FAB-MAP algorithm, originating from the visual appearance-based place recognition. The key part of the algorithm adoption is the new method of feature vectors generation from a list of detected WiFi networks. Another relevant contribution of this paper is the procedure for preparation of the training data for the Chow-Liu tree and for the database of known places. The solution was evaluated on a challenging, publicly available dataset and proved to provide satisfactory results. To fully exploit the automated pipeline of the system tuning a proper validation dataset would be needed. Only by examining the score on examples that were collected independently, under different conditions the parameter tuning procedure would be enabled to find parameter values that are not overfitted. As it comes to the influence of bin width, the difference between dividing the signal strength range into 22 (bin width of 5) or 11 (bin width of 10) intervals can be neglected, justifying the use of larger bins for computation efficiency.
Future work will focus on locating the user or robot using WiFi data clusters much smaller than whole floors. Knowledge of the corridor in which a device is located often can be sufficient for indoor navigation when combined with other premises about the user position [17]. We also plan to implement a more detailed location model than the one available in OpenFABMAP.
Acknowledgements
This research was funded by the National Science Centre in Poland in years 2016-2019 under the grant 2015/17/N/ST6/01228. This work was also partially supported by the Poznań University of Technology grant DSPB/0148
References
- [1] C. K. Chow and C. N. Liu. Approximating discrete probability distributions with dependence trees. IEEE Transactions on Information Theory, 14(3):462–467, 1968.
- [2] J. Gośliński, M. Nowicki, and P. Skrzypczyński. Performance comparison of EKF-based algorithms for orientation estimation on Android platform. IEEE Sensors Journal, 15(7):3781–3792, 2015.
- [3] M. Fularz, M. Nowicki, and P. Skrzypczyński. Adopting feature-based visual odometry for resource-constrained mobile devices. In A. Campilho and M. Kamel, editors, Image Analysis and Recognition, volume LNCS 7324, pages 431–441. Springer, 2014.
- [4] M. Nowicki, J. Wietrzykowski, and P. Skrzypczyński. Experimental evaluation of visual place recognition algorithms for personal indoor localization. In Proc. Int. Conf. on Indoor Positioning and Indoor Navigation (IPIN), Madrid, 2016.
- [5] M. Cummins and P. Newman. Appearance-only SLAM at large scale with FAB-MAP 2.0. International Journal of Robotics Research, 30:1100–1123, 2011.
- [6] P. Bahl and V. N. Padmanabhan. RADAR: an in-building RF-based user location and tracking system. In Proc. INFOCOM 2000. Nineteenth Annual Joint Conference of the IEEE Computer and Communications Societies., volume 2, pages 775–784, 2000.
- [7] A. Moreira, M. J. Nicolau, F. Meneses, and A. Costa. WiFi fingerprinting in the real world - RTLS@UM at the EvAAL competition. In Proc. Int. Conf. on Indoor Positioning and Indoor Navigation (IPIN), pages 1–10, Banff, 2015.
- [8] R. Miyagusuku, A. Yamashita, and H. Asama. Improving Gaussian Processes based mapping of wireless signals using path loss models. In Proc. IEEE/RSJ Int. Conf. on Intelligent Robots and Systems, pages 4610–4615, Daejeon, 2016.
- [9] E. Mokand and B. Cheung. An improved neural network training algorithm for WiFi fingerprinting positioning. ISPRS International Journal of Geo-Information, 2(3):854, 2013.
- [10] Y. Beer. WiFi fingerprinting using bayesian and hierarchical supervised machine learning assisted by GPS. In Proc. Int. Conf. on Indoor Positioning and Indoor Navigation (IPIN), Madrid, 2016.
- [11] M. Nowicki. WiFi-guided visual loop closure for indoor localization using mobile devices. Journal of Automation, Mobile Robotics & Intelligent Systems, 8(3):10–18, 2014.
- [12] A. Schmidt, M. Kraft, M. Fularz, and Z. Domagala. The comparison of point feature detectors and descriptors in the context of robot navigation. Journal of Automation, Mobile Robotics & Intelligent Systems, 7(1):11–20, 2013.
- [13] M. Ester, H.-P. Kriegel, J. Sander, and X. Xu. A density-based algorithm for discovering clusters in large spatial databases with noise. In Proc. 2nd Int. Conf. on Knowledge Discovery and Data Mining, pages 226–231, 1996.
- [14] A. Glover, W. Maddern, M. Warren, S. Reid, M. Milford, and G. Wyeth. OpenFABMAP: An open source toolbox for appearance-based loop closure detection. In Proc. IEEE Int. Conf. on Robotics and Automation, pages 4730–4735, St. Paul, 2012.
- [15] J. Torres-Sospedra, R. Montoliu, A. Martínez-Usó, J. P. Avariento, T. J. Arnau, M. Benedito-Bordonau, and J. Huerta. UJIIndoorLoc: A new multi-building and multi-floor database for WLAN fingerprint-based indoor localization problems. In Proc. Int. Conf. on Indoor Positioning and Indoor Navigation (IPIN), pages 261–270, Busan, 2014.
- [16] M. J. Wainwright and M. I. Jordan. Graphical models, exponential families, and variational inference. Foundations and Trends in Machine Learning, 1(1–2):1–305, 2008.
- [17] M. Nowicki and P. Skrzypczyński. Indoor navigation with a smartphone fusing inertial and WiFi data via factor graph optimization. In MobiCASE 2015, volume LNICST 162, pages 1–19. Springer, 2015.