The exact phase diagram for a class of open multispecies asymmetric exclusion processes
Abstract
The asymmetric exclusion process is an idealised stochastic model of transport, whose exact solution has given important insight into a general theory of nonequilibrium statistical physics. In this work, we consider a totally asymmetric exclusion process with multiple species of particles on a one-dimensional lattice in contact with reservoirs. We derive the exact nonequilibrium phase diagram for the system in the long time limit. We find two new phenomena in certain regions of the phase diagram: dynamical expulsion when the density of a species becomes zero throughout the system, and dynamical localisation when the density of a species is nonzero only within an interval far from the boundaries. We give a complete explanation of the macroscopic features of the phase diagram using what we call nested fat shocks.
keywords:
exclusion process, multispecies, phase diagram, projection, open systemIntroduction
The one-dimensional asymmetric simple exclusion process (ASEP) with open boundaries has been of great importance as a model system towards understanding nonequilibrium phenomena. The matrix ansatz, which has since become an important tool [1], was developed to compute the nonequilibrium steady state (NESS) of the totally asymmetric version of the single-species ASEP [2] (TASEP). Using this ansatz, various measurable quantities such as the density and current were calculated in the NESS, from which the exact nonequilibrium phase diagram was derived. While many rigorous results are known in one dimension, there are none for higher dimensional exclusion processes in contact with reservoirs.
The exact calculation of various out-of-equilibrium quantities was also useful in formulating general principles. For example, the diffusion constant was first calculated exactly for the open TASEP [3]. Using the integrability of the ASEP, the spectrum of the transition matrix was computed [4]. The large deviation functional for the density profiles [5] and the large deviation function for the current [6, 7] was derived using the matrix ansatz. These calculations helped in the formulation of two general principles for driven diffusive systems; the additivity principle [8] and the macroscopic fluctuation theory [9].
It is natural to extend the ASEP to several species of particles. Multispecies exclusion processes have applications to studies of traffic flow [10], cell motility [11, 12], chemotaxis [13], chemical reactions [14] and biological transport in ion-channels [15, 16, 17]. The ASEP with second-class particles was first considered with periodic boundary conditions [18]. The first model with two species and open boundaries whose NESS was determined exactly was a model where positive and negative charges moved in the lattice under the influence of an electric field [19]. Much later, a two-species model called the semipermeable TASEP [20, 21] was considered, where second-class particles were confined to the lattice. The computation of the NESS was later generalised to the semipermeable ASEP [22]. The NESS of a version with more general boundary conditions was also determined exactly [23]. Later on, the phase diagram for a large class of ASEPs with two species and open boundaries was obtained [24, 25]. More recently, classes of integrable ASEPs with multiple species of particles and open boundaries were determined [26].
In this work, we study a multispecies exclusion process on a finite one-dimensional lattice with species of charges called the mASEP introduced recently [27]. The hopping rates in the bulk are asymmetric and those in the boundary are defined in such a way that there are conserved particle numbers. The main results are the following. We obtain the complete -dimensional phase diagram and present formulas for all densities and currents in the thermodynamic limit in all regions of the phase diagram. It will turn out that all the macroscopic features can be explained by a new structure which we call a nested fat shock. To make the presentation self-contained, we review the features for the semipermeable ASEP in Section I of the Supplementary material. We will prove these results in Section II of the Supplementary material by using projections to the semipermeable ASEP.
Results
The mASEP is defined on a one-dimensional lattice of size , where each site is occupied by exactly one particle of type . The barred particles are negative charges, the unbarred ones are positive charges, and 0’s are vacancies. There are species of charges, with the total number of particles of charge being fixed to be for . As a consequence, the number of vacancies is also fixed, with . More precisely, fix an -tuple of positive integers . The state space consists of all words of length in the alphabet such that the total number of ’s and ’s is equal to for and the total number of ’s is .
The dynamics is the effect of a rightward-pointing electric field. In the bulk, we have the asymmetric hopping rule
| (1) |
where we think of the barred particles as negative numbers, and set . On the left and right boundaries, positive charges can only replace and be replaced by their negatively charged partners with rates given by
| (2) |
The mASEP possesses charge-conjugation symmetry in the following sense: interchanging positively and negatively charged particles as well as the rates and , and , and and , and changing the direction of motion leaves the mASEP invariant. The model with and is the single-species open ASEP [2]; for arbitrary , this is the semipermeable ASEP [22]. Furthermore, if , this is the semipermeable TASEP [20, 21] (see Section I of the Supplementary material). We thus denote the mASEP with as the mTASEP. Results of simulations for the mTASEP with are given in Fig. 1.
Phase Diagram
For each integer between 0 and , let be the total density of (both positively and negatively charged) particles of species . We consider the behaviour of the mASEP in the limit and for each such that the total density of species particles converges to . Define the quantities
| (3) |
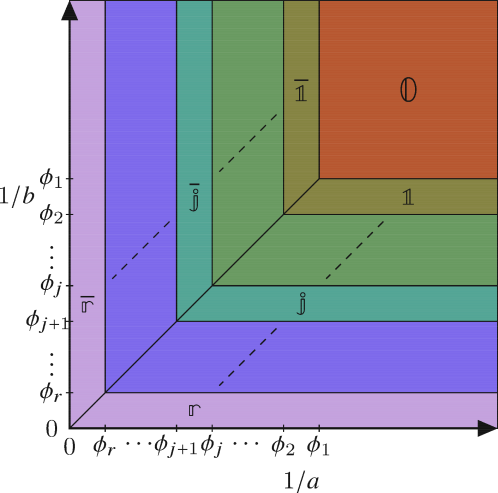
and the function . Set and for . Then the exact phase diagram is given in Fig. 2.
| Phase | Densities in the bulk | |
| Species | Values of | |
| piecewise constant | ||
| piecewise constant | ||
| piecewise constant | ||
| piecewise constant | ||
| piecewise constant | ||
| piecewise constant | ||
| boundary | piecewise linear | |
| piecewise linear | ||
The nonequilibrium phase diagram of the -species mASEP in Fig. 2 comprises phases, , each one of which is characterised by the bulk densities for , as well as the currents for of all types of particles; we tabulate these in Table 1 and 2 respectively. Note that there is no current of ’s and the current of ’s to the left is the same as that of ’s to the right. The mean densities of the and jump discontinuously across the boundary. By contrast, the mean densities vary continuously along the (and ) boundary. All currents change continuously across all phase boundaries in Fig. 2. In all phases except , the system shows phase coexistence with a sharp interface separating intervals of different density for some particle type, as we show by the illustrative density profiles in Fig. 1 for the mTASEP with and Supplementary Fig. S2 for the mASEP with . The proofs of the density profiles in Table 1 and currents in Table 2, which explain the phase diagram in Fig. 2, are given in Section II of the Supplementary material.


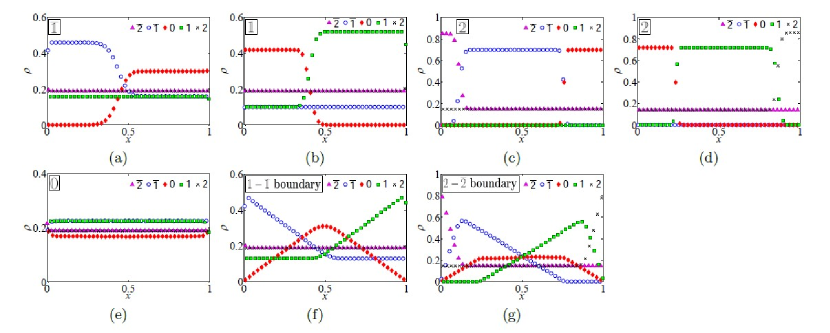
We illustrate the density profiles for various regions in the phase diagram for the example of the -species mTASEP (i.e. ) in Fig. 1. Therefore, and from (3), and , . There are five phases for this system, corresponding to , and two relevant phase-boundaries. The currents can be calculated by mean-field type calculations from the densities in each of the regions. More precisely, and . When there is phase-separation, the densities of all species conspire to ensure that the currents are constant across the system (because of particle conservation in the bulk). The value of the currents in each phase can be compared with Table 2.
In phase , all densities are constant, and the densities of oppositely charged particles are equal. Therefore, , and for . This is seen in Fig. 1(e) and matches with the first row of Table 1.
In phase , the densities of ’s, and ’s are constant, whereas those of ’s and ’s undergo phase separation. As in phase , . Moreover, is also constant throughout the system. In the phase-separated regions, either (forcing ), or from which can be calculated. The density plots can be seen in Fig. 1(b) and match the calculation of the densities in the second row of Table 1 with . The density profiles in can be calculated analogously using charge-conjugation symmetry.
In phase , the only constant densities are given by and . It is not immediately obvious why ’s are excluded from the system, and we give an explanation for this phenomenon of dynamical expulsion in the next section. Particles of species and are phase segregated in three distinct parts. The density of ’s, , is given by the in the rightmost part and in the other two parts. Particles of species exist only in the leftmost part with density , and those of species exist only in the middle part with the same density. In the thermodynamic limit, the middle part is infinitely far away from both boundaries and it is not immediately clear how ’s can be localised in the bulk. We call this phenomenon dynamical localisation and explain how this occurs in the next section. The densities can be seen in Fig. 1(d) and match the calculation of the densities in the second row of Table 1 with . Again, the profiles in can be calculated using charge-conjugation symmetry.
The nomenclature for the phases can now be explained. Each phase is denoted by the phase-segregated species with largest absolute value. For example, ’s and ’s are segregated in phase , ’s and ’s are segregated in phase , ’s, ’s and ’s are segregated in phase , and ’s, ’s and ’s are segregated in phase . The sole exception is phase , where all species have constant density.
To understand the density profiles in the and boundaries, we appeal to the nested fat shock construction, which we explain below. Recall that the phase diagram is calculated in the limit where the system size, . We rescale the system by a factor of so that the locations lie in the interval . In the boundary, as shown in Fig. 3, the densities of particles and are constant and equal to . All the particles of type form a ‘bound state’ of fixed width. We call this the nested fat shock (the nesting is of order 1 here). Both ends of the bound state execute a synchronised symmetric random walk with reflecting boundary conditions. As a consequence, , and are piecewise linear after averaging. In particular, is constant towards the left, since the right end of the bound state cannot move all the way to the left, and similarly for . This is shown in Fig. 1(f).
In the boundary as shown in Fig. 4, none of the densities are constant, and the picture is more complicated. The nested fat shock here consists of the regions containing ’s, ’s and ’s, in that order from left to right. The nesting is of order 2 here. There are four boundaries between the regions , , and , and all of them perform synchronised symmetric random walks in the bulk so that the widths of the regions containing , and is fixed. When one of them touches the boundary the widths of either or can decrease, causing the opposites charged region to increase in size so that the sum of the widths of these two remains constant. The width of the region containing never changes. This behaviour results in the piecewise linear profile shown in Fig. 1(g).
One can now derive the density profiles in regions , , and from these nested fat shocks. For example, in , one has the same nested fat shock structure as in Fig. 3, but the ends of the bound state containing execute a random walk with negative drift, which ensures that the nested fat shock is pinned to the left. Similarly, the nested fat shock is pinned to the right in . Similarly, the density profiles in and can be calculated by forcing the nested fat shock in Fig. 4 to be pinned to the left and right respectively.
The general structure of the nested fat shock is explained in the next section.
| Phase | Currents | |
|---|---|---|
| Species | Value of | |
Nested fat shock
All coarse features of the phase diagram in Fig. 2 are explained by the nested fat shock construction. This is a generalisation of the fat shock construction, which explains the phase diagram for the semipermeable TASEP [21] (i.e. the mTASEP with ). Roughly speaking, the fat shock consists of a macroscopic interval of the system, where all the ’s are localised. The ’s form two simultaneous shocks with the ’s and ’s, with a constant macroscopic width. For more details on the fat shock, see Section I of the Supplementary material.
The nested fat shock is a macroscopic interval of the system where, for some , particles of species are localised in a very specific way.
Particles of species have a nonzero constant density in a subinterval of fixed width inside this interval. Particles of species (resp. ) have a nonzero constant density in a subinterval to the right (resp. left) of the ’s. Although the widths of the and subintervals may vary, the sum of their widths is fixed. This pattern continues until species on the right and species on the left. The boundary between any two adjacent subintervals is a shock-front. Depending on which part of the phase diagram the system finds itself in, the nested fat shock can have either negative, positive or zero drift. If the drift is negative, the negatively charged subintervals containing will not exist, and similarly if there is positive drift, the positively charged subintervals will vanish. If there is zero drift, all subintervals will exist and move in a synchronised fashion.
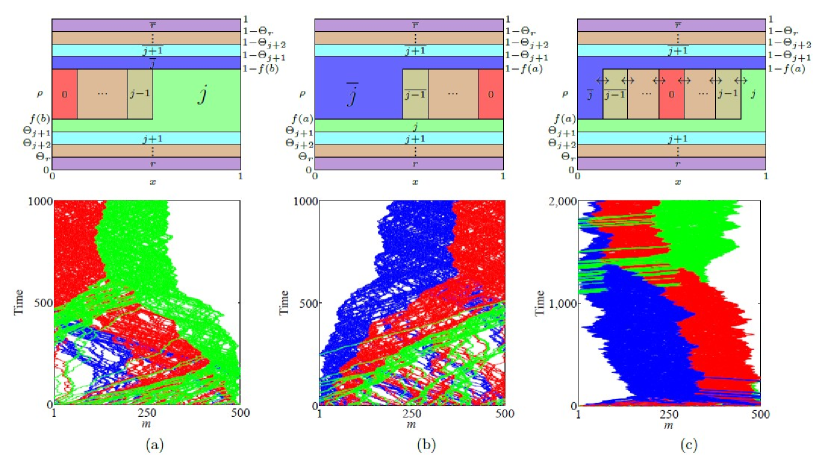
The top row of Fig. 5 shows the structure of the nested fat shock in these three cases in the most general scenario. We give a concrete example of a simulation run of the mTASEP with in the bottom row of the figure, which shows the results for phases (a) (negative drift), (b) (positive drift), and (c) the boundary (zero drift). The simulations show the densities of particles of species and only. If the nested fat shock has nonzero drift, it gets pinned to one of the boundaries; it is pinned on the left in (a) and on the right in (b). When the nested fat shock is pinned to the left, it consists of species and , and particles of species exit the system from the left. Similarly, when pinned to the right, it consists of species and , and particles of species vacate the system from the right. When the nested fat shock has zero drift as in (c), blocks of , and are present, with all shock fronts performing lockstep symmetric random walks.
The precise details for each phase are given below.
Region
Here, only the particles of species participate in the nested fat shock and the width of the shock is larger than the system size. As a result, all densities are constant throughout the system. This explains the densities and currents in region . See the density plot in Fig. 1(e) for the result of simulations.
Regions and
We give details only for region , since those of can be obtained by analogous arguments.
In region , particles of species participate in the nested fat shock. The velocity of this shock is negative and it gets pinned to the left boundary. However, this is not a stable situation. Initially, particles of species will be replaced by those of species , which will then move rightwards in the bulk, until they join the subinterval of the nested fat shock occupied by the particles of species . Once that process is completed, a similar phenomenon will happen with particles of species . This process will continue until all negatively charged particles in the nested fat shock have been replaced by their positive counterparts. In the steady state, we will only see particles of species participating in the shock, which will be pinned to the left.
We point out two new nonequilibrium features of this phase which can be seen in the top row of Fig. 5(a). First, note that species through are localised in the interior of the system. Each of these species has undergone phase separation, with one region of non-zero density and the remaining of zero density. The precise locations of the region with non-zero density can be calculated from the values of . What is more interesting is that species through are localised away from the boundary. This is somewhat counterintuitive since we have taken the thermodynamic limit and these particles are infinitely far away from the boundary. We call this phenomenon dynamical localisation. Such a phenomenon cannot occur in an equilibrium system. The second new feature is the complete absence of particles of species in the system, i.e. . This is related to the previous phenomenon since these particles can only enter at the expense of the dynamically localised particles. We call this phenomenon dynamical expulsion. In the extreme case of the phase, all the barred particles except are expelled.
The picture in the phase can be derived analogously. See the density plots in Regions and of Fig. 1(a), (b), (c) and (d) respectively for the results of simulations. See Fig. 5(a) (resp. (b)) for an illustration of the nested fat shock pinned on the left (resp. right) in the top row and the result of a simulation for and (resp. ) in the bottom row. The hyperlinked video here shows the spatiotemporal evolution of the same fat shock.
Boundary of the region
In the boundary, particles of species participate in the nested fat shock. The velocity of the shock fronts are now zero. Therefore, all these fronts perform a lockstep symmetric random walk in the bulk of the system. All subinterval widths will remain constant until the nested fat shock hits the boundary. When one of the extreme fronts gets pinned to the boundary, the widths of the subinterval containing ’s and ’s can change, but the sum of their widths will remain constant. The other subinterval widths will remain the same. While this front is pinned, the other fronts continue to move synchronously until either another one gets pinned or the one stuck to the boundary gets unpinned. If one more (either or ) gets pinned, the same phenomenon will repeat for that species. Note that, for instance, if the nested fat shock gets (temporarily) pinned to the right and then the next shock front also gets pinned, the density of ’s becomes zero. More and more shock fronts can get pinned until the fat shock containing ’s touches the boundary, at which point the latest front to get pinned can only get unpinned. We thus end up with an instantaneous profile whose schematic is given in the top row of Fig. 5(c). A simulation of the movement of the shock fronts can be seen in the spatiotemporal plot in the bottom row of Fig. 5(c). The hyperlinked video here shows the spatiotemporal evolution of the same fat shock. The steady state density profile can be obtained by averaging over the uniform shock locations and gives rise to piecewise linear profiles for species . The calculation of these profiles is not difficult, but is tedious and is skipped. The currents have the same values as those in regions and with .
Discussion
In this work, we have found the complete phase diagram for a very general multispecies exclusion process, called the mASEP, in contact with reservoirs. We have found two nonequilibrium phenomena, namely dynamical localisation and dynamical exclusion. Just like the fat shock construction explained the gross features of the semipermeable TASEP in all phases, we find a new object called a nested fat shock which explains the features here. Since the widths of the subintervals in the nested shock are fixed because of the conservation of the total number of and species, the system is extremely constrained. These constraints play a crucial role in establishing the structure in the various phases. It is an interesting open question as to how the phase diagram will look like with more general boundary rates.
The proofs of our results have appealed in a fundamental way to the colouring argument. It is natural to ask how general this argument is. We are working on a large class of multispecies exclusion processes by systematically exploiting this argument, and we expect new kinds of dynamical structures to appear.
In recent times, multispecies exclusion processes have found applications in physical, chemical and biological systems, as mentioned in the introduction. It would be interesting to see whether experimental realizations can be found for the various phases that we have shown in this work.
References
- [1] Blythe, R. A. & Evans, M. R. Nonequilibrium steady states of matrix-product form: a solver’s guide. \JournalTitleJ. Phys. A 40, R333–R441 (2007).
- [2] Derrida, B., Evans, M. R., Hakim, V. & Pasquier, V. Exact solution of a D asymmetric exclusion model using a matrix formulation. \JournalTitleJ. Phys. A 26, 1493–1517 (1993).
- [3] Derrida, B., Evans, M. & Mallick, K. Exact diffusion constant of a one-dimensional asymmetric exclusion model with open boundaries. \JournalTitleJ. Stat. Phys. 79, 833–874 (1995).
- [4] de Gier, J. & Essler, F. H. L. Bethe ansatz solution of the asymmetric exclusion process with open boundaries. \JournalTitlePhys. Rev. Lett. 95, 240601 (2005). URL http://link.aps.org/doi/10.1103/PhysRevLett.95.240601. DOI 10.1103/PhysRevLett.95.240601.
- [5] Derrida, B., Lebowitz, J. L. & Speer, E. R. Exact large deviation functional of a stationary open driven diffusive system: The asymmetric exclusion process. \JournalTitleJ. Stat. Phys. 110, 775–810 (2003). URL http://dx.doi.org/10.1023/A:1022111919402. DOI 10.1023/A:1022111919402.
- [6] de Gier, J. & Essler, F. H. L. Large deviation function for the current in the open asymmetric simple exclusion process. \JournalTitlePhys. Rev. Lett. 107, 010602 (2011).
- [7] Lazarescu, A. & Mallick, K. An exact formula for the statistics of the current in the TASEP with open boundaries. \JournalTitleJ. Phys. A 44, 315001 (2011).
- [8] Bodineau, T. & Derrida, B. Current fluctuations in nonequilibrium diffusive systems: An additivity principle. \JournalTitlePhys. Rev. Lett. 92, 180601 (2004). URL http://link.aps.org/doi/10.1103/PhysRevLett.92.180601. DOI 10.1103/PhysRevLett.92.180601.
- [9] Bertini, L., De Sole, A., Gabrielli, D., Jona-Lasinio, G. & Landim, C. Current fluctuations in stochastic lattice gases. \JournalTitlePhys. Rev. Lett. 94, 030601 (2005). URL http://link.aps.org/doi/10.1103/PhysRevLett.94.030601. DOI 10.1103/PhysRevLett.94.030601.
- [10] Karimipour, V. Multispecies asymmetric simple exclusion process and its relation to traffic flow. \JournalTitlePhys. Rev. E 59, 205–212 (1999). URL https://link.aps.org/doi/10.1103/PhysRevE.59.205. DOI 10.1103/PhysRevE.59.205.
- [11] Simpson, M. J., Landman, K. A. & Hughes, B. D. Multi-species simple exclusion processes. \JournalTitlePhysica A 388, 399 – 406 (2009). URL http://www.sciencedirect.com/science/article/pii/S0378437108008935. DOI http://dx.doi.org/10.1016/j.physa.2008.10.038.
- [12] Penington, C. J., Hughes, B. D. & Landman, K. A. Building macroscale models from microscale probabilistic models: A general probabilistic approach for nonlinear diffusion and multispecies phenomena. \JournalTitlePhys. Rev. E 84, 041120 (2011). URL http://link.aps.org/doi/10.1103/PhysRevE.84.041120. DOI 10.1103/PhysRevE.84.041120.
- [13] Painter, K. J. Continuous models for cell migration in tissues and applications to cell sorting via differential chemotaxis. \JournalTitleBull. Math. Biol. 71, 1117–1147 (2009). URL http://dx.doi.org/10.1007/s11538-009-9396-8. DOI 10.1007/s11538-009-9396-8.
- [14] Bruna, M. & Chapman, S. J. Diffusion of multiple species with excluded-volume effects. \JournalTitleJ. Chem. Phys. 137 (2012). URL http://scitation.aip.org/content/aip/journal/jcp/137/20/10.1063/1.4767058. DOI http://dx.doi.org/10.1063/1.4767058.
- [15] Agmon, N. The Grotthuss mechanism. \JournalTitleChemical Physics Letters 244, 456 – 462 (1995). URL http://www.sciencedirect.com/science/article/pii/000926149500905J. DOI http://dx.doi.org/10.1016/0009-2614(95)00905-J.
- [16] Zilman, A., Di Talia, S., Chait, B. T., Rout, M. P. & Magnasco, M. O. Efficiency, selectivity, and robustness of nucleocytoplasmic transport. \JournalTitlePLoS computational biology 3, e125 (2007).
- [17] Jovanovic-Talisman, T. et al. Artificial nanopores that mimic the transport selectivity of the nuclear pore complex. \JournalTitleNature 457, 1023 (2009).
- [18] Derrida, B., Janowsky, S. A., Lebowitz, J. L. & Speer, E. R. Exact solution of the totally asymmetric simple exclusion process: shock profiles. \JournalTitleJ. Stat. Phys. 73, 813–842 (1993).
- [19] Evans, M. R., Foster, D. P., Godrèche, C. & Mukamel, D. Asymmetric exclusion model with two species: Spontaneous symmetry breaking. \JournalTitleJournal of Statistical Physics 80, 69–102 (1995). URL https://doi.org/10.1007/BF02178354. DOI 10.1007/BF02178354.
- [20] Arita, C. Phase transitions in the two-species totally asymmetric exclusion process with open boundaries. \JournalTitleJ. Stat. Mech. Theory Exp. P12008, 18 pp. (electronic) (2006).
- [21] Ayyer, A., Lebowitz, J. L. & Speer, E. R. On the two species asymmetric exclusion process with semi-permeable boundaries. \JournalTitleJ. Stat. Phys. 135, 1009–1037 (2009).
- [22] Uchiyama, M. Two-species asymmetric simple exclusion process with open boundaries. \JournalTitleChaos Solitons Fractals 35, 398–407 (2008). URL http://dx.doi.org/10.1016/j.chaos.2006.05.013. DOI 10.1016/j.chaos.2006.05.013.
- [23] Ayyer, A., Lebowitz, J. L. & Speer, E. R. On some classes of open two-species exclusion processes. \JournalTitleMarkov Process. Related Fields 18, 157–176 (2012).
- [24] Crampe, N., Mallick, K., Ragoucy, E. & Vanicat, M. Open two-species exclusion processes with integrable boundaries. \JournalTitleJ. Phys. A 48, 175002 (2015). URL http://stacks.iop.org/1751-8121/48/i=17/a=175002.
- [25] Crampe, N., Evans, M., Mallick, K., Ragoucy, E. & Vanicat, M. Matrix product solution to a 2-species tasep with open integrable boundaries. \JournalTitlearXiv preprint arXiv:1606.08148 (2016).
- [26] Crampe, N., Finn, C., Ragoucy, E. & Vanicat, M. Integrable boundary conditions for multi-species asep. \JournalTitleJ. Phys. A 49, 375201 (2016). URL http://stacks.iop.org/1751-8121/49/i=37/a=375201.
- [27] Cantini, L., Garbali, A., de Gier, J. & Wheeler, M. Koornwinder polynomials and the stationary multi-species asymmetric exclusion process with open boundaries. \JournalTitleJ. Phys. A 49, 444002 (2016). URL http://stacks.iop.org/1751-8121/49/i=44/a=444002.
Acknowledgements
This work is partially supported by UGC Centre for Advanced Studies. We thank R. Pandit for many useful discussions.