Corresponding author: H. Akamatsu
E-mail: h.akamatsu@sron.nl, Telephone: +31 88 777 5862
Development of frequency domain multiplexing for the X-ray Integral Field Unit (X-IFU) on the Athena.
Abstract
We are developing the frequency domain multiplexing (FDM) read-out of transition-edge sensor (TES) microcalorimeters for the X-ray Integral Field Unit (X-IFU) instrument on board of the future European X-Ray observatory Athena. The X-IFU instrument consists of an array of 3840 TESs with a high quantum efficiency (90 %) and spectral resolution =2.5 eV 7 keV (2800). FDM is currently the baseline readout system for the X-IFU instrument. Using high quality factor LC filters and room temperature electronics developed at SRON and low-noise two stage SQUID amplifiers provided by VTT, we have recently demonstrated good performance with the FDM readout of Mo/Au TES calorimeters with Au/Bi absorbers. An integrated noise equivalent power resolution of about 2.0 eV at 1.7 MHz has been demonstrated with a pixel from a new TES array from NASA/Goddard (GSFC-A2). We have achieved X-ray energy resolutions 2.5 eV at AC bias frequency at 1.7 MHz in the single pixel read-out. We have also demonstrated for the first time an X-ray energy resolution around 3.0 eV in a 6 pixel FDM read-out with TES array (GSFC-A1). In this paper we report on the single pixel performance of these microcalorimeters under MHz AC bias, and further results of the performance of these pixels under FDM.
keywords:
, X-ray Integral Field Unit (X-IFU), TESs, X-ray microcalorimeter, frequency domain multiplexing (FDM) read-out1 INTRODUCTION
Future X-ray astronomical satellite Athena[1] (2028) aims to unveil the hot and energetic side of the Universe. In order to accomplish the goal, Athena will employ two focal plane instruments such as Wide Field Imager (WFI[2]) and X-ray Integrated Field Unit (X-IFU[3, 4]). The X-IFU instrument will provide a superb X-ray spectral ( keV) and spatial () resolutions. Transition edge sensors (TESs) X-ray calorimeter is a current baseline of the X-IFU instrument. X-ray calorimeter is a cryogenic non-dispersive spectrometer. TESs use a sharp resistance drop of a superconducting film as a thermometer operated around 100 mK. With high sensitive thermistor TESs, X-ray calorimeter can archive superb spectral resolution[5] ( 1 eV 6 keV). Furthermore, because of a non-dispersive spectrometer, TESs X-ray calorimeter can be used for diffuse objects such as super nova remnants, galaxies and galaxy clusters.
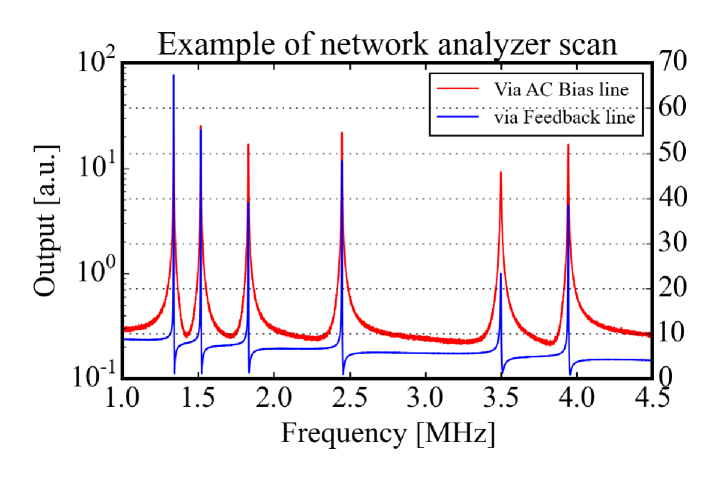
Although TESs X-ray calorimeter will innovate X-ray spectroscopy of cosmic plasma, the instrument needs to satisfy severe constraints on the satellite (the electrical and the cooling power). Therefore, a multiplexing readout of the TESs X-ray calorimeter is crucial technology. SRON is developing the frequency domain multiplexing (FDM) readout. In the FDM, TESs are coupled to a passive LC filter and biased with alternating current (AC bias) at MHz frequencies. Each LC resonator should be separated beyond detector thermal response ( 50 kHz) to avoid crosstalk between neighboring resonators. To satisfy XIFU requirements, a multiplexing factor of 40 pixels/channel in a frequency range from 1 to 5MHz required. The detailed description of the bandwidth requirement of FDM is given in J. van der Kuur et al. 2016 [6]. In this paper, we report on our recent progress in the development of the SRON FDM read-out for a NASA/GSFC TESs calorimeter array.
2 NASA/GSFC TES microcalorimeter array
For the FDM demonstration, we are using two different NASA/GSFC TESs arrays: (1) 88 uniform array (GSFC-A1) and (2) Mixed array (GSFC-A2). The basic properties of these array are summarized in Table. 1. Both the arrays show an excellent performance under the DC bias, typically 1.8–2.4 eV. The TESs consist of thin Mo/Au bilayer films and have 250 250 um BiAu-mushroom absorbers. Both TESs array have an Au layer on top of Si substrate to reduce thermal crosstalk and the bath temperature fluctuation due to X-ray photon attack onto the Si. The basic properties of GSFC-A1 are reported by C. Kilbourne 2007 [7], Iyomoto et al. 2008 [8], etc. GSFC-A2 has different absorber connections and wiring configuration. The absorbers are connected to TESs via T-type stem structures. The wiring of GSFC-A2 is made of the strip-line to increase filling factor and reduce electrical cross-talk. GSFC-A2 also has an better thermalization layer than GSFC-A1, which reduces thermal crosstalk in the array.
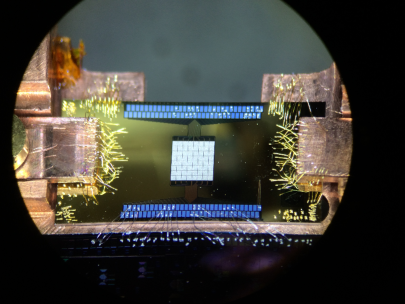
The TES arrays are clamped by Cu bars and thermally coupled to the Cu bracket via several Au bonding (Fig.1). With GSFC-A1, we have improved our FDM readout system and investigated the detector performance under AC bias (Akamatsu et al. 2013[9], 14[10], 15[11] and Gottardi et al. 2012[12], 14[13], 16[14]).
| TES size | Absorber | Transition | Normal state | Saturation | Temperature | |
| [m2] | size [m2] | temperature [mK] | resistance [m] | power [pW] | sensitivity | |
| GSFC-A1 | 140 | 250 | 95 | 7.5 | 6.5 | 60 |
| GSFC-A2 | 100 | 250 | 93 | 8.3 | 4.7 | 70 |
| 120 | 250 | 95 | 9.0 | 6.1 | 70 | |
| 140 | 250 | 97 | 9.8 | 7.2 | 80 | |
| : Dimensionless temperature sensitivity of the thermistor | ||||||
|
|
3 EXPERIMENTAL SETUP
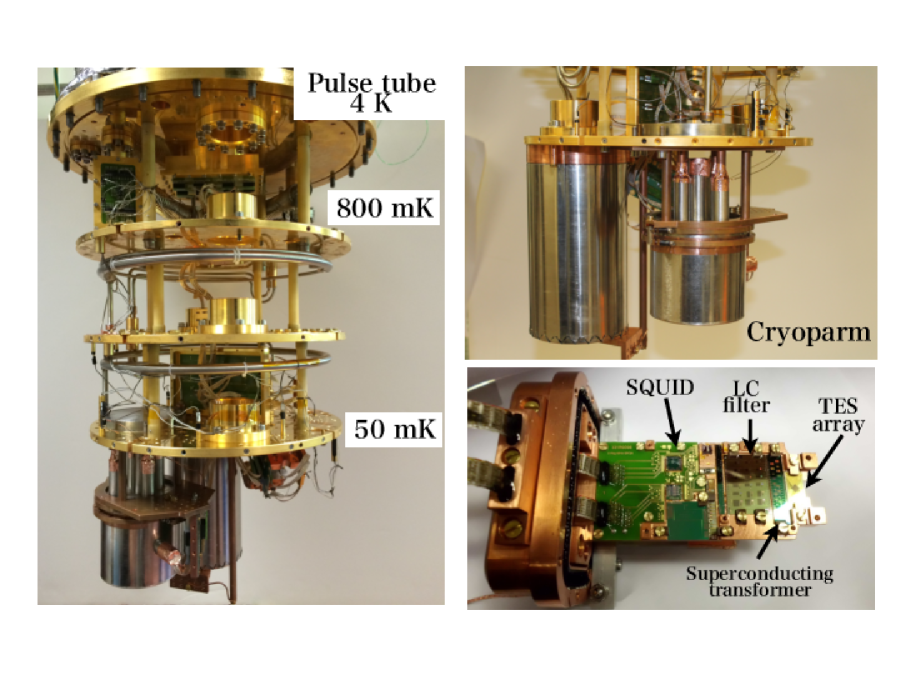
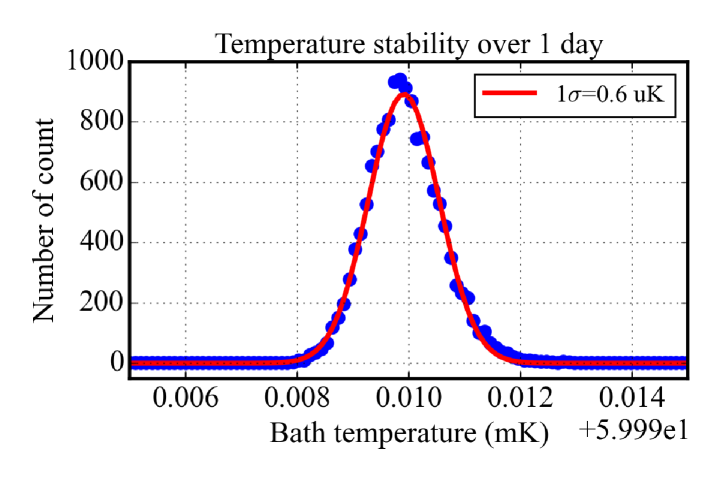
Cryostat: For the FDM demonstration, we are using a cryogen free dilution cooler111http://www.leidencryogenics.com/ (Fig. 2). The cooler has a huge cooling power 400 W 100 mK, which hosts several setups. Currently 2 FDM set-ups with s X-ray calorimeter array are installed. We have developed stable magnetic field and light tight set-up[13]. We employed a high- metal Cryoperm shield and superconducting Nb shield. The Nb shield cools down from one point from the detectors side to control flux trapping. Furthermore, we introduced a Helmholtz coil to investigate TESs response as a function of the applied magnetic field. With a similar setup, we have demonstrated an ultra-low NEP (Noise equivalent power) bolometer for the first time (: Suzuki et al. 2016[15]). For the performance evaluation of TESs calorimerter, stable bath temperature is of importance. We employed a highly sensitive Ge thermistor, which has a temperature sensitivity at 50 mK.
Room temperature electronics: SRON is developing room temperature electronics for the FDM readout. The details are summarized in den Hartog et al. 2009[16].
SQUIDs: We are using low-noise two-stage SQUID amplifiers provided by VTT222http://www.vttresearch.com/. The SQUID amplifiers are mounted on the Cu bracket and cooled down together with other experimental components. For the single pixel characterization, we employed SQUIDs, which are nearly quantum-limited with an coupled energy resolution at 20 mK. The SQUID input current noise shows 1-2 pA/ over the required frequency range between 1–5 MHz as expected for these SQUID amplifiers. The detailed information about the VTT SQUID amplifiers can be found in L. Gottardi et al. 2015[17]. For the multiplexing demonstration, we employed a higher dynamic range SQUIDs at the cost of slightly higher noise 4-6 pA/.
Superconducting transformer: We employed a superconducting transformer to match the read-out impedance to the low ohmic impedance () of the GSFC TESs calorimeter (Tab 1) and optimize the SQUID dynamic range. In our setup, the superconducting transformer works as to match the SQUID dynamic range and the impedences between TESs and SQUID. In this paper, we are using SRON lithographic superconducting transformers with a coupling ratio or 8.
LC filter: SRON developed low-losses lithographic LC filters for the FDM readout. The LC filter made of a-Si:H with gradiometric geometry and strip-line wiring to reduce common impedance and mutual inductance. The nominal inductance of the coil used in each filter is =400 nH (GSFC-A2) or 2 H (GSFC-A1). The detailed information about the LC filter can be found M. Bruijn et al. (2012)[18].
|
4 RESULTS
Here we present the results of the single pixel characterization of GSFC-A2 at 1.7 MHz AC bias. The 120 m TES calorimeter pixel was connected to a 1.7 MHz LC resonator (400 nH) with a 1:8 superconducting transformer. We used the 55Fe X-ray source, which was mounted on the Nb magnetic shield and cooled down together. To avoid X-rays hitting the Si substrate, we employed a Cu collimator with a hole, which fits the size of the TES array. Typical count rate to TESs is about 1.0–1.5 counts/s.
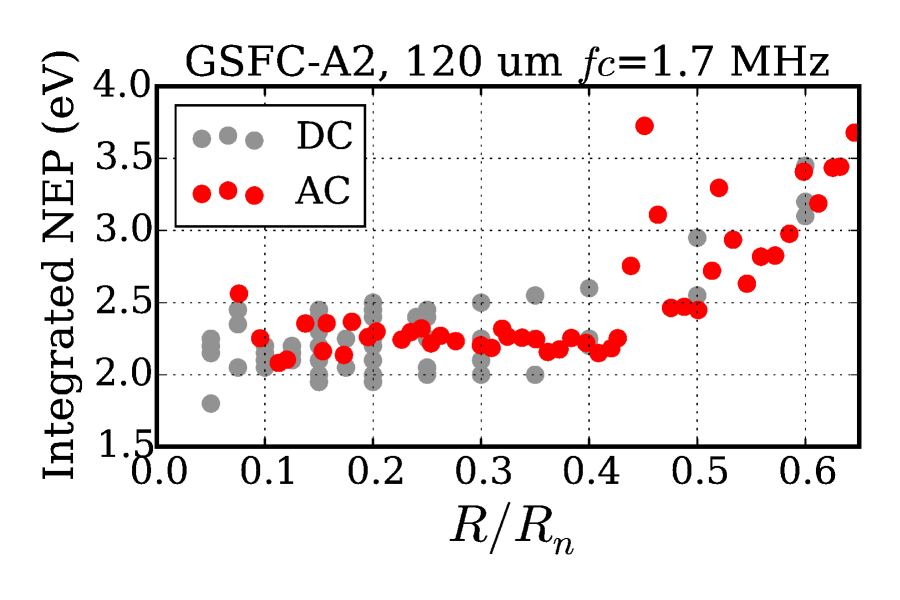
In order to evaluate the detector performance under AC bias, we characterized the integrated NEP resolution. The integrated NEP resolution reflects a potential performance under given measurement set-up. The integrated NEP resolution was estimated based on below formula
| (1) |
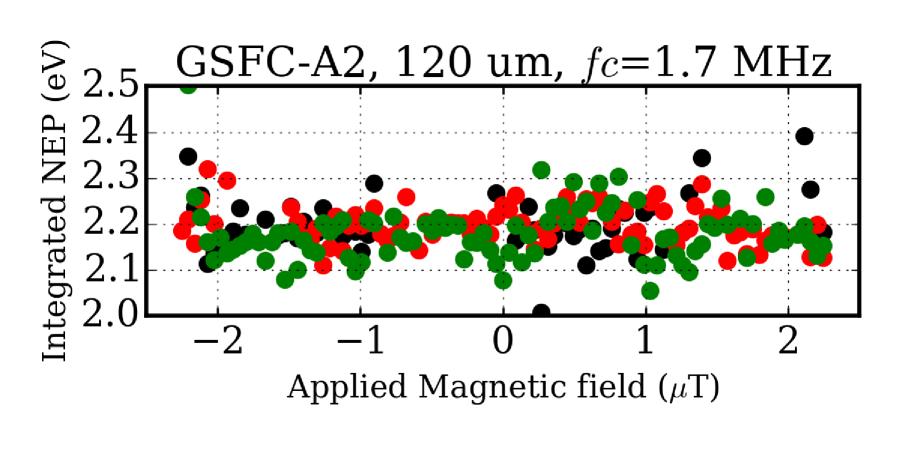
where , and are the detector noise spectral density and responsivity, respectively. The top panel of Fig. 3 shows the dependency of the NEP resolution on the TES bias point (red points). The horizontal axis is normalized on the normal state resistance. The gray points show the results of DC bias. Within a scatter of the data, the integrated NEP resolutions under AC bias are almost comparable to the DC bias case. The profile shows a stable NEP resolution as eV between TES resistance and the best resolution as 2.0 eV at . As previously reported [11], the degradation of the integrated NEP resolution under AC bias has been observed at small TES resistance regime () with GSFC-A1 array. On the other hand, there is no significant difference between AC and DC[19] bias with the GSFC-A2 array. The TES parameters (Tab. 1), the magnetic field sensitivity (Fig. 3) and the impact of the weak-link effect [20, 21, 22] may be responsible for the difference.
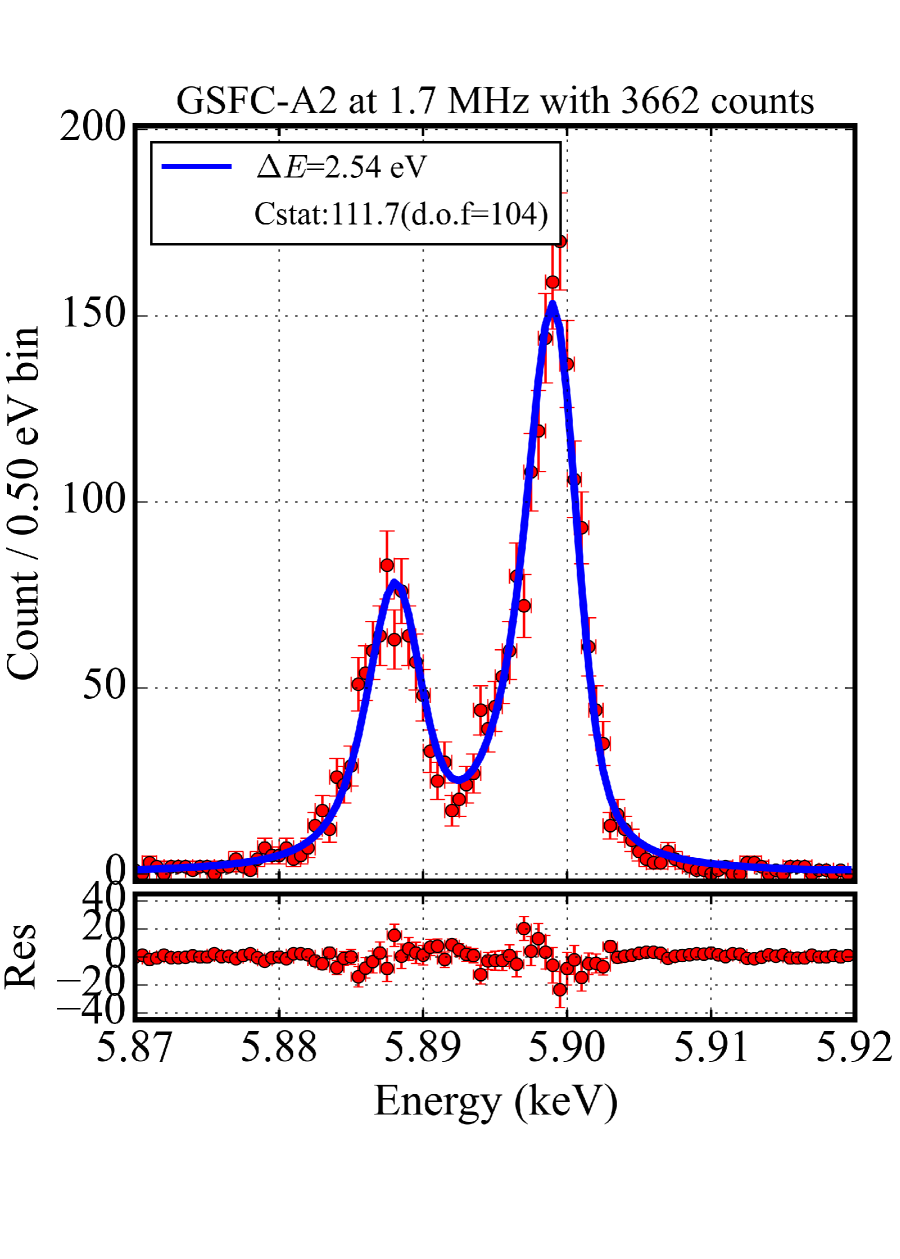
To assess the X-ray resolution of the TESs calorimeter, we applied the optimal filter to the X-ray pulses. After the drift and non-linearity correction, we fitted Mn-Kα line with a line model by Holzer et al (1997) [23]. For the fitting, we employed the Cash statistic[24] to minimize fitting bias (see the SPEX user manual333https://www.sron.nl/files/HEA/SPEX/manuals/manual.pdf chapter 2.12 for a detail). The best-fit parameter then was obtained by minimizing the C-stat parameter. The best X-ray energy resolution under 1.7 MHz AC bias is eV at 5.9 keV, which is close to typical values under DC bias (2.0–2.4 eV). The difference between the integrated NEP and X-ray resolution could be cause by thermal and mechanical fluctuations induced by the external environment. This effect is currently under investigation.
Finally we briefly report on a preliminary result of 6 pixel FDM demonstration. For the FDM demonstration, we used relatively stable (temperature and magnetic field) set-up, which hosts GSFC-A1 array. As described in Sec 2, the GSFC-A1 array is connected 2H coil LC filter. We connected 8 TES calorimeters, to LC filters with resonance frequencies of 1.10, 1.27, 1.38, 1.55, 1.75, 2.05, 2.45 and 2.55 MHz respectively. Because of undesired detector behaviors (too fast detector response), the TESs connected to 1.10 and 1.38 MHz are excluded from the multiplexing measurement. With this condition, we demonstrated 6 pixel multiplexed read out with typical energy resolutions of 3 eV for the first time.
Contrary to the previous 2-pixel multiplexing[25], there is a small performance degradation as a result of 6-pixel multiplexing from eV (single pixel mode) to 3.2 eV (6-pixel multiplexing). The degradation can be explained by sub-optimal components such as TES array and LC filter. The bias line layout of the TES array used for multiplexing experiment showed excess cross talk. Consequently, undesired electrical cross-talk is generated. Furthermore, the thermalization efficiency of the array is an issue. We observed strong thermal cross-talk between TESs and a sign of X-ray hit on the Si substrate. We also observed an electrical cross-talk which is most likely related to a common impedance and mutual inductance in this specific LC filter version. The degradation will be improved by the new generation of LC filters with minimised common inductance and mutual inductance and by the new generation of detector currently under fabrication at NASA/Goddard. In parallel, the demonstration of the FDM readout is still ongoing and the results will be reported in the near future.
5 Summary and Future prospect
We are developing the Frequency Domain Multiplexing readout of TESs calorimeter for the X-IFU onboard the future X-ray astrophysical satellite . By employing a new TES calorimeter array, we have demonstrated an integrated NEP resolution of eV under AC bias at 1.7 MHz, which is consistent with the results of DC bias measurements. The energy resolution of eV at 5.9 keV with the single pixel MHz AC bias readout is also presented.
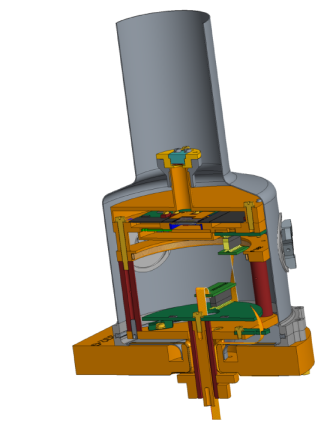
For the near future we are preparing a new experimental setup, which is shown in Fig. 4. This setup is design to test pixels FDM readout. For this demonstration, we will employ (1) a uniform GSFC TESs array with will have similar properties of GSFC-A2, (2) new LC filter and (3) X-IFU dedicated SQUID array. The first cool down of the set up is expected to be around early winter of 2016.
|
Acknowledgements.
H.A acknowledges the support of NWO via a Veni grant. We thank Martijn Schoemans, Dick Boersma, Marcel van Litsenburg, Joris van Rantwijk, Patrick van Winden and Bert-Joost van Leeuwen and Robert Huitin for their precious/continues support. The research leading to these results has received funding from the European Union’s Horizon 2020 Programme under the AHEAD project (grant agreement n. 654215). SRON is supported financially by NWO, the Netherlands Organization for Scientific Research.References
- [1] K. Nandra, D. Barret, X. Barcons, A. Fabian, J.-W. den Herder, L. Piro, M. Watson, C. Adami, J. Aird, J. M. Afonso, and et al., “The Hot and Energetic Universe: A White Paper presenting the science theme motivating the Athena+ mission,” ArXiv e-prints , June 2013.
- [2] N. Meidinger, K. Nandra, M. Plattner, M. Porro, A. Rau, A. E. Santangelo, C. Tenzer, and J. Wilms, “The wide field imager instrument for Athena,” in Space Telescopes and Instrumentation 2014: Ultraviolet to Gamma Ray, Proc. SPIE 9144, p. 91442J, July 2014.
- [3] D. Barret, J. W. den Herder, L. Piro, L. Ravera, R. Den Hartog, C. Macculi, X. Barcons, M. Page, S. Paltani, G. Rauw, J. Wilms, M. Ceballos, L. Duband, L. Gottardi, S. Lotti, J. de Plaa, E. Pointecouteau, C. Schmid, H. Akamatsu, D. Bagliani, S. Bandler, M. Barbera, P. Bastia, M. Biasotti, M. Branco, A. Camon, C. Cara, B. Cobo, L. Colasanti, J. L. Costa-Kramer, L. Corcione, W. Doriese, J. M. Duval, L. Fabrega, F. Gatti, M. de Gerone, P. Guttridge, R. Kelley, C. Kilbourne, J. van der Kuur, T. Mineo, K. Mitsuda, L. Natalucci, T. Ohashi, P. Peille, E. Perinati, C. Pigot, G. Pizzigoni, C. Pobes, F. Porter, E. Renotte, J. L. Sauvageot, S. Sciortino, G. Torrioli, L. Valenziano, D. Willingale, C. de Vries, and H. van Weers, “The Hot and Energetic Universe: The X-ray Integral Field Unit (X-IFU) for Athena+,” ArXiv e-prints , Aug. 2013.
- [4] L. Ravera, D. Barret, J. W. den Herder, L. Piro, R. Clédassou, E. Pointecouteau, P. Peille, F. Pajot, M. Arnaud, C. Pigot, L. Duband, C. Cara, R. H. den Hartog, L. Gottardi, H. Akamatsu, J. van der Kuur, H. J. van Weers, J. de Plaa, C. Macculi, S. Lotti, G. Torrioli, F. Gatti, L. Valenziano, M. Barbera, X. Barcons, M. T. Ceballos, L. Fàbrega, J. M. Mas-Hesse, M. J. Page, P. R. Guttridge, R. Willingale, S. Paltani, L. Genolet, E. Bozzo, G. Rauw, E. Renotte, J. Wilms, and C. Schmid, “The X-ray Integral Field Unit (X-IFU) for Athena,” in Space Telescopes and Instrumentation 2014: Ultraviolet to Gamma Ray, Proc. SPIE 9144, p. 91442L, July 2014.
- [5] S. H. Moseley, J. C. Mather, and D. McCammon, “Thermal detectors as X-ray spectrometers,” NASA STI/Recon Technical Report N 84, Apr. 1984.
- [6] J. van der Kuur et al. SPIE 2016 these proceedings .
- [7] C. A. Kilbourne, S. R. Bandler, A.-D. Brown, J. A. Chervenak, E. Figueroa-Feliciano, F. M. Finkbeiner, N. Iyomoto, R. L. Kelley, F. S. Porter, and S. J. Smith, “Uniform high spectral resolution demonstrated in arrays of TES x-ray microcalorimeters,” in UV, X-Ray, and Gamma-Ray Space Instrumentation for Astronomy XV, Proc. SPIE 6686, p. 668606, Sept. 2007.
- [8] N. Iyomoto, S. R. Bandler, R. P. Brekosky, A.-D. Brown, J. A. Chervenak, E. Figueroa-Feliciano, F. M. Finkbeiner, R. L. Kelley, C. A. Kilbourne, M. A. Lindeman, F. S. Porter, T. Saab, J. E. Sadleir, and S. J. Smith, “Modeling of TES X-Ray Microcalorimeters with a Novel Absorber Design,” Journal of Low Temperature Physics 151, pp. 406–412, Apr. 2008.
- [9] H. Akamatsu, L. Gottardi, J. Adams, C. Bailey, S. Bandler, M. Bruijn, J. Chervenak, M. Eckart, F. Finkbeiner, R. den Hartog, H. Hoevers, R. Kelley, J. van der Kuur, T. van den Linden, M. Lindeman, F. Porter, J. Sadleir, S. Smith, J. Beyer, and M. Kiviranta, “Single pixel characterization of x-ray tes microcalorimeter under ac bias at mhz frequencies,” IEEE Transactions on Applied Superconductivity 23, pp. 2100503–2100503, June 2013.
- [10] H. Akamatsu, L. Gottardi, J. Adams, S. Bandler, M. Bruijn, J. Chervenak, M. Eckart, F. Finkbeiner, R. den Hartog, H. Hoevers, R. Kelley, C. Kilbourne, J. van der Kuur, A. J. van den Linden, F. Porter, J. Sadleir, S. Smith, and M. Kiviranta, “Performance of TES X-ray Microcalorimeters with AC Bias Read-Out at MHz Frequencies,” Journal of Low Temperature Physics 176, pp. 591–596, Aug. 2014.
- [11] H. Akamatsu, L. Gottardi, J. Adams, S. Bandler, M. Bruijn, J. Chervenak, M. Eckart, F. Finkbeiner, R. den Hartog, J. den Herder, H. Hoevers, M. Jambunathan, R. Kelley, C. Kilbourne, S. J. Lee, J. van der Kuur, A. van den Linden, F. Porter, J. Sadleir, S. Smith, M. Kiviranta, and E. Wassell, “Developments of frequency-domain multiplexing of tes arrays for a future x-ray satellite mission,” IEEE Transactions on Applied Superconductivity 25, pp. 1–4, June 2015.
- [12] L. Gottardi, J. Adams, C. Bailey, S. Bandler, M. Bruijn, J. Chervenak, M. Eckart, F. Finkbeiner, R. Hartog, H. Hoevers, R. Kelley, C. Kilbourne, P. Korte, J. Kuur, M. Lindeman, F. Porter, J. Sadlier, and S. Smith, “Study of the Dependency on Magnetic Field and Bias Voltage of an AC-Biased TES Microcalorimeter,” Journal of Low Temperature Physics 167, pp. 214–219, May 2012.
- [13] L. Gottardi, H. Akamatsu, D. Barret, M. P. Bruijn, R. H. den Hartog, J.-. den Herder, H. F. C. Hoevers, M. Kiviranta, J. van der Kuur, A. J. van der Linden, B. D. Jackson, M. Jambunathan, and M. L. Ridder, “Development of TES-based detectors array for the X-ray Integral Field Unit (X-IFU) on the future x-ray observatory ATHENA,” in Space Telescopes and Instrumentation 2014: Ultraviolet to Gamma Ray, Proc. SPIE 9144, p. 91442M, July 2014.
- [14] L. Gottardi, H. Akamatsu, M. P. Bruijn, R. den Hartog, J.-W. den Herder, B. Jackson, M. Kiviranta, J. van der Kuur, and H. van Weers, “Development of the superconducting detectors and read-out for the X-IFU instrument on board of the X-ray observatory Athena,” Nuclear Instruments and Methods in Physics Research A 824, pp. 622–625, July 2016.
- [15] T. Suzuki, P. Khosropanah, M. L. Ridder, R. A. Hijmering, J. R. Gao, H. Akamatsu, L. Gottardi, J. van der Kuur, and B. D. Jackson, “Development of ultra-low-noise tes bolometer arrays,” Journal of Low Temperature Physics 184(1), pp. 52–59, 2016.
- [16] R. den Hartog, D. Boersma, M. Bruijn, B. Dirks, L. Gottardi, H. Hoevers, R. Hou, M. Kiviranta, P. de Korte, J. van der Kuur, B.-J. van Leeuwen, A. Nieuwenhuizen, and M. Popescu, “Baseband Feedback for Frequency-Domain-Multiplexed Readout of TES X-ray Detectors,” in American Institute of Physics Conference Series, B. Young, B. Cabrera, and A. Miller, eds., American Institute of Physics Conference Series 1185, pp. 261–264, Dec. 2009.
- [17] L. Gottardi, M. Kiviranta, J. van der Kuur, H. Akamatsu, M. P. Bruijn, and R. den Hartog, “Nearly quantum limited two-stage squid amplifiers for the frequency domain multiplexing of tes based x-ray and infrared detectors,” IEEE Transactions on Applied Superconductivity 25, pp. 1–4, June 2015.
- [18] M. P. Bruijn, L. Gottardi, R. H. den Hartog, H. F. C. Hoevers, M. Kiviranta, P. A. J. de Korte, and J. van der Kuur, “High-Q LC Filters for FDM Read out of Cryogenic Sensor Arrays,” Journal of Low Temperature Physics 167, pp. 695–700, June 2012.
- [19] S. J. e. a. Smith SPIE 2016 these proceedings .
- [20] J. E. Sadleir, S. J. Smith, I. K. Robinson, F. M. Finkbeiner, J. A. Chervenak, S. R. Bandler, M. E. Eckart, and C. A. Kilbourne, “Proximity effects and nonequilibrium superconductivity in transition-edge sensors,” Phys. Rev. B 84, p. 184502, Nov. 2011.
- [21] S. J. Smith, J. S. Adams, C. N. Bailey, S. R. Bandler, S. E. Busch, J. A. Chervenak, M. E. Eckart, F. M. Finkbeiner, C. A. Kilbourne, R. L. Kelley, S.-J. Lee, J.-P. Porst, F. S. Porter, and J. E. Sadleir, “Implications of weak-link behavior on the performance of Mo/Au bilayer transition-edge sensors,” Journal of Applied Physics 114, pp. 074513–074513, Aug. 2013.
- [22] L. Gottardi, A. Kozorezov, H. Akamatsu, J. van der Kuur, M. P. Bruijn, R. H. den Hartog, R. Hijmering, P. Khosropanah, C. Lambert, A. J. van der Linden, M. L. Ridder, T. Suzuki, and J. R. Gao, “Josephson effects in an alternating current biased transition edge sensor,” Applied Physics Letters 105, p. 162605, Oct. 2014.
- [23] G. Hölzer, M. Fritsch, M. Deutsch, J. Härtwig, and E. Förster, “K1,2 and K1,3 x-ray emission lines of the 3d transition metals,” P.R A 56, pp. 4554–4568, Dec. 1997.
- [24] W. Cash, “Parameter estimation in astronomy through application of the likelihood ratio,” ApJ 228, pp. 939–947, Mar. 1979.
- [25] H. Akamatsu, L. Gottardi, C. P. de Vries, J. S. Adams, S. R. Bandler, M. P. Bruijn, J. A. Chervenak, M. E. Eckart, F. M. Finkbeiner, J. R. Gao, J.-W. den Herder, R. den Hartog, H. Hoevers, R. E. Kelley, P. Khosropanah, C. A. Kilbourne, J. van der Kuur, S.-J. Lee, A. J. van den Linden, F. S. Porter, K. Ravensberg, J. E. Sadleir, S. J. Smith, T. Suzuki, E. J. Wassell, and M. Kiviranta, “Tes-based x-ray microcalorimeter performances under ac bias and fdm for athena,” Journal of Low Temperature Physics 184(1), pp. 436–442, 2016.