Joint multifractal analysis based on wavelet leaders
Abstract
Mutually interacting components form complex systems and the outputs of these components are usually long-range cross-correlated. Using wavelet leaders, we propose a method of characterizing the joint multifractal nature of these long-range cross correlations, a method we call joint multifractal analysis based on wavelet leaders (MF-X-WL). We test the validity of the MF-X-WL method by performing extensive numerical experiments on the dual binomial measures with multifractal cross correlations and the bivariate fractional Brownian motions (bFBMs) with monofractal cross correlations. Both experiments indicate that MF-X-WL is capable to detect the cross correlations in synthetic data with acceptable estimating errors. We also apply the MF-X-WL method to the pairs of series from financial markets (returns and volatilities) and online worlds (online numbers of different genders and different societies) and find an intriguing joint multifractal behavior.
pacs:
05.45.Tp, 05.45.Df, 89.75.Da, 89.65.GhI Introduction
Since the seminal paper on long-range cross-correlation analysis Podobnik and Stanley (2008), the cross correlation and joint multifractality have received considerable research interests. Great concentrations are focused on extending the traditional multifractal detecting approaches into cross or joint multifractal formulism and applying such methods to diagnose the cross or joint multifractality in many real systems.
The invented cross or joint multifractal analysis methods are all rooted from the traditional approaches on multifractal analysis, such as partition function methods Grassberger (1983); Grassberger and Procaccia (1983); Halsey et al. (1986), structure function methodsKolmogorov (1962); VanAtta-Chen-1970-JFM; Anselmet et al. (1984), detrended fluctuation analysis Castro e Silva and Moreira (1997); Weber and Talkner (2001); Kantelhardt et al. (2002), and detrending moving-average analysis Alessio et al. (2002); Carbone et al. (2004a, b); Gu and Zhou (2010), and so on. In 1990, Meneveau et al. proposed a joint multifractal analysis to handle the joint partition function of two multifractal measures and to study the relationship between the dissipation rates of kinetic energy and passive scalar fluctuations in fully developed turbulence Meneveau et al. (1990), which is also termed as the multifractal cross-correlation analysis based on the partition function approach (MF-X-PF) Xie et al. (2015). Wang et al. studied independently the multifractal statistical moment cross-correlation analysis (MFSMXA) Wang et al. (2012), which is a special case of the MF-X-PF. Xie et al. theoretically derived and numerically validated the expression of multifractal formula for binomial measures Xie et al. (2015). Kristoufek proposed the multifractal height cross-correlation analysis (MF-HXA) based on structure function Kristoufek (2011). Zhou generalized the detrended fluctuation analysis into multifractal detrended cross-correlation analysis (MF-X-DFA) Zhou (2008), which is a multifractal version of detrended cross-correlation analysis (DCCA) Podobnik and Stanley (2008). Jiang and Zhou extended the multifractal detrending moving-average analysis (MF-DMA) Gu and Zhou (2010) and detrending moving-average analysis (DMA) Alessio et al. (2002); Carbone and Castelli (2003); Carbone et al. (2004b); Arianos and Carbone (2007); Carbone (2007); Carbone and Kiyono (2016); Tsujimoto et al. (2016); Kiyono and Tsujimoto (2016) into the cross multifractal formulism, namely MF-X-DMA Jiang and Zhou (2011). Other multifractal cross-correlation analysis methods include multifractal cross-correlation analysis (MFCCA) Oświȩcimka et al. (2014); Kwapień et al. (2015), and multifractal detrended partial correlation analysis (MFDPXA, including MF-PX-DFA, MF-PX-DMA, and so on) Qian et al. (2015).
Using these approaches, the long-range cross correlations have been empirically uncovered in pairs of series from different financial markets. Wang et al. found significant cross correlations between return series of Chinese A-share and B-share markets Wang et al. (2010). The spot and future markets, like crude oil and CSI 300 index, were reported to exhibit cross multifractal features Wang et al. (2011); Wang and Xie (2013a). Wang and Xie found that the Chinese Currency and four major currencies (USD, EUR, JPY, and KRW) are significantly cross correlated Wang and Xie (2013b). Ma et al. also confirmed the cross correlations between the Chinese stock markets and surrounding stock markets in Japan, South Korea, and Hong Kong Ma et al. (2013). Wang et al. report that the returns and trading volumes of CSI 300 index exhibit a long range cross correlated behavior Wang et al. (2013). Wang et al. developed an improved method of minimum-variance hedge ratio, namely the detrended minimum-variance hedge ratio, to capture the hedge ratio at different time scales Wang et al. (2014). Zhou and Chen proposed an arbitrage trading strategy based on the DCCA coefficients and found that this strategy could offer a positive and time-stable return Zhou and Chen (2016).
Wavelet transform has long been applied to the study of fractals and multifractals Holschneider (1988); Arnéodo et al. (1988) and a partition function approach based on wavelet transform has been proposed Muzy et al. (1991). Jiang et al. generalized the multifractal wavelet analysis to the bivariate case, namely MF-X-WT Jiang-Zhou-Stanley-2016-PRE, which is a multifractal generalization of the cross wavelet transform Hudgins et al. (1993); Maraun and Kurths (2004); Aguiar-Conraria and Soares (2014). Recently, a new method of wavelet leaders has been proposed to characterize the multifractality Lashermes et al. (2008); Serrano and Figliola (2009); Wendt et al. (2009). In this paper, we propose a new joint multifractal analysis based on wavelet leaders, called joint multifractal analysis based on wavelet leaders (MF-X-WL). Similar to the MF-X-PF and MF-X-WT methods, we introduce two orders in the MF-X-WL method. We check the performance of this method by carrying out extensive numerical experiments with two mathematical models and also apply this method to detect the cross multifractality in the pairs of series from financial markets and online worlds.
II Methods
II.1 Definition of wavelet leader
For completeness, we review briefly the definition of wavelet leaders Lashermes et al. (2008); Serrano and Figliola (2009); Wendt et al. (2009). Wavelet leaders are defined from the discrete wavelet coefficients, which decompose the signals on the orthogonal bases composed of discrete wavelets . Integers and represent the scale and location . Wavelets are space-shifted and scale-dilated templates of a mother wavelet , such that,
| (1) |
The mother wavelet should have a compact time support and the quadrature mirror filters also have finite impulse responses. In practice, the Daubechies bases are found to satisfy such conditions. In this paper, the Daubechies wavelet with order 1 is used. The discrete wavelet coefficients are defined as follows,
| (2) |
One defines a dyadic interval as
| (3) |
and denote the union of the interval and its 2 adjacent neighbors as ,
| (4) |
Following Ref. Lashermes et al. (2008), the wavelet leader is defined as
| (5) |
The physical meaning of Eq. (5) is that the wavelet leader corresponds to the largest value of the absolute wavelet coefficients calculated on intervals, , with . Note that all the fine scales must be considered to compute the wavelet leaders.
II.2 Cross multifractal formalism based on wavelet leaders
Motivated from the multifractal formalism of wavelet leaders Lashermes et al. (2008); Serrano and Figliola (2009); Wendt et al. (2009) and the multifractal cross correlation analysis Podobnik and Stanley (2008); Zhou (2008); Jiang and Zhou (2011); Kristoufek (2011); Wang et al. (2012); Xie et al. (2015), we propose an algorithm to detect the cross multifractality in a pair of series, and , based on wavelet leaders, namely joint multifractal analysis based on wavelet leaders with two moment orders and (MF-X-WL ). Firstly, the wavelet leaders of both series are estimated at different scales , giving and . For a given scale , we can define the joint partition function with moment orders and based on wavelet leaders,
| (6) |
where is the number of wavelet leaders at scale . When and , we recover the traditional multifractal formalism based on wavelet leaders. One can also expect the following scaling behavior if the underlying processes are cross multifractal,
| (7) |
where is the joint scaling exponents. Obviously, we can estimate through regressing against in the scaling range for a given pair .
In analogy with the double Legendre transforms in MF-X-PF Xie et al. (2015) and the multifractal formalism of wavelet leaders Lashermes et al. (2008); Serrano and Figliola (2009); Wendt et al. (2009), we can obtain singularity strengths and
| (8) | |||||
| (9) |
and the multifractal spectrum for MF-X-WL
| (10) |
As pointed out by Muzy et al. Muzy et al. (1991), the estimation of singularity strength and multifractal spectrum based on the Legendre transform may have various errors because of its innate disadvantages. They also proposed an alternative method to compute and from the perspective of canonical method, which is known as a direct estimation method Chhabra and Jensen (1989). This inspires us to directly estimate the singularity strength and and the multifractal spectrum through the following equations,
| (11) | |||||
| (12) | |||||
| (13) |
where . Thus we can directly determine the singularity strength, and , and multifractal function, , from log-log plots of the quantities in Eqs. (11)–(13).
III Numerical experiments
Here, we first conduct two numerical experiments, including binomial measures generated from the multiplicative -model Meneveau and Sreenivasan (1987) and bivariate fractional Brownian motions (bFBMs) Lavancier et al. (2009); Coeurjolly et al. (2010); Amblard et al. (2013), to test the validity and performance of the proposed MF-X-WL approach.
III.1 Joint multifractal analysis of binomial measures
As a first example, we conduct a numerical experiment of testing the validity of our algorithm on two binomial measures and from the -model with known analytic multifractal properties Meneveau and Sreenivasan (1987). Each binomial measure is generated in an iterative manner. We start with the zeroth iteration , where the data set consists of one value, . In the -th iteration, the data set is obtained from
| (14) |
for . When , approaches to a binomial measure, whose partition function and scaling exponent function have an analytic form Serrano and Figliola (2009),
| (15) | |||||
| (16) |
In our numerical experiments, the -model parameters of two binomial measures are set as for and for with an iterative number . The analytic scaling exponent functions and of and are expressed in Eq. (15), when we replace with and . Because both series are generated in terms of the same rule, the two series and are strongly correlated with a coefficient of 0.82. In the case of cross multifractal analysis, we have the theoretical expressions for the partition function and scaling exponent function,
| (17) | |||||
| (18) |
We first consider the scenario of . The results are shown in Fig. 1.
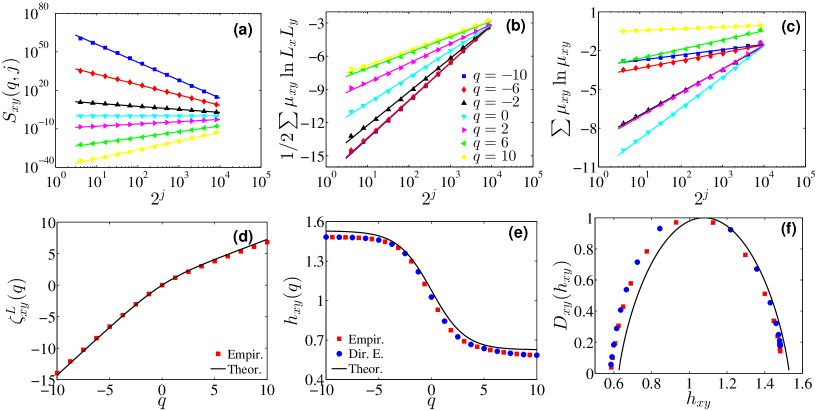
Fig. 1 (a) illustrates the power-law behaviors, spanning more than three orders of magnitude, between the partition functions and the scale . Fig. 1 (b) and (c) present the linear behaviors of the two quantities and against . By linearly regressing the data in plots (a) - (c), we can obtain the scaling exponent function , the singularity strength , and the multifractal function . In Fig. 1 (d), the estimated scaling exponents and theoretical function in Eq. (18) are plotted with respect to for comparison. One can see that the empirical and theoretical values agree with each other nicely when and the estimation errors are also acceptable when , suggesting that MF-X-WL has a good performance in detecting the cross multifractal nature in two binomial measures. Furthermore, the nonlinear behavior between and is a hallmark of multifractality, agreeing with our expectation. Fig. 1 (e) presents a comparison of the singularity strength obtained from different methods. The solid line corresponds to the theoretical values. The squares and circles are obtained from the first derivation of the scaling exponents and the estimation of the slopes in Fig. 1 (b). One can find that the square and circle curve perfectly coincide with each other. However, both curves exhibit a downward shift from the theoretical line. Fig. 1 (f) illustrates the multifractal spectra of two binomial measures, in which a theoretical line and two estimated curves are plotted. Both empirical curves , obtained from Eq. (10) (squares) and Eq. (13) (circles), are again in good agreement with each other and exhibit deviations from the theoretical line on the left side, resulting from the estimation errors in when . Our results suggest that the MF-X-WL is able to provide acceptable results in the analysis of cross mutifractality in two binomial measures.
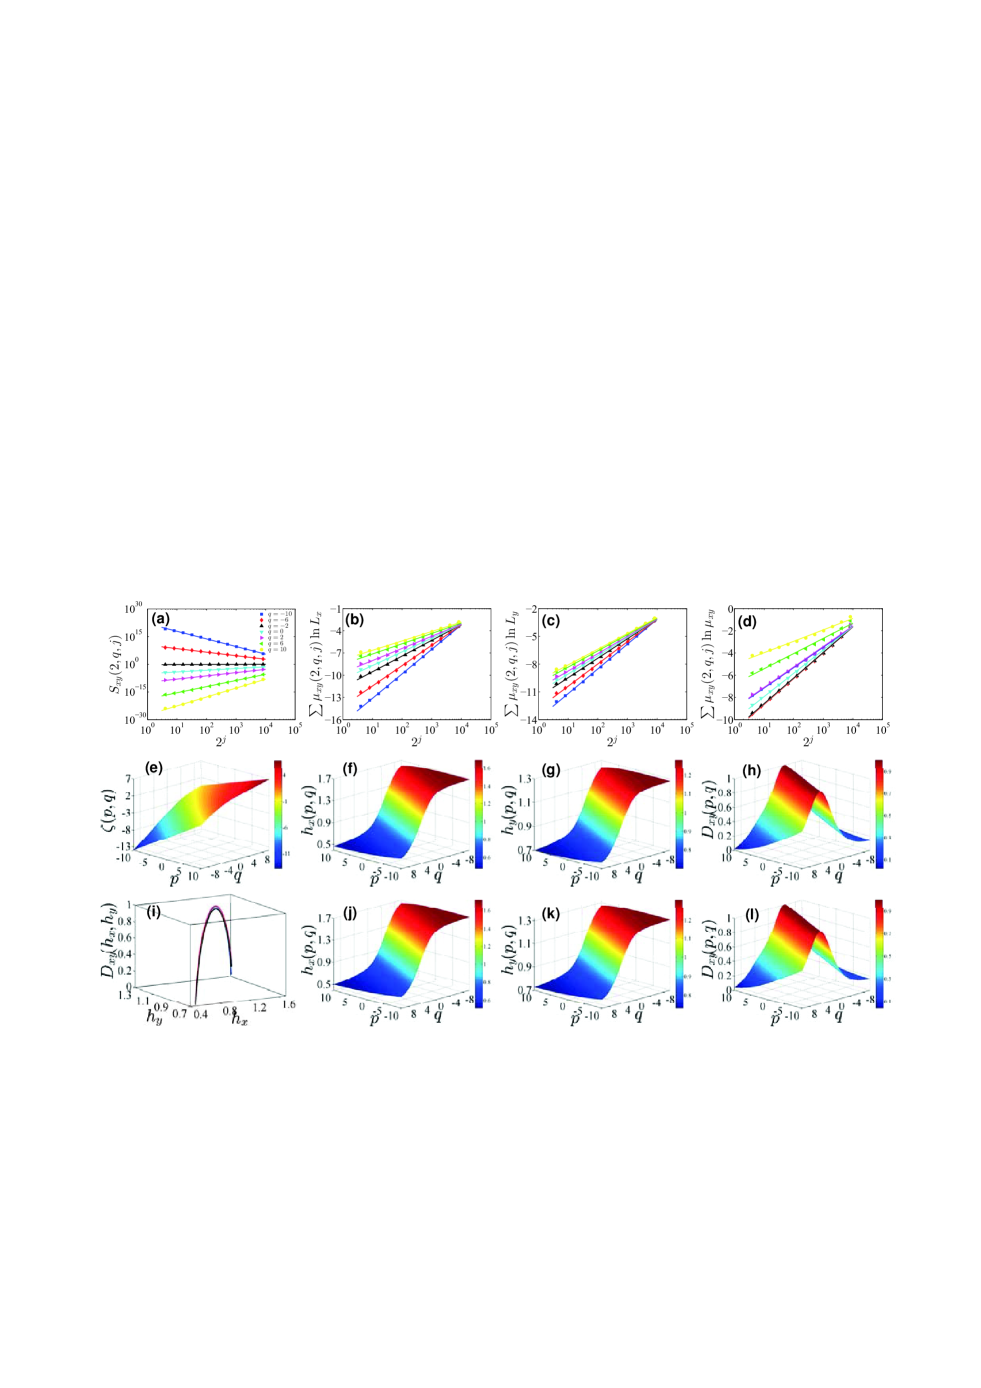
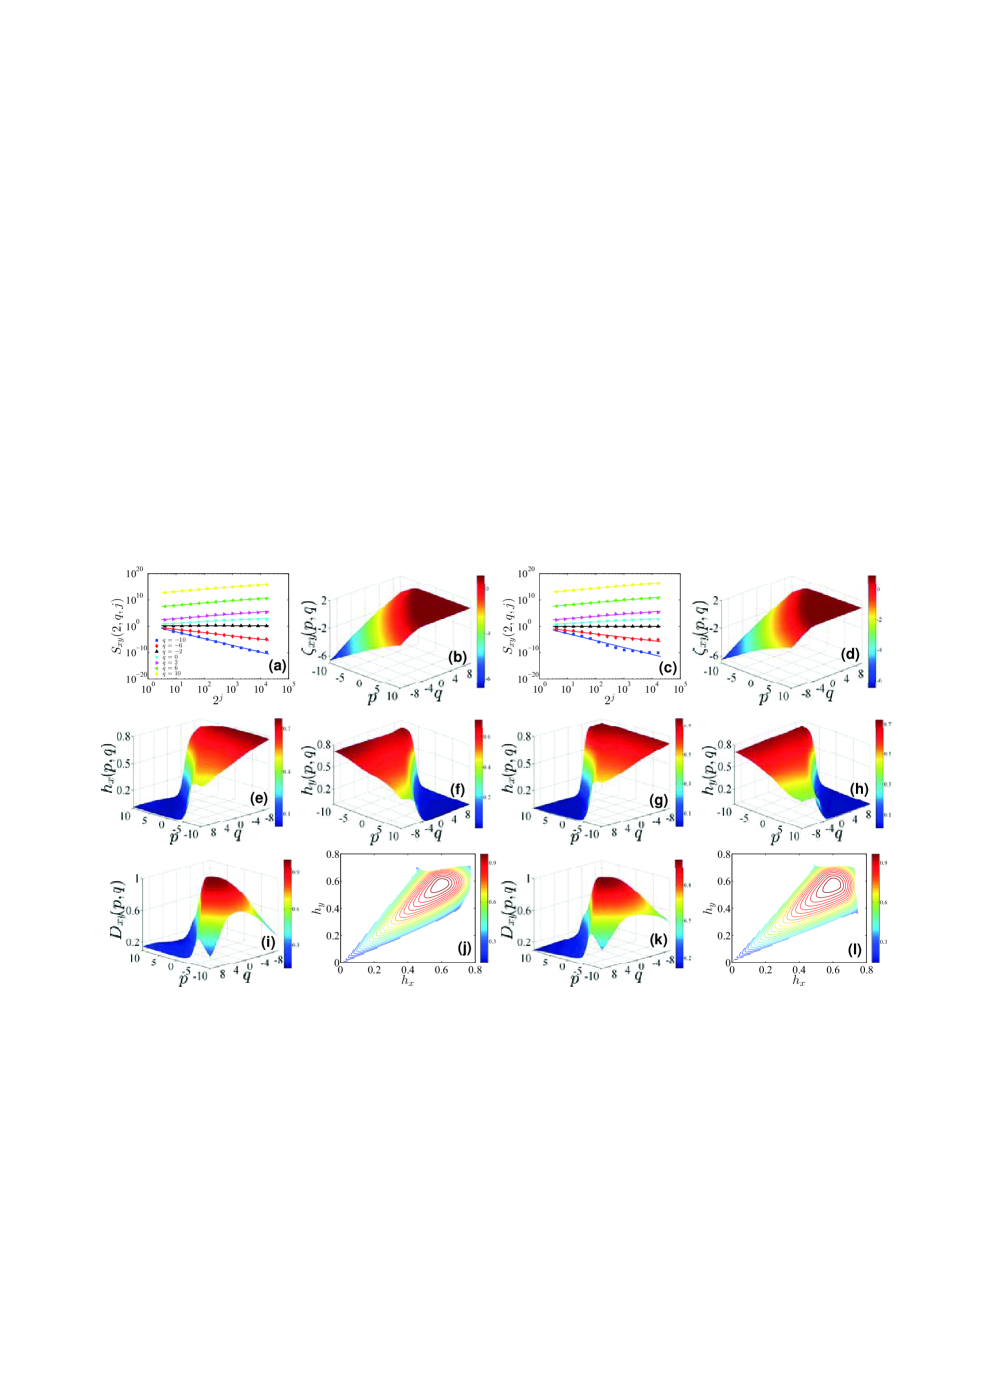
We then release the restriction of . Fig. 2 illustrate the corresponding results. In Fig. 2 (a), we present the power-law dependence between the partition function and the scale for different with fixed . The power-law behavior spans more than three orders of magnitudes. Fig. 2 (b) – (d) illustrates the plots of the three quantities , , and with respect to the scale . Again, very nice linear behaviors are observed between the three quantities and the logarithmic scale. The power-law exponents in panel (a) correspond to the scaling exponents . In Fig. 2 (e), we plot the scaling exponents as a function of and . Obviously, we can see that is a nonlinear function of and , verifying the cross multifractility in the two binomial measures.
Through the double Legendre transform presented in Eqs. (8)-(10), we can determine numerically the two singularity strength functions and and the multifractal spectrum from . The corresponding , and are shown in Fig. 2 (f), (g), and (h), respectively. Alternatively, Eqs. (11)-(13) provide another way to directly estimate the joint singularity strengthes and and the multifractal function , which are the slopes in panels (b), (c), and (d). And the results from the direct methods are illustrated in Fig. 2 (j), (k), and (l). In Fig. 2 (i), we plot the theoretical multifracal spectrum (blue dots) and two empirical multifractal spectra. One of the empirical spectra is obtained from the Legendre transform of (black dots) and the other empirical spectrum is given by the direct determination approach (red dots). We can find that the three multifractal spectra are not a planar surface, but a surface with curvatures, suggesting the univariate function relationship between and and/or . Such univariate function behavior of multifractal spectra is also uncovered by the MF-X-PF method Xie et al. (2015). The two empirical multifractal spectra do not overlap exactly with the theoretical spectrum, suggesting the existence of estimation errors when applying MF-X-WL to test the joint multifractal nature of two binomial measures.
III.2 Joint multifractal analysis of bivariate fractional Brownian motions
A bivariate fractional Brownian motion (bFBM) with parameters is a self-similar Gaussian process with stationary increments, where and are two univariate fractional Brownian motions with Hurst indices and and are the two components of the bFBM and the basic properties of multivariate fractional Brownian motions have been extensively studied Lavancier et al. (2009); Coeurjolly et al. (2010); Amblard et al. (2013). Extensive numerical experiments of multifractal cross-correlation analysis algorithms have been performed on bFBMs Jiang and Zhou (2011); Qian et al. (2015); Xie et al. (2015). The two Hurst indexes and of the two univariate FBMs and their cross-correlation coefficient are input arguments of the bFBM synthetic algorithm. By using the simulation procedure describe in Ref. Coeurjolly et al. (2010); Amblard et al. (2013), we have generated a realization of bFBM with , , and . The length of the bFBM is .
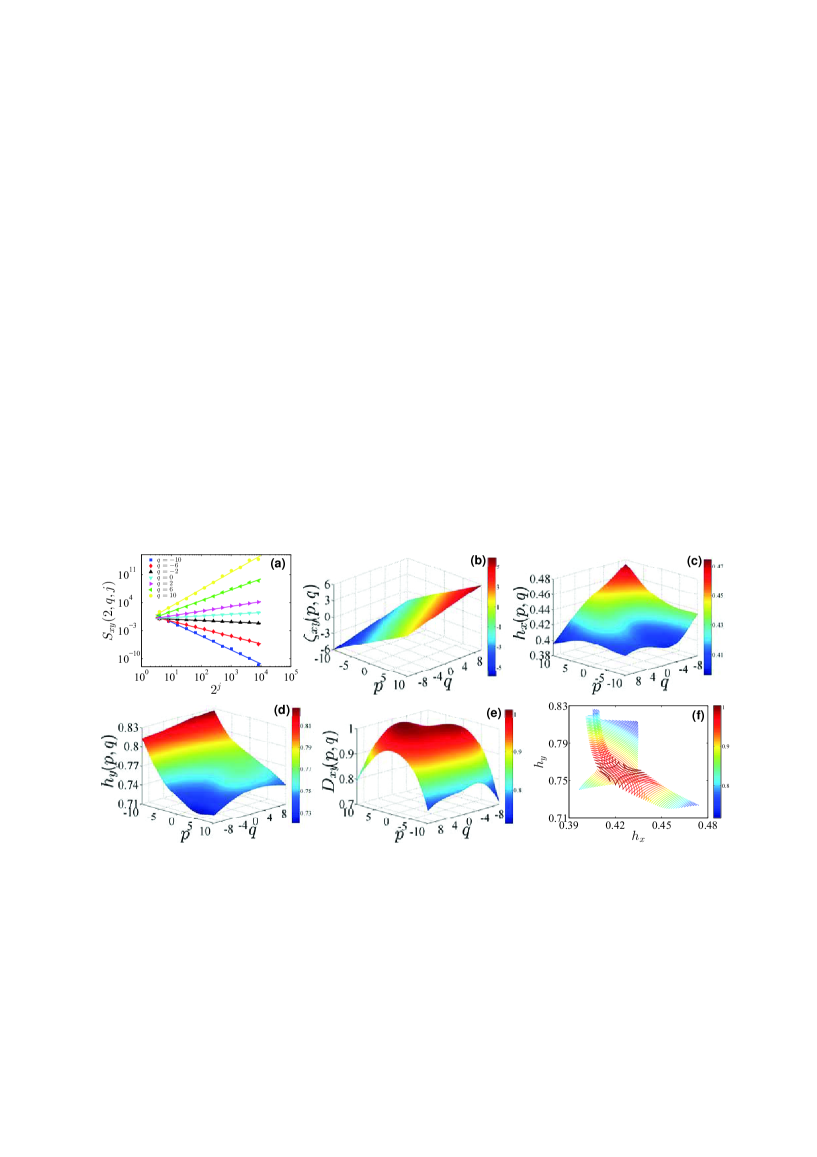
Following Ref. Xie et al. (2015), the cross singularity strength is a constant if each component is monofractal, which also leads to the constant cross multifractal spectrum . In Fig. 3, we present the results of the joint multifractal analysis on bFBMs using the MF-X-WL algorithm. Fig. 3 (a) illustrates the joint partition function against the scale for different with fixed . Intriguing power-law behaviors are observed between the partition functions and the scales. The least-squares estimation gives the scaling exponents . In Fig. 3 (b), the scaling exponents are plotted with respect to the moment orders and . A plane is observed, indicating that there is a linear relationship between and the moment orders and . Such result agrees well with the theoretical expectation. The bivariate regression gives that
| (19) |
Comparing with Eq. (10) we have , , and .
Eqs. (8) and (9) also provide an approximate way to estimate and . In Fig. 3 (c) and (d), we plot the joint singularity strength and , numerically estimated from taking the forward difference of , with respect to the moment orders and . The estimated joint singularity strengths and vary in a very narrow range, verifying the monofractal features. The average values of and are and , which nicely agree with and . Based on and , we can further give the multifractal function following Eq. (10), which is plotted with respect to and in Fig. 3 (e), and against and in Fig. 3 (f). The singularity function varies in a range from 0.7 to 1 with a mean value of 0.9457, smaller than . The estimated , , and from both approaches differ to certain degree from the corresponding theoretical values of , , and . The wide spanning range of also indicates that MF-X-WL may give spurious multifractality for bFBMs. The spurious results also strength the necessity of performing statistical tests on checking multifractality based on bootstrapping Jiang and Zhou (2007); Jiang et al. (2014).
IV Applications
IV.1 Financial markets
In this section, we first apply the MF-X-WL algorithm to uncover the cross multifractality in daily returns and volatilities of the Dow Jones Industrial Average (DJIA) index and the National Association of Securities Dealers Automated Quotations (NASDAQ) index. The daily return is defined as the logarithmic difference of daily closing price:
| (20) |
where is the closing price of the DJIA or the NASDAQ on day . Both indexes are retrieved from Yahoo finance. The spanning period of both indexes is from 5 December 1983 to 17 June 2016, containing 8192 data points in total. The volatilities are defined as the absolute values of the daily returns.
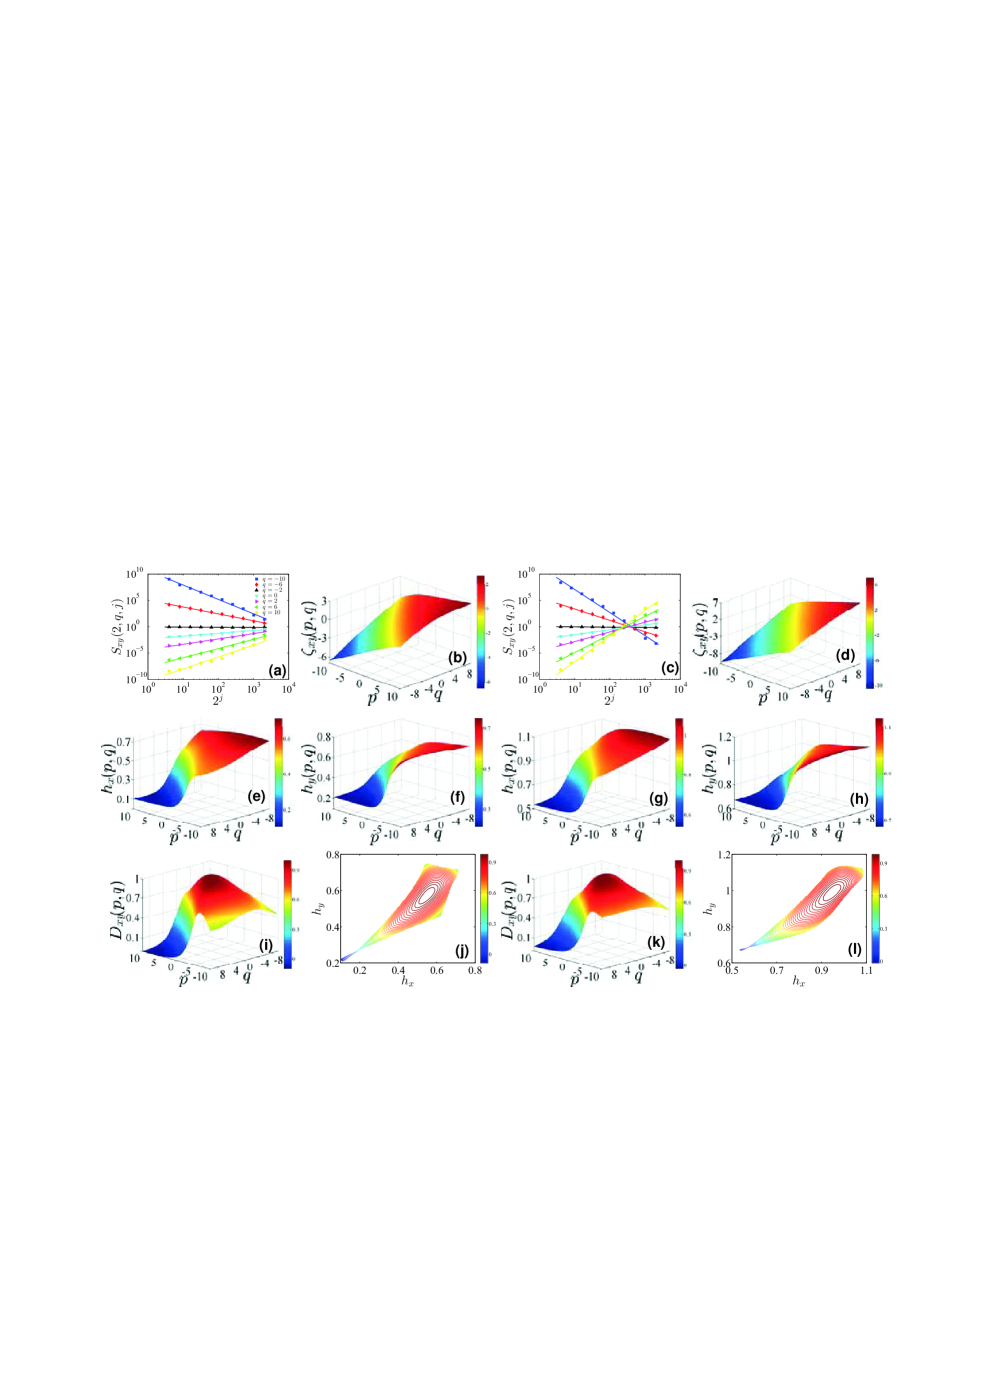
We present the empirical results when applying MF-X-WL on the returns and volatilities of the DJIA index and the NASDAQ index in Fig 4. The left two columns and right two columns of Fig. 4 correspond to the cross multifractal analysis of the two return series and the two volatility series, respectively.
In panels (a) and (c), the partition function is plotted with respect to the scale for different with fixed . One can see that in both panels the power-law scaling is extremely good, spanning over two orders of magnitude. The linear regression of with respect to for a given pair of and , gives the mass exponents , which are shown in panels (b) and (d). Intriguingly, the mass exponents are a nonlinear function of and in the two panels, indicating the presence of cross multifractal features in the return series and the volatility series.
The joint singularity strength functions and are plotted in panels (e, g) and panels (f, h), respectively. The singularity functions are numerically estimated from . We note that the singularity functions and of returns and volatilities are well dispersed with the spanning ranges greater than 0.5 and are a monotonic function of or . Such a width of both singularity strength functions confirms the existence of joint multifractality in the two return series and volatility series. We also find that the joint singularities of volatilities are greater than those of returns on average, indicating stronger memory behaviors in the volatility pairs.
Fig. 4 (i) and (k) illustrate the multifractal function obtained from the double Legendre transform. It is observed that the multifractal function locates in the range of with the maximum point at the point of in both panels. In Fig. 4 (j) and (l), we sketch the multifractal spectrum for returns and volatilities. Our empirical findings favor the existence of joint multifractality in return and volatility pairs of DJIA and NASDAQ.
IV.2 Online world
Following Ref. Jiang et al. (2010), we next investigate the cross multifractal feature in the online number of avatars in a massive multiplayer online role-playing game (MMORPG). Our online number records how many avatars are online simultaneously in each minute. We extract two pairs of online number of avatars from a popular MMORPG in China. In this virtual world, players need to select gender when they create their avatars. And when avatars achieve the level of 16, their operators need to assign the avatars to be a member in one of two opposed societies, namely, Xian and Mo societies. The first pair corresponds to the online number of male and female avatars. The second pair is the online number of avatars in Xian and Mo societies. Each series covers a period from June 2, 2011 to September 3, 2011 with a total number of 131072 points. We then apply the MF-X-WL to analyze the cross multifractal nature in each pair of the online numbers.
The empirical results of cross multifractal analysis are plotted in Fig. 5 for two pairs of online numbers. We show the empirical cross multifractality in the pair of and in the left two columns and of and in the right two columns.
Fig. 5 (a) and (c) illustrate the power-law relationship between the partition function and the scale for different with fixes . We observe that the spanning range of the power-law is more than three orders of magnitude. The mass exponents , corresponding the power-law exponents of versus , are shown in Fig. 5 (b) and (d). In both panels, the mass exponents increase nonlinearly with respect to or , implying the evident cross multifractality in both pairs of the online numbers.
Following Eqs. (8-9), we numerically estimate the joint singularity strength functions and and plot them in Fig. 5 (e, g) and (f, h), respectively. One can see that, for both pairs of online numbers, the shapes of are very similar to each other. We also observe that the maximum value, the spanning range, and the minimum value of are all very close in panels (e) and (g). For the joint singularity strength , very similar behaviors are observed. The widths of both singularity strength functions are very close to 0.8, further confirming the existence of cross multifractal nature in both pairs of online numbers. In Fig. 5 (i, k) and (j, l), we further plot the multifractal function and the multifractal spectrum for the pair of and and the pair of and , respectively. The wide spanning range of again offer strong evidence in favor of the multifractal characteristics in the cross-correlation in both pairs of online numbers.
V Summary and conclusions
We have developed a new approach for joint multifractal analysis with two moment orders based on wavelet leaders, termed as MF-X-WL. The MF-X-WL approach overcomes the shortcoming of the multifractal wavelet analysis that the moment order much be positive. Extensive numerical experiments has been carried out to check the performances of the MF-X-WL method, in which the testing time series pairs are generated from binomial measures and bivariate fractional Brownian motions. Furthermore, this MF-X-WL method has also been applied to the time series pairs from financial markets and online worlds to test its ability to detect any joint multifractalities, in which the testing data include pairs of returns, volatilities, and online avatar numbers.
In the numerical experiments, we found that the MF-X-WL method is able to detect respectively the joint multifractality and monofractality in binomial measures and bivariate fractional Brownian motions, but is not able to give very accurate results. For the synthetic data, we can obtain very nice power-law scaling behaviors between the partition functions and the scale. And we can verify the nonlinear (respectively, linear) feature of the scaling exponent against or for binomial measures (bivariate fractional Brownian motions). However, the estimation errors are propagated when we calculate the joint singularity strengths and the multifractal functions (see Fig. 1 (e, f), Fig. 2 (i) and Fig. 3 (c- f)). As we know, comparing with the DFA-based methods, the wavelet based methods are not the best approach for multifractal analysis Kantelhardt et al. (2002); Oświȩcimka et al. (2006). Possible explanations are as follows: (1) Many other methods, like DFA, are directly applied on the series itself, while the wavelet-based approach is performed on the wavelet coefficients of the analyzed series. The wavelet transform could introduce computational errors, which could be magnified in the followup multifractal analysis. (2) The wavelet leaders are the maximum absolute wavelet coefficients across all scales under consideration. Dropping the non-maximum wavelet coefficients may induce errors in the followup analysis, because these values may have the information of multifractality. However, it is still worth to investigate wavelet-based multifractal methods, since wavelet analysis is wildly accepted in the field of economics and finance, compared to other Econophysics methods.
In the applications, we have used the MF-X-WL method to analyze the joint multifractality in pairs of returns and volatilities in stock markets and pairs of online avatar numbers in an online world. All the empirical results confirm the presence of joint multifractality in pairs of financial series and online number series. Because of lacking theoretical solutions of multifractal formulism for real world series, we cannot offer the impression about the accuracy of the MF-X-WL. One possible solution is to compare with the results of other methods, like MF-X-DFA and MF-X-PF, which is however for future research.
Acknowledgements.
We acknowledge financial support from the National Natural Science Foundation of China (11375064 and 71131007), the Program for Changjiang Scholars and Innovative Research Team in University (IRT1028), and the Fundamental Research Funds for the Central Universities.References
- Podobnik and Stanley (2008) B. Podobnik and H. E. Stanley, Phys. Rev. Lett. 100, 084102 (2008).
- Grassberger (1983) P. Grassberger, Phys. Lett. A 97, 227 (1983).
- Grassberger and Procaccia (1983) P. Grassberger and I. Procaccia, Physica D 9, 189 (1983).
- Halsey et al. (1986) T. C. Halsey, M. H. Jensen, L. P. Kadanoff, I. Procaccia, and B. I. Shraiman, Phys. Rev. A 33, 1141 (1986).
- Kolmogorov (1962) A. N. Kolmogorov, J. Fluid Mech. 13, 82 (1962).
- Anselmet et al. (1984) F. Anselmet, Y. Gagne, E. J. Hopfinger, and R. A. Antonia, J. Fluid Mech. 140, 63 (1984).
- Castro e Silva and Moreira (1997) A. Castro e Silva and J. G. Moreira, Physica A 235, 327 (1997).
- Weber and Talkner (2001) R. O. Weber and P. Talkner, J. Geophys. Res. 106, 20131 (2001).
- Kantelhardt et al. (2002) J. W. Kantelhardt, S. A. Zschiegner, E. Koscielny-Bunde, S. Havlin, A. Bunde, and H. E. Stanley, Physica A 316, 87 (2002).
- Alessio et al. (2002) E. Alessio, A. Carbone, G. Castelli, and V. Frappietro, Eur. Phys. J. B 27, 197 (2002).
- Carbone et al. (2004a) A. Carbone, G. Castelli, and H. E. Stanley, Physica A 344, 267 (2004a).
- Carbone et al. (2004b) A. Carbone, G. Castelli, and H. E. Stanley, Phys. Rev. E 69, 026105 (2004b).
- Gu and Zhou (2010) G.-F. Gu and W.-X. Zhou, Phys. Rev. E 82, 011136 (2010).
- Meneveau et al. (1990) C. Meneveau, K. R. Sreenivasan, P. Kailasnath, and M. S. Fan, Phys. Rev. A 41, 894 (1990).
- Xie et al. (2015) W.-J. Xie, Z.-Q. Jiang, G.-F. Gu, X. Xiong, and W.-X. Zhou, New J. Phys. 17, 103020 (2015).
- Wang et al. (2012) J. Wang, P.-J. Shang, and W.-J. Ge, Fractals 20, 271 (2012).
- Kristoufek (2011) L. Kristoufek, EPL (Europhys. Lett.) 95, 68001 (2011).
- Zhou (2008) W.-X. Zhou, Phys. Rev. E 77, 066211 (2008).
- Carbone and Castelli (2003) A. Carbone and G. Castelli, Proceedings of the SPIE 5114, 406 (2003).
- Arianos and Carbone (2007) S. Arianos and A. Carbone, Physica A 382, 9 (2007).
- Carbone (2007) A. Carbone, Phys. Rev. E 76, 056703 (2007).
- Carbone and Kiyono (2016) A. Carbone and K. Kiyono, Phys. Rev. E 93, 063309 (2016).
- Tsujimoto et al. (2016) Y. Tsujimoto, Y. Miki, S. Shimatani, and K. Kiyono, Phys. Rev. E 93, 053304 (2016).
- Kiyono and Tsujimoto (2016) K. Kiyono and Y. Tsujimoto, Phys. Rev. E 94, 012111 (2016).
- Jiang and Zhou (2011) Z.-Q. Jiang and W.-X. Zhou, Phys. Rev. E 84, 016106 (2011).
- Oświȩcimka et al. (2014) P. Oświȩcimka, S. Drożdż, M. Forczek, S. Jadach, and J. Kwapień, Phys. Rev. E 89, 023305 (2014).
- Kwapień et al. (2015) J. Kwapień, P. Oświȩcimka, and S. Drożdż, Phys. Rev. E 92, 052815 (2015).
- Qian et al. (2015) X.-Y. Qian, Y.-M. Liu, Z.-Q. Jiang, B. Podobnik, W.-X. Zhou, and H. E. Stanley, Phys. Rev. E 91, 062816 (2015).
- Wang et al. (2010) Y.-D. Wang, Y. Wei, and C.-F. Wu, Physica A 389, 5468 (2010).
- Wang et al. (2011) Y.-D. Wang, Y. Wei, and C.-F. Wu, Physica A 390, 864 (2011).
- Wang and Xie (2013a) G.-J. Wang and C. Xie, Nonlin. Dyn. 73, 1687 (2013a).
- Wang and Xie (2013b) G.-J. Wang and C. Xie, Physica A 392, 1418 (2013b).
- Ma et al. (2013) F. Ma, Y. Wei, and D.-S. Huang, Physica A 392, 1659 (2013).
- Wang et al. (2013) D.-H. Wang, Y.-Y. Suo, X.-W. Yu, and M. Lei, Physica A 392, 1172 (2013).
- Wang et al. (2014) G.-J. Wang, C. Xie, L.-Y. He, and S. Chen, Physica A 405, 70 (2014).
- Zhou and Chen (2016) Y. Zhou and S. Chen, Physica A 443, 117 (2016).
- Holschneider (1988) M. Holschneider, J. Stat. Phys. 50, 963 (1988).
- Arnéodo et al. (1988) A. Arnéodo, G. Grasseau, and M. Holschneider, Phys. Rev. Lett. 61, 2281 (1988).
- Muzy et al. (1991) J. F. Muzy, E. Bacry, and A. Arnéodo, Phys. Rev. Lett. 67, 3515 (1991).
- Hudgins et al. (1993) L. Hudgins, C. Friehe, and M. Mayer, Phys. Rev. Lett. 71, 3279 (1993).
- Maraun and Kurths (2004) D. Maraun and J. Kurths, Nonlin. Proc. Geophys. 11, 505 (2004).
- Aguiar-Conraria and Soares (2014) L. Aguiar-Conraria and M. J. Soares, J. Econ. Surveys 28, 344 (2014).
- Lashermes et al. (2008) B. Lashermes, S. G. Roux, P. Abry, and S. Jaffard, Eur. Phys. J. B 61, 201 (2008).
- Serrano and Figliola (2009) E. Serrano and A. Figliola, Physica A 388, 2793 (2009).
- Wendt et al. (2009) H. Wendt, S. G. Roux, S. Jaffard, and P. Abry, Signal Process. 89, 1100 (2009).
- Chhabra and Jensen (1989) A. B. Chhabra and R. V. Jensen, Phys. Rev. Lett. 62, 1327 (1989).
- Meneveau and Sreenivasan (1987) C. Meneveau and K. R. Sreenivasan, Phys. Rev. Lett. 59, 1424 (1987).
- Lavancier et al. (2009) F. Lavancier, A. Philippe, and D. Surgailis, Statist. Prob. Lett. 79, 2415 (2009).
- Coeurjolly et al. (2010) J.-F. Coeurjolly, P.-O. Amblard, and S. Achard, Eur. Signal Process. Conf. 18, 1567 (2010).
- Amblard et al. (2013) P.-O. Amblard, J.-F. Coeurjolly, F. Lavancier, and A. Philippe, Bulletin Soc. Math. France, Séminaires et Congrès 28, 65 (2013).
- Jiang and Zhou (2007) Z.-Q. Jiang and W.-X. Zhou, Physica A 381, 343 (2007).
- Jiang et al. (2014) Z.-Q. Jiang, W.-J. Xie, and W.-X. Zhou, Physica A 405, 235 (2014).
- Jiang et al. (2010) Z.-Q. Jiang, F. Ren, G.-F. Gu, Q.-Z. Tan, and W.-X. Zhou, Physica A 389, 807 (2010).
- Oświȩcimka et al. (2006) P. Oświȩcimka, J. Kwapień, and S. Drożdż, Phys. Rev. E 74, 016103 (2006).