Tidal features of classical Milky Way satellites in a CDM universe
Abstract
We use the APOSTLE cosmological hydrodynamic simulations to examine the effects of tidal stripping on cold dark matter (CDM) subhaloes that host three of the most luminous Milky Way (MW) dwarf satellite galaxies: Fornax, Sculptor, and Leo I. We identify simulated satellites that match the observed spatial and kinematic distributions of stars in these galaxies, and track their evolution after infall. We find 30 of subhaloes hosting satellites with present-day stellar mass - experience stellar mass loss after infall. Fornax analogues have earlier infall times compared to Sculptor and Leo I analogues. Star formation in Fornax analogues continues for – Gyr after infall, whereas Sculptor and Leo I analogues stop forming stars - Gyr after infall. Fornax analogues typically show more significant stellar mass loss and exhibit stellar tidal tails, whereas Sculptor and Leo I analogues, which are more deeply embedded in their host DM haloes at infall, do not show substantial mass loss due to tides. When additionally comparing the orbital motion of the host subaloes to the measured proper motion of Fornax we find the matching more difficult; host subhaloes tend to have pericentres smaller than that measured ones for Fornax itself. From the kinematic and orbital data, we estimate that Fornax has lost of its infall stellar mass. Our best estimate for the surface brightness of a stellar tidal stream associated with Fornax is 32.6 mag , which may be detectable with deep imaging surveys such as DES and LSST.
keywords:
1 Introduction
Milky Way (MW) dwarf spheroidal (dSph) satellite galaxies are among the most dark matter (DM) dominated stellar systems in the Universe (Mateo, 1998; McConnachie, 2012; Walker, 2013). High mass-to-light ratios in these systems have been derived from their velocity dispersion under the assumption that their stellar populations are in dynamical equilibrium. However, this assumption of dynamical equilibrium has been called into question, and must continue to be scrutinised as larger kinematic samples and deeper photometric surveys become available.
Around the MW, in addition to the clear case of Sagittarius (Ibata et al., 1994), among the “classical” dSphs only Carina (Muñoz et al., 2006; Battaglia et al., 2012; McMonigal et al., 2014) and a few “ultra-faint” dwarf galaxies (e.g. the Hercules dSph; Roderick et al. 2015) show signs of having been affected by tides. Around M31 there is evidence of ongoing tidal disturbance in several satellite galaxies (Choi et al., 2002; Crnojević et al., 2014). Although tidal features are not evident in the majority of dSphs, this may simply be because photometric datasets are not sufficiently deep and wide enough to identify them.
Models of galaxy formation in a CDM cosmogony can only reproduce the present-day properties of the MW satellite system if a fraction of satellites experience significant mass loss as the result of tidal interactions with their host (Li et al., 2010; Barber et al., 2015; Sawala et al., 2016). Tidal stirring may also be an effective mechanism for transforming disky field dwarfs into objects with properties resembling dSphs (Tomozeiu et al., 2016). Tidal stripping of satellite galaxies can also provide a unique test of the nature of DM. For example, satellite galaxies are more vulnerable to tides if their gravitational potentials are shallow or cored (Errani et al., 2015), for example due to dark matter self-interactions (Dooley et al., 2016). Different dark matter scenarios, for example warm dark matter (Lovell et al., 2014) or late-decaying dark matter (Wang et al., 2014), also predict different subhalo assembly histories for a given dSph. Wang et al. (2016) show that the CDM subhaloes that best match the stellar mass and kinematics of Fornax are those that have been severely tidally stripped.
Several previous authors have used N-body simulations to examine the observational signatures of tidal interactions on MW satellite galaxies. Muñoz et al. (2008) examine whether the observed features of the Carina dSph can be accounted for by a mass-follows-light model that includes tidal disruption, finding that tidal stripping can strongly affect stars at large radii. Peñarrubia et al. (2008) find that once stars start to be stripped from a dSph, the dark-to-luminous mass ratio increases, and consider the implications of this for the known dSphs. Battaglia et al. (2015) simulate subhaloes with orbits and structural properties that match the Fornax dSph, and find that the structure and kinematics of the stars are only mildly affected by tidal interactions. Klimentowski et al. (2007) study how unbound particles affect the interpretation of stellar kinematics, with a specific application to Fornax. Read et al. (2006) also examine the effects of tidal stripping and tidal shocking to the dSph velocity dispersion profiles.
In this paper, using high-resolution cosmological hydrodynamical simulations from the APOSTLE project, we match simulated satellites, and hence subhaloes, to the observable properties of bright MW dSphs. We examine the nature of faint stellar tidal features associated with these subhaloes and make predictions applicable to real dSphs. Our study is the first attempt to examine the formation of dSph tidal features in an cosmological context with full hydrodynamical models. We specifically focus on satellites in the stellar mass range of -, which are very well resolved by the APOSTLE simulations; the classical MW dSphs that fall within this mass range are Fornax, Sculptor, and Leo I. We predict the surface brightness of tidal streams associated with simulated dSphs, and compare to the surface brightness of known diffuse stellar substructures in the halo of the MW. We also consider the possibility that unbound stars contaminate existing kinematic datasets for these galaxies.
The outline of the paper is as follows. In § 2, we briefly describe the simulations used in our analysis. In § 3 we review our procedure for constructing a subhalo sample from the simulations by matching to observational data. In § 4 we show the general effects of gravitational tides on subhaloes, including the effects on dark matter and stellar mass loss, and changes to the galaxy stellar velocity dispersion. In § 5 and in § 6 we present our results, including the overall properties and mass assembly histories of the bright dSph analogues and the detectability of tidal features around them. Finally we summarise our conclusions in § 7.
2 Simulations
We use sets of high-resolution LG simulations from the APOSTLE project (A Project Of Simulating The Local Environment). For details we refer the readers to the original simulation papers (Fattahi et al., 2016; Sawala et al., 2016). Here we briefly describe some basic properties of the simulations.
The simulations were performed with the code developed for the EAGLE (Evolution and Assembly of GaLaxies and their Environments) project (Schaye et al., 2015; Crain et al., 2015). The Eagle code is a modified version of P-Gadget-3, which is an improved version of the publicly available Gadget-2 code (Springel 2005). For our study, we utilize both the medium-resolution (MR) and high-resolution (HR) runs of the APOSTLE simulations (corresponding to L2 and L1 resolution in Sawala et al. (2016)). The HR runs consist of three Local Group realizations (AP-1, AP-4, and AP-11 in Fattahi et al. (2016)), which contain six MW-mass host haloes with , , , , , and at . is defined as the halo mass enclosed within a density contour 200 times greater than the critical density of the Universe. The primordial gas particle mass of AP-1 (AP-4, AP-11) is ; the dark matter particle mass is . The maximum gravitational softening length is 134 pc for all three HR runs.
We also include the 12 Local Group pairs of MR runs in our analysis. The total mass of each pair (i.e., the sum of the virial masses of the two primary haloes) is in the range . The primordial gas particle mass spans the range of , and the dark matter particle mass range is –. The maximum gravitational softening length is 307 pc for all MR runs. The APOSTLE simulations were performed in the WMAP-7 cosmology (Komatsu et al., 2011), with density parameters at for matter, baryons and dark energy of , and , respectively, Hubble parameter , linear power spectrum amplitude on the scale of = 0.81 and power-law spectral index . Dark matter haloes in both simulations were identified using the friends-of-friends (FoF) algorithm. Each FoF halo was iteratively decomposed into self-bound subhaloes using the SUBFIND algorithm (Springel et al., 2001).
3 Methodology
In this section we outline how we identify subhaloes in APOSTLE simulations that provide good matches to the observed stellar kinematics of particular dSphs. We review the procedure outlined in Wang et al. (2016), based on the Jeans formalism, which we follow closely here, and also the dynamical mass estimation in Fattahi et al. (2016b) that we adopt for selecting MR analogues. We then describe how we identify tidally stripped stars previously associated with simulated dSphs.
3.1 Selecting simulated analogues of real dSphs
We focus on MW satellites in the stellar mass range . Three of the so-called classical MW dSph satellite galaxies have a stellar mass in this range (assuming a stellar mass-to-light ratio of order unity): Fornax (absolute magnitude ), Sculptor () and Leo I () (Mateo, 1998). These three dSphs have similar line-of-sight (LOS) stellar velocity dispersion – (Mateo et al., 2008; Walker et al., 2009).
We consider a sequence of increasingly stringent conditions to select potential bright dSph analogues in the simulations, as follows:
-
1.
Select subhaloes with stellar masses broadly consistent with the observed dSph luminosity, assuming a stellar mass-to-light ratio –. We choose the acceptable Fornax stellar mass range to be –. For both Sculptor and Leo I the corresponding range is –. Observational estimates of stellar mass are – for Fornax, for Sculptor and for Leo I (Wolf et al., 2010; McConnachie, 2012; de Boer et al., 2012).
-
2.
Apply the Jeans formalism to select HR subhaloes with gravitational potentials that match the observed stellar kinematics, using the methods described in §3.2. The spatial resolution of the MR simulations is not high enough to resolve the subhalo potential within the dSph half-light radius, so instead we use (the circular velocity at the half-light radius), as described in Fattahi et al. (2016b), to constrain the stellar kinematic properties of our dSphs in these simulations.
-
3.
Determine how well the orbits of these subhaloes match those derived from the observed mean radial velocity and proper motion of the real dSphs by selecting those analogues at least with comparable orbital pericentres.
3.2 Fitting dSph stellar kinematics
To identify subhaloes in the HR simulations with observed stellar kinematic and photometric data to match Fornax, Sculptor, and Leo I, we use the spherical Jeans equations, allowing for a constant but non-zero anisotropy in the stellar velocity dispersion. We follow a similar approach to that outlined in Wang et al. (2016), to which we refer the reader for more details.
We begin by identifying subhaloes in the simulations with the halo finder SUBFIND. For each subhalo, the self-bound dark matter distribution is determined as a function of radius. Given the potential of each subhalo, the parametrised stellar distribution, and velocity anisotropy, we solve the spherical Jeans equations to determine the line-of-sight velocity dispersion assuming that the potential is spherically symmetric, dispersion-supported, and in dynamical equilibrium. The derived velocity dispersion is then fitted to the stellar kinematic data by marginalizing over model parameters via a Markov Chain Monte Carlo (MCMC) method to determine the best fit values.
The dSph stellar kinematic data we use are line-of-sight velocity measurements from the samples described in Walker et al. (2009). In this sample we consider only stars with 90 probability of membership. We bin the velocity data in circular annuli and derive the mean line-of-sight velocity in each annulus as function of projected radius. The line-of-sight velocity dispersion and associated error in each annulus are calculated following the method described in Strigari et al. (2010).
Since MR subhaloes have poor resolution of the potential within the half-light radius of the dSphs we study, we adopt the approach described in Fattahi et al. (2016b) to identity the kinematic properties of these subhaloes. We select MR subhaloes that match the observed value of , which is the circular velocity at the half-light radius with estimated enclosed mass . The values obtained for each Milky Way classical dSph are listed in Fattahi et al. (2016b). The radii where V1/2 is measured in the MR runs are smaller than the convergence radius defined by Power et al. (2003). To correct for this numerical resolution, we use the approach described in Appendix A of Fattahi et al. (2016b). For example, to find Fornax analogues we select central111Central refers to the most massive structure of a given FoF group galaxies in the stellar mass range of interest and measure the level of correction for their . We then apply an average correction to of satellite galaxies in the same stellar mass range.
3.3 Tracing stellar tidal features
An important part of our analysis is to determine the mass of dark matter and stars lost by a given dwarf satellite galaxy after it falls into its Galactic-analogue host halo and the corresponding evolution of stellar tidal features. To do this, we identify each dwarf galaxy at its time of infall (using a merger tree algorithm that links haloes and subhaloes between simulation outputs). We then consider the set of all stellar, gaseous and dark matter particles that were gravitationally bound to this galaxy at any time after the infall time. We trace all these particles down to . If any new particles are added to the system by ongoing star formation or the gravitational capture of smaller systems between the infall time and the present day, these will not be included in our procedure. It is then trivial to calculate, for example, the fraction of stellar mass lost since infall, and to separate particles at any time into those that have been stripped and those that remain bound to the satellite.
4 Effects of Tides on Subhaloes
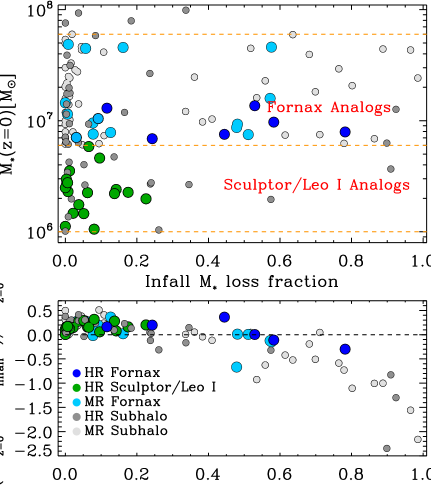
In the upper panel of Fig. 1 we plot the fraction of stellar mass that has been lost since infall for all luminous () subhaloes. This fraction is computed using only those star particles that are bound to the subhalo at the time of infall and therefore does not include any stars formed (or accreted) after infall. This additional stellar mass is, however, included in the present-day stellar mass plotted on the -axis of Fig. 1. We use different colours to highlight HR and MR analogues of MW dSphs that we identify on the basis of their stellar kinematics (dark blue for HR Fornax, light blue for MR Fornax, and green for HR Sculptor/Leo I analogues). The rest of the subhaloes are shown as grey circles (dark grey for HR, and light grey for MR). We will describe the properties of these dSph analogues in detail in §5.
In general we find that present-day subhaloes with stellar mass in the range we study have experienced very different degrees of stellar mass loss. This reflects the diversity of their orbital properties and dark matter halo masses and sizes. We find that 36 out of 127 () subhaloes (taking HR and MR together) in the present-day stellar mass range shown have lost of the stellar mass they had at infall. Among the subhaloes we identify as bright dSph analogues (of both Fornax and Sculptor/Leo), 11 out of 39 () have lost more than , and majority of them are Fornax analogues. Some of these subhaloes have undergone even more significant stellar stripping, with mass loss for of all subhaloes and of dSph analogues. Notably, 10 out of 21 Fornax analogues (both HR and MR) have stellar mass loss fractions . On the other hand, all Sculptor/Leo I analogues have mild stellar mass loss, . This result agrees with other studies of tidal effects on Milky Way dSphs using the APOSTLE simulations (Sawala et al., 2016; Fattahi et al., 2016b). These studies show that present-day haloes that have and host observable dwarf galaxies have been affected by tidal stripping even more strongly than typical satellite haloes of the same mass. Similar findings are also shown in Sawala et al. (2016), in particular dwarf galaxies in APOSTLE simulations are biased towards stronger stripping compared to haloes that did not form stars. As pointed out in Sawala et al. (2016), this is an important factor in explaining why these simulations do not demonstrate the ”too big to fail” problem posed by Boylan-Kolchin et al. (2011). Fattahi et al. (2016b) also show that tidal stripping may have significantly reduced the dark matter content of several Milky Way dSphs. Fornax is a clear case for which the value of is systematically lower than that expected for satellites with comparable luminosity (also see Cooper et al. (2010); Guo et al. (2015) for similar arguments).
In the lower panel of Fig. 1 we show the fractional change in stellar velocity dispersion between the infall time and the present day, as a function of the fraction of total mass lost since infall. We can interpret these results in the context of previous studies which showed how tidal forces and mass loss affect the stellar velocity dispersion of dwarf satellite galaxies (e.g. Peñarrubia et al., 2008). For modest amounts of total mass loss () we find an increase in stellar velocity dispersion by up to . This is likely due to a combination of tidal heating, ongoing star formation and (in a small number of cases) ongoing accretion of stars from bound companions. For subhaloes that lose of their total mass after infall, the stellar velocity dispersion drops drastically. In intermediate cases (total mass loss fractions of –) the change in stellar velocity dispersion follows a smooth evolution between those two regimes with some scatters, reflecting the changing balance between the different effects.
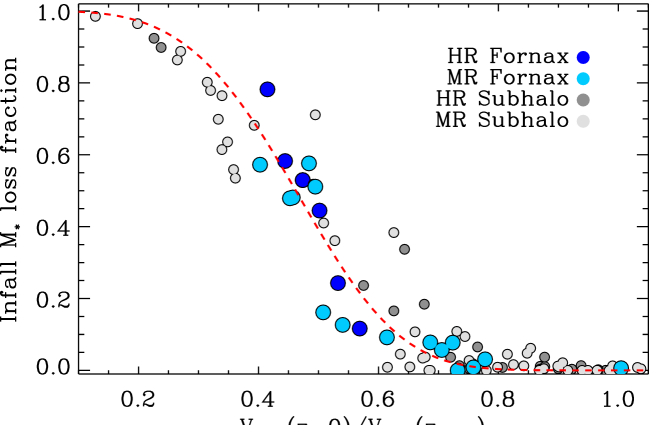
It is expected that the effects of tides on stellar components are highly correlated with the degree to which the dark matter halo is tidally stripped. The galaxies are embedded deeply inside the dark matter potential wells, thus subhaloes will typically experience significant dark matter halo mass loss before the main stellar distribution begins to show signs of tidal disturbance. In Fig. 2 we show the infall stellar mass loss fraction as a function of the ratio of subhalo circular velocity at the present day to that at infall, , for subhaloes (both HR and MR) with stellar mass . We verify that the tidal effects on the dark matter and stellar components of subhaloes are consistent with this picture: there is no significant stellar tidal stripping (e.g. ) until the dark matter halo is severely stripped (e.g. ). We find that the relation between infall stellar mass loss fraction () and change in is well represented by the following fitting function:
| (1) |
where . The best fit values of the parameters are and . The fit is shown by the red dashed line in Fig. 2.
5 Properties of dwarf spheroidal analogues
In this section we discuss the properties of the simulated bright dSph analogues that are either indicative of or determined their tidal stripping, including their present-day densities and velocity profiles, the evolution of their stellar, gaseous and dark mass before and after infall, and their orbital motions, which we compare to those estimated for their observed counterparts.
5.1 Density and velocity profiles
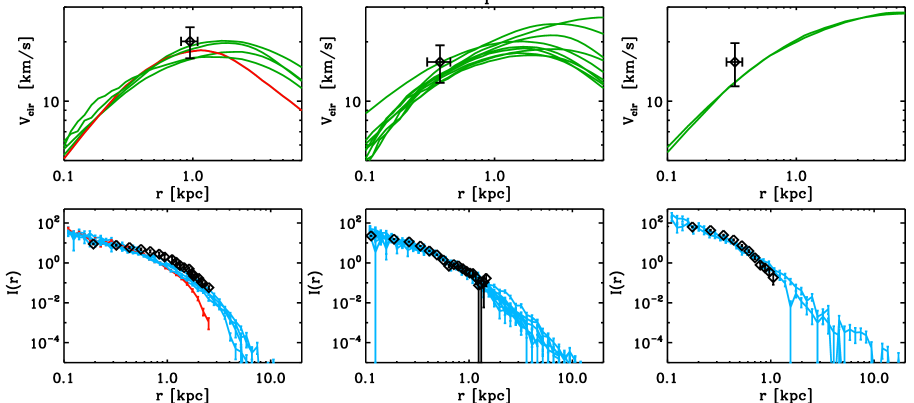
In upper panels of Fig. 3 we show the circular velocity profiles of subhaloes in the HR runs that match the observed surface density of giant stars in Fornax, Sculptor, and Leo I and corresponding radial velocity measurements. Here, only these internal properties are used as constraints . The estimates of circular velocity at the half-light radius () for each dSph (from Fattahi et al. 2016b, marked by black diamonds with uncertainties of percentile intervals) agree well with the results of our full Jeans analysis. The projected stellar density profiles also agree well with observations (shown in the lower panels of Fig. 3, as black diamonds with Poisson errors). The observed star count (number density) profiles are taken from Coleman et al. (2005) (Fornax, lower left panel), Battaglia et al. (2008) (Sculptor, lower middle panel), and Smolčić et al. (2007) (Leo I, lower right panel). We have scaled the stellar mass density profiles from the simulations to match the amplitude of the observed number density profiles of bright giants. For the simulated Fornax circular velocity curves, the maximum circular velocity at is in the range –. In contrast to Fornax, the Sculptor and Leo I analogues have a wider range with values up to . These ranges agree well with previous works (e.g. Peñarrubia et al., 2008; Strigari et al., 2010; Boylan-Kolchin et al., 2012; Sawala et al., 2016; Fattahi et al., 2016b) even though some of those analyses were carried out using dark matter-only simulations or assuming NFW potentials. The Fornax stellar density profiles steepen beyond kpc, whereas Sculptor and Leo I have somewhat shallower profiles. We find that the average stellar velocity dispersion of the bound star particles is –, which agrees well with the observed values. This indicates that those systems are in equilibrium and hence confirms that our use of the Jeans formalism is appropriate for the simulated systems. We note that Sculptor and Leo I have very similar stellar kinematic properties and light profile shapes. The sets of Sculptor and Leo I analogues have many subhaloes in common. Therefore, we do not distinguish between them in the rest of the paper, except in the discussion of their orbital properties.
In the leftmost panels of Fig. 3 we highlight in red the circular velocity and density profile of one particular Fornax analogue. The density profile of this analogue is significantly shallower than those of the other analogues and is a relatively poor fit to the observed Fornax light profile. This analogue also has a smaller value of (the radius corresponding to ) than the other Fornax analogues. These features indicate that this subhalo has experienced a very significant amount of tidal stripping; we show in the next section that it has lost of its stellar mass at infall. As noted by Peñarrubia et al. (2008), even though stars deeply embedded within DM haloes are quite resilient to disruption, the loss of a significant fraction of their total mass nevertheless leads to an increase in the concentration of their light profiles. This seems to be the case for our analogue.
5.2 Mass evolution
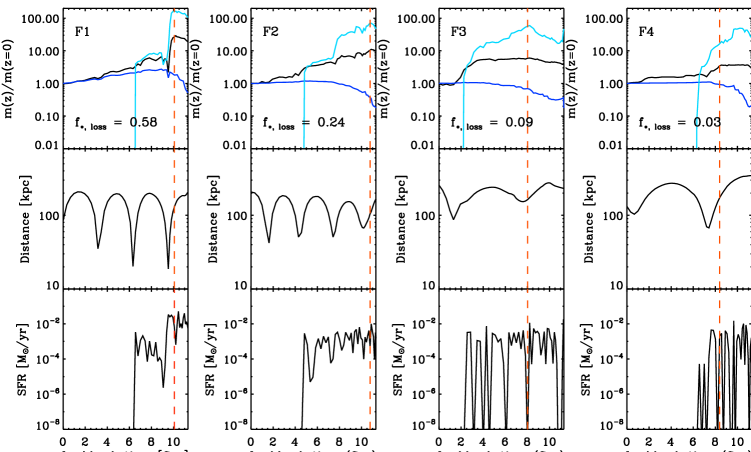
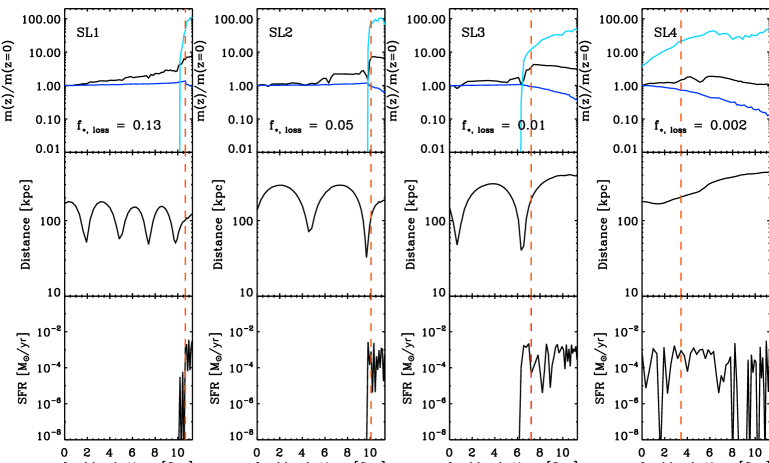
In the upper panels of Fig. 4 we show the evolution of total mass (black lines), stellar mass (dark blue lines) and gas mass (light blue lines) for four Fornax analogues, measured relative to their values at (The gas mass is normalized to the stellar mass at z = 0). These are computed by summing the masses of all particles gravitationally bound to the particular halo at each instant according to the SUBFIND algorithm222The assignment of particles to subhaloes in this algorithm is sensitive to the density contrast and velocity of the subhaloes relative to their host halo. Some material (in extreme cases the whole subhalo) may be considered unbound near pericentre but later considered bound again as the subhalo moves back towards apocentre. This gives rise to transient ‘dips’ in the bound mass near apocentres, which are visible in Fig. 4 and Fig. 5. This feature of the SUBFIND algorithm does not affect our discussion here. In most cases the extent of the subhalo according to the definition used by SUBFIND is a good approximation to the true subhalo tidal radius..
We find that the subhaloes of many Fornax analogues show large differences, typically an order of magnitude, between their mass at and the maximum total mass they reach over their lifetime. That peak mass occurs around the time of infall, which for these objects occurs at a lookback time of – Gyr. Those analogues also show stellar mass loss fraction . The lower panels of Fig. 4 show the evolution of the star formation rate (SFR). These systems fluctuate around a low average SFR at high redshift. In most cases their SFR is not notably affected by infall or even the first pericentric passage, such that the peak stellar mass is reached after infall. Instead, star formation ends suddenly after 2–3 pericentres (3–6 Gyr) in response to an extremely rapid and near-total loss of gas from the system at that time (seen in the cyan lines in the upper panels). This behaviour is common to the majority of the Fornax analogues.
The evolution of Fornax analogues after infall contrasts strongly with that of Sculptor and Leo I analogues, four examples of which are shown in Fig. 5. These systems have less dramatic differences between peak mass and current mass and their infall times are typically more recent (– Gyr ago), consistent with previous studies of the likely infall times of different MW dSphs (Rocha et al., 2013). Their gas content and SFR fall to zero more quickly after infall, around the first apocentre unless their orbit stays far from the galactic centre the whole time (e.g. SL4).
The differences seen in the post-infall evolution of gas mass and the effects on the star formation histories of different analogues are interesting, and reminiscent of well-established differences in the stellar populations of observed dSphs (notably the presence of intermediate-age stars in Fornax). The catastrophic removal of gas is likely to be the result of ram-pressure stripping (Gunn & Gott, 1972).
Comparing different panels in Fig. 4 we also find that the level of tidal stripping is correlated with orbital properties, such as pericentre distance, number of pericentre passages, and infall time.
5.3 Orbital Motions
We now compare the orbital motions of our analogue subhaloes with the observed motions of real dSphs, and thus determine whether the tidal forces on the simulated galaxies are representative of those experienced by real dSphs.
Fornax, Sculptor, and Leo I all have measured proper motions from which their orbits can be reconstructed. These orbits are, however, subject to assumptions about the shape and amplitude of the Galactic potential. For instance, using measured radial velocities and proper motions of stars in Fornax, Piatek et al. (2007) estimate its perigalacticon, , and apogalacticon, , adopting a Galactic potential model from Johnston et al. (1995). They find confidence intervals of kpc and kpc. The implied eccentricity of the orbit, , is then .
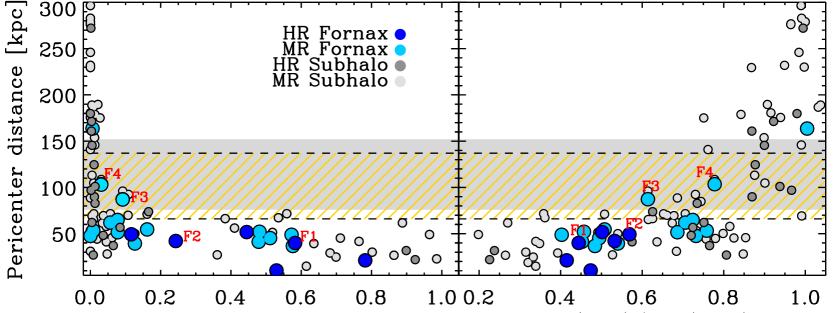
In Fig. 6 we show the pericentre distance as a function of stellar mass loss fraction (left panel) and (right panel) for subhaloes with stellar mass , which is the luminosity range of our Fornax analogues. The yellow shaded areas mark the 95 confidence interval range of orbital perigalacticon from Piatek et al. (2007) (with their assumed MW potential) and the grey shaded areas are the 95 confidence intervals for perigalacticon derived using the same orbital velocity measurements in combination with the potentials taken directly from the APOSTLE simulations.
To account for the response of the Fornax motion in the APOSTLE Milky Way potentials, we derive the range of latest orbital pericentre distance using the equations that describe motion of a bound star in a spherical potential (Binney & Tremaine, 2008) with the observed Fornax radial motion and proper motion from Piatek et al. (2007). We assume that the potential is static. The pericentre and apocentre distance is then obtained by solving for in the following equation:
| (2) |
where is the specific energy of the orbit, is the specific angular momentum, and is the potential. We have verified that this procedure, assuming the spherically averaged simulated potential at , recovers accurately the last orbital pericentre and apocentre distances of the actual orbits of the subhaloes in the same simulations. We compute the 95 confidence interval on the pericentre distance by Monte-Carlo sampling from the error distributions of Fornax distance, radial velocity and proper motion, assuming these distributions to be Gaussian.
We find that the derived orbital pericentre and apocentre ranges vary with the assumption of the underlying Galactic potential. We have considered the six HR Galactic potentials from APOSTLE and the Galactic potential model from Johnston et al. (1995). We list the results of these calculations in Table 1.
We find that a population of Fornax analogues has a pericentre distance smaller than the lower bound on that of Fornax itself, more so for the analogues experiencing the greatest stellar tidal stripping. For the analogues that do lie within the shaded regions in Fig. 6 (both from the MR simulations), the highest stellar mass loss fraction is , which corresponds to of tidally stripped stars. By interpolating along the approximate locus of the analogues in Fig. 6 we can infer that the observed bounds on the likely pericentre of Fornax are consistent with stellar mass loss fractions of up to .
We note that even though a majority of the Fornax analogues are heavily tidally stripped, most of them have orbits that are not consistent with the orbital properties (e.g. pericentre distance) inferred from the measurements of the motion of Fornax. Precisely matching the real orbital properties if Fornax is difficult, due to the small sample size in our simulations. As a result, only two subhaloes satisfy all constraints when the orbital data is included. In addition to the implications for the formation of Fornax, this may have interesting implications for the Milky Way potential. For example, in Table 1 we show that a more massive Galactic potential predicts smaller pericentre distances. If the Milky Way halo mass is less than , the 95 confidence lower bound on the pericentre is kpc (see Table 1). This is also inconsistent with any of our Fornax analogues.
In the case of Sculptor, a similar orbital study was carried out by Piatek et al. (2006). They obtain confidence intervals on perigalacticon and apogalacticon of kpc and kpc, implying with the Galactic potential model from Johnston et al. (1995). In the case of Leo I, a study of HST proper motion measurements was carried out by Sohn et al. (2013). Using three different mass models for the Galactic potential with total virial masses of , and respectively, they infer a perigalacticon occurring Gyr ago at a galactocentric distance of kpc. On this basis they estimate that Leo I entered the Milky Way virial radius Gyr ago and is most likely on its first infall. Most of our Sculptor/Leo I analogues lie within those perigalacticon and apogalacticon ranges, although the some of them have higher orbital eccentricities.
6 Tidal Debris
In this section we study the surface brightness of the outer regions of the analogues, including their tidal debris, in order to assess the detectability of tidal features. We also investigate the possibility that tidally stripped star may contaminate kinematic observations of real dSphs.
6.1 Do dSphs have stellar tidal tails?
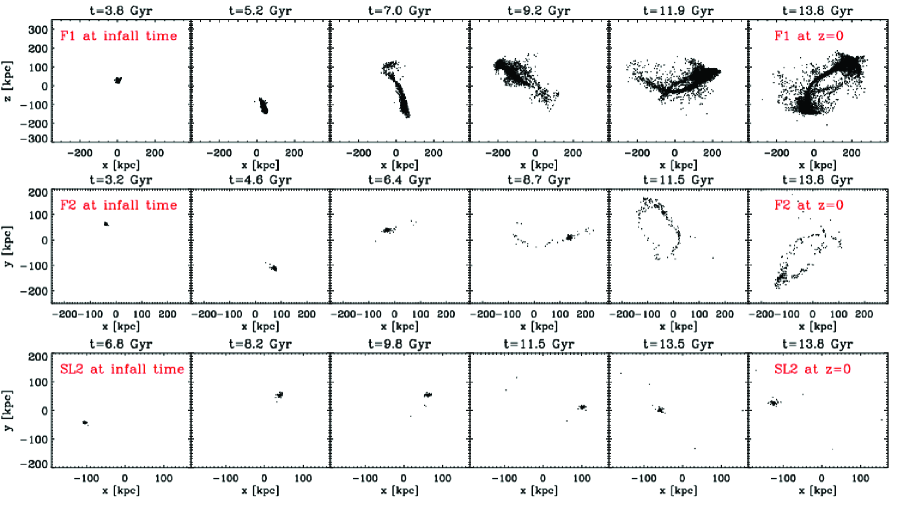
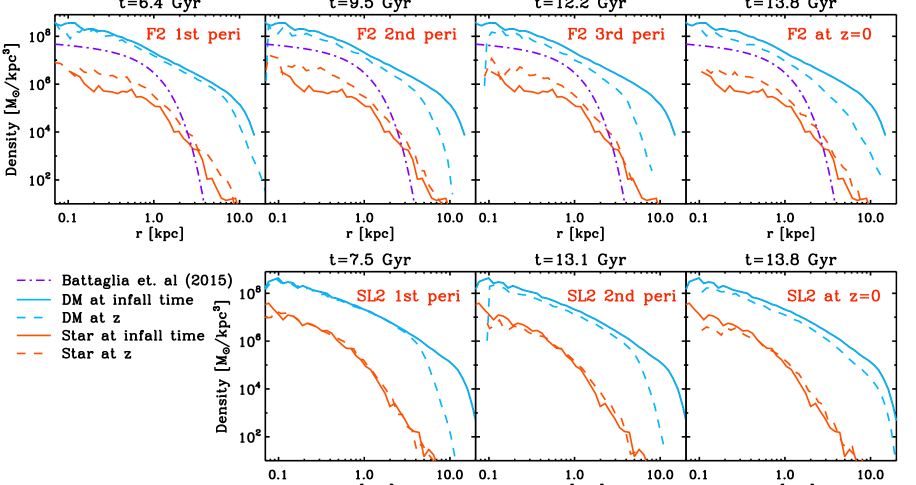
In Fig. 7 we show the time evolution of the stellar mass surface density distribution for three HR dSph analogues: F1, F2, and SL2. In the leftmost panels, which correspond to these galaxies at their times of infall, the star particles are deeply embedded within their host haloes, as expected. As time evolves (from left to the right), we see that tidal stripping of stars from F1 and F2 leads to the development of leading and trailing streams that approximately trace their obits. Our results in §5.3 imply that Fornax may have lost up to of its infall stellar mass (equivalent to a stellar mass ). Among the HR analogues333The resolution of the MR analogues is too low to study faint tidal features. F2 is closest to having this amount of mass loss. It is therefore likely to be a much better predictor of tidal features that may be observed around Fornax than F1, which has lost of its stars. F2 has , which is about in stellar mass, but this is nevertheless sufficient to generate extended coherent tidal features. In contrast, SL2 does not have clear tidal tails, with only a handful of unbound star particles (). Indeed, as is shown in Fig. 1, most of the Sculptor and Leo I analogues in exhibit very little stellar mass loss, usually less than . The qualitative features of SL2 shown in Fig. 7 are representative of such analogues.
| Galactic Potential | ( kpc) | conf. | ( kpc) | conf. | |
|---|---|---|---|---|---|
| [] | [kpc] | [kpc] | [kpc] | [kpc] | |
| AP-1 G1 | 1.66 | 128 | (76, 149) | 140.0 | (93, 165) |
| AP-1 G2 | 1.10 | 135 | (113, 152) | 144.0 | (121, 167) |
| AP-4 G1 | 1.38 | 133 | (97, 151) | 144.0 | (113, 167) |
| AP-4 G2 | 1.35 | 134 | (102, 151) | 144.0 | (116, 167) |
| AP-11 G1 | 0.99 | 135 | (111, 152) | 145.0 | (121, 167) |
| AP-11 G2 | 0.80 | 136 | (114, 152) | 145.0 | (123, 167) |
| Johnston et al.(1995) | – | 125 | (74, 148) | 138.0 | (90, 164) |
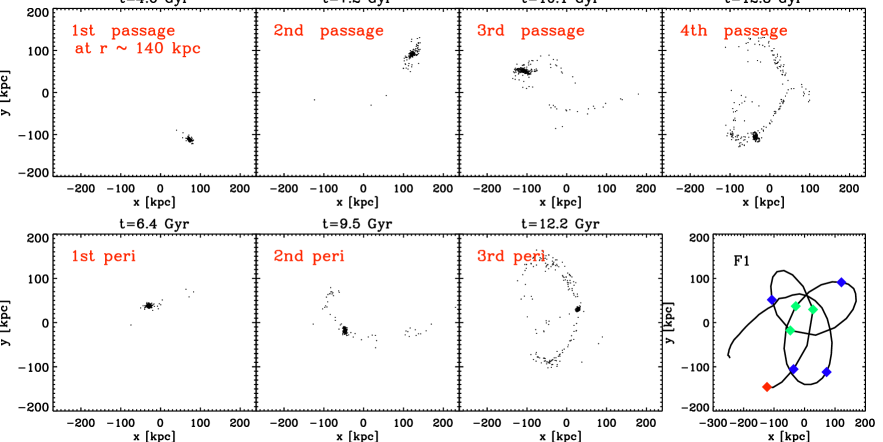
The upper panels of Fig. 8 illustrate the star particle distribution of F2 at different phases along its orbit: in the upper panel, at the observed distance of Fornax ( kpc), and in the lower panels at each perigalacticon. F2 has three perigalactic passages after its infall Gyr ago. Even after the first perigalacticon, the galaxy exhibits clear signs of tidal stripping.
Perhaps the most obvious reason that the majority of Fornax analogues show tidal features resulting from stellar stripping, whereas most of the Sculptor/Leo I analogues do not, is simply because the Fornax analogues must have lost more mass overall in order to be identified as such. Fig. 2 demonstrates that stellar stripping correlates with total mass loss. Similar finding is illustrated in Fig. 8 in Sawala et al. (2016), where Fornax is shown to have very high stellar-to-total mass ratio and will likely be explained by tidal stripping. Another factor is the extent of the stellar distribution at the time of infall. In Fig. 9 we show the dark matter and stellar density profiles of F2 and SL2 at their perigalacticons and at . At infall, their host subhaloes have similar halo masses, . At the second perigalactic passages ( Gyr for F2, Gyr for SL2) their dark matter distributions (for the mass that SUBFIND considers bound) are both truncated at kpc. Fig. 7 and Fig. 8 clearly show that, while F2 already exhibits extended stream-like features at this second perigalacticon, SL2 has not lost significant stellar mass. This difference arises because, at infall, the stellar distribution in F2 extends up to kpc, whereas stars in SL2 are relatively more deeply embedded, extending only to kpc. As the subhaloes lose weakly-bound dark matter to tides after infall, the subhalo tidal radius of F2 becomes comparable to the extent of its stellar distribution. The greater compactness of stars in SL2 at infall explains its apparently greater resilience to stellar stripping, despite the overall similarity in the halo mass and total mass evolution of the two galaxies.
6.2 Surface densities of stellar tidal features
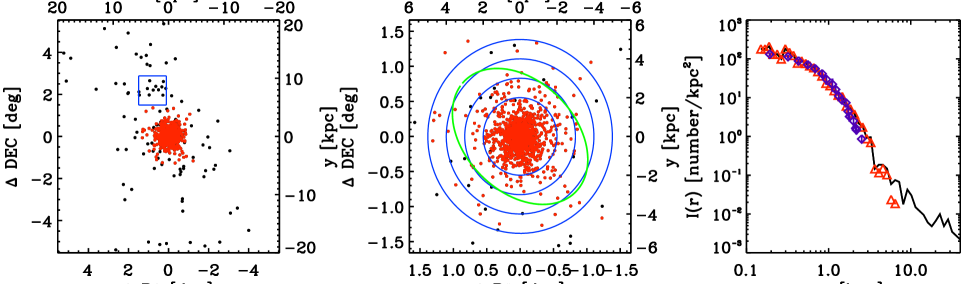
We now provide estimates of the (typically very low) surface brightness of the tidal features seen in the simulations and compare these to known tidal features. We again focus on Fornax analogue F2 at , with a galactocentric distance of 207 kpc, to provide an upper bound on the surface brightness estimate.
We obtain a simple measure of surface brightness by drawing a few regions of interest around the simulated dwarf galaxies and along their stellar tidal tails. We use all the star particles lying within these regions, assuming a stellar mass-to-light ratio , to calculate an average apparent surface brightness. For the purpose of this exercise we choose a fiducial projection along radial direction between the subhalo and galactic halo centre.
In Fig. 10 we show the spatial distributions of gravitationally bound star particles in F2 (red points) and star particles that were previously bound to F2 but have been unbound by tides (black points) at . In the left panel we show all the star particles lying within a kpc box projected along the axis of the simulation coordinate system. We can clearly see the tidally stripped stars extending along the direction. Within a kpc box about 2 degrees away from the galaxy, the surface brightness of an overdense region is . The enclosed stellar mass within this region is . For comparison, the surface brightness of the Virgo Overdensity discovered by SDSS is (Jurić et al., 2008), and the surface brightness of the Sagittarius dwarf Northern stream is (Martínez-Delgado et al., 2004). The stellar overdensity in Eridanus-Phoenix recently discovered by DES has (Li et al., 2016). These magnitudes are comparable to the surface brightness of the tidal feature from F2, therefore similar features could be detected in ongoing or existing imaging surveys.
We also examine the stellar structure at the edge of the F2 galaxy. As shown in the middle panel of Fig. 10, we draw 4 annuli centred on the galaxy with radius of 2–5 kpc ( – ) and 1 kpc spacing. Using naive visual inspection, there is no obvious stellar tidal structure or elongation of the body of the galaxy within 5 kpc, although this may simply be because the resolution of the simulation is not sufficient to capture any faint structures. The average surface brightness of the annulii are (2-3 kpc), 32.8 mag (3-4 kpc), and (4-5 kpc). The surface brightness rapidly drops below the reach of current surveys beyond – kpc (– for kpc, or – for kpc). This is consistent with the stellar ‘tidal radius’ of a King-model fit to the light profile of Fornax, (Battaglia et al., 2006), beyond which the stellar distribution is indistinguishable from the background.
We have also demonstrated in the right panel of Fig. 10 that the shape of F2’s light profile agrees well with observations of Fornax itself (blue diamond points; Coleman et al., 2005). Although there are stars gravitationally bound to F2 at – kpc, their density would be indistinguishable from the background, at least with current imaging surveys. We show the surface number density of bound (red) and unbound (black) star particles in the right panel of Fig. 10. The projected stellar density profile in the inner region of F2 is well-resolved and its shape agrees well with that of Fornax overall (we have rescaled the amplitude of the simulated profile to match approximately that of the observed data, which is based on counts of giant stars). There is a steeper drop at kpc in the observed profile. The bound star particles in F2 extend up to kpc and continue as a diffuse tidally stripped stellar tail.
We note that stellar tidal features are usually identified in surveys by ‘matched filtering’, using colour and magnitude cuts based on theoretical or empirical model isochrones to isolate, for example, main-sequence turn-off (MSTO) or red giant branch (RGB) stars from the background (Rockosi et al., 2002; Belokurov et al., 2006). Here we do not implement such a procedure, assuming instead that all stars in the tidal features are detectable. Our numbers therefore serve as upper limits on surface brightness. Due to the limited particle resolution, we can only report average surface brightness estimations over large areas, because the fine structures of tidal features are not resolved in our simulations. In reality, if there are any overdense structures around MW dSphs, they could contain smaller-scale fluctuations brighter than our estimates. We nevertheless find that there are several features along our simulated dSph tidal streams that have surface densities comparable to known stellar overdensities. The presence of such structures around galaxies such as Fornax can, therefore, be constrained in the near future by wide-field imagining observations.
6.3 Stellar kinematic contaminations from tidal debris
In systems with very high mass-to-light ratios, such as the MW dSphs, stellar kinematics provide a direct probe of the distribution of dark matter on very small scales. Such measurements are now one of the principle tests of the validity of the CDM model. However, the samples of stars used to study the kinematics of MW dSphs can be contaminated by tidally stripped stars that are not in equilibrium with the system. This contamination will affect the precision of dynamical mass estimates based on stellar velocities (Klimentowski et al., 2007). Here we demonstrate that gravitationally unbound stars are indeed likely to be confused with bound member stars in conventional stellar kinematic observations. We also demonstrate that, depending on the projected orientation of tidal tails with respect to the line-of-sight, these unbound stars will bias stellar velocity dispersion measurements.
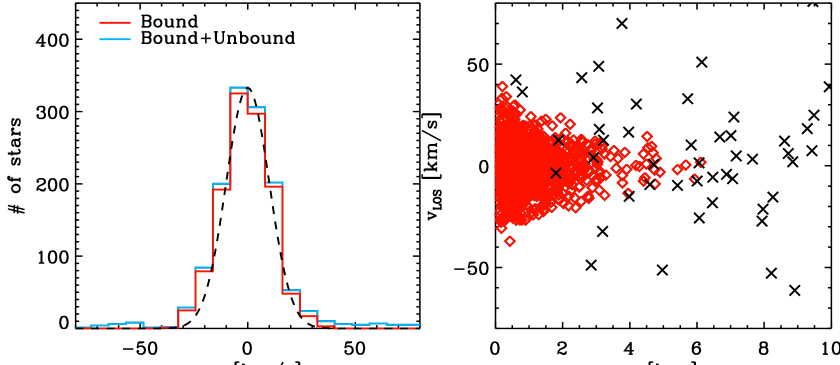
In the left panels of Fig. 11 we show the line-of-sight velocity distribution of stars (red: bound only, blue: both bound and unbound) in the F2 subhalo, projected along the radial direction (i.e. along the vector from the centre of the galactic halo to the centre of F2) with velocity measured relative to the peculiar velocity of F2. The line-of sight velocity distributions are close to Gaussian, centred at zero relative velocity with average dispersion (black dashed curves). In the right panel we plot the velocity distribution as a function of radius for both the bound (red diamonds) and stripped stars (black crosses). Some of the stripped stars have velocities much larger than those of bound stars at the same radius. However, a good fraction of these lie within the range of the velocity distribution of bound stars, between and .
Fig. 11 indicates that a simple, non-iterative, cut-off in velocity, as commonly applied to kinematic samples (e.g. Walker et al., 2006), may be subject to kinematic contamination from tidally stripped stars. There are other methods that can be combined to determine membership probabilities for stars which utilize information such as the spatial distribution, the colour-magnitude diagram (CMD), the metallicity of stars, and the full velocity distribution (e.g. Simon & Geha, 2007; Walker et al., 2009). However, since stripped stars were associated with the target galaxies in the past, their metallicities and CMDs are likely to be similar to those of the stars that remain bound. The spatial distribution may be more informative, because stars closer to the centres of galaxies are more likely to be bound, although this method can only provide relative probabilities. Stripped stars in the foreground or background may still contaminate the velocity sample at small projected radii (see right panel of Fig. 11).
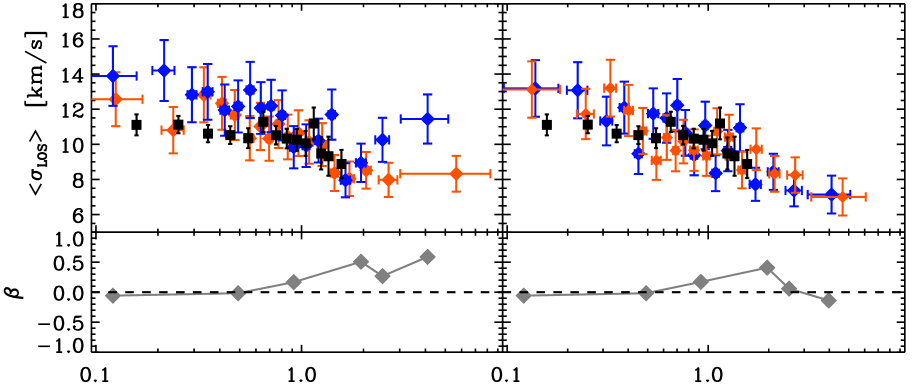
In Fig. 12 we show that the unbound stars have characteristic velocity signatures. They can inflate the stellar velocity dispersion and change the stellar velocity anisotropy, to an extent that depends on the orientation of the tidal stream and the peculiar velocity of the galaxy along the line-of-sight direction. Similar results have been obtained by several previous studies (e.g. Read et al., 2006; Klimentowski et al., 2007). For instance, Klimentowski et al. (2007) studied -body simulations of a dwarf galaxy on a highly eccentric orbit. They found that when the dwarf is observed along its tidal tails, kinematic samples are most strongly contaminated by unbound stars from the tails (e.g. Figs. 5 and 6 in their paper). In the upper panels of Fig. 12, we plot the velocity dispersion for F2 along the line-of-sight (blue points) and in a direction perpendicular to the line-of-sight (orange points). We only include stars with LOS velocities relative to the peculiar velocity of F2, as these would be identified as possible member stars using the width of the velocity distribution alone. We find the velocity dispersion is inflated by unbound stars at kpc by a factor of (depending on the LOS projection) relative to the velocity dispersion of bound stars at kpc.
In the lower panels of Fig. 12 we show the velocity dispersion anisotropy , which denotes the ratio between the tangential and radial components of the velocity dispersion. At a given radius,
| (3) |
where is the tangential component of the velocity dispersion, and is the radial component. In F2, the velocity anisotropy for the bound stars (lower right panel) is consistent with zero at most of the radii, with a variation between and . This indicates that isotropic orbits are good approximations for bound stars in the F2 galaxy. However, at kpc, where unbound stars start to dominate, the velocity anisotropy can deviate significantly from zero. For example, the curve in lower left panel shows a increase in anisotropy. This result can be explained by the large radial motions of stripped stars along the stellar stream.
6.4 Comparison to previous work on Fornax tidal evolution
Battaglia et al. (2015) construct a set of N-body simulations to study the effect of tides on Fornax. However, contrary to our results, they do not find any evidence for stellar tidal features. To understand this discrepancy, we compare the initial conditions of their simulations with our Fornax analogues. They adopted two orbital setups: one with perigalactic radius kpc and apogalactic radius kpc, yielding an orbital eccentricity , and another with and kpc. Since the orbit of our subhalo F2 is quite similar to their second orbital configuration (first kpc and kpc after infall), we can conclude that the difference is not entirely due to the orbits.
The initial DM mass adopted in Battaglia et al. (2015) was , which is similar to the infall mass of F2, . The infall stellar mass in our simulation is lower than their initial stellar mass ( versus our value of 3). In addition, in order to increase the possibility of generating stellar tidal disruption, Battaglia et al. (2015) assumed a cored DM density profile.
Therefore purely on the basis of its subhalo mass and DM density profile, our Fornax DM subhalo should be more resilient to tidal forces than their subhalo. However, when we compare the stellar density profiles, which are shown in Fig. 9, we see that their stellar distribution is much more concentrated than ours. In the upper panels of Fig. 9, the purple dash-dotted lines show the stellar density profile of Battaglia et al. (2015). It declines very rapidly around Fornax’s nominal King stellar ‘tidal radius’ of kpc. In contrast, our profiles have an extended distribution up to kpc (at ). However, as shown in § 6.2, the surface brightness of F2 drops quickly at kpc, at which point it falls below the limiting background density of current observations. It is therefore quite likely that, in reality, the Fornax stellar distribution extends far beyond the apparent ‘tidal radius’. This may explain why our conclusions regarding tidal features around Fornax differ from those of Battaglia et al. (2015).
7 Conclusion and Discussion
We have used the high-resolution APOSTLE hydrodynamical simulations to investigate, for the first time, the stellar tidal stripping of classical MW dSphs in the range of in a cosmological context. This cosmological context is important because the factors that determine the severity of tidal effects, including the assembly history and structure of the potential well of the host galaxy, the mass and structure of the satellite galaxies, and their infall times, stellar content and orbits, are all self-consistently taken into account. In these simulations, we find many examples of stellar stripping of satellites due to tidal interactions with their host; 30 of satellites lose more than 20 of their stellar mass between their time of infall and the present day. This fraction is remarkably high given that only a handful of MW dSphs display clear signs of tidal tails or strong structural distortions that could be attributed to tidal stirring. However, given the difficulty of detecting diffuse low-surface brightness tidal features, the apparent contradictions can be explained by a lack of sufficiently deep wide-area photometric data. Ongoing and future deep imaging surveys, such as DES and LSST, will be able to verify this in the near future.
We have identified Fornax analogues that best match the observed orbital properties of Fornax. We note that many of our Fornax analogue subhaloes are severely tidally stripped, but they tend to have lower orbital pericentre distance than the predictions derived from measurements of the velocity of Fornax. This puzzling tension may indicate that Fornax’s orbit is in some way unusual, or provide constraints on the Galactic potential. We leave this work to a future study with more detailed modeling of the Galactic potential and orbital simulations of Fornax.
Nevertheless, those Fornax analogues that match the orbital properties have typically lost of their infall stellar mass and exhibit faint stellar tidal streams along their orbit. This tidal debris is generally low in surface brightness, but with overdense regions that are comparable to currently known stellar overdensities and streams in the MW. We also show that these Fornax analogues may have diffuse but nevertheless bound stellar components extending beyond the conventional Fornax stellar ‘tidal radius’. These extended envelopes are difficult to distinguish from background stars.
Our results are interesting in the context of recent observational and theoretical studies of Fornax. For example Bate et al. (2015) have used VST ATLAS survey data to show that a population of Fornax RGB stars extends all the way out to the Fornax stellar ‘tidal radius’ defined by Battaglia et al. (2006). This observation is in line with the predictions of our simulation, and differs from the conclusions of Battaglia et al. (2015) that stars Fornax do not extended beyond that radius, and that Fornax has undergone no significant stellar tidal stripping. The lack of significant stellar tidal features in our Sculptor and Leo I analogues can, however, be explained by their compact stellar distribution, even though their dark matter tidal radius (different than the stellar one) may be similar to that of the Fornax analogues after a few pericentric passages.
Having identified Fornax, Sculptor and Leo I analogues in the simulations on the basis of their observed stellar kinematics and luminosities, we find that they exhibit different mass assembly histories and star formation histories. Fornax analogues in particular suffer significant mass loss, with early infall - Gyr ago. They exhibit continuous star formation activity after infall, although this activity has generally ceased by the present day. On the other hand, the mass loss of Sculptor and Leo I analogues is much less severe. These analogues tend to have more recent infall times than Fornax, with star formation suppressed very rapidly after infall.
As noted by Wang et al. (2016), the correlation between infall time and star formation timescale could also be useful in testing the nature of DM, because different DM models predict different infall times. As an example, in the case of Fornax, CDM models always predict infall at lookback times of - Gyr ago, whereas alternatives, such as warm DM (WDM) or decaying DM (DDM) models, predict infall times as recent as - Gyr ago. It is interesting to note that Fornax does show signs of recent star formation activity (Weisz et al., 2015), Gyr ago. This short timescale for shutting down star formation may be in tension with infall Gyr ago. Thus it is important to understand how the star formation timescales of dSphs can be used to constrain their likely orbital history, which in turn may enable stronger tests of the nature of DM.
Finally, we have discussed the potential for kinematic contamination by tidally stripped stars in the context of dSph stellar velocity dispersion measurements. We have shown that unbound stars can inflate the stellar velocity dispersion and change the average stellar velocity anisotropy in the outskirt of dSphs. We find that a conventional cut on heliocentric velocities cannot exclude all the unbound particles, nor can metallicity cuts or selections based on CMD filtering, since the contaminating stars were once gravitationally-bound member stars. On the other hand, these kinematic features can also serve as a signature to detect tidal debris.
Acknowledgments
We would like to thank Nitya Kallivayalil, Manoj Kaplinghat, Mike Boylan-Kolchin, Robyn Sanderson, Josh Simon, and Ting Li for useful discussions. MYW and LES acknowledge support from NSF grant PHY-1522717. APC is supported by a COFUND/Durham Junior Research Fellowship under EU grant 267209 and by STFC (ST/L00075X/1). T. S. acknowledges the support of the Academy of Finland grant 1274931. JFN was supported by a Visiting Professorship Grant from the Leverhulme Trust VP1-2014-021. This work used the DiRAC Data Centric system at Durham University, operated by the Institute for Computational Cosmology on behalf of the STFC DiRAC HPC Facility (www.dirac.ac.uk). This equipment was funded by BIS National E-infrastructure capital grant ST/K00042X/1, STFC capital grants ST/H008519/1 and ST/K00087X/1, STFC DiRAC Operations grant ST/K003267/1 and Durham University. DiRAC is part of the National E-Infrastructure.
References
- Barber et al. (2015) Barber C., Starkenburg E., Navarro J. F., McConnachie A. W., 2015, Mon. Not. R. Astron. Soc., 447, 1112
- Bate et al. (2015) Bate N. F., McMonigal B., Lewis G. F., Irwin M. J., Gonzalez-Solares E., Shanks T., Metcalfe N., 2015, ArXiv e-prints
- Battaglia et al. (2008) Battaglia G., Helmi A., Tolstoy E., Irwin M., Hill V., Jablonka P., 2008, Astrophys. J. Lett., 681, L13
- Battaglia et al. (2012) Battaglia G., Irwin M., Tolstoy E., de Boer T., Mateo M., 2012, Astrophys. J. Lett., 761, L31
- Battaglia et al. (2015) Battaglia G., Sollima A., Nipoti C., 2015, Mon. Not. R. Astron. Soc., 454, 2401
- Battaglia et al. (2006) Battaglia G., Tolstoy E., Helmi A., Irwin M. J., Letarte B., Jablonka P., Hill V., Venn K. A., Shetrone M. D., Arimoto N., Primas F., Kaufer A., Francois P., Szeifert T., Abel T., Sadakane K., 2006, Astron. Astrophys., 459, 423
- Belokurov et al. (2006) Belokurov V., Zucker D. B., Evans N. W., Gilmore G. e. a., 2006, Astrophys. J. Lett., 642, L137
- Binney & Tremaine (2008) Binney J., Tremaine S., 2008, Galactic Dynamics: Second Edition, by James Binney and Scott Tremaine. ISBN 978-0-691-13026-2 (HB). Published by Princeton University Press, Princeton, NJ USA
- Boylan-Kolchin et al. (2011) Boylan-Kolchin M., Bullock J. S., Kaplinghat M., 2011, Mon. Not. R. Astron. Soc., 415, L40
- Boylan-Kolchin et al. (2012) Boylan-Kolchin M., Bullock J. S., Kaplinghat M., 2012, Mon. Not. R. Astron. Soc., 422, 1203
- Choi et al. (2002) Choi P. I., Guhathakurta P., Johnston K. V., 2002, Astron. J., 124, 310
- Coleman et al. (2005) Coleman M. G., Da Costa G. S., Bland-Hawthorn J., Freeman K. C., 2005, Astron. J., 129, 1443
- Coleman & de Jong (2008) Coleman M. G., de Jong J. T. A., 2008, ApJ, 685, 933
- Cooper et al. (2010) Cooper A., Cole S., Frenk C., White S., Helly J., et al., 2010, Mon.Not.Roy.Astron.Soc., 406, 744
- Crain et al. (2015) Crain R. A., Schaye J., Bower R. G., Furlong M., Schaller M., Theuns T., Dalla Vecchia C., Frenk C. S., McCarthy I. G., Helly J. C., Jenkins A., Rosas-Guevara Y. M., White S. D. M., Trayford J. W., 2015, Mon. Not. R. Astron. Soc., 450, 1937
- Crnojević et al. (2014) Crnojević D., Ferguson A. M. N., Irwin M. J., McConnachie A. W., Bernard E. J., Fardal M. A., Ibata R. A., Lewis G. F., Martin N. F., Navarro J. F., Noël N. E. D., Pasetto S., 2014, Mon. Not. R. Astron. Soc., 445, 3862
- de Boer et al. (2012) de Boer T. J. L., Tolstoy E., Hill V., Saha A., Olszewski E. W., Mateo M., Starkenburg E., Battaglia G., Walker M. G., 2012, Astron. Astrophys., 544, A73
- Dooley et al. (2016) Dooley G. A., Peter A. H. G., Vogelsberger M., Zavala J., Frebel A., 2016, ArXiv e-prints
- Errani et al. (2015) Errani R., Peñarrubia J., Tormen G., 2015, Mon. Not. R. Astron. Soc., 449, L46
- Fattahi et al. (2016) Fattahi A., Navarro J. F., Sawala T., Frenk C. S., Oman K. A., Crain R. A., Furlong M., Schaller M., Schaye J., Theuns T., Jenkins A., 2016, Mon. Not. R. Astron. Soc., 457, 844
- Fattahi et al. (2016b) Fattahi A., Navarro J. F., Sawala T., Frenk C. S., Sales L. V., Oman K., Schaller M., Wang J., 2016b, ArXiv e-prints
- Gunn & Gott (1972) Gunn J. E., Gott III J. R., 1972, ApJ, 176, 1
- Guo et al. (2015) Guo Q., Cooper A. P., Frenk C., Helly J., Hellwing W. A., 2015, Mon. Not. R. Astron. Soc., 454, 550
- Ibata et al. (1994) Ibata R. A., Gilmore G., Irwin M. J., 1994, Nature, 370, 194
- Johnston et al. (1995) Johnston K. V., Spergel D. N., Hernquist L., 1995, ApJ, 451, 598
- Jurić et al. (2008) Jurić M., Ivezić Ž., Brooks A. e. a., 2008, ApJ, 673, 864
- Klimentowski et al. (2007) Klimentowski J., Łokas E. L., Kazantzidis S., Prada F., Mayer L., Mamon G. A., 2007, Mon. Not. R. Astron. Soc., 378, 353
- Komatsu et al. (2011) Komatsu E., Smith K. M., Dunkley J., Bennett C. L. e. a., 2011, Astrophys. J. Suppl. Ser., 192, 18
- Li et al. (2016) Li T. S., Balbinot E., Mondrik N., Marshall J. L., et al. D., 2016, ApJ, 817, 135
- Li et al. (2010) Li Y.-S., De Lucia G., Helmi A., 2010, Mon. Not. R. Astron. Soc., 401, 2036
- Lovell et al. (2014) Lovell M. R., Frenk C. S., Eke V. R., Jenkins A., Gao L., Theuns T., 2014, Mon. Not. R. Astron. Soc., 439, 300
- Martínez-Delgado et al. (2004) Martínez-Delgado D., Gómez-Flechoso M. Á., Aparicio A., Carrera R., 2004, ApJ, 601, 242
- Mateo et al. (2008) Mateo M., Olszewski E. W., Walker M. G., 2008, ApJ, 675, 201
- Mateo (1998) Mateo M. L., 1998, Ann. Rev. Astron. Astroph., 36, 435
- McConnachie (2012) McConnachie A. W., 2012, Astron. J., 144, 4
- McMonigal et al. (2014) McMonigal B., Bate N. F., Lewis G. F., Irwin M. J., Battaglia G., Ibata R. A., Martin N. F., McConnachie A. W., Guglielmo M., Conn A. R., 2014, Mon. Not. R. Astron. Soc., 444, 3139
- Muñoz et al. (2008) Muñoz R. R., Majewski S. R., Johnston K. V., 2008, ApJ, 679, 346
- Muñoz et al. (2006) Muñoz R. R., Majewski S. R., Zaggia S., Kunkel W. E., Frinchaboy P. M., Nidever D. L., Crnojevic D., Patterson R. J., Crane J. D., Johnston K. V., Sohn S. T., Bernstein R., Shectman S., 2006, ApJ, 649, 201
- Peñarrubia et al. (2008) Peñarrubia J., Navarro J. F., McConnachie A. W., 2008, ApJ, 673, 226
- Piatek et al. (2006) Piatek S., Pryor C., Bristow P., Olszewski E. W., Harris H. C., Mateo M., Minniti D., Tinney C. G., 2006, Astron. J., 131, 1445
- Piatek et al. (2007) Piatek S., Pryor C., Bristow P., Olszewski E. W., Harris H. C., Mateo M., Minniti D., Tinney C. G., 2007, Astron. J., 133, 818
- Power et al. (2003) Power C., Navarro J. F., Jenkins A., Frenk C. S., White S. D. M., Springel V., Stadel J., Quinn T., 2003, MNRAS, 338, 14
- Read et al. (2006) Read J. I., Wilkinson M. I., Evans N. W., Gilmore G., Kleyna J. T., 2006, Mon. Not. R. Astron. Soc., 367, 387
- Rocha et al. (2013) Rocha M., Peter A. H. G., Bullock J. S., Kaplinghat M., Garrison-Kimmel S., Oñorbe J., Moustakas L. A., 2013, Mon. Not. R. Astron. Soc., 430, 81
- Rockosi et al. (2002) Rockosi C. M., Odenkirchen M., Grebel E. K., Dehnen W., Cudworth K. M., Gunn J. E., York D. G., Brinkmann J., Hennessy G. S., Ivezić Ž., 2002, Astron. J., 124, 349
- Roderick et al. (2015) Roderick T. A., Jerjen H., Mackey A. D., Da Costa G. S., 2015, ApJ, 804, 134
- Sawala et al. (2016) Sawala T., Frenk C. S., Fattahi A., Navarro J. F., Bower R. G., Crain R. A., Dalla Vecchia C., Furlong M., Helly J. C., Jenkins A., Oman K. A., Schaller M., Schaye J., Theuns T., Trayford J., White S. D. M., 2016, Mon. Not. R. Astron. Soc., 457, 1931
- Schaye et al. (2015) Schaye J., Crain R. A., Bower R. G., et al. 2015, Mon. Not. R. Astron. Soc., 446, 521
- Simon & Geha (2007) Simon J. D., Geha M., 2007, ApJ, 670, 313
- Smolčić et al. (2007) Smolčić V., Zucker D. B., Bell E. F., Coleman M. G., Rix H. W., Schinnerer E., Ivezić Ž., Kniazev A., 2007, Astron. J., 134, 1901
- Sohn et al. (2013) Sohn S. T., Besla G., van der Marel R. P., Boylan-Kolchin M., Majewski S. R., Bullock J. S., 2013, ApJ, 768, 139
- Springel et al. (2001) Springel V., White S. D. M., Tormen G., Kauffmann G., 2001, Mon. Not. R. Astron. Soc., 328, 726
- Strigari et al. (2010) Strigari L. E., Frenk C. S., White S. D. M., 2010, Mon. Not. R. Astron. Soc., 408, 2364
- Tomozeiu et al. (2016) Tomozeiu M., Mayer L., Quinn T., 2016, ApJ, 818, 193
- Walker (2013) Walker M., 2013, Dark Matter in the Galactic Dwarf Spheroidal Satellites. p. 1039
- Walker et al. (2009) Walker M. G., Mateo M., Olszewski E. W., 2009, Astron. J., 137, 3100
- Walker et al. (2006) Walker M. G., Mateo M., Olszewski E. W., Bernstein R., Wang X., Woodroofe M., 2006, Astron. J., 131, 2114
- Walker et al. (2009) Walker M. G., Mateo M., Olszewski E. W., Sen B., Woodroofe M., 2009, Astron. J., 137, 3109
- Wang et al. (2014) Wang M.-Y., Peter A. H. G., Strigari L. E., Zentner A. R., Arant B., Garrison-Kimmel S., Rocha M., 2014, Mon. Not. R. Astron. Soc., 445, 614
- Wang et al. (2016) Wang M.-Y., Strigari L. E., Lovell M. R., Frenk C. S., Zentner A. R., 2016, Mon. Not. R. Astron. Soc., 457, 4248
- Weisz et al. (2015) Weisz D. R., Dolphin A. E., Skillman E. D., Holtzman J., Gilbert K. M., Dalcanton J. J., Williams B. F., 2015, ApJ, 804, 136
- Wolf et al. (2010) Wolf J., Martinez G. D., Bullock J. S., Kaplinghat M., Geha M., Muñoz R. R., Simon J. D., Avedo F. F., 2010, Mon. Not. R. Astron. Soc., 406, 1220