Optothermal nonlinearity of silica aerogel
Abstract
We report on the characterization of silica aerogel thermal optical nonlinearity, obtained by z-scan technique. The results show that typical silica aerogels have nonlinear optical coefficient similar to that of glass mW), with negligible optical nonlinear absorption. The nonlinear coefficient can be increased to values in the range of mW by embedding an absorbing dye in the aerogel. This value is one order of magnitude higher than that observed in the pure dye and in typical highly nonlinear materials like liquid crystals.
In the recent years, there has been growing interest in studying soft-colloidal matter and complex materials for their properties and possible applications in biophysics and photonic technologies.Likos01 ; Khoo95 ; Conti06 ; Lee09 ; DelRe11 ; Ghofraniha09 ; Ashkin82 In particular, their nonlinear optical properties are promising for fundamental physical studies, imaging and sensing. Despite these encouraging features, they present scattering losses and limits in the high energy regime due to the fact that thermal phenomena as diffusion and convection, which usually cause the destruction of the sample, are present.ContiDelRe10
In this framework, nanoporous Silica Aerogel (SA) has attracted great interestAreogelBook for its physical, chemical and mechanical characteristics. This solid-state material exhibits strong nonlinearities and low thermal conductivity with limited optical scattering losses. Its porous structure hampers convection by trapping the gas molecules within a large number of nano-cavities. This feature is called Knudsen effectKnudsenBook and makes Aerogel an excellent thermal conductive insulator, also allowing steep temperature gradient profiles. Because of these characteristics, SA is a good candidate for very high optical power applications.
Recently, physicists reported on SA nonlinear optical response.Seo2003 ; Seo2006 Thanks to a z-scan measurements, performed by using impulsed lasers at nm and nm wavelength, they found a nonlinear refractive index of electronic nature respectively of mW and mW. These values have been questioned by other measurements which state that they are too high. Birks10 ; Birks10_02
Further studies have demonstrated shock waves excitation in SA due to the presence of a optothermal induced nonlinearity and resistance to highly focused laser beams.Gentilini:14 In these regards, quantifying the SA thermal nonlinearity and its temporal response is extremely relevant.
In the following, we report on an experimental investigation of thermal nonlinear index of refraction for SA samples. We first investigate the nonlinear response in time as a function of power, that demonstrates the thermal origin. Than, through z-scan technique, we measured the coefficient.
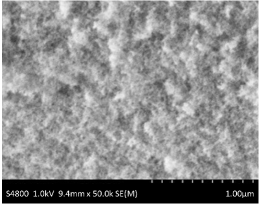
Silica Aerogel samples were synthesized by the coauthors by a base catalyzed polymerization process using tetramethylorthosilicate (TMOS) as the precursor Rao1998 . For a typical sample with a total volume of ml, tetramethyl orthosilicate (TMOS; l, mmol, eq.) was diluted with methanol (MeOH; l, mmol, eq.). After shaking the jar for seconds, an ammonium hydroxide solution (NH4OH (aq); l, mM solution, mmol, eq.) was added and the mixture was shaken for seconds before pouring it into a PMMA cuvette mould, with a square cross section of cm2. The mould was sealed to prevent drying of the sample by evaporation of the methanol during the gelation. The formed alcogel was then allowed to set for approximately to hours before submerging the PMMA cuvette in acetone for solvent extraction. The PMMA cuvette dissolves in the acetone and by refreshing the acetone several times over a days period, the alcogel was purified and chemical impurities were removed. The alcogel was then dried by transferring it into a custom made supercritical point dryer to replace the acetone inside the gel with liquid , which was subsequently evaporated slowly in its supercritical phase, obtaining pristine SA samples. Figure 1 shows a SEM image of the SA sample used. The matter density and the linear refractive index of the samples used are respectively gcm3 and : these parameters participate in determining the strength of scattering.
In order to verify the thermal origin of the nonlinearity of the sample, we measure the nonlinear time-dependent response.
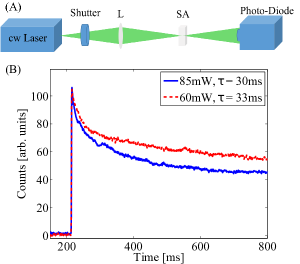
We used a continuous-wave (CW) laser beam at wavelength nm, controlled in time by a beam shutter.
The laser beam is focused in the SA sample with a focus size m and a central section of the transmitted signal is acquired through a photo-diode connected to an oscilloscope (Fig.2A).
Figure 2B reports the photon counts collected by the oscilloscope for two different laser powers mW and mW. We observe that the beam intensity has different time decays at the two different powers consistently with their nonlinear nature.
The decay rates, obtained fitting these curves, are ms and ms as reported in the inset of Fig.2B. The decay rates are of the order of few milliseconds, as expected by a nonlinearity of thermal origin. BoydBook Indeed, the decrease in transmitted intensity with time is due to the presence of a defocusing thermal nonlinearity, whose measurements are reported afterwords. When the thermal nonlinearity is excited, light is subject to a defocusing, i.e., the intensity decreases locally. This is coherent with measurements in Fig. 2B, which show intensity exponential decays exp in the region of light covered by the photo-diode.
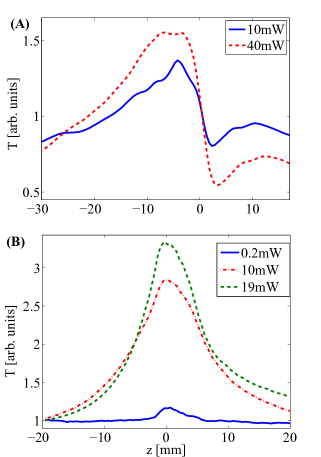
In order to quantify the thermal nonlinear index of refraction of the sample, we used the z-scan techniqueBahae90 ; Sheik-bahae:89 ; Bahae1991 . This consists in measuring the transmitted intensity through a finite aperture placed in the far field of a laser beam propagating through the sample, which is moved across a lens focal plane (see Fig.3A). If the sample is sufficiently thin, i.e. it is smaller than the diffraction length, it behaves like a lens with variable focal length. The transmitted intensity as a function of the z-position of the sample presents a peak and a valley (see Fig.3B). The transmission, , is calculated by normalizing the output power to its mean value. The peak-valley difference is proportional to the phase shift induced by the presence of the sample, and hence to its nonlinear index of refraction, as shown in the following expression:Bahae90
| (1) |
where is the wave vector and is the intensity at the focal point, is the linear transmittance of the far field aperture and is the effective thickness of the sample.
The occurrence of the peak before the valley and viceversa depends on the sign of the nonlinearity.
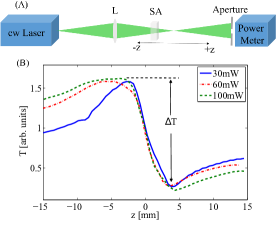
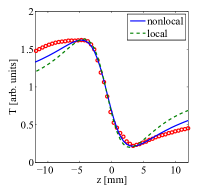
The experimental setup is illustrated in Fig.3A. As in the previous measurement, we used a CW laser beam at nm wavelength. The sample is placed on a translation stage, which changes its position around the lens focus. We record the power transmitted by the aperture by a power meter. Figure 3B shows the normalized transmission curves obtained for the SA sample at different laser powers mW, mW and mW. The deviation of curves in Fig. 3B from the expected lorentzian behavior is due to the presence of nonlocality.Ortega:14 ; Lara:07 ; Ramirez:10 ; DavilaPintle:13 Indeed, in a purely refractive medium nonlocality tends to deepen the valley and suppress the peak. Vaziri2013 Furthermore, nonlocality acts on the transmission function broadening its tails (see Fig.3B). Figure 4 shows both local and nonlocal fits of the normalized transmission curves at mW. The nonlocal fitting function used is
| (2) |
where is the nonlocal coefficient, the nonlinear phase change induced by the material during the z-scan, and is the ratio between the propagation distance and the Rayleigh length . The local case can be obtained putting in Eq. (2). Vaziri2013 ; Vaziri2013_02 As shown in Table 1, the value of the nonlinear refractive index does not change significantly due to the fitting model used.
| [mW] | fitting model | |
|---|---|---|
| Local | ||
| Nonlocal |
We measured the nonlinear absorption opening all the aperture in Fig. 3A, not finding any measurable value of the nonlinear absorption coefficient . This feature shows that SA is an optimal sample for thermal nonlinear studies since it does not exhibit significant nonlinear losses.
Repeating this measurement in different points of the sample we found that there is not a substantial dependence of the nonlinear refractive index value from the position in the sample. Hence we conclude that the sample is homogeneous, and the measurements are not affected by particular disorder configuration or scattering.
The retrieved values of the defocusing nonlinear refractive index are reported in Table 2. Uncertainties are calculated from the different measurements at different points of the sample. As shown in Table 2, the nonlinear refractive index is slightly dependent by the beam input power. This is due to the fact that the SA nonlinearity is not high, and hence the variation as a function of power is not evident. Despite this, we state that the sample has a defocusing nonlinearity.
| P [mW] | [mW] |
|---|---|
| 30 | |
| 60 | |
| 100 |
In order to increase the nonlinearity we added Rhodamine B (RhB) to the SA sample, before the gelation stage, using a solution tetramethyl rhodamine iso-thiocyanate in methanol (TRITC; in MeOH; , ). RhB is a dye and has a high nonlinear refraction index (m2/W for an aqueous solution of RhB at a concentration of mM)Ghofraniha07 . Figure 5A shows the normalized transmittance of this sample for different input beam powers mW and mW. We found an increase in the value with respect to the not-dyed SA sample: mW and mW respectively. The curve asymmetry is due to the presence of nonlinear absorptionDavilaPintle:13 (Fig.5A), while the nonlocality enhances the peak with respect to the valleyOrtega:14 . Figure 5B reports the measurement of the nonlinear absorption which is found to be mW, mW and mW at mW, mW and mW. The thermodiffusion of RhB provides a measurable value of : in the high intensity region, SA scaffold suffers a thermal expansion increasing the fraction of air volume in the lightened region. This phenomenon causes a reduction in the refractive index (defocusing effect) and in the amount of absorption (saturable absorption effect), and hence an increase in the transmission function. The broadening of the transmission function in Fig. 5B os related to nonlocality. We remark that and dependence on the power shows evidence of higher order nonlinear effects, which we ascribe to reversible structural deformations of the SA scaffold outlined before.
| Material | [mW] |
|---|---|
| Liquid CrystalsGOMEZ2003 | |
| RhB at mMGhofraniha07 | |
| Glassdancus2007z |
The values of obtained for SA are in agreement with thermal nonlinearities reported in literature as can be seen in Table 3. Adding RhB strongly enhances the nonlinear response.
In conclusion, we measured the nonlinear response of Silica Aerogel confirming its thermal origin and the fact that disorder does not hamper the nonlinear action: the strong nonlinearity of SA is comparable with the highest reported and can be enhanced by adding Rhodamine or other light absorbing dyes.
We also find evidence of higher order nonlinear effects witnessed by the dependence of the nonlinear refraction and absorption on the input power. Thanks to its impressive properties Silica Aerogel can be exploited in several application as high power lasers or optical limiters.
We acknowledge support from EPSRC (EP/J004200/1 and EP/M508214/1), the Templeton Foundation (grant number 58277) and the ERC project VANGUARD (grant number 664782). The research data supporting this publication can be accessed at http://dx.doi.org/10.17630/0c377d2f-efa5-4228-9b73-5b1f36a8365e.
References
- (1)
- (2) C. N. Likos, “Effective interactions in soft condensed matter physics,” Phys. Rep., vol. 348, p. 267–439, 2001.
- (3) I. C. Khoo, Liquid Crystals: Physical Properties and Nonlinear Optical Phenomena. New York: Wiley, 1995.
- (4) C. Conti, N. Ghofraniha, G. Ruocco, and S. Trillo, “Laser Beam Filamentation in Fractal Aggregates,” Phys. Rev. Lett., vol. 97, no. 12, p. 123903, 2006.
- (5) W. M. Lee, R. El-Ganainy, D. N. Christodoulides, K. Dholakia, and E. M. Wright, “Nonlinear optical response of colloidal suspensions,” Opt. Express, vol. 17, no. 12, p. 10277–10289, 2009.
- (6) E. DelRe, E. Spinozzi, R. Agranat, and C. Conti, “Scale Free Optics and Diffractionless waves in nano-disordered ferroelectrics,” Nat. Photonics, 2011.
- (7) N. Ghofraniha, C. Conti, G. Ruocco, and F. Zamponi, “Time-Dependent Nonlinear Optical Susceptibility of an Out-of-Equilibrium Soft Material,” Phys. Rev. Lett., vol. 102, no. 3, p. 038303, 2009.
- (8) A. Ashkin, J. M. Dziedzic, and P. W. Smith, “Continuous-wave self-focusing and self-trapping of light in artificial Kerr media,” Opt. Lett., vol. 7, p. 276, 1982.
- (9) C. Conti and E. DelRe, “Optical Supercavitation in Soft Matter,” Phys. Rev. Lett., vol. 105, p. 118301, 2010.
- (10) M. A. Aegerter, N. Leventis, and M. M. Koebel, eds., Areogels Handbook. Advances in Sol-Gel Derived Materials and Technologies, New York: Springer, 2011.
- (11) M. Knudsen, Kinetic Theory of Gases: Some Modern Aspects. New York: Methuen, London; Wiley, 3 ed., 1950.
- (12) J. T. Seo, Q. Yang, S. Creekmore, B. Tabibi, D. Temple, S. Y. Kim, K. Yoo, A. Mott, M. Namkung and S. S. Jung, “Large pure refractive nonlinearity of nanostructure silica aerogel,” App. Phys. Lett., vol. 82, no. 25, p. 4444–4446, 2003.
- (13) J. T. Seo, S. M. Ma, Q. Yang, L. Creekmore, H. Brown, R. Battle, K. Lee, A. Jackson, T. Skyles, B. Tabibi, K. P. Yoo, S. Y. Kim, S. S. Jung and M. Namkung, “Large Optical Nonlinearity of Highly Porous Silica Nanoaerogels in the Nanosecond Time Domain,” J. Korean Phys. Soc., vol. 48, no. 6, p. 1395–1399, 2006.
- (14) M. D. Rollings, M. D. Grogan, L. Xiao, R. England, T. A. Birks and W. J. Wadsworth, “Large pure refractive nonlinearity of nanostructure silica aerogel,” Conference on Lasers and Electro-Optics 2010, vol. 82, p. JTuD59, 2010.
- (15) T. A. Birks, M. D. W. Grogan, L. M. Xiao, M. D. Rollings, R. England and W. J. Wadsworth, “Silica aerogel in optical fibre devices,” 2010 12th International Conference on Transparent Optical Networks, p. 1–4, Jun. 2010.
- (16) S. Gentilini, F. Ghajeri, N. Ghofraniha, A. Di Falco, and C. Conti, “Optical shock waves in silica aerogel,” Opt. Express, vol. 22, p. 1667–1672, Jan 2014.
- (17) A. V. Rao and P. Wagh, “Preparation and characterization of hydrophobic silica aerogels,” Mat. Chem. Phys., vol. 53, no. 1, pp. 13 – 18, 1998.
- (18) R. W. Boyd, Nonlinear Optics. New York: Academic Press, 2 ed., 2002.
- (19) M. Sheik-Bahae, A. Said, T.-H. Wei, D. Hagan, and E. Van Stryland, “Sensitive measurement of optical nonlinearities using a single beam,” Quantum Electronics, IEEE Journal of, vol. 26, pp. 760–769, Apr 1990.
- (20) M. Sheik-bahae, A. A. Said, and E. W. V. Stryland, “High-sensitivity, single-beam n2 measurements,” Opt. Lett., vol. 14, pp. 955–957, Sep 1989.
- (21) M. Sheik-Bahae, A. A. Said, D. J. Hagan, M. J. Soileau, and E. W. Van Stryland, “Nonlinear refraction and optical limiting in ”thick” media,” Opt. Eng., vol. 30, no. 8, pp. 1228–1235, 1991.
- (22) A. B. Ortega, M. L. A. Carrasco, M. M. M. Otero, E. R. Lara, E. V. G. Ramírez, and M. D. I. Castillo, “Analytical expressions for z-scan with arbitrary phase change in thin nonlocal nonlinear media,” Opt. Express, vol. 22, pp. 27932–27941, Nov 2014.
- (23) E. R. Lara, Z. N. Meza, M. D. I. Castillo, C. G. T. no Palacios, E. M. P. no, and M. L. A. Carrasco, “Influence of the photoinduced focal length of a thin nonlinear material in the z-scan technique,” Opt. Express, vol. 15, pp. 2517–2529, Mar 2007.
- (24) E. V. G. Ramirez, M. L. A. Carrasco, M. M. M. Otero, S. C. Cerda, and M. D. I. Castillo, “Far field intensity distributions due to spatial self phase modulation of a gaussian beam by a thin nonlocal nonlinear media,” Opt. Express, vol. 18, pp. 22067–22079, Oct 2010.
- (25) J. A. D. Pintle, E. R. Lara, and M. D. I. Castillo, “Sensitivity optimization of the one beam z-scan technique and a z-scan technique immune to nonlinear absorption,” Opt. Express, vol. 21, pp. 15350–15363, Jul 2013.
- (26) M. R. R. Vaziri, “Z-scan theory for nonlocal nonlinear media with simultaneous nonlinear refraction and nonlinear absorption,” Appl. Opt., vol. 52, pp. 4843–4848, Jul 2013.
- (27) M. R. R. Vaziri, F. Hajiesmaeilbaigi and M. H. Maleki, “Generalizing the Z -scan theory for nonlocal nonlinear media,” J. Opt., vol. 15, pp. 025201, Dec 2013.
- (28) N. Ghofraniha, C. Conti, G. Ruocco, and S. Trillo, “Shocks in Nonlocal Media,” Phys. Rev. Lett., vol. 99, no. 4, p. 043903, 2007.
- (29) A. F. N. S.L. Gómez, F.L.S. Cuppo, “Nonlinear optical properties of liquid crystals probed by Z-scan technique,” Braz. J. Phys., vol. 33, pp. 813 – 820, 12 2003.
- (30) I. Dancus, A. Petris, P. Doia, E. Fazio, and V. Vlad, “Z-scan measurement of thermal optical nonlinearities,” in ROMOPTO 2006: Eighth Conference on Optics, pp. 67851F–67851F, International Society for Optics and Photonics, 2007.