ODE and Random Boolean networks in application to modelling of 6-mercaptopurine metabolism
2 St. Petersburg Research Institute of Phthisiopulmonology,
Polytechnicheskaya st. 32, Saint-Petersburg, Russia;
3 Kursk State University, Radishcheva st. 33, Kursk, Russia.
∗ Corresponding author, e-mail: aurebours@googlemail.com )
Abstract
We consider two approaches to modelling of cell metabolism of 6-mercaptopurine, which is one of the important chemotherapy drugs used for treating of acute lymphocytic leukemia: kinetic ordinary differential equations and random Boolean networks, and analyse their interplay with respect to taking into account ATP concentration as a key parameter of switching between different pathways. It is shown that Boolean networks, which allows for avoiding complexity of general kinetic modelling, preserve an opportunity to the reproduction of the principal switching mechanism. To keep a detailed quantitative measure of the control parameter, a combined Boolean-ODE method is proposed.
1 Introduction
6-mercaptopurine (6-MP) is one of the important chemotherapy drugs used for treating acute lymphocytic leukemia (ALL). It belongs to the class of medications called purine antagonists and works by stopping the growth of cancer cells. 6-MP undergoes extensive metabolic intracellular transformations that results in the production of thionucleotides and active metabolites, which have cytotoxic and immunosuppressive properties leading to various acute side-effects as kidney affection, hepatotoxicity, pancreatitis and neuropathy.
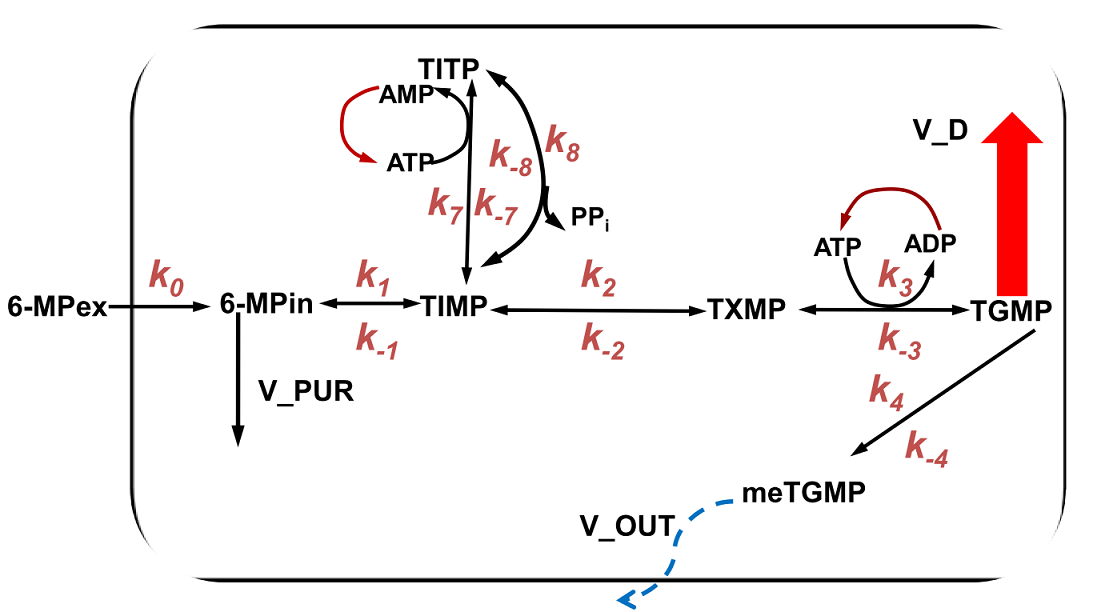
The conversion of 6-MP according the metabolic scheme presented in Fig. 1 involves several small pathways [1]. The desired pathway results in the formation of 6-Thioguanosine monophosphate (TGMP) that could be incorporated (via some metabolic transformations) into DNA and RNA leading to the tumor cell death [2, 3, 4] in the case of successful treatment of ALL. The catabolic pathways regulated by the enzyme mercaptopurine methyltransferase (TPMT) lead to the production of various methyl-mercaptopurines affecting purine biosynthesis [2] that leads to treatment failure in most cases [3]. The transformation (see Fig. 1) of 6-Thioinosine-5’-monophosphate (TIMP) to 6-Thioinosine-5’-triphosphate (TITP) is also an additional pathway, which results in the accumulation of cytotoxic products (TITP, TDTP) and slow production of TGMP. Since the realization of each pathway depends on enzymes properties, which are considered as the main regulators of ratio of activated and inactivated metabolites, then, in particular, a polymorphism in the corresponding genes can lead to the drug tolerance during ALL therapy [2, 5]. On the other hand, the energetic balance disturbance connected with the mitochondrial disfunction can play a crucial role in the appearance of side-effects and treatment failure [6, 7].
Besides experimental studies, enzymes activity in 6-MP metabolism and regulation effects have been exposed to numerical simulations and mathematical modelling [3, 2, 8]. These detailed semi-mechanistic models involve various compartments of human organism: from cell to organs to describe side-effects in dependence on the drug dose that allows for forecasting optimal dose for successful treatment. However, these models have been more attended to the properties of regulating enzymes and exclude energy metabolism, which may play a crucial role in the occurrence of side-effects [7]. Moreover, the large scale networks of interacting components require the adjusting of an enormous number of kinetic constants that prevents understanding of principal mechanisms and key parameters of switching between the pathways in 6-MP metabolism.
This is why another approach proposed by L. Glass and S. Kaufmann [9] gain popularity, see for a review of recent state of the art, e.g. [10, 11, 12]: Boolean networks. The Boolean network represents a graph, whose nodes can take values 0 (inactive) or 1 (active) and the edges are matched to the rules of Boolean logic. Their evaluation with respect to the previous logical states of nodes determines the consequent state of the network’s nodes.
Certainly, if ODE-based models are over-complicated, the Boolean networks are often over-simplified. For example, sometimes their over-simplicity requires introducing tricks, which are artificial to a certain extent, like over- and under- self- expressed nodes with value [13]. This situation calls for some hybrid models, which should exhibit the best sides of the both approaches [12, 14].
This problem is closely connected with the question about an interplay of ODEs modelling the scheme of kinetic reactions and Boolean networks simulating activity of reactants. This challenge induced a number of works, one can mention the pioneering article [15], as well the recent developments [16, 17]. However, the approaches considered in these works deals with the processes, which exhibit sharp transitions. In other words, such ODEs corresponds as a rule to the high-order Hill kinetics and the extraction of fast processes is possible. It is a natural situation for the gene/protein networks, but the components kinetics of biochemical metabolic networks is more smooth.
Thus, one of the goals of the present work is an attempt to overcome this difficulty utilizing a certain freedom, which provides probabilistic Boolean networks [18]: a set of Boolean networks, each of them corresponds to a different pathway, and a choice between them is determined by potential interactions between underlying biological components and their uncertainties.
2 Kinetic ODE model
To describe the principal dynamics of 6-MP metabolic transformations and to single out key nodes of this ”metabolic chain”, we have proposed a model, which describes the simplified kinetic scheme shown in Fig. 1. The dimensional model does not detalize dynamics of each enzyme but involves ATP concentration as a key player of the energy metabolism.
As a result, the system of ODE corresponding to the simplified kinetic model can be written as follows:
In our simulations, the kinetic constants corresponding to the biophysically relevant dynamics were determined as , , , , , , , , , , , , , , , , where M means M/mL, and d means days
The initial concentrations were equal to zero for all variables except the fixed value M/mL and , whose value plays a role of a control parameter.
3 A Boolean network mimicking the key dynamical processes
3.1 Network construction
The simplified metabolic network described above allows the representation in terms of the probabilistic Boolean network, which consists of five nodes , and the threshold-based rule for a choice between possible pathways. The value of the continuous control parameter could be non-stationary in dependence of the iteration’s number . The correspondence of these nodes to the metabolites and the transition rules for a parallel update of states are presented in Table 1.
| Node | Metabolite | Rules of interactions and updating |
|---|---|---|
| 6MPin | Starting node activated, when 6-mercaptopurine enters the cell. It activates TIMP and then will be deactivated. | |
| TIMP | This node is activated by 6MPin or by TITP and can activate nodes TXMP or TITP in dependence on a chosen pathway (the choice is governed by the variable ); it is deactivated after this. | |
| TXMP | This node is activated by TIMP and can activate TGMP or TIMP in dependence on a chosen pathway (the choice is governed by the variable ); it is deactivated after this. | |
| TGMP | This node indicate the target output, is activated by TXMP and deactivated after the completed output. | |
| TITP | This node is activated by TIMP within one of possible pathways and activate TIMP; it is deactivated after this. | |
| ATP | The continual parameter, which governs a choice of pathways by as follows: if , then then the irreversible activation TXMPTGMP is chosen; the reversible transition TXMPTGMP holds otherwise; if the pathway through TXMP is chosen, the pathway through TITP holds otherwise. The parameter is non-stationary and satisfies the decay kinetics if the process goes through the TIMP pathway. |
The realisation of this its via Boolean and conditional operators reads as follows (here the states of nodes are grouped into the matrix ):
y(:,1)=[1 0 0 0 0]’;
for j=2:M;
    if y(1,j-1)==1;
       y(2,j)=1;
    end
    if alpha>0.5
       if (y(2,j-1)==1)|(y(5,j-1)==1)
          if alpha<0.75
              y(3,j)=y(2,j-1);
              y(2,j)=y(5,j-1);
          else
              y(5,j)=1;
              alpha=(1-kappa)*alpha;
          end
        end
            y(4,j)=y(3,j-1);
    else
        y(3,j)=y(2,j-1);
        y(2,j)=1;
    end;
end
Here “=”, “==”, and “|” operators denotes the assignment, the equality, and OR respectively. Note that the code represented above can be evaluated straightforwardly using MATLAB or other software, which support MATLAB-like syntax (e.g. OCTAVE, FreeMat) if supplied by initial conditions and a value of the decay parameter. The last one is introduced via the simplest discretization of of the equation via the Euler scheme with the unit time step (i.e. in accordance to the assumed step of networks nodes updating):
.
For example, they may be stated as
N=5; % Number of nodes
M=8; % Number of iterations
y=zeros(N,M); % Initializing the matrix
ATP=0.6; % Initial ATP input (control parameter)
kappa=0.1; % The decay parameter value
alpha=ATP;
3.2 Simulation results
The growth of metabolites concentrations occurs sequentially for one node after another along the “metabolic chain” (see Fig. 1). It is revealed that TIMP is the key node of the reactions cascade since it provides two pathways, slow and fast, that also defines the blockage of the slow way interacting with ATP. Here we can define the concentration of ATP as a “key player” in the 6-MP metabolism, which regulates transitions in two main points: the metabolic pathway of TITP production (the chain’s branch from TIMP) and the transition TXMPTGMP.
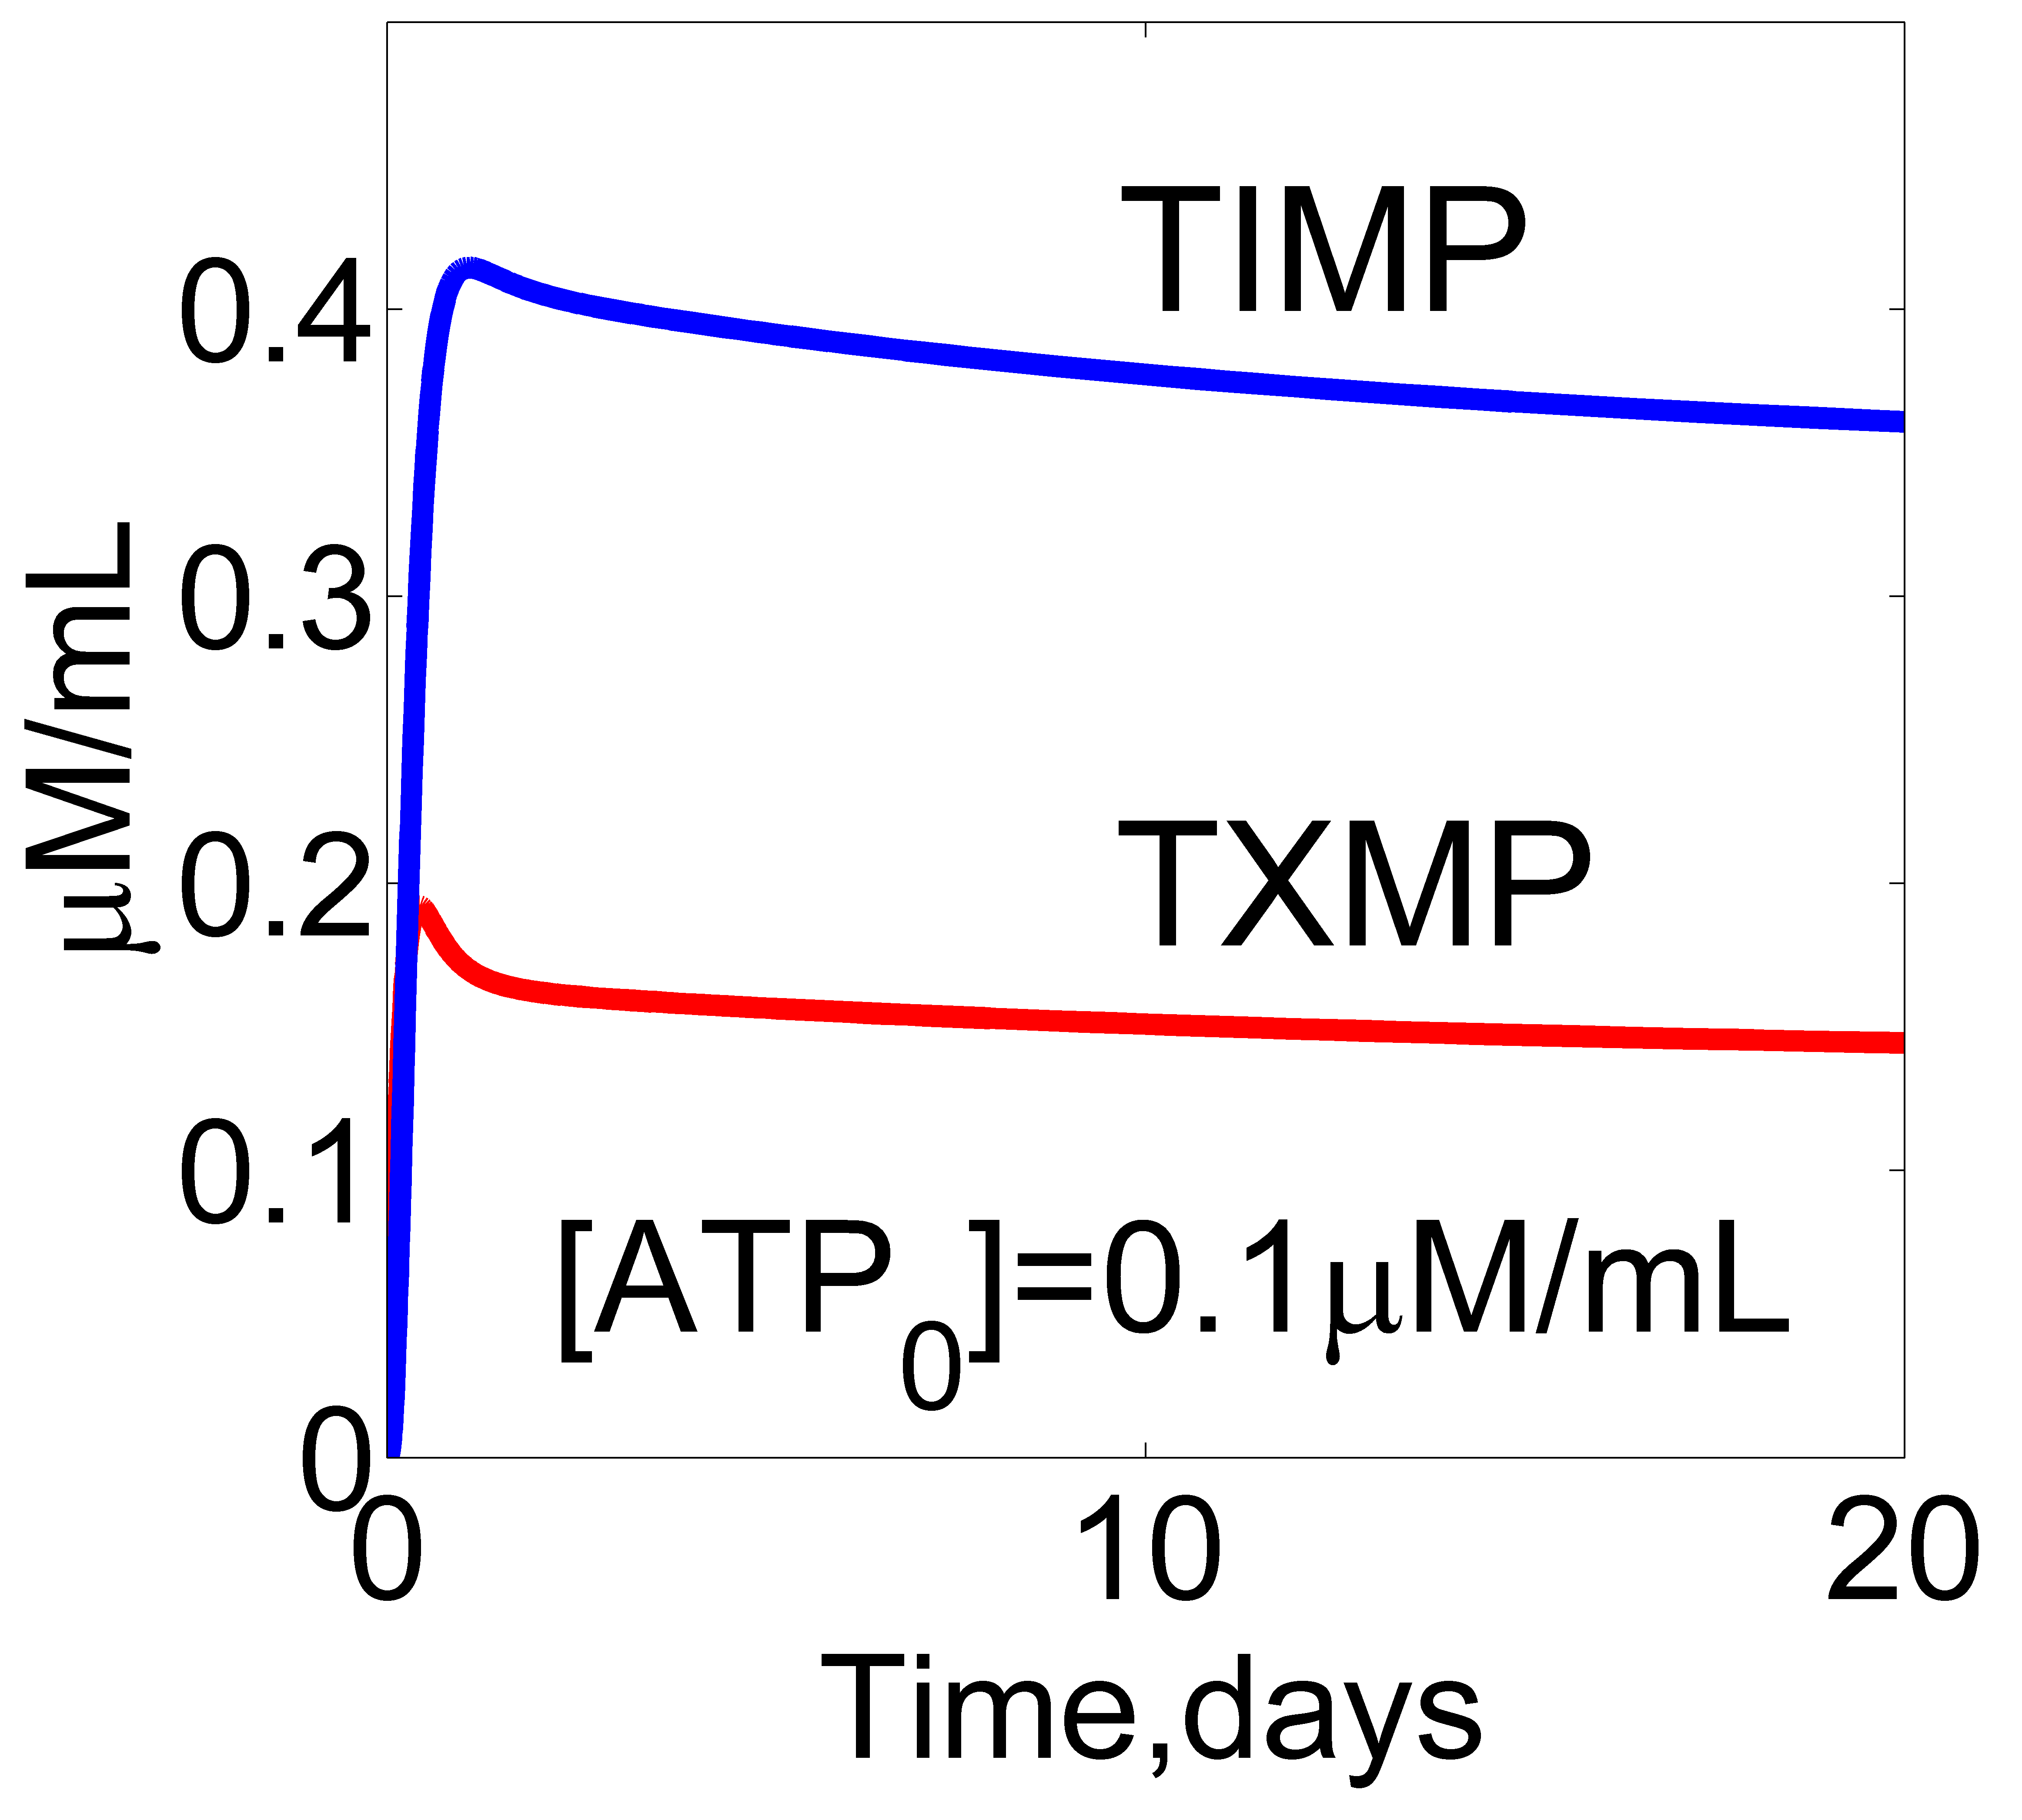
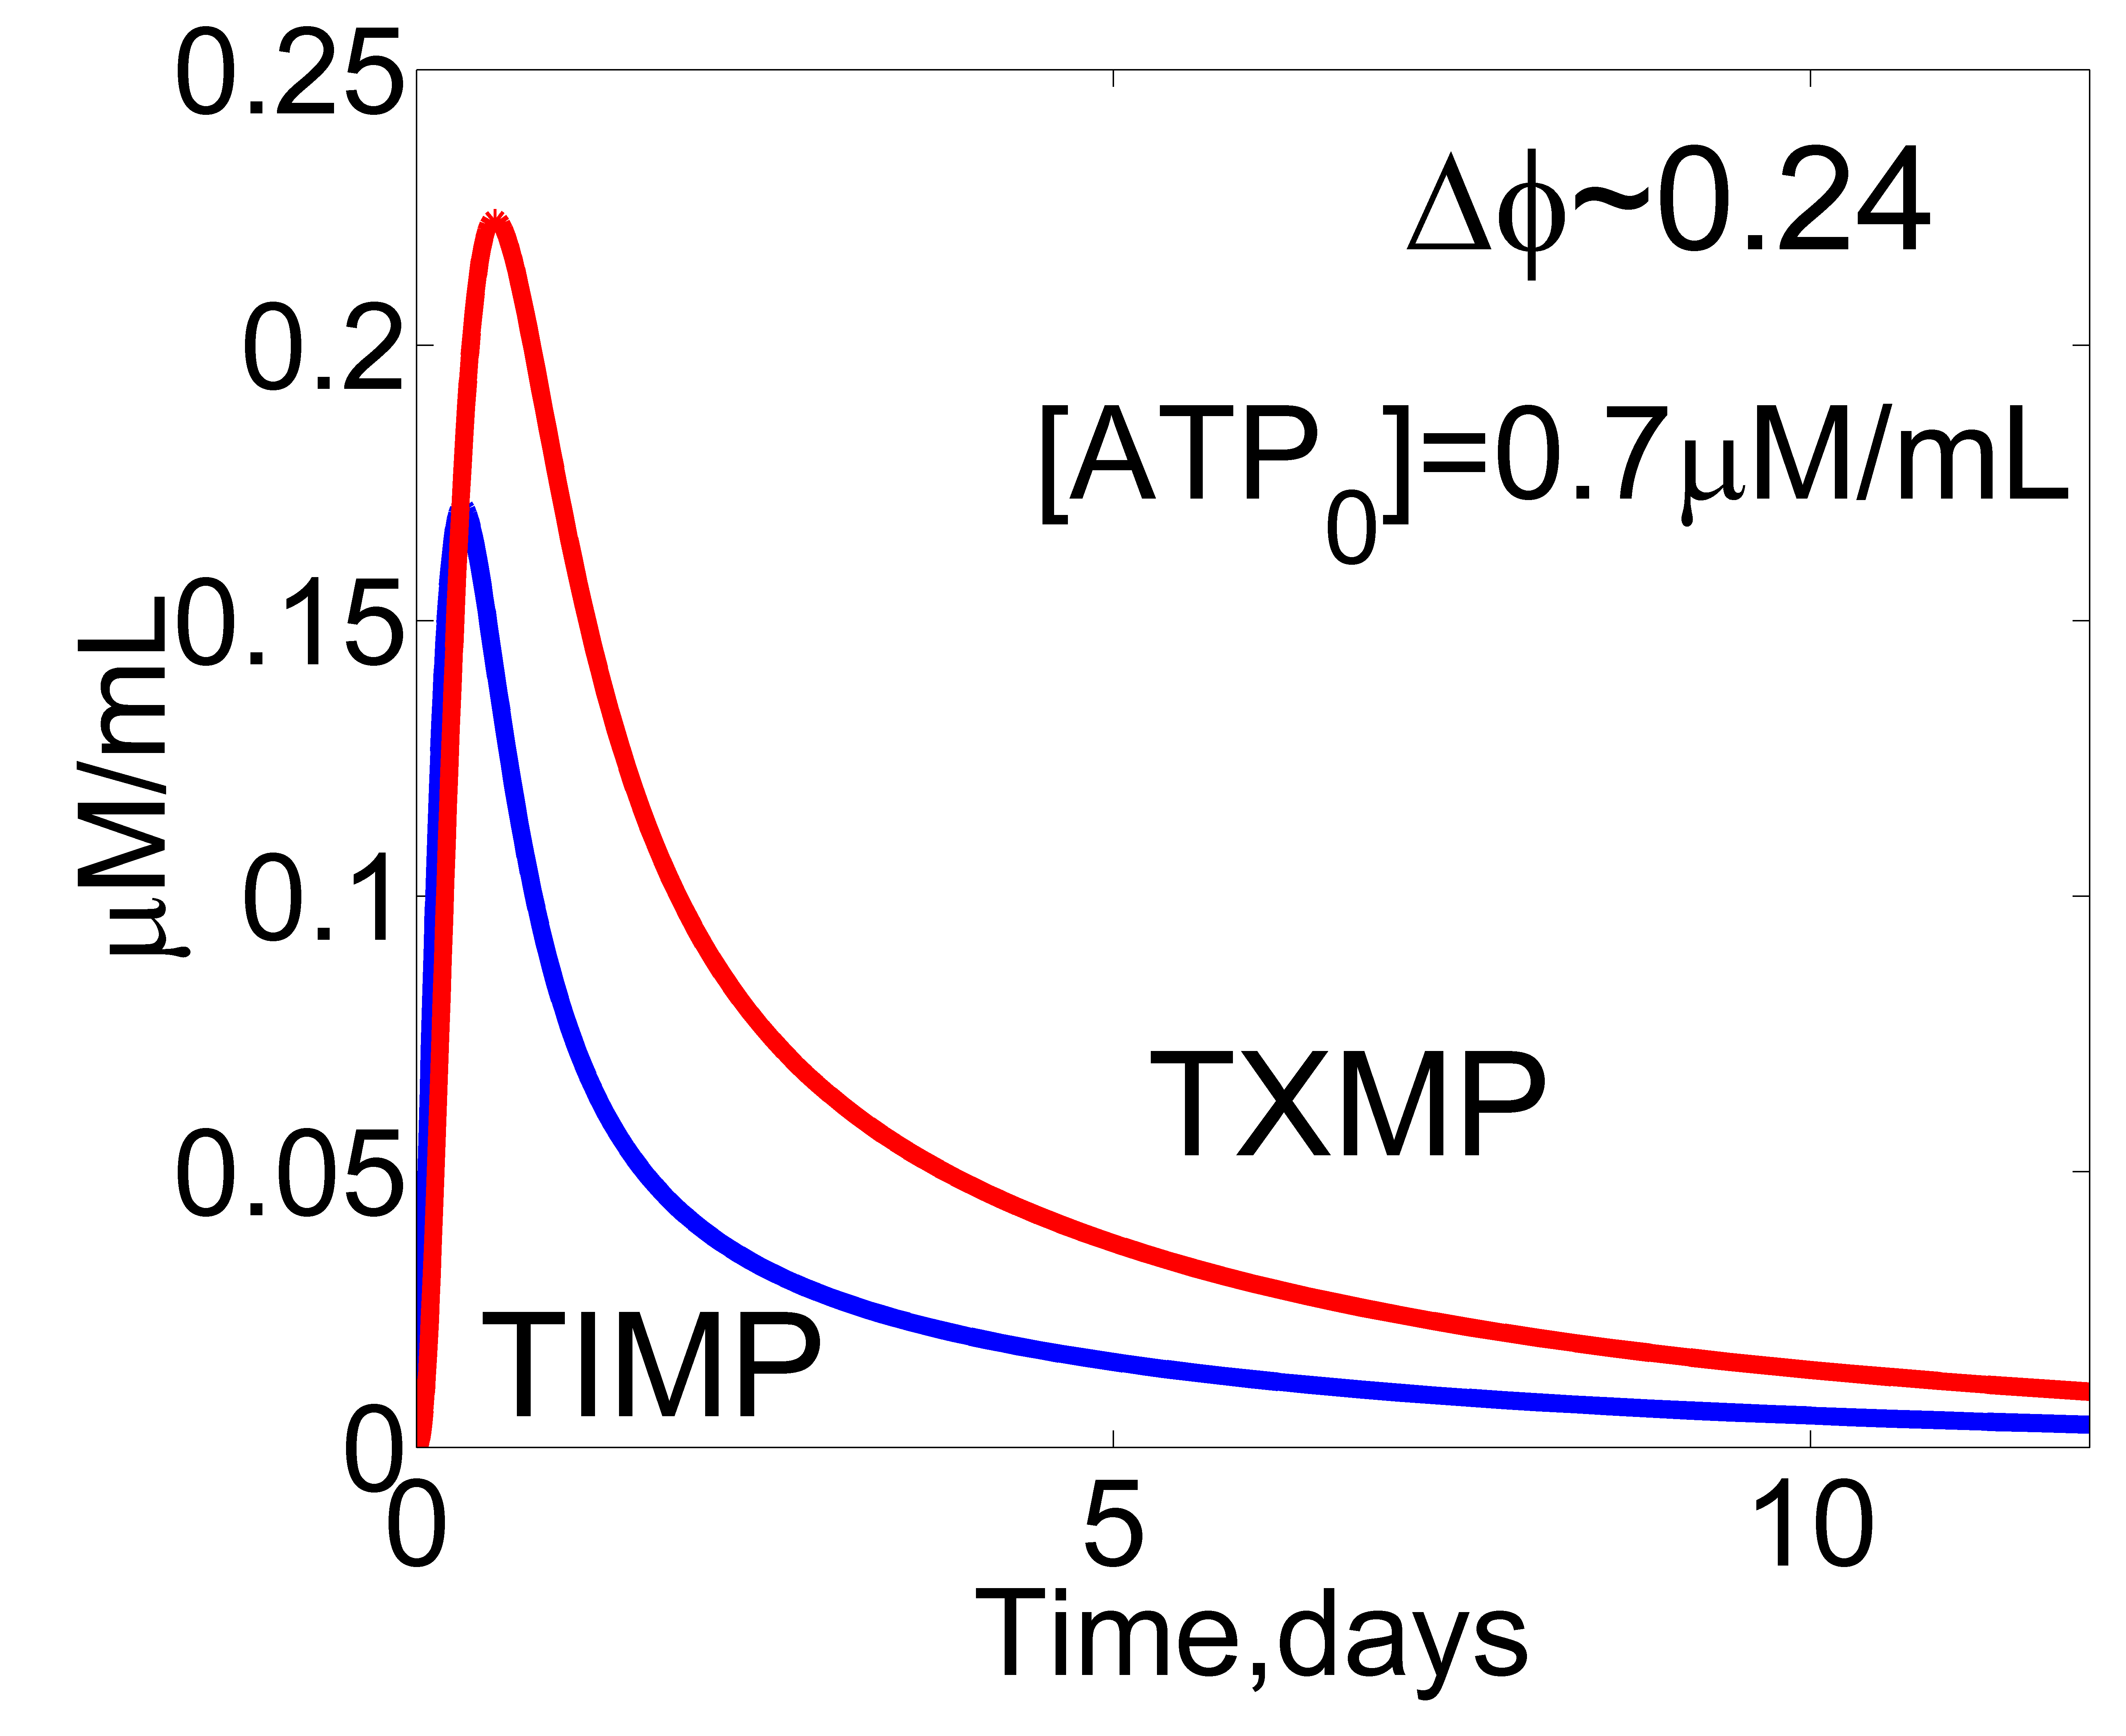
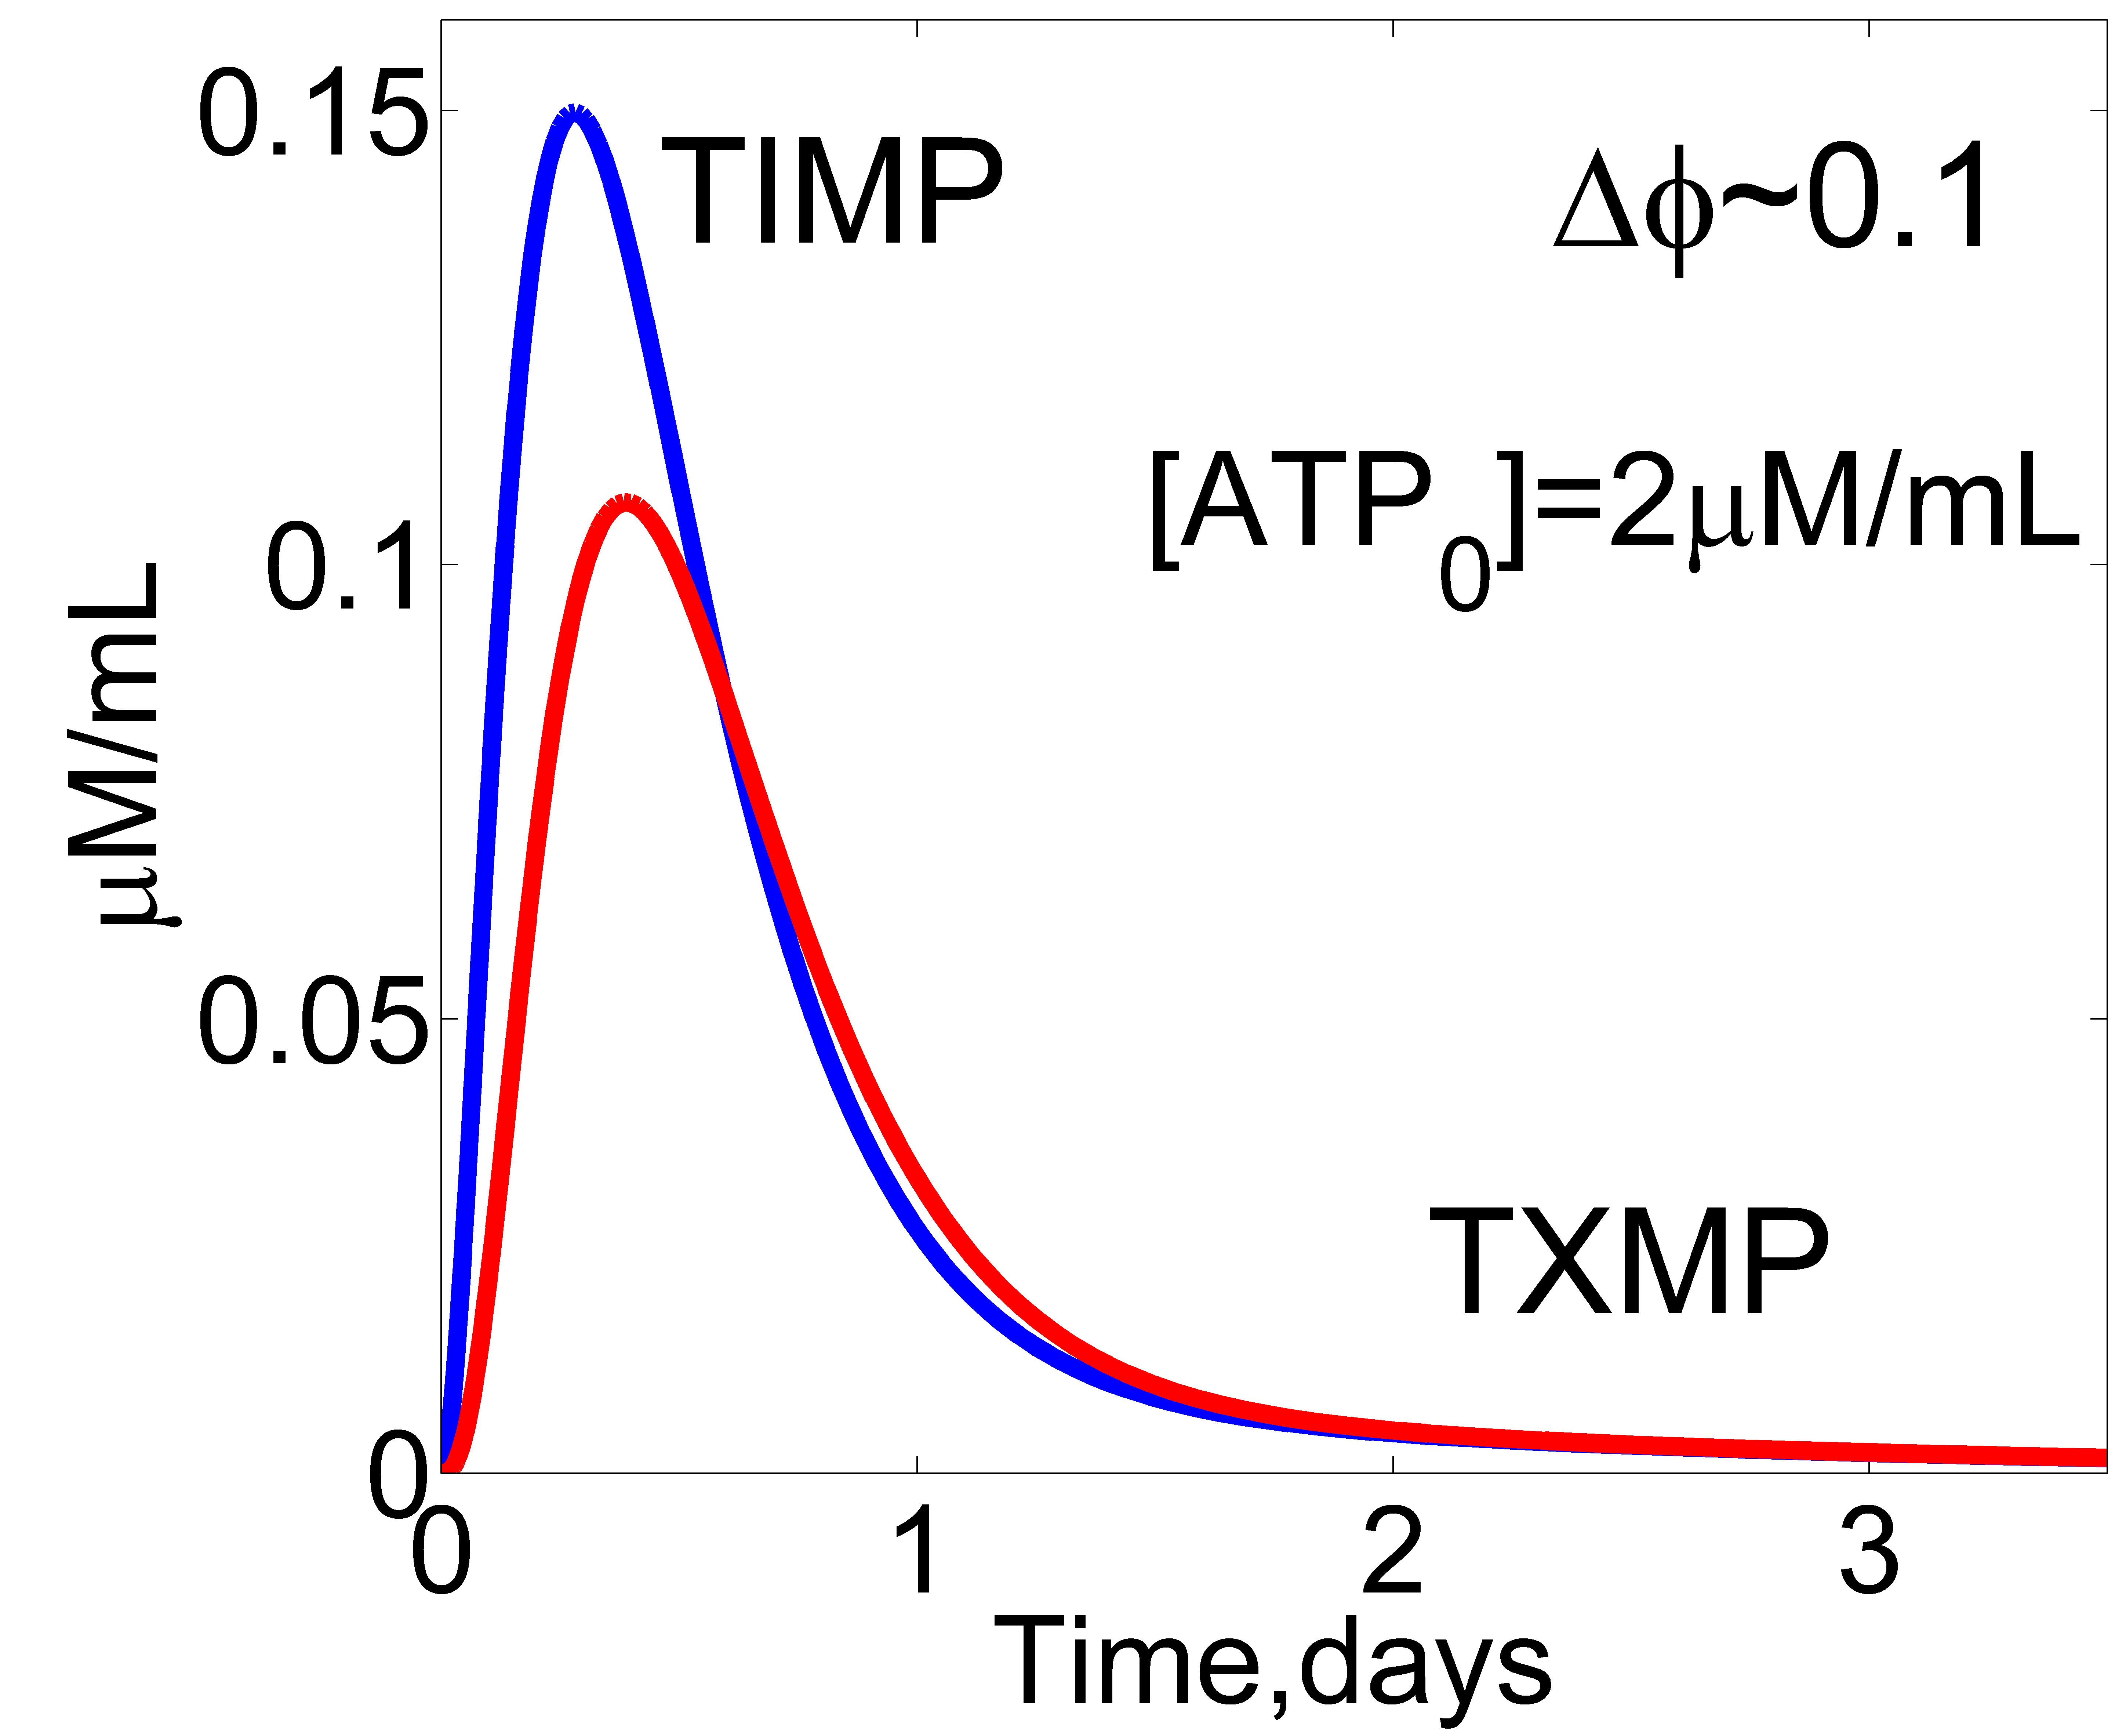
Simulations of this kinetic model show that small concentrations of ATP lead to the blockage of metabolic chain in the node TIMP (Fig 2,left). Large concentrations of ATP result in the competition between production of TITP (the end product of branch) and TGMP (the product of the chain), see (Fig 2,middle). The optimal concentration of ATP, which shifts the pathway to higher production of TGMP is equal to 0.7 M/mL ((Fig 2,right)).
The same situation can be observed at the simulation of Boolean Networks. Table 2 represents the results of simulations evaluated for a set of increasing initial values (ATP) of the control parameter . They capture all principal features of the dynamics for the simulated network. Note that first two steps are the same for all cases since the activation of TIMP by 6-MPin is unconditional. The different pathways are realized during next iterations only.
For ATP=0.2 the dynamics is blocked at the transition from TXMP to TGMP. Instead of the forward activation, the process goes back reactivating the node corresponding to TIMP. At the same time, since this reaction is reversible, the reactivation of TXMP occurs, etc. Thus, the system reaches a steady state, which is reflected in unit values of the nodes and spreading ad infinitum.
The value ATP=0.2 corresponds to the situation, where the pathway TXMP TGMP is allowed but the pathway leading to TITP is blocked. As a result, the transition process is direct and straightforward: the nodes – are activated sequentially during the four sequential iterations. When is activated, this means that the target substance is released, and all nodes switch off to zeros in absence of a new influx into .
Both the values ATP=0.8 and ATP=0.9 exceed the threshold value . Whence, the pathway to TITP is available now. It is reflected as but at the third iteration, i.e. the pathway is changed. However, there is a difference in the further time evolution of the network’s states for these two cases. Namely, the table corresponding to
ATP=0.8 demonstrate the activation of (i.e. the backward transition TITP TIMP) during the next iteration and the consequent sequential nodes activation along the pathway TIMP TXMP TGMP. On the other hand, these step are delayed in the case of ATP=0.8: the both 3rd and 4th iterations contains and , only.
Such a behaviour originates from the introduced non-stationarity of the control parameter , which resembles the concentration of ATP. As it was discussed above, the TIMP TITP pathway is an ATP-consuming process. Thus, each iteration corresponding to this pathway diminishes while it will cross the threshold from above. Further, this pathway will be blocked. The cases ATP=0.8 and ATP=0.9 require one and two iterations for this decay of , respectively. Larger values of ATP will result in larger delays.
Finally, we should note that the discussed results are quasi-deterministic, since they
correspond to individual realizations. In a general case, i.e. in the strict sense of probabilistic Boolean networks, one can generate an ensemble of realisations with ATP randomly distributed with respect to some appropriate probability distribution. Correspondingly, the output will be a distribution of the nodes values during iterations. But this procedure is out of direct goals of the present work.
| ATP=0.2 | |||||||
|---|---|---|---|---|---|---|---|
| 1 | 2 | 3 | 4 | 5 | 6 | 7 | |
| 1 | 0 | 0 | 0 | 0 | 0 | 0 | |
| 0 | 1 | 1 | 1 | 1 | 1 | 1 | |
| 0 | 0 | 1 | 1 | 1 | 1 | 1 | |
| 0 | 0 | 0 | 0 | 0 | 0 | 0 | |
| 0 | 0 | 0 | 0 | 0 | 0 | 0 |
| ATP=0.6 | |||||||
|---|---|---|---|---|---|---|---|
| 1 | 2 | 3 | 4 | 5 | 6 | 7 | |
| 1 | 0 | 0 | 0 | 0 | 0 | 0 | |
| 0 | 1 | 0 | 0 | 0 | 0 | 0 | |
| 0 | 0 | 1 | 0 | 0 | 0 | 0 | |
| 0 | 0 | 0 | 1 | 0 | 0 | 0 | |
| 0 | 0 | 0 | 0 | 0 | 0 | 0 |
| ATP=0.8 | |||||||
|---|---|---|---|---|---|---|---|
| 1 | 2 | 3 | 4 | 5 | 6 | 7 | |
| 1 | 0 | 0 | 0 | 0 | 0 | 0 | |
| 0 | 1 | 0 | 1 | 0 | 0 | 0 | |
| 0 | 0 | 0 | 0 | 1 | 0 | 0 | |
| 0 | 0 | 0 | 0 | 0 | 1 | 0 | |
| 0 | 0 | 1 | 0 | 0 | 0 | 0 |
| ATP=0.9 | |||||||
|---|---|---|---|---|---|---|---|
| 1 | 2 | 3 | 4 | 5 | 6 | 7 | |
| 1 | 0 | 0 | 0 | 0 | 0 | 0 | |
| 0 | 1 | 0 | 0 | 1 | 0 | 0 | |
| 0 | 0 | 0 | 0 | 0 | 1 | 0 | |
| 0 | 0 | 0 | 0 | 0 | 0 | 1 | |
| 0 | 0 | 1 | 1 | 0 | 0 | 0 |
4 Discussion
It is known that the methylation of 6-MP resulted in a formation of the intermediate metabolites occurs at a low concentration of intracellular ATP (0.1 mol/ml). Simultaneously, the concentrations TIMP and TXMP remain at a prolonged constant level. At these conditions, a production of the final metabolite, TGMP, slows down. As a result, the therapeutic efficiency also diminishes but the risk of toxic action grows since intermediate metabolites of 6-MP inhibit biosynthesis of de novo purines. Thus, the lowering intracellular ATP pool in T-lymphocytes results in higher toxicity and lower efficiency of this drug [7, 19].
Our results model an effect of high initial concentration of ATP on the metabolism of 6-MP. They show that ATP concentrations 0.1 mol/ml produce high concentrations of the intermediate metabolite that indicates an incomplete metabolism of the drug accompanied by a production of TGMP insufficient for the therapeutic action. Therefore, we suppose that the intensive TIMP formation plays a role of the marker indicating an accumulation of toxic final metabolites at a high level of intracellular ATP.
A concentration change of ATP is a key factor for the energy exchange deficit accompanied by the mitochondrial [21]. This results in decreasing therapeutic effect of drugs during the tumor treatment. It has been shown the glycolysis inhibition by an attenuation of the glucose consumption cell function leads to the diminishing of ATP level and, finally, results in tumor cell death. However, the process of energy deficiency is invertible since the cell activates another pathway, which supports ATP accumulation, and the cell will recover its function.
The results obtained using our model argue that the optimal initial ATP concentration is equal to 0.7 mol/ml. It corresponds to the situation, when 6-MP metabolism is a completed process resulted in the both production of therapeutically active products and reducing the pool of toxic intermediate products.
At the administration of cytotoxic drugs according to the protocol BFM ALL 2000 [20], it is expedient to keep the concentration of intracellular ATP within a middle range to prevent risks of adverse drugs reactions instead of an artificial inhibition of energy metabolism [21].
The clinical indication of low ATP concentration is acidosis by lactates accumulation [21]. This leads to the mitochondrial dysfunction and an additional toxic effect. Higher ATP concentrations inhibit glycolysis resulting in a glucose accumulation, glycose tolerance, and, indirectly, in the cardiomyopathy development [22].
Thus, we hypothesize that the maintenance of ATP intermediate level is a necessary condition to reach a complete therapeutic effect and diminish toxicity of a chemotherapy process.
5 Conclusion and Outlooks
In this work, we have analysed the dynamic behaviour of metabolic pathways of 6-mercaptopurine with a focus on the revealing a key parameter, which switches between two principal “branches”, slow and fast one. The results of simulations based on the system of ordinary equations indicate that ATP is the desired “key player” in the 6-MP metabolism. This conclusion is supported by a number of phenomenological observations presented in the modern biomedical literature and allows for quantitative clarifying the underlying processes.
Basing on the results of ODE modelling, we have reformulated the problems in terms of the probabilistic Boolean networks. This approach is much more simpler in realization since it does not require a knowledge of multiple kinetic parameters but, in the same time, adequately reproduces the key details of switching principal dynamic regimes as a choice between different possible pathways. Therefore, it can be scaled to more detailed picture of metabolites interactions in future research of the studied process.
We also need to highlight the crucial feature introduced into a construction of the network: a non-stationary continual parameter, which governs the switching process. Such an approach, which has demonstrated its effectiveness in the considered case study, opens new perspectives for “hybridising” of continual (ODE-based) and discrete (Boolean) approaches to metabolic modelling. In contrast to previous works [15, 16, 17], which considered Boolean networks only as a limiting case of continual-time kinetic processes (in fact, as a mimicking of switching between unstable stationary state by nodes activity), the introduction of non-stationarity into the probabilistic parameter allows the consideration of smoother transitions, and, in principle, even an activity of small sub-networks with a small number of kinetic constants considered as building blocks for a large Boolean network.
Acknowledgement
The work is supported by the Grant no. 14.575.21.0073, code RFMEFI57514X0073 of the Ministry of Education and Science of the Russian Federation
References
- [1] Cheok M.H., Pottier N., Kager L.,Evans W.E. (2009). Pharmacogenetics in acute lymphoblastic leukemia. Seminars in hematology, WB Saunders, 46(1), 39-51.
- [2] Panetta J.C., Evans W.E., Cheok M.H. (2006). Mechanistic mathematical modelling of mercaptopurine effects on cell of human acute lymphoblastic leukaemia cells. British Journal of Cancer, 94, 93-100
- [3] Jayachandran D., Rundell A.E., Hannemann R.E., Vik A.T., Ramkrishna D. (2014). Optimal Chemotherapy for Leukemia: A Model-Based Strategy for Individualized Treatment. PLOS one, 9(10), 1-18
- [4] Hedeland R.L., Hvidt K., Nersting J., Rosthøj S., Dalhoff K., Lausen B., Schmiegelow K. (2010). DNA incorporation of 6-thioguanine nucleotides during maintenance therapy of childhood acute lymphoblastic leukaemia and non-Hodgkin lymphoma. (2010). Cancer Chemother Pharmacol., 66(3), 485-91.
- [5] Dorababu P., Nagesh N.,Linga V.G., Gundeti S.,Kutala V.F., Reddanna P., Digumarti R. (2012). Epistatic interactions between thiopurine methyltransferase (TPMT) and inosine triphosphate pyrophosphatase (ITPA) variations determine 6-mercaptopurine toxicity in Indian children with acute lymphoblastic leukemia. Eur J Clin Pharmacol, 68, 379-387
- [6] Daehn I., Brem R., Barkauskaite E., Karran P. (2011). 6-Thioguanine damages mitochondrial DNA and causes mitochondrial dysfunction in human cells. FEBS Letters, 585, 3941-46
- [7] Fernández-Ramos, A. A., Poindessous, V., Marchetti-Laurent, C., Pallet, N., Loriot, M. A. (2016). The effect of immunosuppressive molecules on T-cell metabolic reprogramming. Biochimie, 127, 23-36.
- [8] Ogungbenro K., Aarons L. (2014). Physiologically based pharmacokinetic modelling of methotrexate and 6-mercaptopurine in adults and children. Part 2: 6-mercaptopurine and its interaction with methotrexate. J Pharmacokinet Pharmacodyn., 41, 173–185
- [9] Glass, L., Kauffman, S. A. (1973). The logical analysis of continuous, non-linear biochemical control networks. Journal of Theoretical Biology, 39(1), 103-129.
- [10] Karlebach, G., Shamir, R. (2008). Modelling and analysis of gene regulatory networks. Nature Reviews Molecular Cell Biology, 9(10), 770-780.
- [11] Wang, R. S., Saadatpour, A., Albert, R. (2012). Boolean modeling in systems biology: an overview of methodology and applications. Physical biology, 9(5), 055001.
- [12] Le Novére, N. (2015). Quantitative and logic modelling of molecular and gene networks. Nature Reviews Genetics, 16(3), 146-158.
- [13] Davidich, M. I., Bornholdt, S. (2013). Boolean network model predicts knockout mutant phenotypes of fission yeast. PLoS One, 8(9), e71786.
- [14] Fisher J., Henzinger, T. A. (2007). Executable cell biology. Nature biotechnology, 25(11), 1239-1249.
- [15] Davidich, M., Bornholdt, S. (2008). The transition from differential equations to Boolean networks: a case study in simplifying a regulatory network model. Journal of Theoretical Biology, 255(3), 269-277.
- [16] Stötzel, C., Röblitz, S., Siebert, H. (2015). Complementing ODE-based system analysis using Boolean networks derived from an Euler-like transformation. PloS One, 10(10), e0140954.
- [17] Menini, L., Possieri, C., Tornambé, A. (2016). Boolean network representation of a continuous time system and finite horizon optimal control: application to the single gene regulatory system for the lac operon. International Journal of Control, DOI:10.1080/00207179.2016.1186289.
- [18] Shmulevich, I., Dougherty, E. R., Kim, S., Zhang, W. (2002). Probabilistic Boolean networks: a rule-based uncertainty model for gene regulatory networks. Bioinformatics, 18(2), 261-274.
- [19] Valente, M. J., Araújo, A. M., de Lourdes Bastos, M., Fernandes, E., Carvalho, F., de Pinho, P. G., Carvalho, M. (2016). Characterization of hepatotoxicity mechanisms triggered by designer cathinone drugs (β-keto amphetamines). Toxicological Sciences, doi: 10.1093/toxsci/kfw105.
- [20] Flohr, T., Schrauder, A., Cazzaniga, G. et al. (2008). Minimal residual disease-directed risk stratification using real-time quantitative PCR analysis of immunoglobulin and T-cell receptor gene rearrangements in the international multicenter trial AIEOP-BFM ALL 2000 for childhood acute lymphoblastic leukemia. Leukemia, 22, 771-782.
- [21] Beuster, G., Zarse, K., Kaleta, C., Thierbach, R., Kiehntopf, M., Steinberg, P., Shuster, S., Ristow, M. (2011). Inhibition of alanine aminotransferase in silico and in vivo promotes mitochondrial metabolism to impair malignant growth. Journal of Biological Chemistry, 286(25), 22323-22330.
- [22] Guertl, B., Noehammer, C., Hoefler, G. (2000). Metabolic cardiomyopathies. International Journal of Experimental Pathology, 81, 349-372.