Photon echo in exciton-plasmon nanomaterials: a time-dependent signature of strong coupling
Abstract
We investigate the dynamics of photon echo exhibited by exciton-plasmon systems under strong coupling conditions. Using a self-consistent model based on coupled Maxwell-Bloch equations we investigate femtosecond time dynamics of ensembles of interacting molecules optically coupled to surface plasmon supporting materials. It is shown that observed photon echoes under two pulse pump-probe sequence are highly dependent on various material parameters such as molecular concentration and periodicity. Simulations of photon echoes in exciton-plasmon materials reveal a unique signature of the strong exciton-plasmon coupling, namely a double-peak structure in spectra of recorded echo signals. This phenomenon is shown to be related to hybrid states (upper and lower polaritons) in exciton-plasmon systems under strong coupling conditions. It is also demonstrated that the double-peak echo is highly sensitive to mild deviations of the coupling from resonant conditions making it a great tool for ultrafast probes.
I Introduction
The research field of nanoplasmonics has grown substantially in past few years due to tremendous progress in fabrication techniques and optical characterization Zayats et al. (2005); Stockman (2011); Halas et al. (2011). Due to strong spatial localization of electromagnetic modes corresponding to surface plasmon-polariton resonance in such materials, one may investigate the fundamentals of light-matter interaction on a single molecule level Chikkaraddy et al. (2016). A new type of nanomaterials with molecular excitons strongly optically coupled to plasmons is also extensively discussedTorma and Barnes (2015). While the linear plasmonics is still enjoying significant interest Murray and Barnes (2007), the field of nonlinear plasmonics Kauranen and Zayats (2012) recently began to attract considerable attention Butet et al. (2015). An obvious extension of various nonlinear spectroscopy techniquesMukamel (1999) to the domain of plasmonics is also an ongoing effort Vasa et al. (2013); Sukharev et al. (2013); Metzger et al. (2016).
Free induction decay is a well-documented phenomenon that was first demonstrated in nuclear magnetic resonance and is also observed in optics Allen and Eberly (1975). A population of quantum emitters can exist in which all emitters have the same central transition energy but each is detuned by some amount from the central transition energy due to inhomogeneous broadening Abella et al. (1966), which can result from conditions such as Doppler shift in individual gas molecules or variations in electric field from point to point in solids Mandel and Wolf (1995). The macroscopic polarization of an ensemble of emitters is the sum of each individual contribution from every emitter in the ensemble. Given that the transition energies of the emitters in the ensemble are described by a distribution, each individual emitter oscillates at a frequency that is slightly different from the others after the system is pumped by a strong incident pulse. As a result, all of the emitters begin to oscillate in phase at first, but eventually they dephase within a characteristic inhomogeneous lifetime and, if left alone, never re-phase again Allen and Eberly (1975). However, for times less than the natural lifetime of the emitter, each emitter is still oscillating. One can in principle invert the dephasing process by applying a second pump in the form of a pulse. The oscillations then all run in reverse, resulting in a subsequent rephasing. The ensemble exhibits a non-zero macroscopic polarization once again eventually emitting radiation known as a photon echo signal.
This technique is widely used in chemistry and is referred to as photon echo spectroscopy de Boeij et al. (1998). Inhomogeneous effects due to variations in an emitter’s surroundings cause each emitter to oscillate at a slightly different frequency than the others, and photon echo spectroscopy removes this effect. Any remaining dephasing is irreversible by the echo technique, and is revealed as diminished intensity of the echo Cho et al. (1992). For example, as the delay in applying the pulse increases, the natural lifetime of the emitters causes all of their oscillations to decrease, resulting in an echo with lower intensity. Thus a time and frequency structure of a detected photon echo contains important information about a probed system.
Additionally, the recovery of a time signal after dephasing offers prospects for memory storage. In Langer et al. (2014), the optical properties are copied to a spin system whose lifetime is much longer than that of the optical system thus extending the duration of the system’s memory.
Our major interest in this paper is to test a concept of photon echo in strongly coupled exciton-plasmon systems in order to understand any new features unique to the strong coupling regime. First, we briefly overview the numerical model used. Next, we consider the application of a pulse to a 1-D ensemble followed by application of a pulse generating a photon echo signal. The density of molecules in this ensemble is varied and the strength of the echo is considered in terms of the transmission and reflection of the ensemble. Finally, we investigate the photon echo of two exciton-plasmon systems, namely a periodic array of slits and a core-shell nanoparticle, each combined with inhomogeneously broadened molecules.
II Model
The time dynamics of molecules is described by the Liouville equation
| (1) |
where corresponds to the index of a specific transition energy, , of a given molecule at a given spatial position, is the single-molecule density matrix, describes relaxation processes, and is the Hamiltonian of a single molecule with a dipole moment operator interacting with a local electric field
| (2) |
here the field-free Hamiltonian for a molecule with energy index is . The dynamics of the electric field, , is governed by corresponding Maxwell’s equations as discussed below.
We consider an ensemble of two-level molecules explicitly including the inhomogeneous broadening (IB) described by the Gaussian distribution
| (3) |
where is the normalization constant, is the energy corresponding to the maximum in the Gaussian distribution, and characterizes the full width at half-maximum (FWHM) of the distribution, which describes how broad a given IB is. Specific values of in this work are: ”narrow” is eV, ”intermediate” is eV, and ”broad” is eV. The distribution (3) is normalized such that
| (4) |
The expectation value of the dipole moment is calculated as a sum over all molecular transition frequencies
| (5) |
The macroscopic polarization, , is calculated according to , where is the number density of molecules. The polarization current, , is subsequently inserted into Maxwell’s equations, the solutions of which at a give time and spatial positions are then used to update macroscopic polarization. The following set of parameters describing a molecule is used in this paper: the transition dipole moment is Debye, the radiationless lifetime of the excited state is ps, and the pure dephasing time is fs.
To model electromagnetic (EM) wave propagation and its interaction with molecules and metal in time and space in addition to the Bloch equations (1) we numerically integrate Maxwell’s equations employing the finite-difference time-domain method (FDTD) Taflove and Hagness (2005)
| (6a) | |||||
| (6b) | |||||
where and are the permeability and the permittivity of free space, respectively, is the magnetic field, corresponds to the current density in spatial regions occupied by metal and polarization current in regions filled with molecules, is the relative permittivity at a given spatial position (1 for vacuum, see below).
To account for the material dispersion of metal we employ the Drude model
| (7) |
where is the plasma frequency, is the phenomenological damping, and is the high-frequency limit of the dielectric function. For silver, we use the following parameters Gray and Kupka (2003): eV, eV, and . The corresponding time dynamics of the current density satisfies the following equation Taflove and Hagness (2005)
| (8) |
Coupled equations (1), (6a), (6b), and (8) are solved self-consistently using home-built codes. The numerical convergence is achieved for the grid with nm and a time step of .
It should be noted that inevitable discretization of the transition energy distribution (3) results in unphysical rephasing which must be carefully monitored in all simulations in order to avoid spurious numerical artifacts. In brief, after initial excitation of the molecular system, free induction decay occurs followed by a numerical rephasing after a delay which is proportional to the , where is the discretization step in (3). The rephasing is obviously unphysical for a realistic number of molecules (i.e. continuous transition frequency distribution with the revival time being infinite Allen and Eberly (1975)). In all our simulations we use an energy step no larger than eV, corresponding to a revival time of fs or longer.
III Results and Discussion
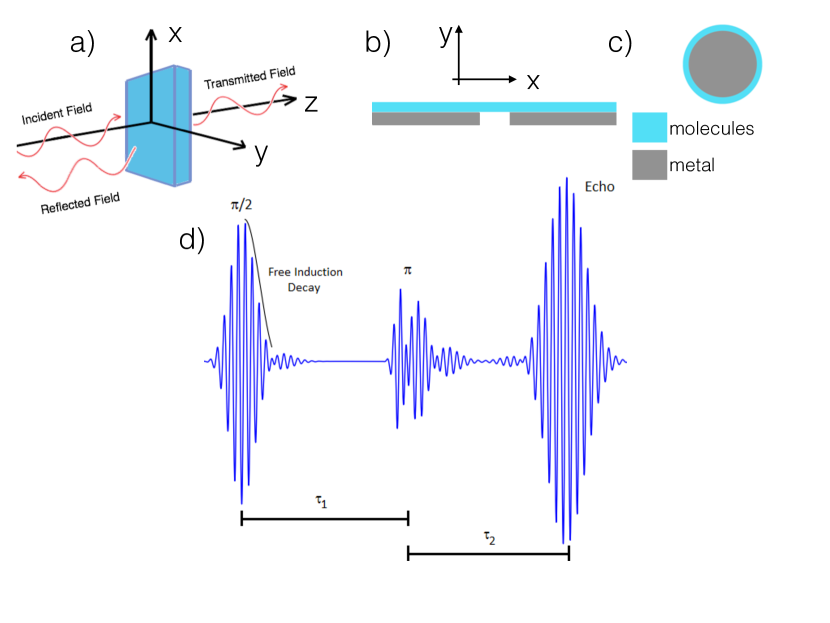
First we consider noninteracting molecules driven by linearly polarized incident field, the polarization current calculated in the direction of the incident field polarization is used as an indication of rephasing. We employ the two-pulse pump-probe photon echo sequence as illustrated in Fig. 1d. corresponds to the time between the maximum of the pulse and the pulse, and corresponds to the time between the maximum of the pulse and the maximum of the echo. These times are roughly equal as they should be Mandel and Wolf (1995). The duration and amplitude of the pulse are such that it drives the density matrix element of a molecule (whose transition energy corresponds to ) to . The pulse completely inverts the molecule. Molecules are excited by a pulse polarizing the sample, which then undergoes dephasing resulting in observed free induction decay. A pulse is then applied, and the maximum of the photon echo signal is observed at time . Using these simulations as a test case we verified our numerical procedure and proceed to the case of interacting molecules.
The ensemble considered thus far has been a collection of noninteracting molecules. In order to determine the influence of collective effects on the echo amplitude and its form, we employ Maxwell-Bloch formalism applied to the one-dimensional thin molecular layer as depicted in Fig. 1a. By integrating coupled Maxwell-Bloch equations we allow molecules to interact via emission and absorption of EM radiation. We first examined the main results of Ref. [Puthumpally-Joseph et al., 2015] for the molecules with IB calculating the transmission, , and reflection, (not shown). Both and expectedly broaden and flatten as the inhomogeneous broadening is introduced and further increased. The transmission decreases toward and the reflection increases toward as the density increases, both are expected results as at high densities the electric susceptibility near central frequency becomes negative indicating the fact that the molecules oscillate out-of-phase with respect to the incident field thus efficiently canceling it out inside the sample Puthumpally-Joseph et al. (2014). Distortion is observed on the edges of the spectral features due to increasing interference between the reflected signals from varying depths of the ensemble.
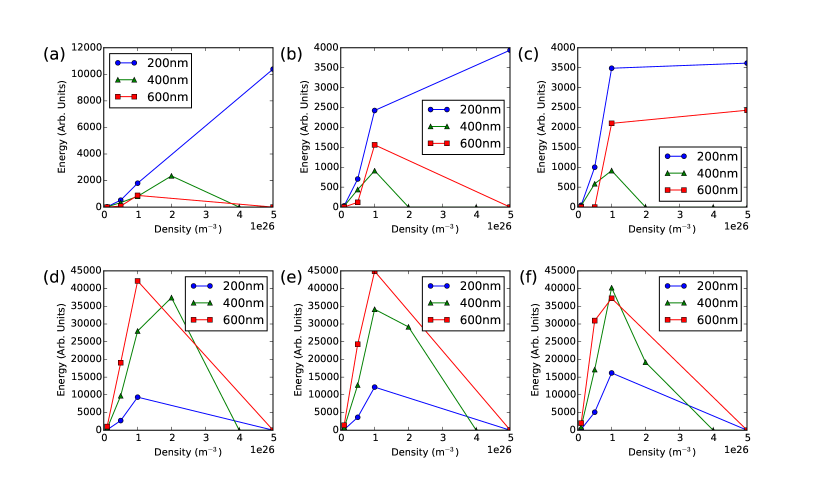
We apply the --pulse sequence tuned to the central frequency of a single molecule set at eV, then record the energy of the echo signal. The signal is calculated as an integral of the electric field intensity over time on both the input (reflection) and output (transmission) sides of the molecular layer. Simulations are performed for several densities, molecular layer thicknesses, and values of inhomogeneous broadening. The results are shown in Fig. 2. On both sides of the ensemble, the echo amplitude increases with the density for lower densities but, in many instances, decreases sharply at higher densities. This can be understood in terms of how the transmission and reflection of the ensemble vary with density. At higher densities, the reflection approaches and the transmission becomes very small as discussed above. Thus, the driving fields do not make it as far into the ensemble for higher densities making photon echo signal lower as not all molecules completely re-phase and therefore reducing the macroscopic polarization, which in turn reduces the intensity of photon echo. Another interesting observation is that there is obviously an optimal molecular density, at which the energy of photon echo detected on the output side has a global maximum. This is explained below.
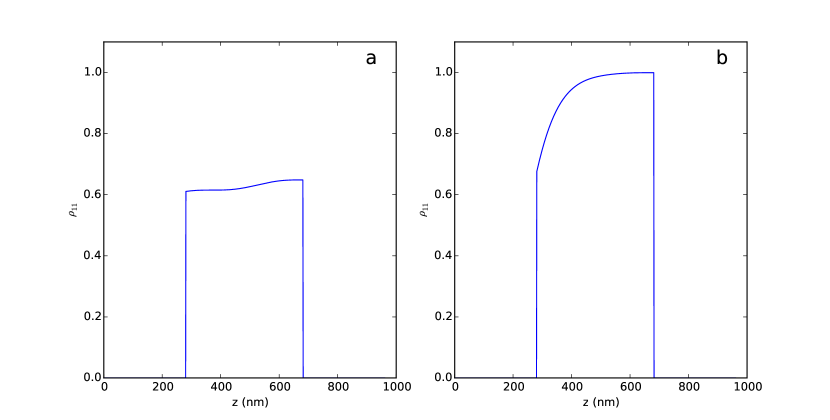
A snapshot of the molecular population as a function of the position is shown in Fig. 3. The pulse travels from left to right, and the ground state population along the ensemble is calculated immediately after the pulse passes through the ensemble. It is seen that, for a higher density, the ground state population approaches as we look farther into the ensemble; the local EM fields are smaller and therefore do not drive the molecules through complete cycle. With this in mind, it makes sense that the echo on the output side drops off at higher densities: more and more of the ensemble (toward the output side) ceases to participate in the echo at higher densities, and the echo from the input side is not able to travel through the ensemble to the output side. Thus, the echo increases with increasing density until reflection increases significantly, disrupting the echo process throughout the ensemble. The input side is somewhat more complicated, as there is obvious interference between incoming and outgoing reflected waves, and the reflected waves from lesser depths interfere with reflected waves from deeper regions of the ensemble. Furthermore, the ensemble is driven by high fields on resonance, leading to higher dispersion and as a result the low group velocity. The latter results in high spatially modulated populations which obviously have a significant effect on the generation of a photon echo Blake and Sukharev (2015).
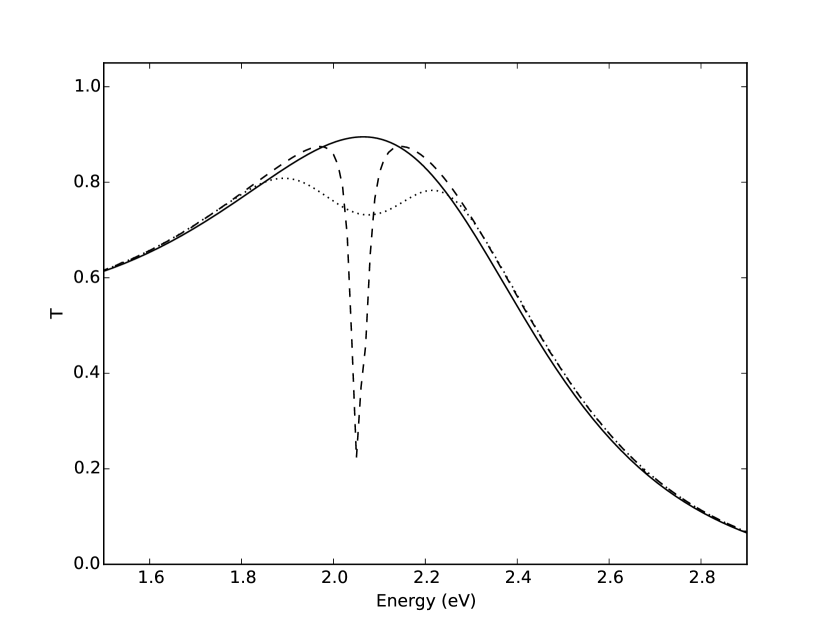
We now turn our attention to an exciton-plasmon system comprising the periodic array of slits and molecules with inhomogeneous broadening as schematically depicted in Fig. 1b. The bare metallic grating exhibits a set of surface plasmon-polariton (SPP) resonances in the form of enhanced transmission and decreased reflection Weiner (2009). For the parameters used we consider the SPP resonance at eV as our working mode. The corresponding spatial distribution of EM field is highly localized near slit edges on both input and output sides of the array Weiner (2011). The resonant molecules (whose transition energy is eV) with no inhomogeneous broadening placed inside a thin layer on top of the array lead to the Rabi splitting of the SPP mode into an upper and lower polariton indicating the strong coupling regime between the SPP field and molecules. However when the molecules exhibit inhomogeneous broadening, the Rabi splitting is still observable but it is significantly broader as one may expect as not all molecules are as strongly coupled compared to the previous case. Nonetheless anticipated broader spectrum one can actually observe significantly higher Rabi splitting. Fig. 4 shows linear transmission spectra for bare slits, the hybrid system with no inhomogeneous broadening, and for the hybrid system whose molecules are inhomogeneously broadened. As seen from Fig. 4, the Rabi splitting for the hybrid system with no inhomogeneous broadening reaches meV whereas that for a hybrid system with inhomogeneous broadening is meV. This is a surprising result. One would have expected to observe the opposite behavior of the Rabi splitting. However the increase of the splitting in systems with distributed energies is not uncommon. Simulations of optics of exciton-plasmon systems comprised diatomic molecules (described using the full machinery of a ro-vibrational structure for each electronic state) and metal reveal similar tendency Sukharev and Charron (2016). The increase of the exciton-plasmon coupling is observed for the molecules described by two potential energy surfaces with the excited one being a dissociative state, i.e. having a continuum of ro-vibrational states. This in part can be explained by the fact that plasmon resonances are usually quite broad and a wide range of molecular transition energies contribute coherently to the coupling. It should also be noted that in our simulations the pure dephasing time is the same for all resulting in the same characteristic decay time for all molecules.
We now apply the --pulse sequence to the array of slits with molecules on top and record the transverse component of the electric field on both the input and output sides of the system for the extended period of time when the echo is observed. We set central transition frequency to the SPP mode at eV. What is seen is very different from the conventional photon echo generated by a 1-D ensemble: the observed echo has a clear double-peaked structure. The frequency-time analysis of the echo signal reveals two peaks as seen in Fig. 6. We proceed to show that the double-peaked structure has its origins in the interaction between the SPP mode and molecules.
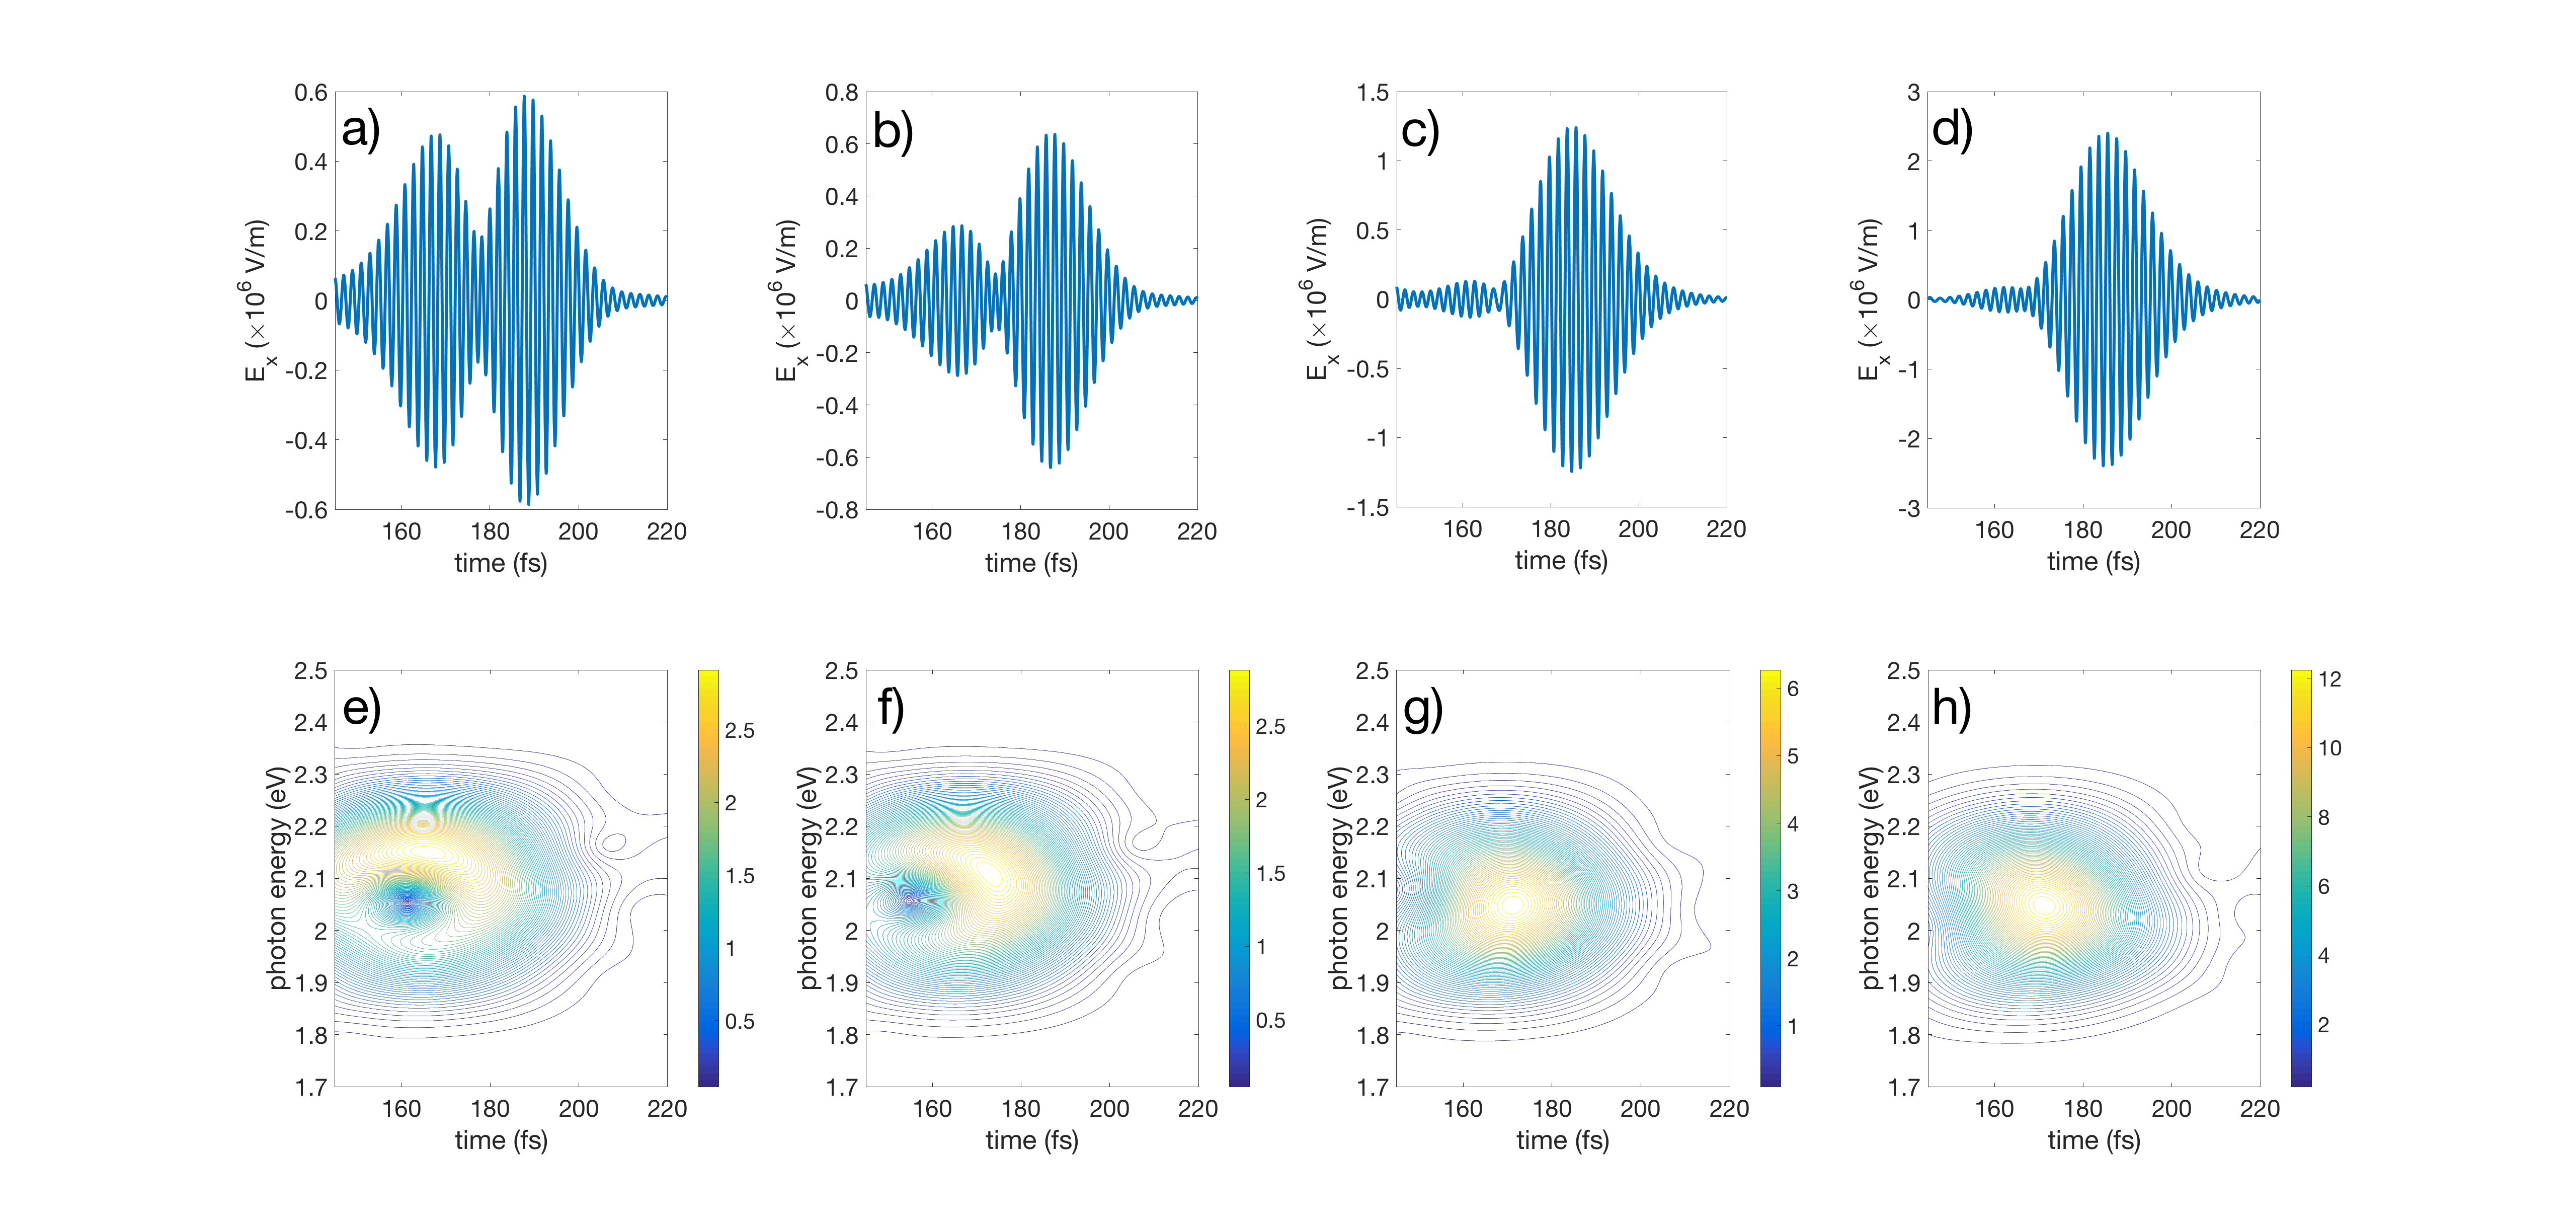
The SPPs are spatially localized to within tens of nanometers of a metal-dielectric interface. In order to ascertain whether our observations of the double peak echo is influenced by surface plasmons, we insert a spacer layer of variable thickness between the molecular film and the slits. As the spacer thickness is increased, the film is moved into progressively weaker plasmon fields leading to a noticeably lower molecule-plasmon coupling. As shown in Fig. 5 (panels (a) - (d)), the double-peaked structure of the echo gradually disappears as the spacer thickness is increased. The amount of coupling between plasmons and molecules depends, among other things, on the strength of the plasmon fields. We therefore expect that if the double-peaked structure of the echo is caused by the strong coupling between plasmons and molecules, a spacer layer of increasing size will reduce the echo to a single peak, which is exactly what is observed. It is interesting to see how sensitive the double-peaked photon echo is to the molecule-plasmon coupling as it nearly vanishes for the spacer with a thickness above nm. Even though plasmon fields are still quite significant at distances of nm above the metal the spectrum of echo is already reduced to a single resonance at . The corresponding Husimi transformations Brixner and Gerber (2001) of the time signals (Fig. 5 (panels (e) - (h))) further reveal a clear contribution from the hybrid states formed due to strong coupling between molecules and the SPP mode (upper and lower polariton states) to the time dynamics of the photon echo. When the molecular layer is placed right on top of the metal array an obvious signature of two polaritonic branches appears in the time-frequency map with maxima near eV and eV (compare those with maxima seen in the linear transmission, dotted line in Fig. 4). As the distance between the molecular layer and metal increases the Rabi splitting gradually decreases eventually leading to a single peak in photon echo as the damping rates begin to surpass the coupling strength between molecules and the SPP mode. We thus conclude that the double peak structure observed in photon echo signals is a unique signature of the upper and lower polaritons that are formed as a result of the strong coupling between SPPs and molecules.
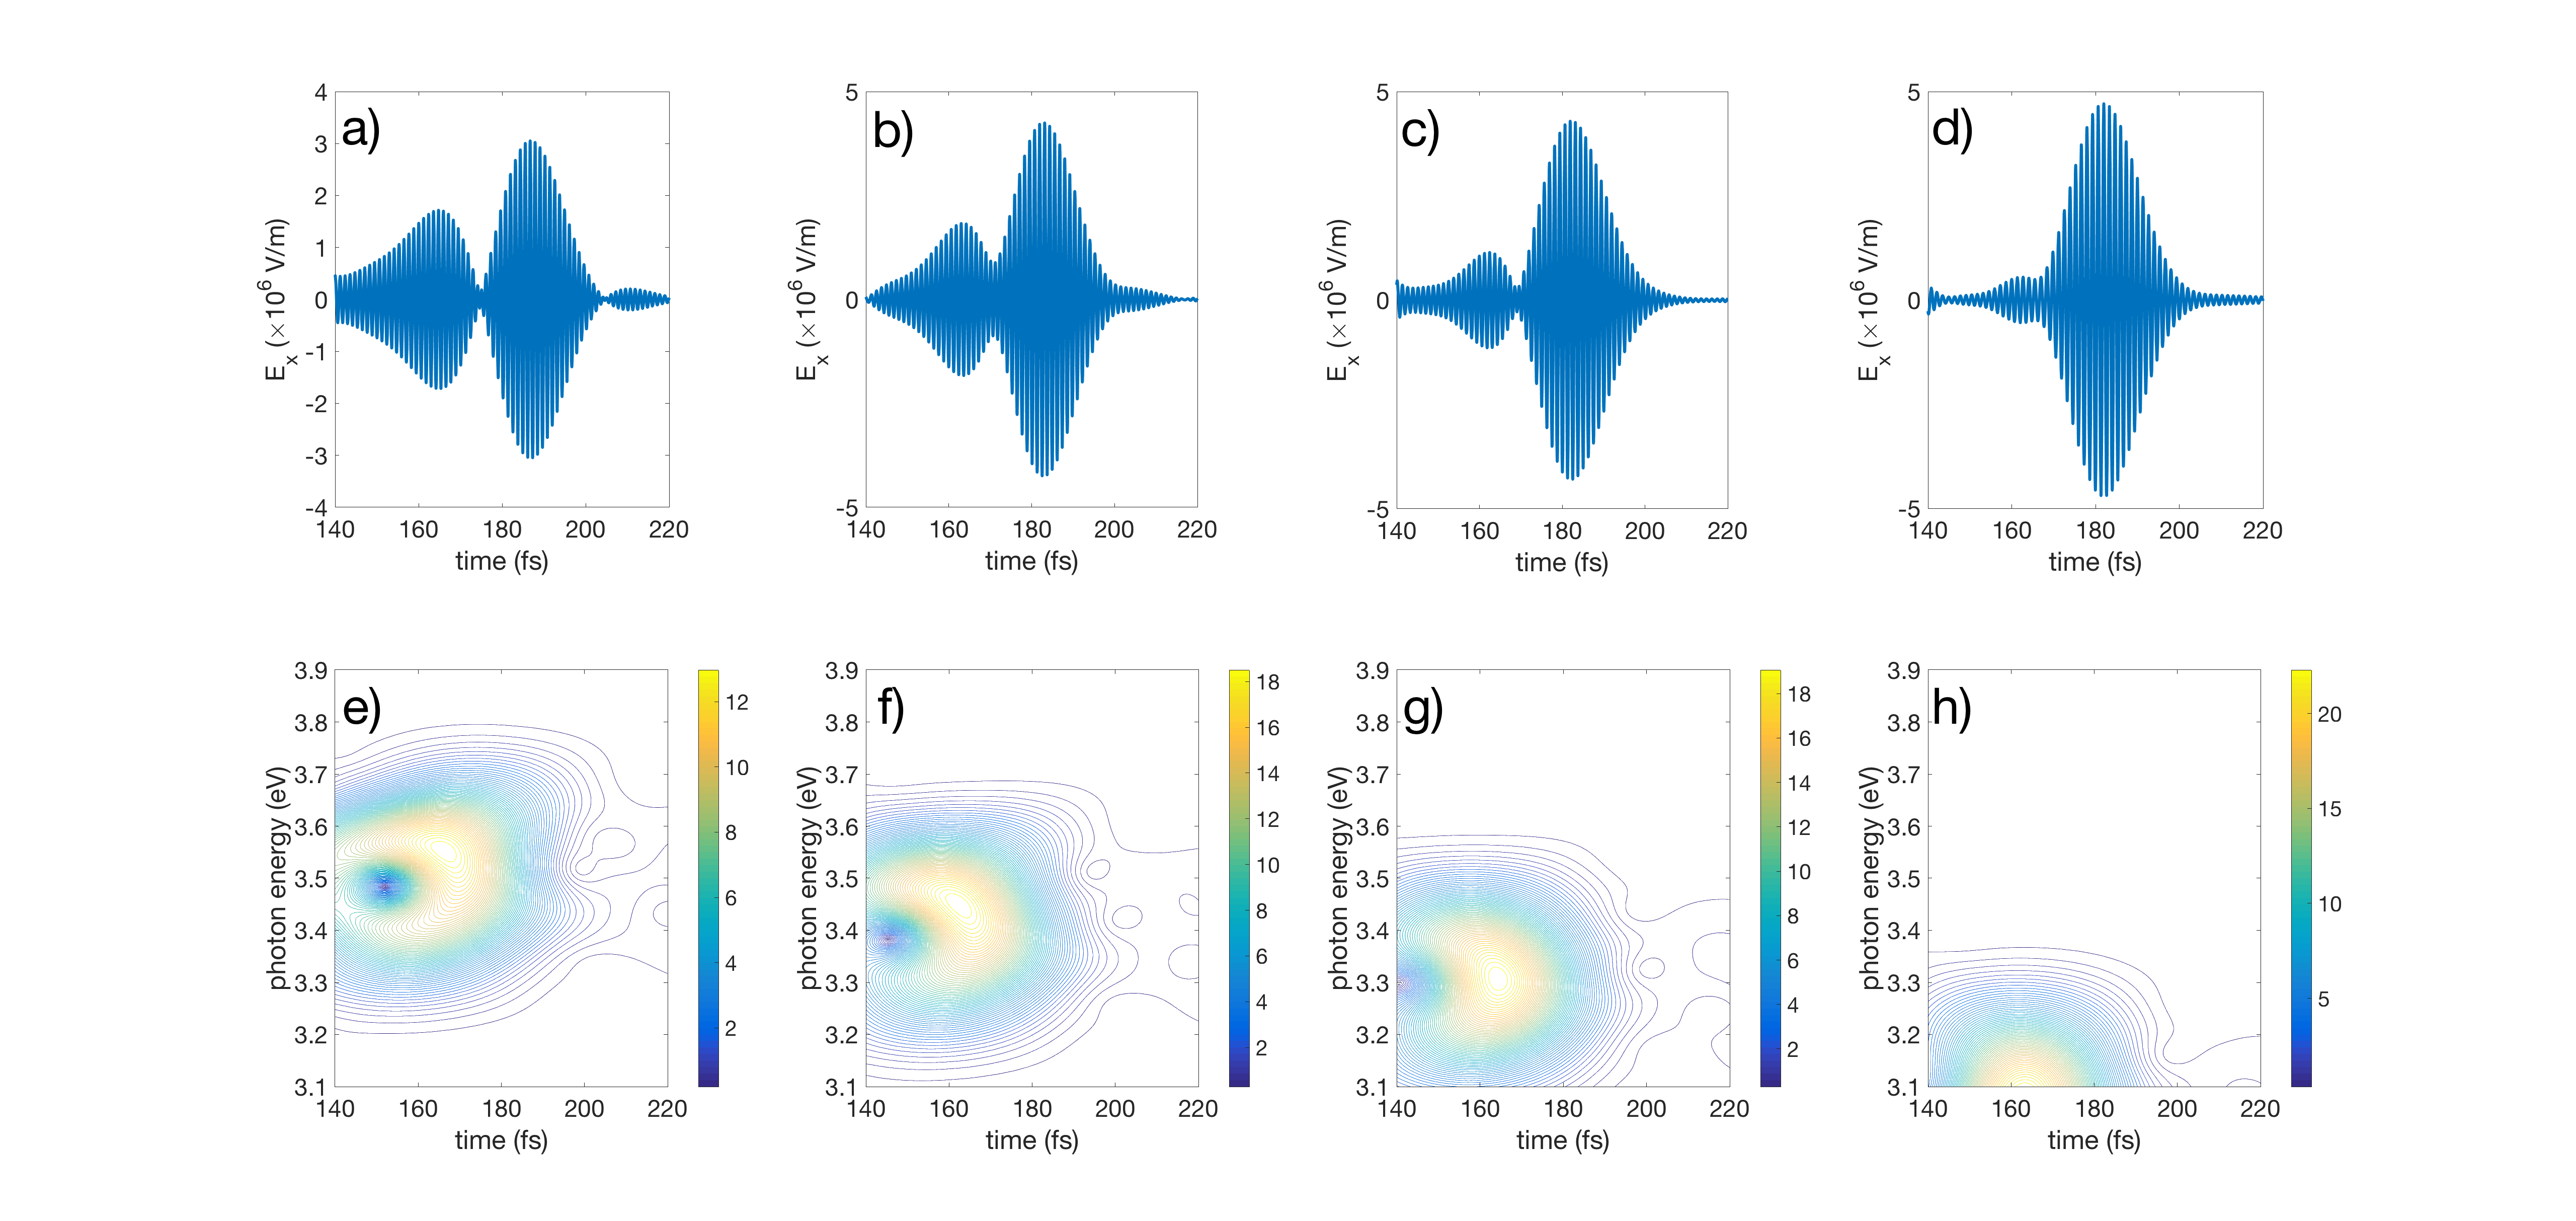
To further confirm that the observed double-peaked photon echo signals are exhibited by exciton-plasmon systems under strong coupling conditions we consider a core-shell nanoparticle with a metal core and a shell comprised molecules with inhomogeneous broadening as schematically depicted in Fig. 1c. The bare silver core has a localized plasmon-polariton resonance at eV as revealed in calculations of the scattering. We then add resonant molecules with the frequency distribution (3) centered at eV with eV. Simulations of the linear response of the core-shell particle show the expected Rabi splitting with hybrid modes at eV and eV. In order to tune the molecule-plasmon coupling we vary the central energy of the distribution of molecules, . By detuning from the plasmon resonance of the metal core we alter the Rabi splitting. It is expected that the double-peaked photon echo will gradually change its form to a single peak. Fig. 6 shows the results of simulations demonstrating the gradual loss of the double-peaked structure in the echo. The smaller Rabi splitting with larger detuning leads to a single dominant frequency in corresponding Husimi maps. We also performed simulations with variable detuning applied to the hybrid slits system, both by adjusting the molecules’ central energy as well as adjusting the slit period (and therefore altering the surface plasmon energy). As expected, the double-peaked structure vanished in each instance as the detuning was increased.
IV Conclusion
We performed rigorous numerical studies of photon echo in exciton-plasmon systems under strong coupling conditions using Maxwell-Bloch formalism. It is shown that photon echoes are highly dependent on materials parameters such as a thickness of molecular layer and molecular density. We have demonstrated that our numerical methods reproduce conventional photon echo signals. We have characterized the echo from a one-dimensional ensemble of interacting molecules in terms of density, ensemble thickness, and the amount of inhomogeneous broadening. It is demonstrated that in one-dimensional systems the echo detected on the output side has an optimal molecular concentration at which the transmitted signal has a maximum energy. To the best of our knowledge it is shown for the first time that applying two-pulse photon echo sequence to exciton-plasmon systems leads to double-peaked echoes. This is demonstrated by different means to be of plasmonic origin, with the double-peaked structure resulting from the hybrid modes of the system (upper and lower polaritons). It is also shown that the unique signature of upper and lower polaritons in photon echoes is highly sensitive to exciton-plasmon coupling making it a great tool for ultrafast optical probes of nanomaterials to further scrutinize fundamentals of light-matter interaction.
V Acknowledgments
This work is supported by the Air Force Office of Scientific Research under grant No. FA9550-15-1-0189. The authors are also grateful to the financial support provided by Binational Science Foundation under grant No. 2014113.
References
- Zayats et al. (2005) A. V. Zayats, I. I. Smolyaninov, and A. A. Maradudin, Phys Rep 408, 131 (2005).
- Stockman (2011) M. I. Stockman, Opt. Express 19, 22029 (2011).
- Halas et al. (2011) N. J. Halas, S. Lal, W.-S. Chang, S. Link, and P. Nordlander, Chemical Reviews 111, 3913 (2011), pMID: 21542636.
- Chikkaraddy et al. (2016) R. Chikkaraddy, B. de Nijs, F. Benz, S. J. Barrow, O. A. Scherman, E. Rosta, A. Demetriadou, P. Fox, O. Hess, and J. J. Baumberg, Nature 535, 127 (2016).
- Torma and Barnes (2015) P. Torma and W. L. Barnes, Rep. Prog. Phys. 78, 013901 (2015).
- Murray and Barnes (2007) W. A. Murray and W. L. Barnes, Adv. Mater. 19, 3771 (2007).
- Kauranen and Zayats (2012) M. Kauranen and A. V. Zayats, Nat Photon 6, 737 (2012).
- Butet et al. (2015) J. Butet, P.-F. Brevet, and O. J. F. Martin, ACS Nano 9, 10545 (2015).
- Mukamel (1999) S. Mukamel, Principles of Nonlinear Optical Spectroscopy (Oxford University Press, New York, 1999).
- Vasa et al. (2013) P. Vasa, W. Wang, R. Pomraenke, M. Lammers, M. Maiuri, C. Manzoni, G. Cerullo, and C. Lienau, Nat Photon 7, 128 (2013).
- Sukharev et al. (2013) M. Sukharev, T. Seideman, R. J. Gordon, A. Salomon, and Y. Prior, ACS Nano 8, 807 (2013).
- Metzger et al. (2016) B. Metzger, M. Hentschel, and H. Giessen, ACS Photonics 3, 1336 (2016).
- Allen and Eberly (1975) L. Allen and J. H. Eberly, Optical Resonance and Two-Level Atoms (John Wiley & Sons, Inc., 1975).
- Abella et al. (1966) I. D. Abella, N. A. Kurnit, and S. R. Hartmann, Phys. Rev. 141, 391 (1966).
- Mandel and Wolf (1995) L. Mandel and E. Wolf, Optical Coherence and Quantum Optics (Cambridge University Press, 1995).
- de Boeij et al. (1998) W. P. de Boeij, M. S. Pshenichnikov, and D. A. Wiersma, Annu. Rev. Phys. Chem. 49, 99 (1998).
- Cho et al. (1992) M. Cho, N. F. Scherer, G. R. Fleming, and S. Mukamel, J. Chem. Phys. 96, 5618 (1992).
- Langer et al. (2014) L. Langer, S. V., Poltavtsev, Y. A., M. Salewski, Y. D. R., G. Karczewski, T. Wojtowicz, A. A., and M. Bayer, Nat Photon 8, 851 (2014).
- Taflove and Hagness (2005) A. Taflove and S. Hagness, Computational Electrodynamics: The Finite-Difference Time-Domain Method (Artech House, 2005).
- Gray and Kupka (2003) S. K. Gray and T. Kupka, Phys. Rev. B 68, 045415 (2003).
- Puthumpally-Joseph et al. (2015) R. Puthumpally-Joseph, O. Atabek, M. Sukharev, and E. Charron, Phys. Rev. A 91, 043835 (2015).
- Puthumpally-Joseph et al. (2014) R. Puthumpally-Joseph, M. Sukharev, O. Atabek, and E. Charron, Phys. Rev. Lett. 113, 163603 (2014).
- Blake and Sukharev (2015) A. Blake and M. Sukharev, Phys. Rev. B 92, 035433 (2015).
- Weiner (2009) J. Weiner, Rep. Prog. Phys. 72, 064401 (2009).
- Weiner (2011) J. Weiner, Opt. Express 19, 16139 (2011).
- Sukharev and Charron (2016) M. Sukharev and E. Charron, “to be published,” (2016).
- Brixner and Gerber (2001) T. Brixner and G. Gerber, Opt. Lett. 26, 557 (2001).