Young star clusters in circumnuclear starburst rings
Abstract
We analyse the cluster luminosity functions (CLFs) of the youngest star clusters in three galaxies exhibiting prominent circumnuclear starburst rings. We focus specifically on NGC 1512 and NGC 6951, for which we have access to H data that allow us to unambiguously identify the youngest sample clusters. To place our results on a firm statistical footing, we first explore in detail a number of important technical issues affecting the process from converting the observational data into the spectral-energy distributions of the objects in our final catalogues. The CLFs of the young clusters in both galaxies exhibit approximate power-law behaviour down to the 90 per cent observational completeness limits, thus showing that star cluster formation in the violent environments of starburst rings appears to proceed similarly as that elsewhere in the local Universe. We discuss this result in the context of the density of the interstellar medium in our starburst-ring galaxies.
keywords:
globular clusters: general – galaxies: evolution – galaxies: individual (NGC 1512, NGC 6951) – galaxies: star clusters: general – galaxies: star formation1 Introduction
Over the past decades, the prevalence in starburst environments of luminous, young massive star clusters (YMCs) has become well established, both based on ground-based data (e.g., van den Bergh 1971; Schweizer 1982; Arp & Sandage 1985; Lutz 1991) and by exploiting high-resolution Hubble Space Telescope (HST) observations (e.g., Holtzman et al. 1992; de Grijs et al. 2003a,b, 2013a; Whitmore 2003; Larsen et al. 2006). The majority of extragalactic starburst environments host unresolved clusters, access to whose individual member stars is, however, impossible with current instrumentation. Consequently, the star cluster luminosity (mass) function (CLF, CMF), i.e., the number of clusters per unit cluster luminosity (mass), is among the most important diagnostics for our understanding of the evolution of star cluster systems as a whole. The CLFs of young star cluster systems have been studied extensively in interacting and starburst galaxies, and they are often compared with their counterparts in the discs of ‘normal’, quiescent galaxies.
Until approximately a decade ago, a fierce debate about the evolution of CLFs and CMFs raged in the astrophysics community (for a review, see de Grijs & Parmentier 2007). One school of thought (e.g., Whitmore & Schweizer 1995; Whitmore et al. 1999; Zhang & Fall 1999; Mengel et al. 2005) advocated that the CLF (CMF) at the time of cluster formation was a power-law function of the form or, equivalently, , where and are the clusters’ -band luminosities and masses, respectively, and (e.g., de Grijs et al. 2003b; Portegies Zwart et al. 2010; Fall & Chandar 2012). This initial power-law CLF (CMF) would gradually transform into a Gaussian or ‘lognormal’ distribution, to eventually resemble the near-universal distributions of the old globular cluster systems found throughout the local Universe (e.g., Fall & Zhang 2001; Fall 2006). The competing scenario started from an initially lognormal CLF (CMF), which would retain its lognormal shape over the entire evolutionary time-scale of a given star cluster system, although the peak luminosity (mass) would gradually be reduced (e.g., Vesperini 1998; Anders et al. 2007).
This debate was predominantly fuelled by a number of potentially unphysical assumptions underlying the main study supporting the initial power-law CMF arguments at that time (Fall & Zhang 2001). In addition, the observational data available around the turn of the century were insufficiently deep to allow one to reach unequivocally below the postulated peak of the CLF in what became the poster-child star cluster system in this field, the Antennae system (NGC 4038/9; e.g., Anders et al. 2007). In the mean time, deeper observations of both the Antennae system (e.g., Whitmore et al. 2010) as well as of the young cluster systems in both the Small and Large Magellanic Clouds (e.g., de Grijs & Goodwin 2008; de Grijs et al. 2013b) have clearly shown that the CLFs of the youngest (disc) star cluster systems are well-described by power-law shapes down to the lowest luminosities attainable, corresponding to masses well below M⊙. Theoretical efforts (e.g., Fall 2006) have also adequately and convincingly addressed the earlier criticism levelled at Fall & Zhang’s (2001) seminal study. The community’s commonly accepted point of view has thus become that star clusters, in both galactic discs and starburst regions, usually form following a power-law CMF (CLF), which is gradually transformed into a lognormal-like distribution owing to both internal and external perturbations and two-body relaxation processes, which operate on billion-year time-scales.
In this context, our recent discovery (de Grijs & Anders 2012) of a lognormal-like CMF for star clusters as young as Myr in the circumnuclear starburst ring of the spiral galaxy NGC 7742 came as a surprise. Neither theoretical predictions nor prior observational evidence indicated that initial power-law CLFs/CMFs could transform into lognormal distributions on time-scales as short as a few yr, yet that was what we inferred to have occurred. This led us to propose that the physical conditions governing star cluster evolution and possibly also their formation may be different in the dense, highly complex starburst-ring environments from those both in quiescent galaxy discs and in interacting and starburst galaxies.
However, few studies to date have specifically addressed the CLFs pertaining to circumnuclear starburst rings or their evolutionary scenarios. Yet, many galaxies feature remarkable circumnuclear starburst rings, which are associated with high star-formation rates. Two scenarios have been proposed to explain their formation: (i) as a consequence of bar-driven gas inflow and dynamical resonances in the bar, inflowing gas as well as stars accumulate in a ring which connects the two inner Lindblad resonances at the ends of the bars (e.g., Romero-Gómez et al. 2006; Athanassoula et al. 2010; Athanassoula 2012); or (ii) they may have formed owing to the centrifugal barrier encountered by gas migrating to the inner regions of the galaxy (Kim et al. 2012). The high-density environments in these rings make them ideal locations to harbour large numbers of YMCs, much more so than in galaxy centres (e.g., Miocchi et al. 2006). Indeed, based on high-resolution HST images, numerous young (a few yr-old) and intermediate-age (a few Gyr-old) star clusters have been uncovered in these structures (e.g., Barth et al. 1995; Maoz et al. 1996, 2001; Ho 1997; Buta et al. 2000; de Grijs et al. 2003a,b; Mazzuca et al. 2008; de Grijs & Anders 2012; Hsieh et al. 2012; van der Laan et al. 2013, henceforth vdL13).
In this paper, we explore the CLFs of the youngest star clusters in three well-observed galaxies with large amounts of ancillary data which exhibit prominent circumnuclear starburst rings. We start by focussing on the starburst-ring cluster population in the spiral galaxy NGC 6951, an SAB(rs)bc galaxy with a well-known and well-studied ring: see Barth et al. (1995) for an early HST-based cluster study, as well as the review by vdL13 (and references therein). We will also examine in detail the CLF of the clusters in the remarkably luminous circumnuclear starburst ring in NGC 1512. NGC 1512 is an SB(r)a galaxy at a distance of 10 Mpc (e.g., Maoz et al. 2001). We first explore in detail a number of technical issues: see Section 2. In Section 3, we address the shapes of the CLFs in our two main sample galaxies. Finally, we place the results obtained for the individual ring populations in the broader context of the field of star cluster evolution in Section 5.
2 From observational data to star cluster photometry
2.1 Data sets
Our perusal of the HST Data Archive showed that NGC 6951 has been observed by a number of investigators using a range of cameras. Table 1 (top) includes details of the full data set acquired from the Hubble Legacy Archive (HLA).111http://hla.stsci.edu/hlaview.html The imaging observations, already processed and calibrated by the HLA pipeline reduction software, span the entire optical/near-infrared wavelength range, from the bluest F330W filter observed with the Advanced Camera for Surveys (ACS)–High-Resolution Camera (HRC) to the near-infrared F160W filter obtained with the Near-Infrared Camera and Multi-Object Spectrometer’s (NICMOS) Camera 2 (NIC2).
| Filter | Proposal ID/PI | Camera | Exposure time (s) | PHOTFLAM |
| NGC 6951 | ||||
| F330W () | GO-9379/Schmitt | ACS/HRC | 1200 | |
| F547M () | GO-5419/Sargent | WFPC2/PC | 300 | |
| F606W () | GO-8597/Regan | WFPC2/PC | 560 | |
| F658N (H) | GO-9788/Ho | ACS/WFC | 700 | |
| F814W () | GO-9788/Ho | ACS/WFC | 120 | |
| F110W () | GO-7331/Stiavelli | NICMOS/NIC2 | 256 | |
| F160W () | GO-7330/Mulchaey | NICMOS/NIC2 | 320 | |
| NGC 1512 | ||||
| F336W () | GO-13364/Calzetti | WFC3 | 1107 | |
| F438W () | GO-13364/Calzetti | WFC3 | 953 | |
| F555W () | GO-13364/Calzetti | WFC3 | 1131 | |
| F658N (H) | GO-6738/Filippenko | WFPC2/PC | 5200 | |
| F814W () | GO-13364/Calzetti | WFC3 | 977 | |
We rotated, aligned and cropped the combined images in all passbands to a common orientation, pixel scale and field of view, respectively, using standard iraf/stsdas routines222The Image Reduction and Analysis Facility (iraf) is distributed by the National Optical Astronomy Observatories, which is operated by the Association of Universities for Research in Astronomy, Inc., under cooperative agreement with the U.S. National Science Foundation. stsdas, the Space Telescope Science Data Analysis System, contains tasks complementary to the existing iraf tasks. We used Version 3.6 (November 2006) for the data reduction performed in this paper. and adopting the ACS/WFC footprint as our basis. The final image set consists of images in seven filters with a pixel size of 0.05 arcsec, covering 999976 pixels in right ascencion (R.A.) and declination (Dec), and centred on the galaxy centre (assumed to coincide with the nuclear star cluster), R.A. (J2000) = 20h 37m 14.13s, Dec (J2000) = 66∘ 06′ 20.2′′. This centre position is, to within a fraction of an arcsecond, identical to that listed in the Two Micron All-Sky Survey (2MASS; Skrutskie et al. 2006).
We also selected pre-processed, high-resolution images of NGC 1512 from the HLA, ensuring that they covered the longest possible wavelength range. The most suitable data-set combination was observed with the Wide Field Camera 3 (WFC3; pixel size arcsec) in the F336W, F438W, F555W and F814W filters: see Table 1 (bottom). All four exposures shared the same orientation, pixel scale and field of view, covering the entire galaxy. Since the circumnuclear starburst ring represents a small fraction of the full image, for convenience we trimmed the ring portion in the original exposures to yield a final standard science image of pixels2. In addition, we also explored the usefulness of the WFC3 ultraviolet F275W image, but this exposure was discarded because of large photometric uncertainties.
2.2 Object selection

Following the same steps as in our previously established image reduction and analysis protocol (e.g., de Grijs et al. 2013a; Li et al. 2015; and references therein), we ran our custom-written idl333The Interactive Data Language (idl) is licensed by Research Systems Inc., of Boulder, CO, USA. source-finding routines on two ‘middle-wavelength’ images for each galaxy. For NGC 6951 we adopted the F547M and F814W observations, while for NGC 1512 we used the F438W and F555W images. We selected these middle-wavelength images to ensure that their use would not directly lead to rejection of extremely blue or extremely red objects from our initial sample of cluster candidates. We based our assessment of the number of detections as a function of detection threshold (for details, see also Barker et al. 2008), in units of the root-mean-square scatter in the background level, . For a given filter, the latter was determined based on the standard deviation of the ‘counts’ in an empty section of the science frames, located as far away from the galaxy as possible. For both galaxies we adopted minimum detection limits of 3 in all four middle-wavelength images. This choice returned 1873 and 1129 detections for NGC 6951 in the F547M and F814W images, respectively. For the NGC 1512 data, application of the 3 critical thresholds in the F438W and F555W bands resulted in catalogues containing 2304 and 1834 detections, respectively.
This first selection step served, in essence, to remove false detections owing to Poissonian shot noise from our initial catalogues; the resulting catalogues contain both genuine objects and small-scale background fluctuations, thus necessitating additional selection steps. As an example, in Fig. 1 (top panels) we show for the NGC 6951 observations the number of detections as a function of threshold in both the F547M and F814W images. Adopting a detection threshold of 3, based on a change in slope of the detection efficiency (i.e., the number of detections as a function of minimum background level), ensures that we are conservative in excluding real objects, so that this first selection step will not unduly bias the final source counts.
The subsequent cross correlation of source positions, initially allowing a positional mismatch of only 1 pixel in both spatial dimensions, led to final source counts of 104 and 960 for NGC 6951 and NGC 1512, respectively.444Two of us (R. d. G. and S. J. for NGC 6951; C. M. and R. d. G. for NGC 1512) analysed the HST archive data independently; we both found a very similar number of genuine cluster candidates. As we will show in Section 2.3, releasing this constraint, adjusted to 2- and 3-pixel positional mismatches in both directions, does not have a significant effect on the number of objects retained for further analysis. The reduction from the initial numbers of detections in the individual passbands to our final source catalogues is significant. However, as we will show below by using detection threshold based on the intensity variations in the ring regions instead of those in empty fields, the steps we have followed to obtain our final samples are well-understood and justifiable: each step approached the selection from a rather conservative angle so as not to remove genuine objects inadvertently. This meant that our initial source lists were dominated by small-scale background fluctuations rather than real clusters. The final cross-correlation step (and, for NGC 1512, the minimum size selection applied below) is the most important procedure in whittling down the initial, fluctuation-dominated catalogue of detections to genuine object lists.
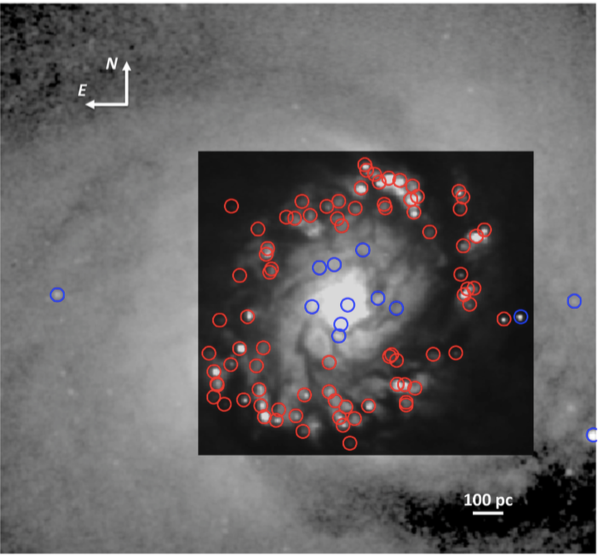
Of the 104 cluster candidates in NGC 6951, 82 are associated with the circumnuclear starburst ring, which we broadly define as the dominant feature at radii between 35 and 105 pixels, or pc if we adopt an absolute distance modulus of mag (23.7 Mpc).555This value represents the geometric mean of 11 individual distance measurements, 10 of which are based on distance estimates to supernova SN 2000E (NASA Extragalactic Database; http://ned.ipac.caltech.edu/cgi-bin/nDistance?name=NGC+6951). The median distance modulus to NGC 6951 based on these measurements is mag. At this distance, 1 arcsec pc, while 1 ACS/WFC pixel pc. Figure 2 (top) displays the galaxy’s inner pixels2 ( arcsec2) as observed through the F606W filter, with the star clusters that form part of the starburst ring and those not associated with the ring indicated by red and blue circles, respectively. We opted to show the F606W image instead of the F547M image on which our cluster selection is partially based, because the former is much deeper and shows more structure while covering a very similar wavelength range; the latter image is additionally affected by significant numbers of cosmic-ray hits (e.g., examine in detail fig. 4 of vdL13; residuals of their cosmic-ray removal appear as white areas without background noise), none of which coincide with any of our genuine star cluster candidates, however.
Because of the galaxy’s closer proximity, for NGC 1512 we proceeded by first applying a cluster size cut in order to remove stellar (point) sources. To do so, we made use of a standard Gauss-fitting routine in idl, applied to all selected sources, to determine their sizes, . To define the minimum size for extended cluster candidates, we generated artificial HST point-spread functions (PSFs) using the TinyTim software package (Krist & Hook 1997). The best Gaussian width resulting from this analysis was pixels. Note that the HST PSF is not a two-dimensional (2D) Gaussian function. However, by consistently applying computationally robust Gaussian fits to our 2D object data,666Note that while realistic profiles can be fitted to the brighter objects, their complexity renders such fits to the fainter objects unstable but Gaussian fits turn out to be much more computationally robust and stable. Therefore, we opted to apply Gaussian fits to all candidate clusters so as to gain insights into their relative size distributions. we can nevertheless distinguish very well the more extended objects from their unresolved counterparts. A side effect of this approach is that some real objects will be returned with Gaussian sizes that are smaller than the TinyTim , simply because of the differences between the actual HST PSF and a smooth 2D Gaussian distribution.
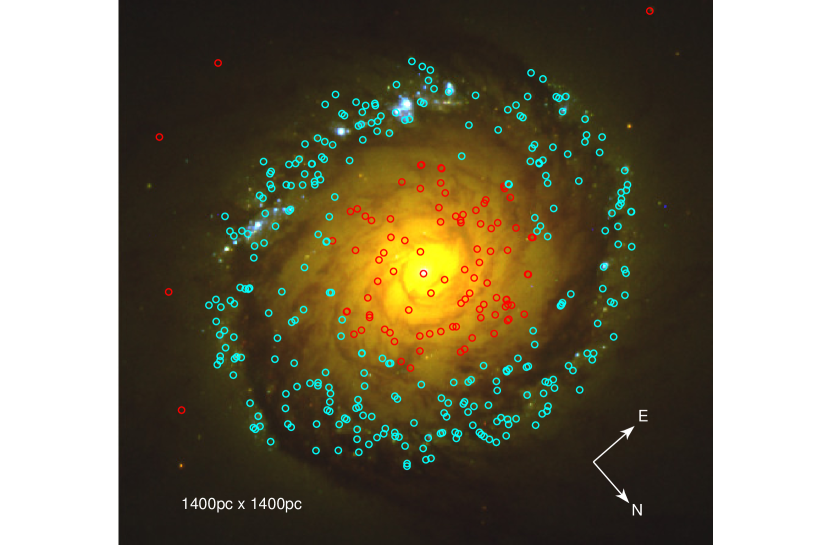
We hence adopted a conservative size-cut criterion so as not to reject some marginally extended sources (i.e., pixels = 2.74 pc). Note that 1 WFC3 pixel corresponds to roughly 2.4 pc in linear size, for an absolute distance modulus to NGC 1512 of mag (13.0 Mpc).777This value represents the geometric mean of 10 individual distance measurements compiled in the NASA Extragalactic Database (http://ned.ipac.caltech.edu). The median distance modulus to NGC 1512 based on these measurements is mag. We verified that our size cut, combined with our adopted minimum brightness levels, is adequate to avoid individual stars, assuming a typical stellar full width at half maximum of pixels ( pixel) for WFC3/UVIS images (e.g., Calzetti et al. 2015; based on the actual HST profiles instead of Gaussian fits). In fact, an increase of our adopted size cut will exclude most low-mass clusters. This step left us with a sample of 469 cluster candidates (as discussed for NGC 6951 in Section 2.4, we also removed several sources with extremely large Gaussian widths, 43 pc). Figure 2 (bottom) shows the spatial distribution of our resulting NGC 1512 cluster sample overplotted on a colour composite image. The cluster candidates identified by the cyan circles are located in the NGC 1512 circumnuclear starburst ring, which we delineated by an annular region containing the main, conspicuous features at radii between 104 and 260 pixels ( pc), assuming an inclination angle of 30 (Koribalski & López-Sánchez 2009).
Careful visual inspection of the original images and a large subset of the initial detections thus obtained reveals that our initial catalogue is dominated by background fluctuations rather than genuine clusters. The cross-correlation step is highly efficient in removing the majority of these background fluctuations from our final source list; as such, we consider this a crucial selection step. To back up this statement quantitatively, we also pursued an alternative approach: instead of defining our detections in terms of their flux above a threshold based on the Poissonian noise characteristics of empty areas in our science frames, for both galaxies we determined the standard deviations across the starburst ring in all intermediate-band filters used for the source detections. These standard deviations include the effects of shot noise and fluctuations in the background flux. For NGC 6951, again applying a threshold, this selection yields 1119 and 436 detections in the F547M and F814W images, respectively. The corresponding numbers for NGC 1512, also using a threshold, are 553 and 327 objects in the F438W and F555W filters, respectively. Note that these detections still include small-scale background fluctuations, so that application of a cross-correlation step is just as crucial in this case. The latter step yields final object samples containing 33 and 289 objects in NGC 6951 and NGC 1512, respectively; the minimum size criterion adopted for NGC 1512 further reduces this latter number to 153 ring clusters. These final numbers of clusters are indeed smaller than the numbers in our object catalogues resulting from application of detection thresholds based on the noise statistics in empty field regions. Indeed, the objects included in those latter catalogues but not in the catalogues resulting from the use of detection thresholds based on the intensity fluctuations in the galaxies’ ring regions represent the fainter complement of the CLFs. Their numbers are consistent with an approximately homologous cluster population obeying power-law CLFs characterized by .
2.3 Our source selection criteria: effects of biases
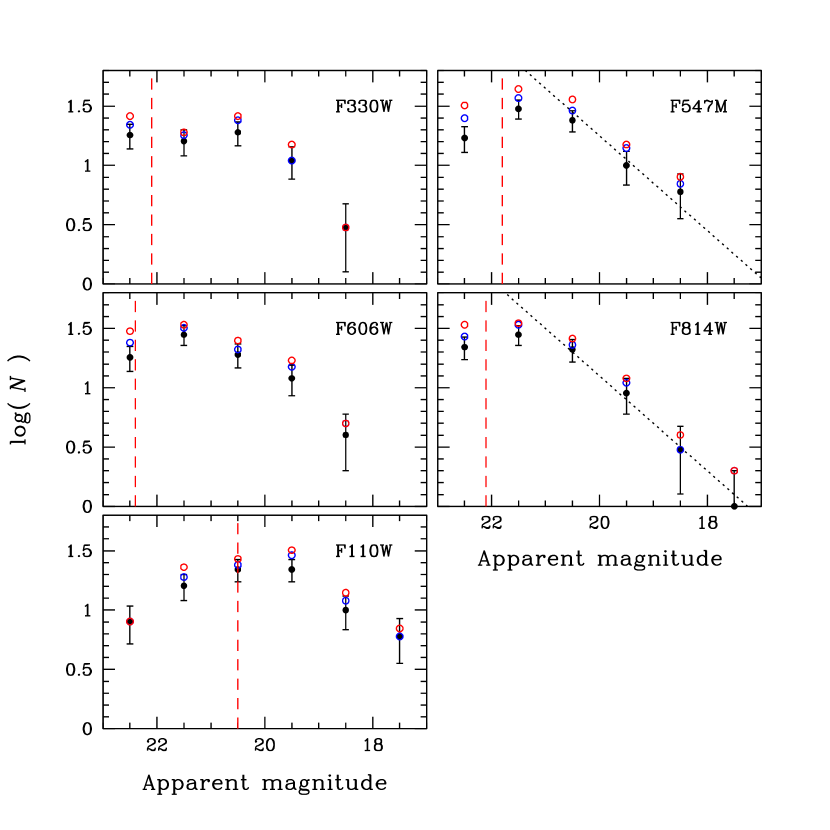
We will now address the effects of our source selection procedures to provide sound evidence of the physical reality of the objects considered here. In Fig. 1 (bottom panels) we show the luminosity functions888For the construction of the luminosity functions in Fig. 1, we adopted fixed source aperture radii of 3 pixels and sky annuli of 6–8 pixels, instead of the adaptive aperture sizes we advocate in Section 2.4 for the more advanced analysis of our genuine cluster sample. In de Grijs et al. (2013a) we showed that this approach leads to statistically identical results for large numbers of sample objects, such as those considered here. of the detections in NGC 6951 in both the F547M and F814W images, prior to any positional cross matching. We show the number of detections based on adoption of thresholds of 3 and 6 (open circles and solid bullets, respectively) in our full fields of view – and using detection thresholds based on the noise statistics in ‘empty’ regions on the science frames – as well as the detections in the galaxy’s starburst ring area only (blue asterisks), i.e., for pc or pixels. The luminosity functions are composed of detections with maximum photometric uncertainties of 0.5 mag in the relevant filter. However, releasing this constraint does not cause any appreciable differences, except in the lowest-luminosity bins in both filters, i.e., well below our completeness limits.
Next, we consider the effects of the different selection criteria used to reach our final sample of genuine cluster candidates. We take the NGC 1512 cluster population as an example and refer to Fig. 3 for illustrative purposes, where we show the NGC 1512 CLFs derived from our F438W photometry. The error bars represent the Poissonian uncertainties. The initial, single-passband luminosity function, using fixed source apertures of 6 WFC3 pixels and background annuli spanning from 7 to 10 pixels in radii, is shown using red triangles. In our next step, we cross-correlated the detections in the F438W and F555W filters, yielding the CLF represented by green squares; the apertures used for the corresponding photometry are identical to those used for the initial luminosity function. The blue diamonds trace the NGC 1512 CLF after our application of a minimum size criterion in terms of the observational , again using the same photometric apertures. Finally, the black solid bullets show the final CLF of genuine clusters, but using variable instead of fixed apertures (for justification, see Section 2.4). It is clear that the most significant change in the (C)LF shape occurs when adjusting the aperture sizes used for the photometry. The blue and black CLFs correspond to the same cluster sample, yet their shapes are significantly different, in the sense that the number of bright objects is much larger in the variable-aperture CLF than in the fixed-aperture CLF. The reverse applies to the fainter objects.
We suggest that this effect is caused by the extended nature of our sample objects (see Section 2.4). This is supported by a comparison of the initial F547M and F814W luminosity functions of all detections shown in the bottom panels of Fig. 1 with the right-hand panels of Fig. 4. We will discuss Fig. 4 in more detail below, but for the present purpose it is sufficient to realize that the CLF slopes between Fig. 1 and Fig. 4 are, in essence, the same for luminosities well away from the 90 per cent completeness limits in both filters (see Section 2.5 below). We remind the reader that we did not apply a minimum size criterion to the NGC 6951 cluster sample because of the galaxy’s location at a much greater distance than that of NGC 1512. This fortuitously renders the majority of our NGC 6951 sample clusters point sources for all practical purposes.
Finally, we explore the impact, if any, of having selected objects found within 1 pixel in both and between our two middle-wavelength images. We consider the cross correlation of the detections in two filters to generate our initial master list an essential step to ensure that we are eventually dealing with genuine clusters rather than noise peaks or other artefacts. However, although the completeness levels in both filters are reasonably close, one could envision a situation in which a cluster’s SED is sufficiently steep over this narrow wavelength range that it may be detectable in one filter but fall below the detection threshold in the other. Since such conditions would apply to luminosities close to the detection threshold in either filter, this might have a measurable effect on the resulting CLFs close to the canonical completeness limits.
Instead of allowing only a 1-pixel mismatch in both spatial dimensions, we repeated our sample selection for both NGC 6951 and NGC 1512 adopting both 2- and 3-pixel mismatches (i.e., maximum spatial differences of 2.8 pixels and 4.2 pixels, respectively), given that at the faintest levels close to the detection limit stochastic dither might affect an object’s centre position. Compared with our 104 NGC 6951 sample objects based on the 1-pixel criterion, the 2- and 3-pixel selection criteria resulted in samples of 131 and 158 candidate clusters. The resulting CLFs are shown in Fig. 4. Clearly, the more relaxed cross-identification criteria did not lead to significantly different CLFs.
Similarly, we reran our source selection routines on the NGC 1512 data using the more relaxed 2- and 3-pixel selection restrictions to see how the resulting shapes of the CLFs depend on the selection criteria. Our - and -pixel selection criteria resulted in samples of 1228 and 1440 cluster candidates, compared with 960 real objects if we adopt the original, -pixel selection criterion. Again, the more relaxed cross-identication criteria did not cause signicant deviations from the originally derived CLFs.
2.4 Cluster photometry
We next obtained the broad-band SEDs for all 104 clusters identified in the NGC 6951 central galaxy field using two different approaches. For comparison with previous results, we first determined the cluster photometry based on 3-pixel source apertures (based on inspection of the radial profiles of isolated point sources in our ACS/WFC science images), adjusted by aperture corrections calculated on the basis of TinyTim model PSFs. We adopted sky annuli with inner and outer radii of 6 and 8 pixels, respectively, for local background subtraction, a choice based on inspection of the radial intensity distributions of a large subsample of our target clusters. We generated artificial PSFs for each filter/camera combination to determine the specific aperture corrections required. (Note that this approach implicitly assumes that all of our sample clusters are genuine point sources.) The resulting photometric database is included in Table 2. Throughout this paper and in all relevant figures, we have adopted the STmag system, whose photometric zero points (zpt) are defined by the HST image header keywords photflam (see Table 1) and photzpt = , through zpt = log(photflam) + photzpt.
The aperture corrections required for 3-pixel source radii and 6–8-pixel sky annuli (for 0.05 arcsec pixels) are and mag, respectively, for the F330W, F547M, F606W, F814W, F110W and F160W photometry. The uncertainties associated with our photometry, determined using standard aperture-photometry routines implemented in our IDL package, are owing to the necessarily limited number of photons detected (i.e., they represent the photon noise in the background annuli owing to the discrete nature of the incoming photons) and to errors in determining the sky region’s contribution (particularly in the case of non-constant background levels). In essence, therefore, the uncertainties reflect the signal-to-noise ratios of and fluctuations in the background annuli. The flux levels in our background annuli correspond to the median fluxes, which is an adequate representation of the background contribution even in highly variable regions such as circumnuclear starburst rings. Using the detectors’ ‘gain’ parameters listed in the image headers, the standard aperture photometry routine determined the uncertainties in units of the photo-electrons triggered by incident photons, while also taking into account the detectors’ read-out noise characteristics, also provided as image header parameters.
| # | XIDb | ||||||||
|---|---|---|---|---|---|---|---|---|---|
| (arcsec) | (arcsec) | (mag) | (mag) | (mag) | (mag) | (mag) | (mag) | ||
| 1 | 0.07 | 4.41 | |||||||
| 2 | 7.82 | 4.15 | |||||||
| 3 | 1.43 | 4.03 | |||||||
| 4 | 0.15 | 3.84 | 53 | ||||||
| 5 | 2.28 | 3.68 | 52 | ||||||
| # | ||||||
|---|---|---|---|---|---|---|
| (mag) | (mag) | (mag) | (mag) | (mag) | (mag) | |
| 1 | ||||||
| 2 | ||||||
| 3 | ||||||
| 4 | ||||||
| 5 | ||||||
Small-aperture photometry combined with aperture corrections is applied increasingly often (e.g., Harris et al. 2004; Annibali et al. 2011; vdL13), even for extended objects. However, while this approach is well-established for point-source photometry, it breaks down for extended objects (see, e.g., de Grijs et al. 2013a), unless one fully models the radial profiles (Anders et al. 2006). To show this, we additionally adopted an adaptive aperture-photometry approach (de Grijs & Anders 2012; de Grijs et al. 2013a; Li et al. 2015), scaling the source apertures and sky annuli based on a measure of the objects’ sizes (i.e., their Gaussian sizes, ). We used a source aperture radius of , and and for the inner and outer sky annuli, respectively. The exact scaling was determined by checking the stellar growth curves, to identify where the objects’ radial profiles vanish into the background noise. We have confirmed that the choice of our source radii was conservative enough so as not to miss any genuine source flux, and we also verified that our selected sky annuli were not significantly contaminated by neighbouring sources. We adjusted the source apertures and sky annuli where necessary to minimize the effects of crowding. The resulting photometric database is included in Table 3. As before, the uncertainties associated with our object photometry reflect the signal-to-noise ratios of and fluctuations in the background annuli.

Figure 5 offers a comparison of our aperture-corrected PSF photometry with that resulting from the adaptive aperture-photometry approach in all medium- and broad-band filters used here. The panels in the top and middle rows show the detailed comparisons. It is clear that while a significant subset of our sample clusters are well matched using either approach, a large minority of sources are fainter in the fixed-aperture photometry. The panels in the bottom row of Fig. 5 show that these objects tend to be significantly more extended than the canonical PSF size. We visually checked these objects’ radial profiles in relation to the aperture sizes adopted. We are confident that our choice of variable aperture size has resulted in inclusion of all of the objects’ photometry. Indeed, this result underscores our reluctance to rely on aperture-corrected PSF photometry since that approach ignores the radial intensity distributions of more extended sources and, hence, often causes one to underestimate the relevant source fluxes.

In Fig. 6a,b, we show the NGC 6951 clusters’ Gaussian sizes, , as a function of their F547M magnitudes. It is clear that while the brighter objects tend to exhibit larger sizes,999If—as expected for well-sampled clusters—light traces mass, this is a direct consequence of the mass–size relation. the fainter objects are significantly more compact. We attempted to excise star cluster complexes from our final sample on the basis of the objects’ profile fits. The size of the ACS/WFC PSF is pc at the distance of NGC 6951. Of order half a dozen objects with ’s often well in excess of 10 pixels ( pc) were discarded. The detection of a small number of objects with very large sizes was mostly caused by crowding in the images; we carefully checked that our final sample objects are not severely affected by crowding. Figure 6 thus shows that we have been successful at distinguishing genuine objects from spurious detections.
Figure 7 shows a comparison of our aperture-corrected PSF photometry with that of vdL13 in the F330W, F547M, F606W and F814W filters. Of the 55 objects identified by vdL13, we found 38 unambiguous matches in our database; an additional seven objects could not be uniquely cross-identified, either because one of our objects appeared to coincide with two objects in the vdL13 database (three cases) or vice versa. In addition, vdL13’s objects 3, 9, 18, 20, 21, 24 and 35 do not have counterparts in our database. vdL13 obtained their photometry based on a combination of SExtractor and daophot routines. Specifically, they decided to use source apertures of 2 pixels (0.09 arcsec) and sky annuli between 6 and 16 pixels, in essence to avoid the effects of crowding. On the whole – and within the observational uncertainties and given the cluster size-dependent systematics introduced by the use of fixed apertures combined with aperture corrections (Fig. 5) – our PSF photometry is indeed consistent with the vdL13 fixed-aperture photometry, confirming our analysis in Fig. 5.

Next, we obtained photometric measurements for our 469 NGC 1512 sample clusters in the targeted central galaxy field (in both the circumnuclear starburst ring and the main galactic disk region) to acquire their SEDs using our adaptive aperture-photometry method. Table 4 includes the photometric measurements for the 275 sample clusters with good-quality measurements, which we defined as objects with observational uncertainties mag in at least three filters. Figure 6c shows the clusters’ Gaussian sizes (expressed in units of pixels) as a function of their F555W magnitudes. The trend seen for the NGC 1512 clusters mimicks that seen for the NGC 6951 cluster sample.
| # | R.A. (J2000) | Dec. (J2000) | ||||||
|---|---|---|---|---|---|---|---|---|
| (hh mm ss.ss) | (mag) | (mag) | (mag) | (mag) | ||||
| 1 | 60.97376 | 04 03 53.70 | 43.34726 | 43 20 50.14 | ||||
| 2 | 60.97379 | 04 03 53.71 | 43.34728 | 43 20 50.22 | ||||
| 3 | 60.97404 | 04 03 53.76 | 43.34718 | 43 20 49.85 | ||||
| 4 | 60.97411 | 04 03 53.78 | 43.34715 | 43 20 49.76 | ||||
| 5 | 60.97289 | 04 03 53.49 | 43.34803 | 43 20 52.92 | ||||
2.5 Completeness checks
We next proceeded to characterize the observational completeness levels. For our completeness tests of the NGC 6951 data, we selected the area of pixels2 centred on the galaxy’s centre shown in Fig. 2 (top). This region is dominated by the circumnuclear starburst ring ( pixels). For a given filter, we first added 500 artificial extended sources (all assigned the same magnitude and of the same size, pixels) with random (, ) coordinates to our science frames, carefully avoiding positions too close to the science images’ edges. The positions of 163 of these artificial sources coincided with the area occupied by the starburst ring. Note that the majority of our sample clusters have sizes somewhat smaller than the size adopted for our artificial sources (see Fig. 6). This implies that the resulting completeness levels are conservative (everything else being equal, these completeness limits are somewhat brighter than expected for the ‘average’ object). The completeness levels for objects with a smaller Gaussian (point-source-like) size of pixel are 0.4–0.7 mag fainter from the bluest to the reddest filters in our collection.
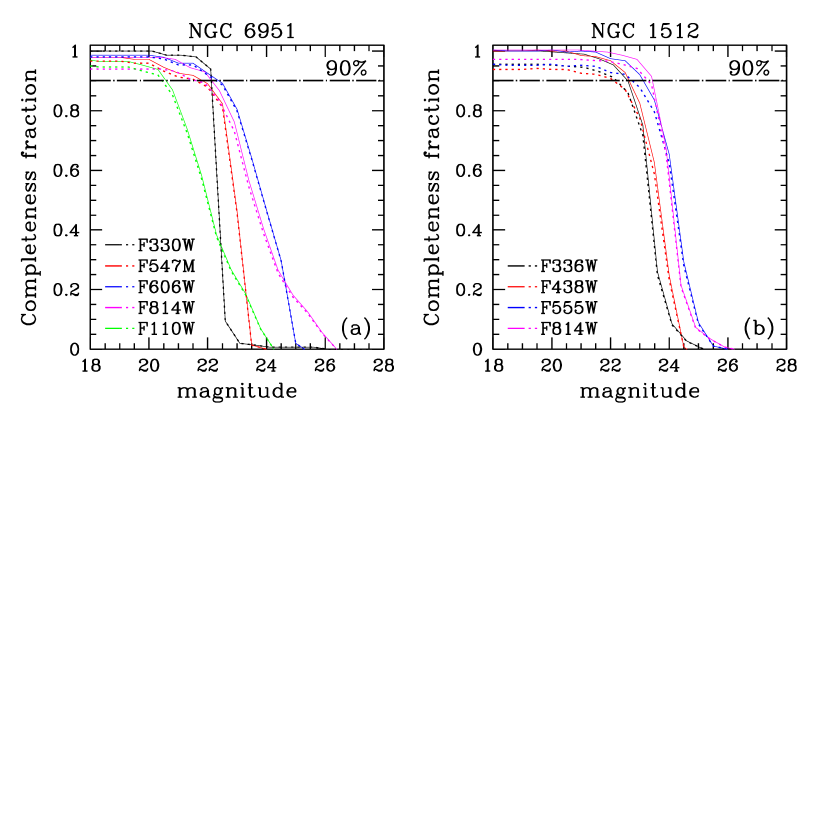
In retrieving the input artificial clusters, we first checked whether we could detect them in both the science and template images in both filters (which helped us to evaluate how many artificial sources could be recovered after correction for blends and chance superpositions), using the same source discovery routine as applied to detect the real objects. Of the 500 input sources, 476 could be retrieved from images containing only artificial sources and no background flux prior to any completeness analysis; 4–9 blends with real objects were detected, depending on the filter considered, all of which were found in the region occupied by the ring. We subsequently applied our cross-identification technique to the artificial cluster lists in both middle-wavelength filters used for the object selection to further consolidate their authenticity. This step led to rejection of those clusters that were too faint in one of the input filters to meet our minimum detection limit. We subsequently obtained photometry for the resulting cluster catalogue. Figure 8 displays the completeness levels of our science frames as a function of input magnitude for all filters used. We additionally ran completeness tests for the ring region only, following exactly the same approach as for the full frames.
In the F330W, F547M, F606W, F814W and F110W filters, the 90 per cent completeness limits are mag, mag, mag, mag and mag. Note that the 90 per cent completeness limits occur at –1.0 mag brighter magnitudes than the conventionally used 50 per cent completeness limits, in all filters. We point out that our selection limit for clusters in NGC 6951 is ultimately determined by the completeness levels in the F547M filter, the filter we used for our source detection characterized by the lowest completeness. This is driven by our data reduction procedures: we first determined the positions of all genuine objects and subsequently obtained the photometry at those positions in all filters, irrespective of completeness level. The resulting photometric databases (Tables 2 and 3) show that this results in reliable photometric determinations in all filters to well below the canonical 90 per cent levels for any of the other filters (i.e., other than F547M). Finally, the 90 per cent completeness level in the F547M filter corresponds to an absolute magnitude of mag, which underscores that our sample consists of genuine star clusters only: individual blue supergiants do not reach these brightnesses (e.g., Maoz et al. 2001).
To obtain the corresponding completeness levels pertaining to our central NGC 1512 images (covering pixels2), we proceeded similarly as for NGC 6951, using 306 artificial sources as completeness benchmark in each filter and for each step in magnitude. The artificial cluster size adopted was based on the size distribution of our genuine cluster sample, which exhibits a significant peak at sizes pixels (see, e.g., Fig. 6, which also shows that the larger sources tend to be brighter and, hence, will not affect our completeness analysis significantly): we thus assigned the median pixels ( pc) to our artificial clusters. Of the 306 input sources, 294 could be retrieved from images containing only artificial sources and no background flux prior to any completeness analysis; 8–11 blends with real objects were detected, depending on the filter considered, all of which were found in the region occupied by the ring.
The resulting completeness levels of our science frames are shown in Fig. 8 as a function of input magnitude, for all filters. We found that for the F336W, F438W, F555W and F814W filters, the corresponding 90 per cent completeness limits are mag, mag, mag and mag. The more commonly used 50 per cent completeness limits occur at brightness levels that are fainter by 0.6 mag, 1.0 mag, 1.0 mag and 0.7 mag, respectively. From Fig. 8, we can see that the F336W filter is our limiting filter for the NGC 1512 analysis. However, since our object selection is based on source detection and cross-identification in the F438W and F555W filters, our sample is intrinsically limited by the least sensitive of the latter filters. Our NGC 1512 cluster sample is therefore a ‘-band detection limited’ sample. Its 90 per cent completeness level corresponds to an absolute magnitude of mag. Although individual blue supergiants are sufficiently luminous to be seen at these brightness levels, their numbers are expected to be too small to affect the statistical results obtained in this paper (e.g., Maoz et al. 2001; Chandar et al. 2010).
3 Cluster luminosity functions
The CLFs are among the most important diagnostics considered in discussing the evolution of statistically well-sampled star cluster populations in external galaxies. It is well-established that shortly after the time of cluster formation, both the CLF and its corresponding CMF are expected to resemble power-law distributions, i.e., and , where and usually attain values close to 2 (cf. de Grijs et al. 2003b; Portegies Zwart et al. 2010; Fall & Chandar 2012). As discussed in Section 1, over time these populations lose their lower-mass and, hence, lower-luminosity members, thus resulting in rounded distributions that are often approximated by a lognormal distribution (e.g., Fall & Zhang 2001; Fall 2006). In this evolutionary context, it is important to define CLFs (and CMFs) that cover only narrow age ranges in order to avoid complications owing to poorly quantified evolutionary effects.
We are fortunate in also having access to HST observations of both NGC 6951 and NGC 1512 which were obtained through narrow-band filters centred on the H emission line. We obtained ACS/WFC observations of the NGC 6951 starburst ring from the HLA which were observed through the F658N filter. The H emission line, at a rest-frame wavelength of nm, appears only for very young stellar populations, with ages up to approximately 10 Myr. Selection of a subsample of our target clusters based on excess H emission (with respect to the flux level expected from the continuum; see below) will thus ensure that we only include the youngest clusters. We thus proceeded to obtain our sample clusters’ H photometry adopting exactly the same source positions and aperture radii as used for the medium- and broad-band filters in our observational arsenal, followed by standard flux calibration using the photflam HST image header keyword (see Table 1, top).
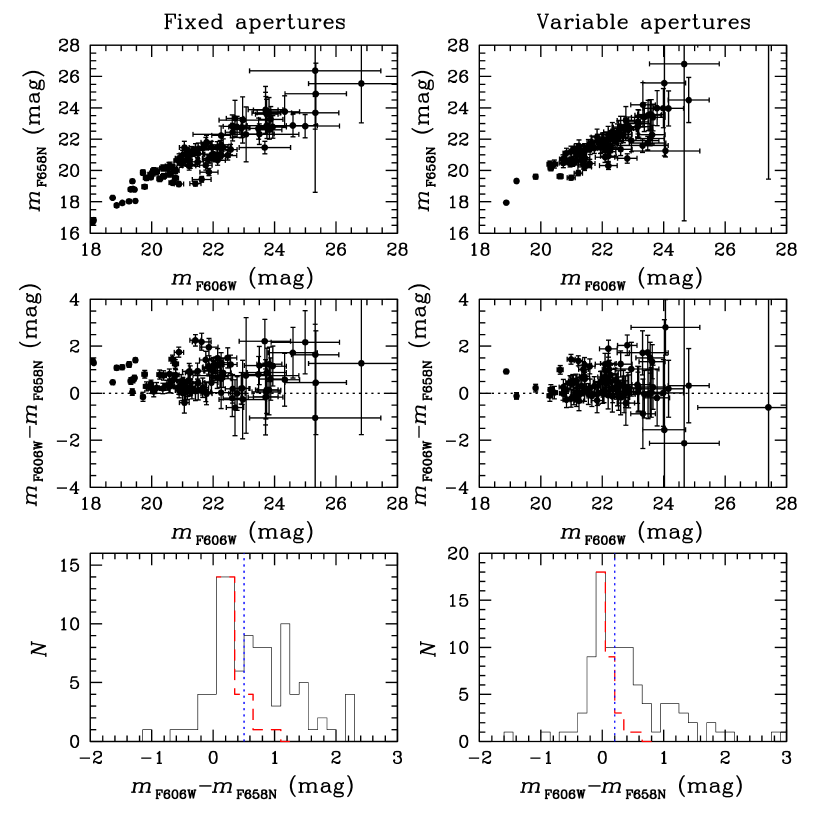
Figure 9 forms the basis of our selection of H-excess objects. We provide the results for both (left) aperture-corrected fixed-aperture and (right) size-dependent variable-aperture photometry. The panels in the top and middle rows show direct comparisons of the emission-line (F658N) and continuum (F606W) fluxes of our sample sources. The panels in the bottom row show the distributions of the differences in magnitude between the F606W and F658N fluxes. Objects without excess H emission (i.e., clusters older than approximately 10 Myr) are expected to reside in the histograms’ peaks centred on a zero magnitude difference. In order to allow us to select H-excess objects, we mirrored the left-hand sides of the histograms, as shown by the red dashed lines. The blue dotted lines show the minimum magnitude differences adopted for selection of H-excess objects, i.e., mag for our fixed-aperture photometry and mag for our variable apertures. For NGC 6951, these choices led to ‘H-excess samples’ containing 55 and 49 objects, respectively. In the following, we will also show the results for additional, more strictly defined H-excess samples characterized by mag (for both sets of photometric measurements) in order to underscore the reliability of our results. The latter samples are, however, more significantly affected by small-number statistics.
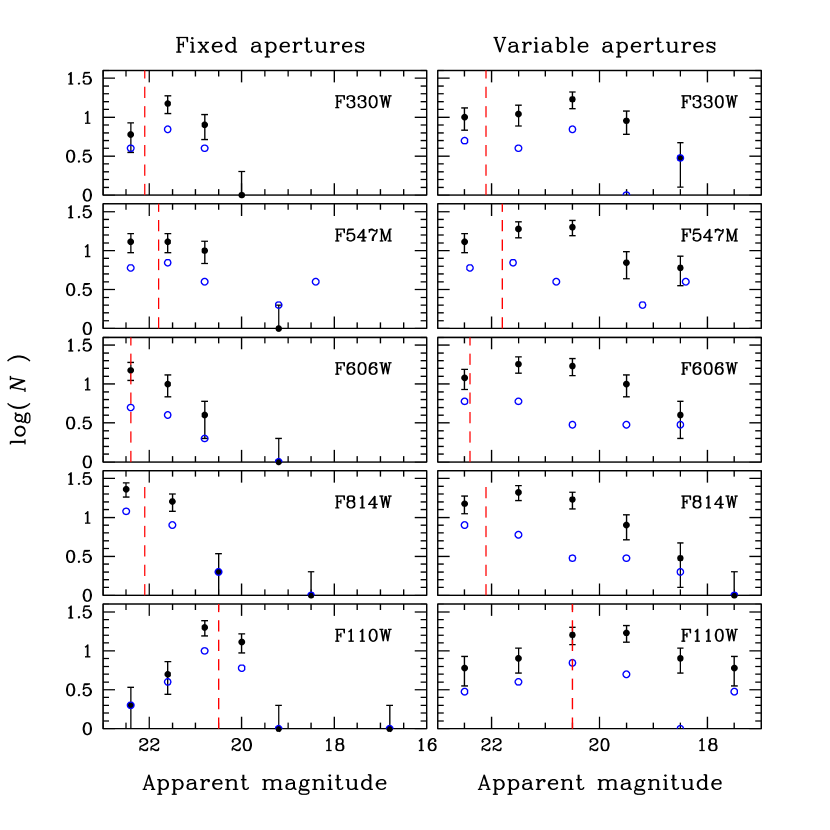
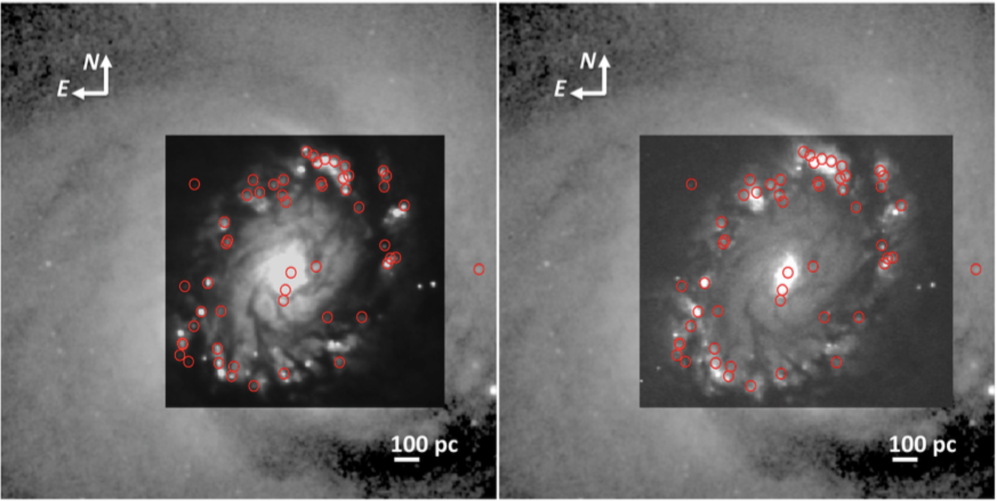
Figure 11 shows the H-excess objects in NGC 6951 overplotted on both a continuum image observed through the F606W filter and the H (F658N) image. The resulting CLFs for the young, H-excess objects in NGC 6951 are shown in Fig. 10. We have also indicated the completeness levels in all panels. Note that, strictly speaking, our samples are F547M-limited samples; the completeness limits for the other filters in our arsenal are for illustrative purposes only. The youngest clusters, characterized by an H excess, are found both in a broad swath due north of the galactic centre and in a concentration in the southwest of the starburst ring. vdL13 analysed the age distribution of their 55 sample clusters in the NGC 6951 starburst ring and tentatively suggested that the clusters may be younger in both the southwestern and northeastern quadrants. Careful comparison with their data tables, as well as inspection of their Fig. 7, shows that our results are in broad agreement with theirs.
We proceeded similarly for NGC 1512. We compared the galaxy’s cluster photometry in the F555W broad-band filter with that in the adjacent F658N narrow-band filter. Again, objects without excess H emission are expected to reside in the histogram’s peak centred on the smallest magnitude difference. (The peak of the magnitude differences is slightly offset from zero magnitude, because the F658N filter curve does not overlap with the F555W filter curve, so that the slope of the SED becomes important.) The minimum magnitude difference adopted for selection of H-excess objects is mag. We also imposed a brightness limit of mag. These choices led to ‘H-excess samples’ containing 127 objects.
Before proceeding, we note one potential caveat which may have affected our selection of ‘H-excess’ clusters using their F555W magnitudes. At low redshifts, observations of cluster populations through this filter may be contaminated by the presence of [OIII]4959,5007Å line emission, which could be stronger than the objects’ H emission (e.g., Reines et al. 2010, their fig. 11; see also Anders & Fritze–v. Alvensleben 2003). For very young clusters, i.e., for ages below 3–4 Myr, the contribution of [OIII]-emitting gas could be –1.5 mag brighter than that from the stars alone, decreasing to a brightening of 1.0 mag at 4 Myr 0.3 mag at 6 Myr, and 0.15 mag at 8 Myr (Reines et al. 2010). If our NGC 1512 cluster sample is indeed affected by significant excess [OIII] flux in their F555W magnitudes, such clusters may not show a significant deviation from the 1:1 relation between their F658N and F555W magnitudes. If so, our H-selected sample is conservative, implying that our method may have missed a fraction of the youngest clusters. (We also note that, at the youngest ages (3–4 Myr), these clusters will most likely still be embedded in their natal dust cocoons, so that they may not have passed our selection criteria, which required sufficient signal-to-noise ratios in the blue F438W images.)
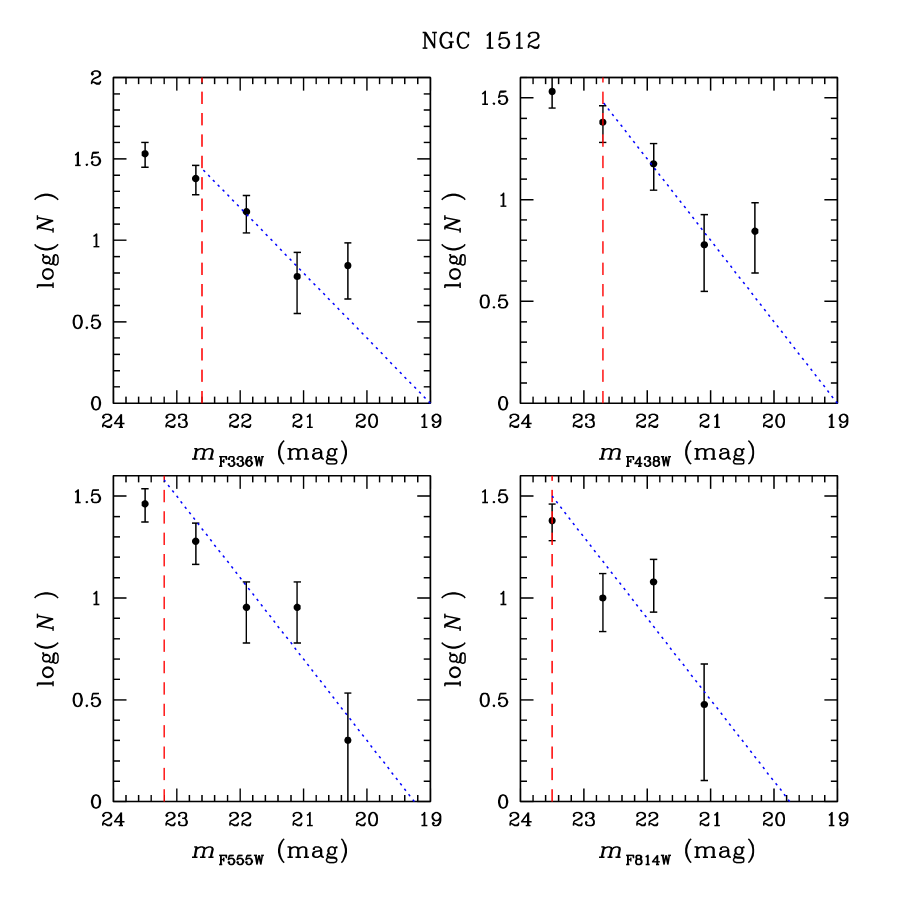
In Fig. 12 we show the filter-dependent CLFs for the cluster population detected in the NGC 1512 ring, including their Poissonian uncertainties (shown as error bars). The red vertical solid lines denote the respective 90 per cent completeness limits based on our artificial-cluster tests. We also show the expected, canonical power-law CLF slopes (blue dotted lines). Although the CLFs are affected to some extent by small-number statistics at brighter magnitudes, it is clear that – within the observational scatter – the canonical slope holds well down to the 90 per cent completeness limits for all passbands. In view of the caveat pointed out above, it appears that contamination by [OIII] emission has not significantly affected the CLF shapes of the H-selected clusters compared with the full CLFs prior to any selection. Of course, the impact of [OIII] contamination may also have affected our sample selection equally across the observational magnitude range, which is impossible to ascertain based on our current data set. Nevertheless, if an intrinsic turnover in the youngest cluster sample were somehow masked by excess [OII] emission, this would imply a selection function in the F555W filter that appears to be at odd with the selection functions in the other filters considered here.
The situation for NGC 6951 is more complex, however. As discussed above, the galaxy’s full CLFs in the F547M and F814W filters are well represented by power laws which hold down to magnitudes just above the 90 per cent completeness limits, where the CLFs appear to turn over. Since they occur close to the detection limit, we do not consider these apparent turnovers statistically significant. However, the H-selected NGC 6951 CLFs shown in Fig. 10 start to turn over at significantly brighter magnitudes (by up to 1 mag) than the completeness limits in any of the filters considered. The H-selected CLFs are composed of a subset of the full CLFs, i.e., the former contain only those clusters that exhibit clear H emission and which are thus most likely younger than approximately 10 Myr.
In a follow-up paper we will determine the clusters’ ages and masses based on their full SEDs, which will allow us to investigate this CLF behaviour close to the completeness limits in more detail, and specifically in terms of the CMF. Here, we suggest that the apparent turnovers, occurring at up to 1 mag above the 90 per cent completeness curves, are most likely caused by the H magnitude cut. Fainter young clusters, i.e., those located close to the completeness limits, will also be fainter in terms of their H emission. Given the photometric uncertainties associated with the fainter sources, H selection will have predominantly removed fainter cluster from the young subsample.
4 Overall context
We have presented a careful analysis of the CLFs of the starburst ring clusters in NGC 6951 and NGC 1512. One of our main aims of the analysis in this paper was to assess whether the dense and often violent conditions in circumnuclear starburst rings may give rise to differences in either the distribution of cluster luminosities at the time of their formation, i.e., the initial CLF, or characteristic disruption time-scale. To get an initial handle on answering this question, we compiled a database of galaxies exhibiting circumnuclear starburst rings and which were observed with the HST in at least four passbands. This latter criterion is necessary for successful SED analysis to derive the clusters’ age and mass distributions (e.g., Anders et al. 2004; de Grijs et al. 2013a). Among these, one of our own earlier studies dealt with the starburst ring galaxy NGC 3310 (de Grijs et al. 2003a,b).
Maoz et al. (2001) used HST/WFPC2 observations to explore the galaxy-wide CLFs in the starburst-ring galaxies NGC 1512 and NGC 5248. Although they do not distinguish between clusters located in the starburst rings compared with those in the main galaxy discs, their cluster samples are dominated by starburst ring clusters. They separate their samples into 15 Myr-old and older clusters and show that for both galaxies the young and older extinction-corrected -band CLFs exhibit similar shapes, within the statistical uncertainties, in essence following power-law distributions to the lowest luminosities attainable. (A downturn of the CLFs in the lowest-luminosity bin is apparent for NGC 5248, although the importance of selection effects on these results is unclear since those authors only focussed on the bright end of the CLF.)
The -band CLFs of the 10 Myr-old cluster system in the circumnuclear ring of the peculiar galaxy ESO 565-G11, as well as that of the inner-ring CLF in NGC 3081 appear to be genuine power-law functions with slopes to down to the completeness limits (Buta et al. 1999, 2000a, 2004). Similarly, Barth et al. (1995) showed that the NGC 1097 ring CLF exhibits a steep rise down to at least the estimated observational completeness limit, mag. These slopes are reminiscent of the slope derived by de Grijs et al. (2003a) for the young, Myr-old starburst-ring clusters in NGC 3310, for mag. However, these luminosities are well above the observational selection limit, while the NGC 3310 CLF is not shown graphically by these authors. They do point out, however, that a comparison of their broad-band CLF with that based on H data is inconclusive.
The star clusters in the circumnuclear rings of NGC 1326 and NGC 4314 pose interesting conundrums. Buta et al. (2000b) find that the apparent -band CLF of the NGC 1326 ring clusters, which are mostly thought to be younger than Myr, is well approximated by a power law down to the observations’ generic completeness level of mag. However, once they apply a correction for internal extinction, the resulting CLF exhibits a significant deviation from the canonical power-law distribution for mag, i.e., at significantly brighter luminosities than the applicable completeness limit. Unfortunately, the authors do not comment on this CLF behaviour, which could imply that extinction might mask a CLF turnover rather than cause it. Benedict et al. (2002) find an almost identical result for the NGC 4314 ring clusters.
It thus appears that even in the high-density, high-shear circumnuclear starburst rings in the local Universe the shape of the initial CLF resembles that of a power law with the canonical slope . The high-density environments in these rings make them ideal locations to harbour large numbers of YMCs, much more so than in galaxy centres (e.g., Miocchi et al. 2006). In turn, this might make these environments conducive to significant cluster-to-cluster interactions. This could possibly lead to enhanced cluster disruption (e.g., de Grijs & Anders 2012; and references therein) or cluster mergers (e.g., McMillan et al. 2007; Saitoh et al. 2011; Fujii et al. 2012), depending on their relative bulk velocities. Both processes facilitate the preferential removal of lower-mass clusters from a cluster population, although we point out that for cluster mergers to be a viable mechanism, the resulting mass distribution must somehow remain scale-free. It is unclear at the present time whether this constraint is met in practice. More importantly, however, the direct collision rate is expected to be significantly lower than the more distant encounter rate, even in these high-density starburst rings, simply owing to the difference in collision cross section versus the impact radius of more distant encounters. In fact, simulations have shown that as soon as the relative velocities are sufficiently high compared with the clusters’ internal velocity dispersions, cluster mergers are inefficient and destructive encounters start to dominate (Fellhauer et al. 2009; for the basic physical principles involved, see also Gerhard & Fall 1983).
For example, the nuclear ring in NGC 1512 is located very close to the galactic centre, with inner and outer edges at radii of 288 pc and 722 pc, respectively. Within this specified narrow range of radii, we estimated an approximate cluster number density by adopting a standard vertical scale height of 300 pc (cf. the thin disc of our Milky Way) of 649 clusters kpc-3, corresponding to an average cluster-to-cluster separation of 115 pc for clusters with luminosities above our selection limit and after correction for the -band detection limit. We adopted Galactic parameters for NGC 1512, because (i) both galaxies are barred spirals and (ii) they have similar dynamical masses of M⊙ within roughly 60 kpc (e.g., Hartwick & Sargent 1978; Koribalski & López-Sánchez 2009). For comparison, we obtained an approximate density of 300 massive clusters kpc-3 in the NGC 7742 starburst ring, or an average separation of pc (de Grijs & Anders 2012), if we adopt Mazzucca et al.’s (2008) ring size and assume that the ring thickness follows that of generic, late-type galactic discs, with a ratio of scale length to scale height of order eight (e.g., de Grijs 1998).
To place these numbers in their proper context, we also calculated the approximate cluster density in the centre of the nearby barred spiral galaxy Messier 83 (M83), based on relevant data fom the literature (Chandar et al. 2010; Bastian et al. 2012), which resulted in an estimate of 524 clusters kpc-3. This number density is lower than that in the NGC 1512 starburst ring but higher than that in the NGC 7742 ring. To arrive at this estimate, we assumed that all clusters in the galaxy’s central region are located in a disc-like configuration and we used the Milky Way’s thin-disc scale height, combined with the area covered by the M83 central cluster sample. Our estimate of the clusters’ number density may well be an underestimate, because M83 is a massive starburst galaxy which is significantly larger than NGC 1512 (Jarrett et al. 2003). Given the roughly constant scale height to scale length ratio in spiral galaxies (e.g., de Grijs 1998; his fig. 6 for Hubble types greater than 3 or 4), it is likely that M83 will, therefore, have a larger scale height than NGC 1512. We thus conclude that the density of star clusters in the circumnuclear starburst ring of NGC 1512 is much higher than that in the centres of star-cluster-forming galaxies such as M83 (we found a similar result for M51), although this same conclusion does not hold for all starburst rings (e.g., NGC 7742). We recently carefully reassessed the properties of the NGC 7742 cluster population, based on their luminosities (an observational quantity) rather than their masses (a derived quantity). Our preliminary analysis seems to confirm that the galaxy’s starburst-ring clusters – and particularly the youngest subsample – show evidence of a turnover in the CLF well above the 90 per cent completeness limit (de Grijs & Ma, in prep.).
Acknowledgements
We thank Thijs Kouwenhoven and Mike Fellhauer for providing us with helpful dynamical insights. This paper is based on observations made with the NASA/ESA HST, and obtained from the HLA, which is a collaboration between the Space Telescope Science Institute (STScI/NASA), the Space Telescope European Coordinating Facility (ST-ECF/ESA), and the Canadian Astronomy Data Centre (CADC/NRC/CSA). This research has also made use of NASA’s Astrophysics Data System Abstract Service. We acknowledge research support from the National Natural Science Foundation of China (grants 11373010, 11633005 and U1631102).
References
- Anders et al. (2007) Anders P., Bissantz N., Boysen L., de Grijs R., Fritze-v. Alvensleben U., 2007, MNRAS, 377, 91
- Anders et al. (2004) Anders P., Bissantz N., Fritze-v. Alvensleben U., de Grijs R., 2004, MNRAS, 347, 196
- Anders & Fritze-v. Alvensleben (2003) Anders P., Fritze-v. Alvensleben U., 2003, A&A, 401, 1063
- Anders et al. (2006) Anders P., Gieles M., de Grijs R., 2006, A&A, 451, 375
- Annibali et al. (2011) Annibali F., Tosi M., Aloisi A., van der Marel R. P., 2011, AJ, 142, 129
- Arp & Sandage (1985) Arp H., Sandage A., 1985, AJ, 90, 1163
- Athanassoula (2012) Athanassoula E., 2012, MNRAS, 426, L46
- Athanassoula et al. (2010) Athanassoula E., Romero-Gómez M., Bosma A., Masdemont J. J., 2010, MNRAS, 407, 1433
- Barker et al. (2008) Barker S., de Grijs R., Cerviño M., 2008, A&A, 487, 711
- Barth et al. (1995) Barth A. J., Ho L. C., Filippenko A. V., Sargent W. L. W., 1995, AJ, 110, 1009
- Bastian et al. (2012) Bastian N., Adamo A., Gieles M., et al., 2012, MNRAS, 419, 2606
- Benedict et al. (2002) Benedict G. F., Howell, D. A. Jørgensen I., Kenney J. D. P., Smith B. J., 2002, AJ, 123, 1411
- Buta et al. (2004) Buta R. J., Byrd G. G., Freeman T., 2004, AJ, 127, 1982
- Buta et al. (1999) Buta R., Crocker D. A., Byrd G. G., 1999, AJ, 118, 2071
- Buta, Crocker, & Byrd (2000) Buta R., Crocker D. A., Byrd G. G., 2000a, ASPC, 197, 45
- Buta et al. (2000) Buta R., Treuthardt P. M., Byrd G. G., Crocker D. A., 2000b, AJ, 120, 1289
- Calzetti et al. (2015) Calzetti D., et al., 2015, ApJ, 811, 75
- Chandar et al. (2010) Chandar R., et al., 2010, ApJ, 719, 966
- de Grijs (1998) de Grijs R., 1998, MNRAS, 299, 595
- de Grijs& Anders (2012) de Grijs R., Anders P., 2012, ApJL, 758, L22
- de Grijs et al. (2003a) de Grijs R., et al., 2003a, MNRAS, 343, 1285
- de Grijs et al. (2013a) de Grijs R., Anders P., Zackrisson E., Östlin G., 2013a, MNRAS, 431, 2917
- de Grijs et al. (2003b) de Grijs R., et al., 2003b, MNRAS, 342, 259
- de Grijs et al. (2013b) de Grijs R., Goodwin S. P., Anders P., 2013b, MNRAS, 436, 136
- de Grijs & Goodwin (2008) de Grijs R., Goodwin S. P., 2008, MNRAS, 383, 1000
- de Grijs& Parmentier (2007) de Grijs R., Parmentier G., 2007, ChJA&A, 7, 155
- Fall (2006) Fall S. M., 2006, ApJ, 652, 1129
- Fall & Chandar (2012) Fall S. M., Chandar R., 2012, ApJ, 752, 96
- Fall & Zhang (2001) Fall S. M., Zhang Q., 2001, ApJ, 561, 751
- Fellhauer, Wilkinson, & Kroupa (2009) Fellhauer M., Wilkinson M. I., Kroupa P., 2009, MNRAS, 397, 954
- Fujii, Saitoh, & Portegies Zwart (2012) Fujii M. S., Saitoh T. R., Portegies Zwart S. F., 2012, ApJ, 753, 85
- Gerhard & Fall (1983) Gerhard O. E., Fall S. M., 1983, MNRAS, 203, 1253
- Harris et al. (2004) Harris J., Calzetti D., Gallagher J. S. III, Smith D. A., Conselice C. J., 2004, ApJ, 603, 503
- Hartwick & Sargent (1978) Hartwick F. D. A., Sargent W. L. W., 1978, ApJ, 221, 512
- Ho (1997) Ho L. C., 1997, RMxAC, 6, 5
- Holtzman et al. (1992) Holtzman J. A., et al., 1992, AJ, 103, 691
- Hsieh et al. (2012) Hsieh, P.-Y., Ho P. T. P., Kohno K., Hwang C.-Y., Matsushita S., 2012, ApJ, 747, 90
- Jarrett et al. (2003) Jarrett T. H., Chester T., Cutri R., et al., 2003, AJ, 125, 525
- Kim et al. (2012) Kim W.-T., Seo W.-Y., Stone J. M., Yoon D., Teuben P. J., 2012, ApJ, 747, 60
- Koribalski & López-Sánchez (2009) Koribalski B. S., López-Sánchez A. R., 2009, MNRAS, 400, 1749
- Krist & Hook (1997) Krist J. E., Hook R. N., 1997, HST Calibration Workshop with a New Generation of Instruments, Casertano S., Jedrzejewski R., Keyes T., Stevens M., eds., (Baltimore: STScI), p. 192
- Larsen et al. (2006) Larsen S. S., 2006, in Planets to Cosmology: Essential Science in the Final Years of the Hubble Space Telescope, Livio M., Casertano S., eds., (Baltimore: STScI), p. 35
- Li et al. (2015) Li S., de Grijs R., Anders P., Li C., 2015, ApJS, 216, 6
- Lutz (1991) Lutz D., 1991, A&A, 245, 31
- Maoz et al. (2001) Maoz D., Barth A. J., Ho L. C., Sternberg A., Filippenko A. V., 2001, AJ, 121, 3048
- Maoz et al. (1996) Maoz D., et al., 1996, AJ, 111, 2248
- Mazzucca et al. (2008) Mazzucca L. M., Knapen J. H., Veilleux S., Regan M. W., 2008, ApJS, 174, 337
- McMillan, Vesperini, & Portegies Zwart (2007) McMillan S. L. W., Vesperini E., Portegies Zwart S. F., 2007, ApJ, 655, L45
- Mengel et al. (2005) Mengel S., Lehnert M. D., Thatte N., Genzel R., 2005, A&A, 443, 41
- Miocchi et al. (2006) Miocchi P., Capuzzo Dolcetta R., Di Matteo P., Vicari A., 2006, ApJ, 644, 940
- Portegies Zwart et al. (2010) Portegies Zwart S. F., McMillan S. L. W., Gieles M., 2010, ARA&A, 48, 431
- Reines et al. (2010) Reines A. E., Nidever D. L., Whelan D. G., Johnson K. E., 2010, ApJ, 708, 26
- Romero-Gómez et al. (2006) Romero-Gómez M., Masdemont J. J., Athanassoula E., García-Gómez C., 2006, A&A, 453, 39
- Saitoh et al. (2011) Saitoh T. R., Daisaka H., Kokubo E., Makino J., Okamoto T., Tomisaka K., Wada K., Yoshida N., 2011, IAU Symp, 270, 483
- Schweizer (1982) Schweizer F., 1982, ApJ, 252, 455
- Skrutskie et al. (2006) Skrutskie M. F., et al., 2006, AJ, 131, 1163 (2MASS)
- van den Bergh (1971) van den Bergh S., 1971, A&A, 12, 474
- van der Laan et al. (2013) van der Laan T. P. R., Schinnerer E., Emsellem E., Hunt L. K., McDermid R. M., Liu G., 2013, A&A, 551, A81 (vdL13)
- Vesperini (1998) Vesperini E., 1998, MNRAS, 299, 1019
- Whitmore (2003) Whitmore B. C., 2003, in A Decade of Hubble Space Telescope Science, Livio M., Noll K., Stiavelli M., eds., (Baltimore: STScI), p. 153
- Whitmore et al. (2010) Whitmore B. C., et al., 2010, AJ, 140, 75
- Whitmore et al. (1999) Whitmore B. C., et al., 1999, AJ, 118, 1551
- Whitmore & Schweizer (1995) Whitmore B. C., Schweizer F., 1995, AJ, 109, 960
- Zhang & Fall (1999) Zhang Q., Fall S. M., 1999, ApJL, 527, L81