A study of the Lyman- line profile in DBA white dwarfs
Abstract
The hydrogen abundances in DBA white dwarfs determined from optical or UV spectra have been reported to differ significantly in some studies. We revisit this problem using our own model atmospheres and synthetic spectra, and present a theoretical investigation of the Lyman- line profile as a function of effective temperature and hydrogen abundance. We identify one possible solution to this discrepancy and show considerable improvement from a detailed analysis of optical and UV spectra of DBA stars.
1 Introduction
The most widely used technique to determine the atmospheric parameters of DB white dwarfs is the so-called spectroscopic technique (see, e.g., Bergeron et al. 2011). By comparing the line shapes of the normalized observed spectrum of a star with the predictions from model atmospheres, it is possible to obtain the effective temperature, , and the surface gravity, , of a particular star. An example of the spectroscopic technique is shown in the left panel of Figure 1. The hydrogen abundance in a DBA star can also be constrained if a spectrum of the H line is available (see insert in the left panel of Fig. 1).
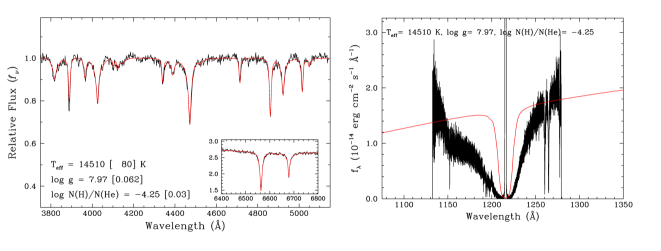
On the right panel of Figure 1, we plotted the Lyman- profile predicted from the synthetic spectrum obtained from chemically homogeneous models with the atmospheric parameters determined from optical spectroscopy together with the observed Lyman- line of G200-39 (HST spectrum kindly provided to us by Siyi Xu). As is clearly shown, the predicted absorption feature is substantially weaker than the actual observed line. The use of the spectroscopic technique on this part on the spectrum would thus yield very different atmospheric parameters than what is obtained from the H line. Although we are only showing here the discrepancy between the optical and UV spectra for G200-39, this problem is also present in other DBA white dwarfs we studied (usually hotter), but to a lesser extent.
2 Exploring the parameter space
The strength and shape of the Lyman- line are affected by both the effective temperature and the hydrogen abundance. To get a stronger absorption feature, we can either lower or increase . To know by how much we would need to lower the effective temperature, we fitted the observed Lyman- line by forcing the surface gravity and hydrogen abundance to the optical values ( and ), allowing only to vary. Our best fit is shown in the left panel of Figure 2. The right panel of Figure 2 shows the same experiment, but by forcing the surface gravity and effective temperature to the optical values ( K) and allowing only the hydrogen abundance to vary.
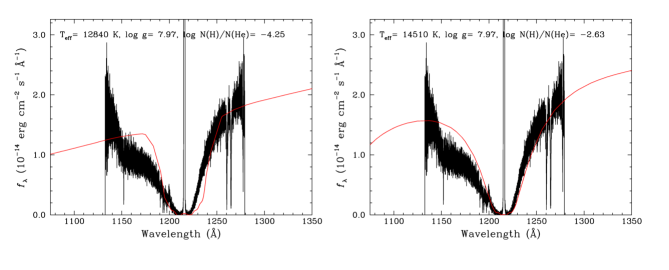
In order to get a strong enough Lyman- line for G200-39, we would need to lower the effective temperature by about 1600 K, which is in strong disagreement with the optical temperature ( K vs K); this temperature difference is clearly larger than the measurement errors. We get approximately the same effect on the strength of the Lyman- line by increasing the hydrogen abundance by 1.62 dex ( from the optical fit vs from the UV fit), again in strong disagreement with the optical value. Note, however, that the shape of the line profile predicted with a higher hydrogen abundance is in better agreement with the observations than the prediction with a lower effective temperature.
3 An inhomogeneous H/He abundance distribution?
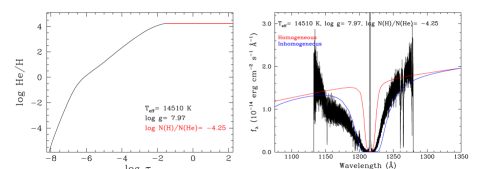
The Lyman- line is produced higher in the atmosphere than its optical counterparts. An inhomogeneous atmosphere, where the hydrogen abundance increases as we approach the star’s surface, could explain the discrepancy between the ultraviolet and the optical spectroscopic fits. To test the effect of a chemically inhomogeneous atmosphere on the predicted synthetic spectrum, we fixed the hydrogen abundance in the convective zone and then obtained the H/He abundance as a function of depth from the diffusive equilibrium approximation (MacDonald & Vennes 1991). An example of such a profile for the atmospheric parameters of G200-39 is shown in the left panel of Figure 3. Note that in this exploratory calculation, we used a homogeneous atmospheric structure (temperature and pressure), with parameters obtained from the optical solution (left panel of Fig. 1), and the inhomogeneous profile was only used when calculating the synthetic spectrum. The resulting Lyman- line for G200-39, displayed in the right panel of Figure 3, is in much better agreement with the observations.
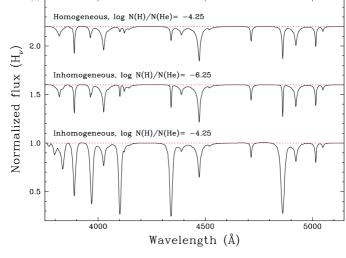
The effect of using an inhomogeneous abundance profile on the optical spectrum is illustrated in Figure 4 for a model at K, , and in the convection zone (bottom spectrum). This spectrum can be compared with that obtained from a chemically homogeneous atmosphere with the same hydrogen abundance (top spectrum). As can be seen, the hydrogen lines in the inhomogeneous model are predicted much stronger than in the homogeneous model, which we recall, is representative of the observed spectrum of G200-39. In order to produce hydrogen lines of comparable strength, the hydrogen abundance in the convection zone of the inhomogeneous model needs to be reduced by a factor of 100 (middle spectrum). These results offer the tantalizing possibility that the hydrogen abundances in DBA white dwarfs determined from homogeneous models have been largely overestimated, and consequently that the total hydrogen mass present in these stars has been significantly overestimated as well.
4 Conclusions
The hydrogen abundance determined from spectroscopic fits to H is much smaller than that obtained from the Lyman- line, when using homogeneous model atmospheres. To correctly fit the Lyman- line, we either need to lower the temperature, or to use a larger ratio than the value obtained from fits to the optical spectrum. Our exploratory calculations suggest that this discrepancy can be resolved by using inhomogeneous H/He abundance profiles, with hydrogen abundances in the convection zone significantly smaller than those inferred from homogeneous models. If these results are confirmed, the total hydrogen mass present in DBA stars may be grossly overestimated.
Our next step is to implement this inhomogeneous hydrogen abundance profile in the calculation of the atmospheric structure itself (and not only in the synthetic spectrum) to get a self-consistent solution.
Acknowledgments
We are deeply grateful to Siyi Xu for letting us use her HST spectrum of G200-39. This work was supported in part by the NSERC Canada and by the Fund FRQ-NT (Québec).
References
- Bergeron et al. (2011) Bergeron, P., et al., 2011, ApJ, 737, 28
- MacDonald & Vennes (1991) MacDonald, J., & Vennes, S., 1991, ApJ, 371, 719